
Effect of High-Intensity Interval Training Combined with Blood Flow Restriction at Different Phases on Abdominal Visceral Fat among Obese Adults: A Randomized Controlled Trial


Abstract
1. Introduction
2. Methods
2.1. Participants
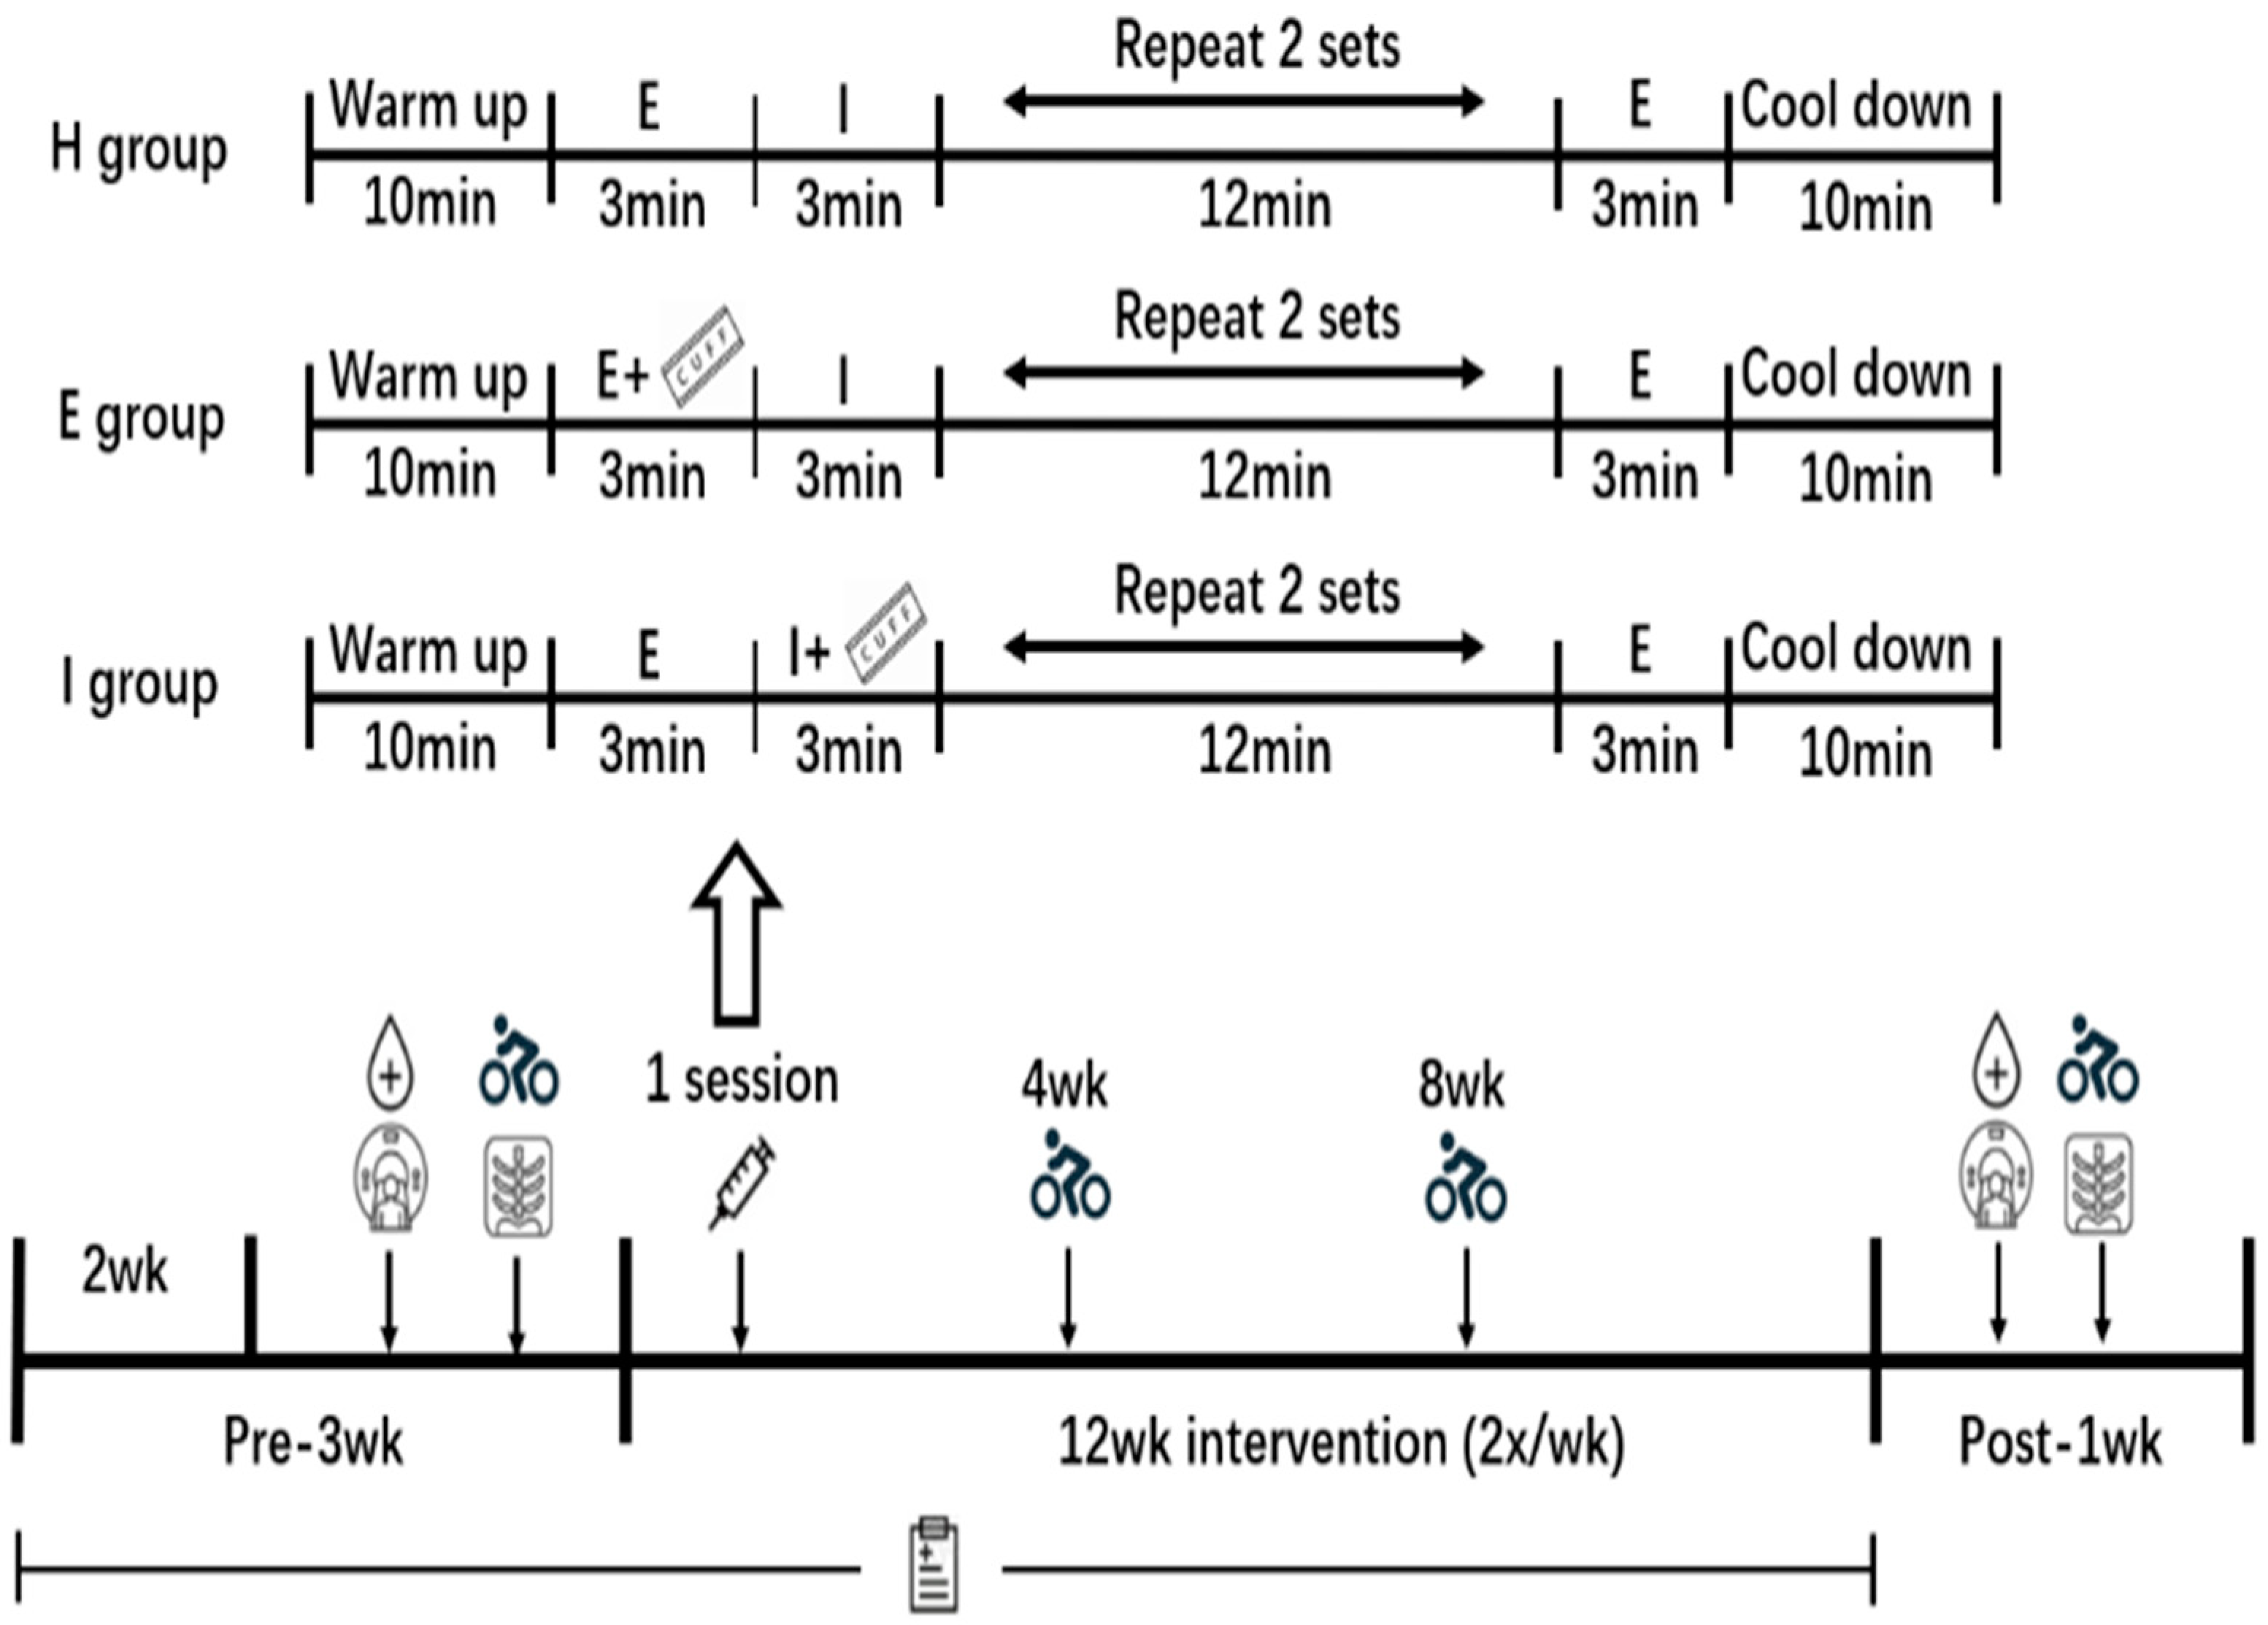
2.2. Study Design
2.3. Test Method for Calorie Expenditure and Intake
2.4. Body Composition Test
2.5. Blood and Maximal-Oxygen-Uptake Tests
2.6. Interventions
2.7. Limb Occlusive Pressure
2.8. Statistical Analysis
3. Results
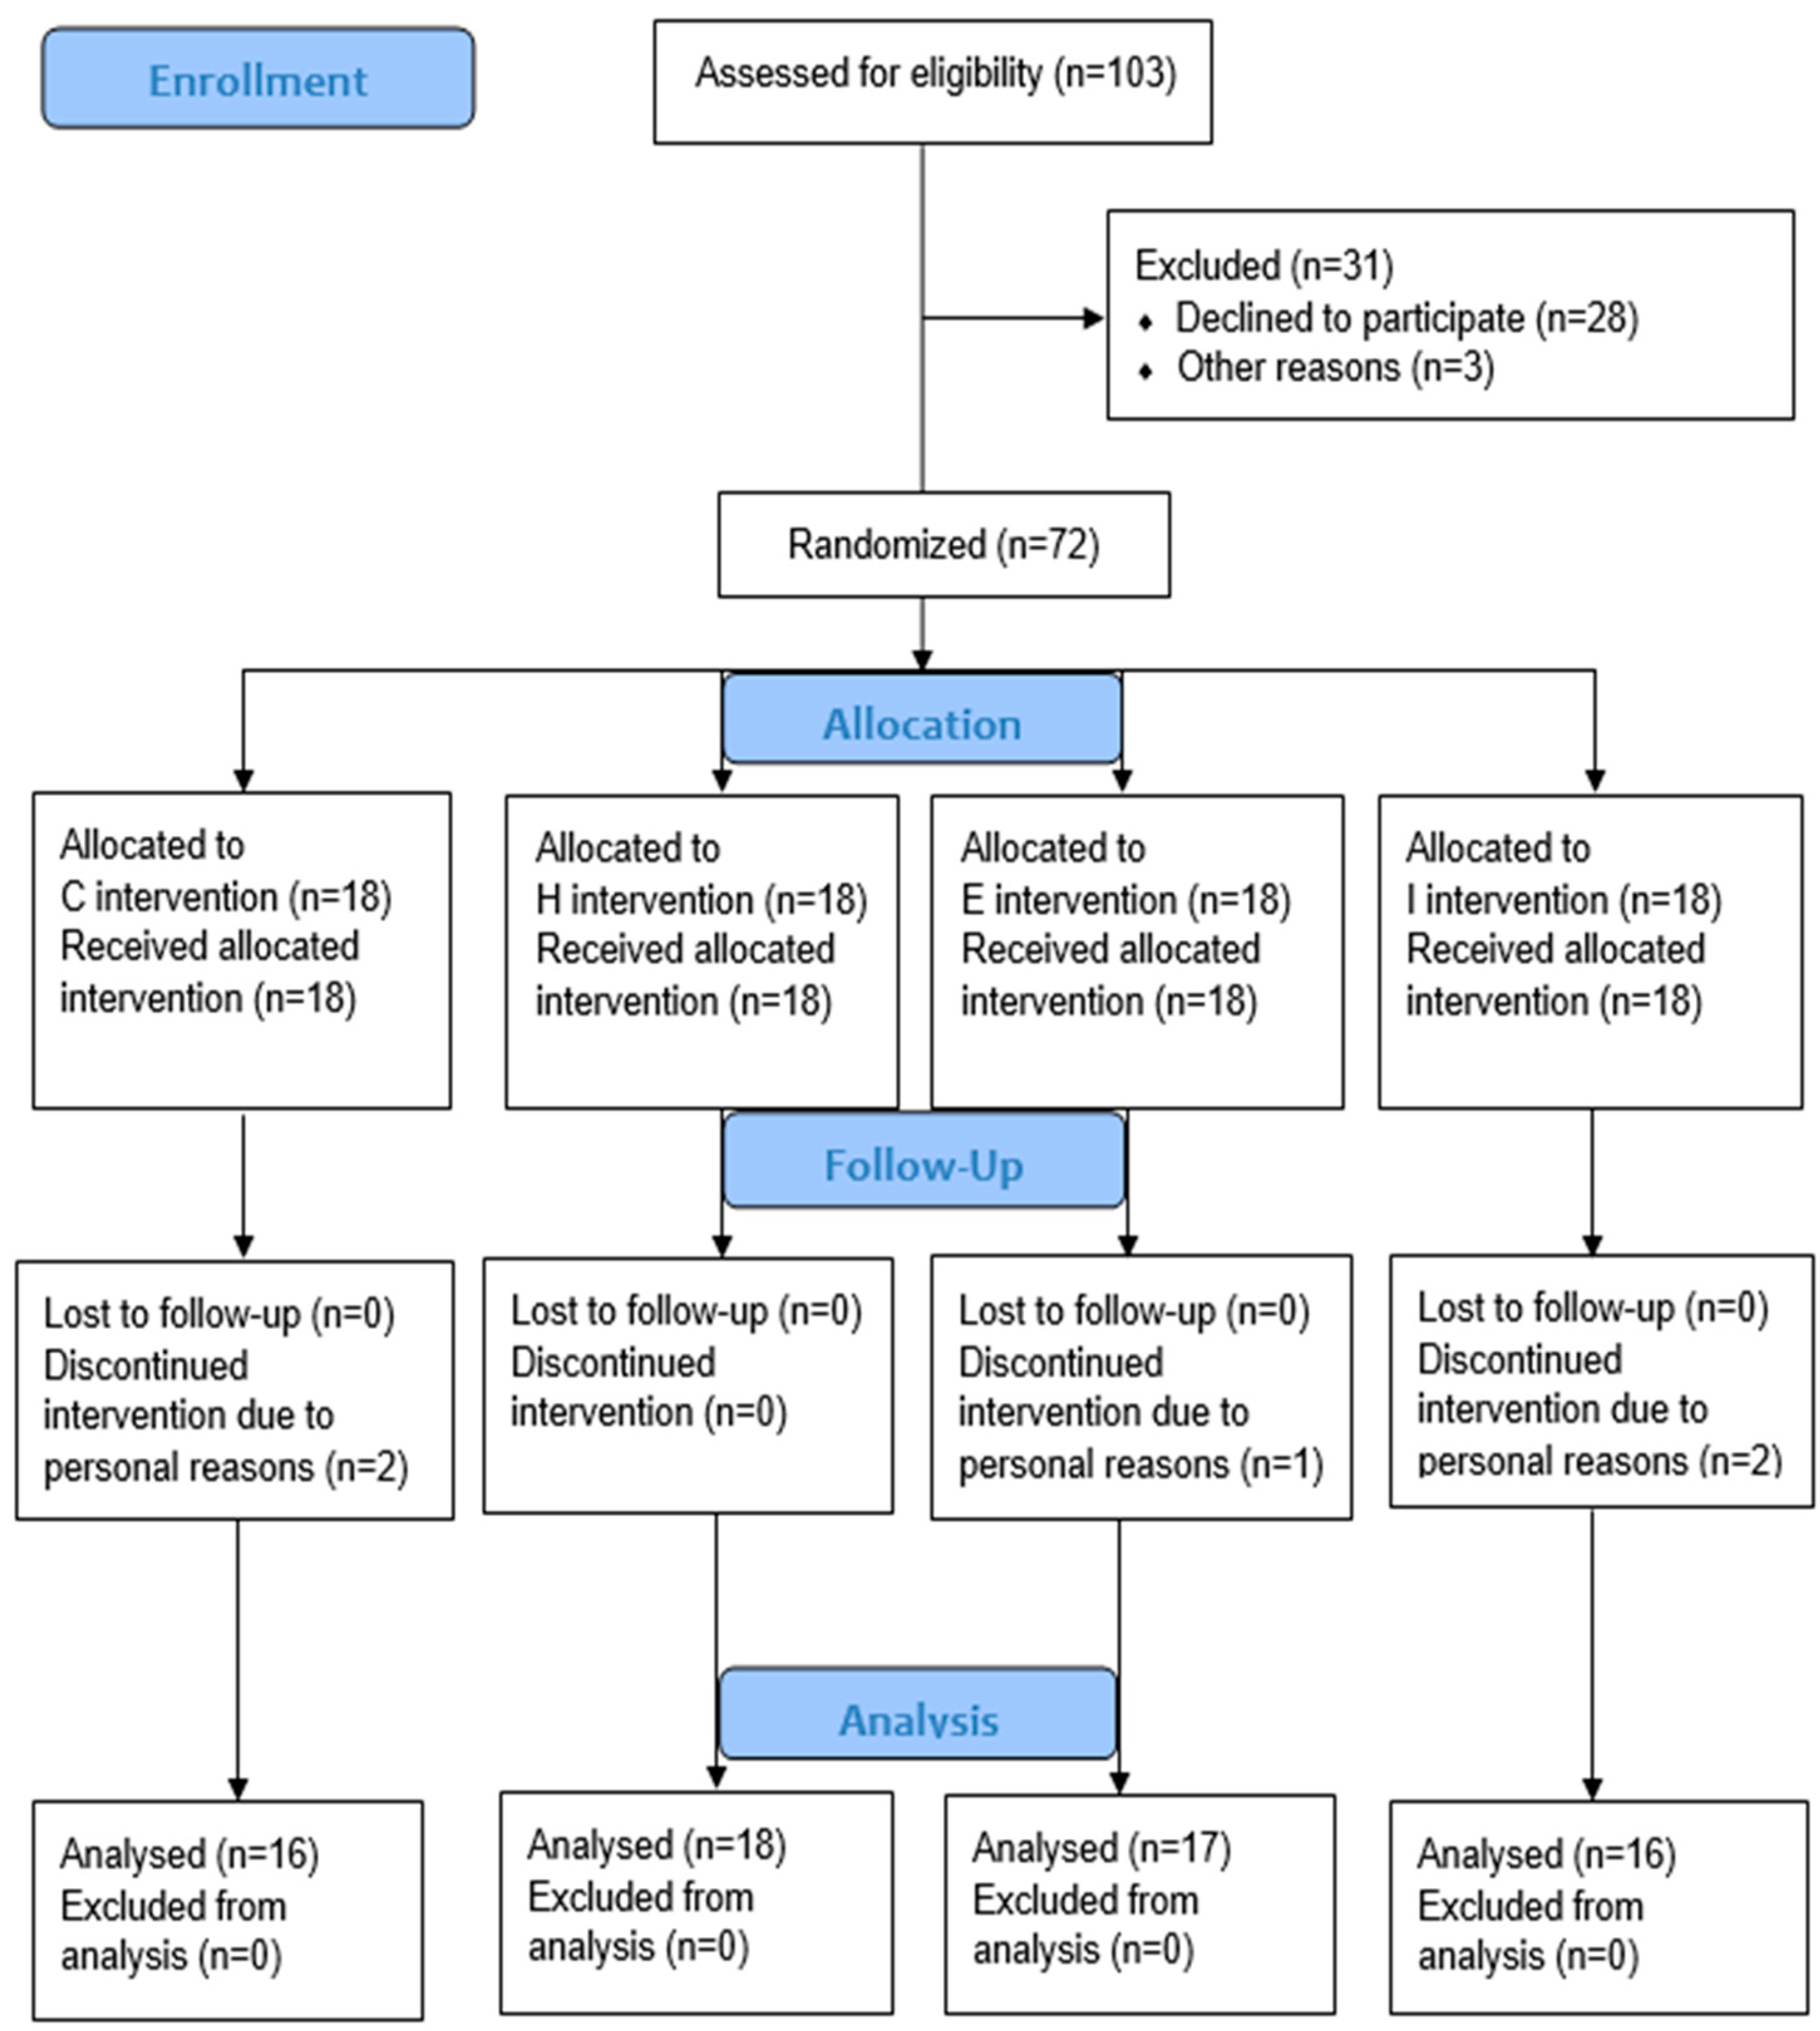
3.1. Participants
3.2. Calorie Expenditure and Intake
3.3. Training Sessions
3.4. Fat and Metabolic Variables
3.4.1. Whole-Body and Regional Fat
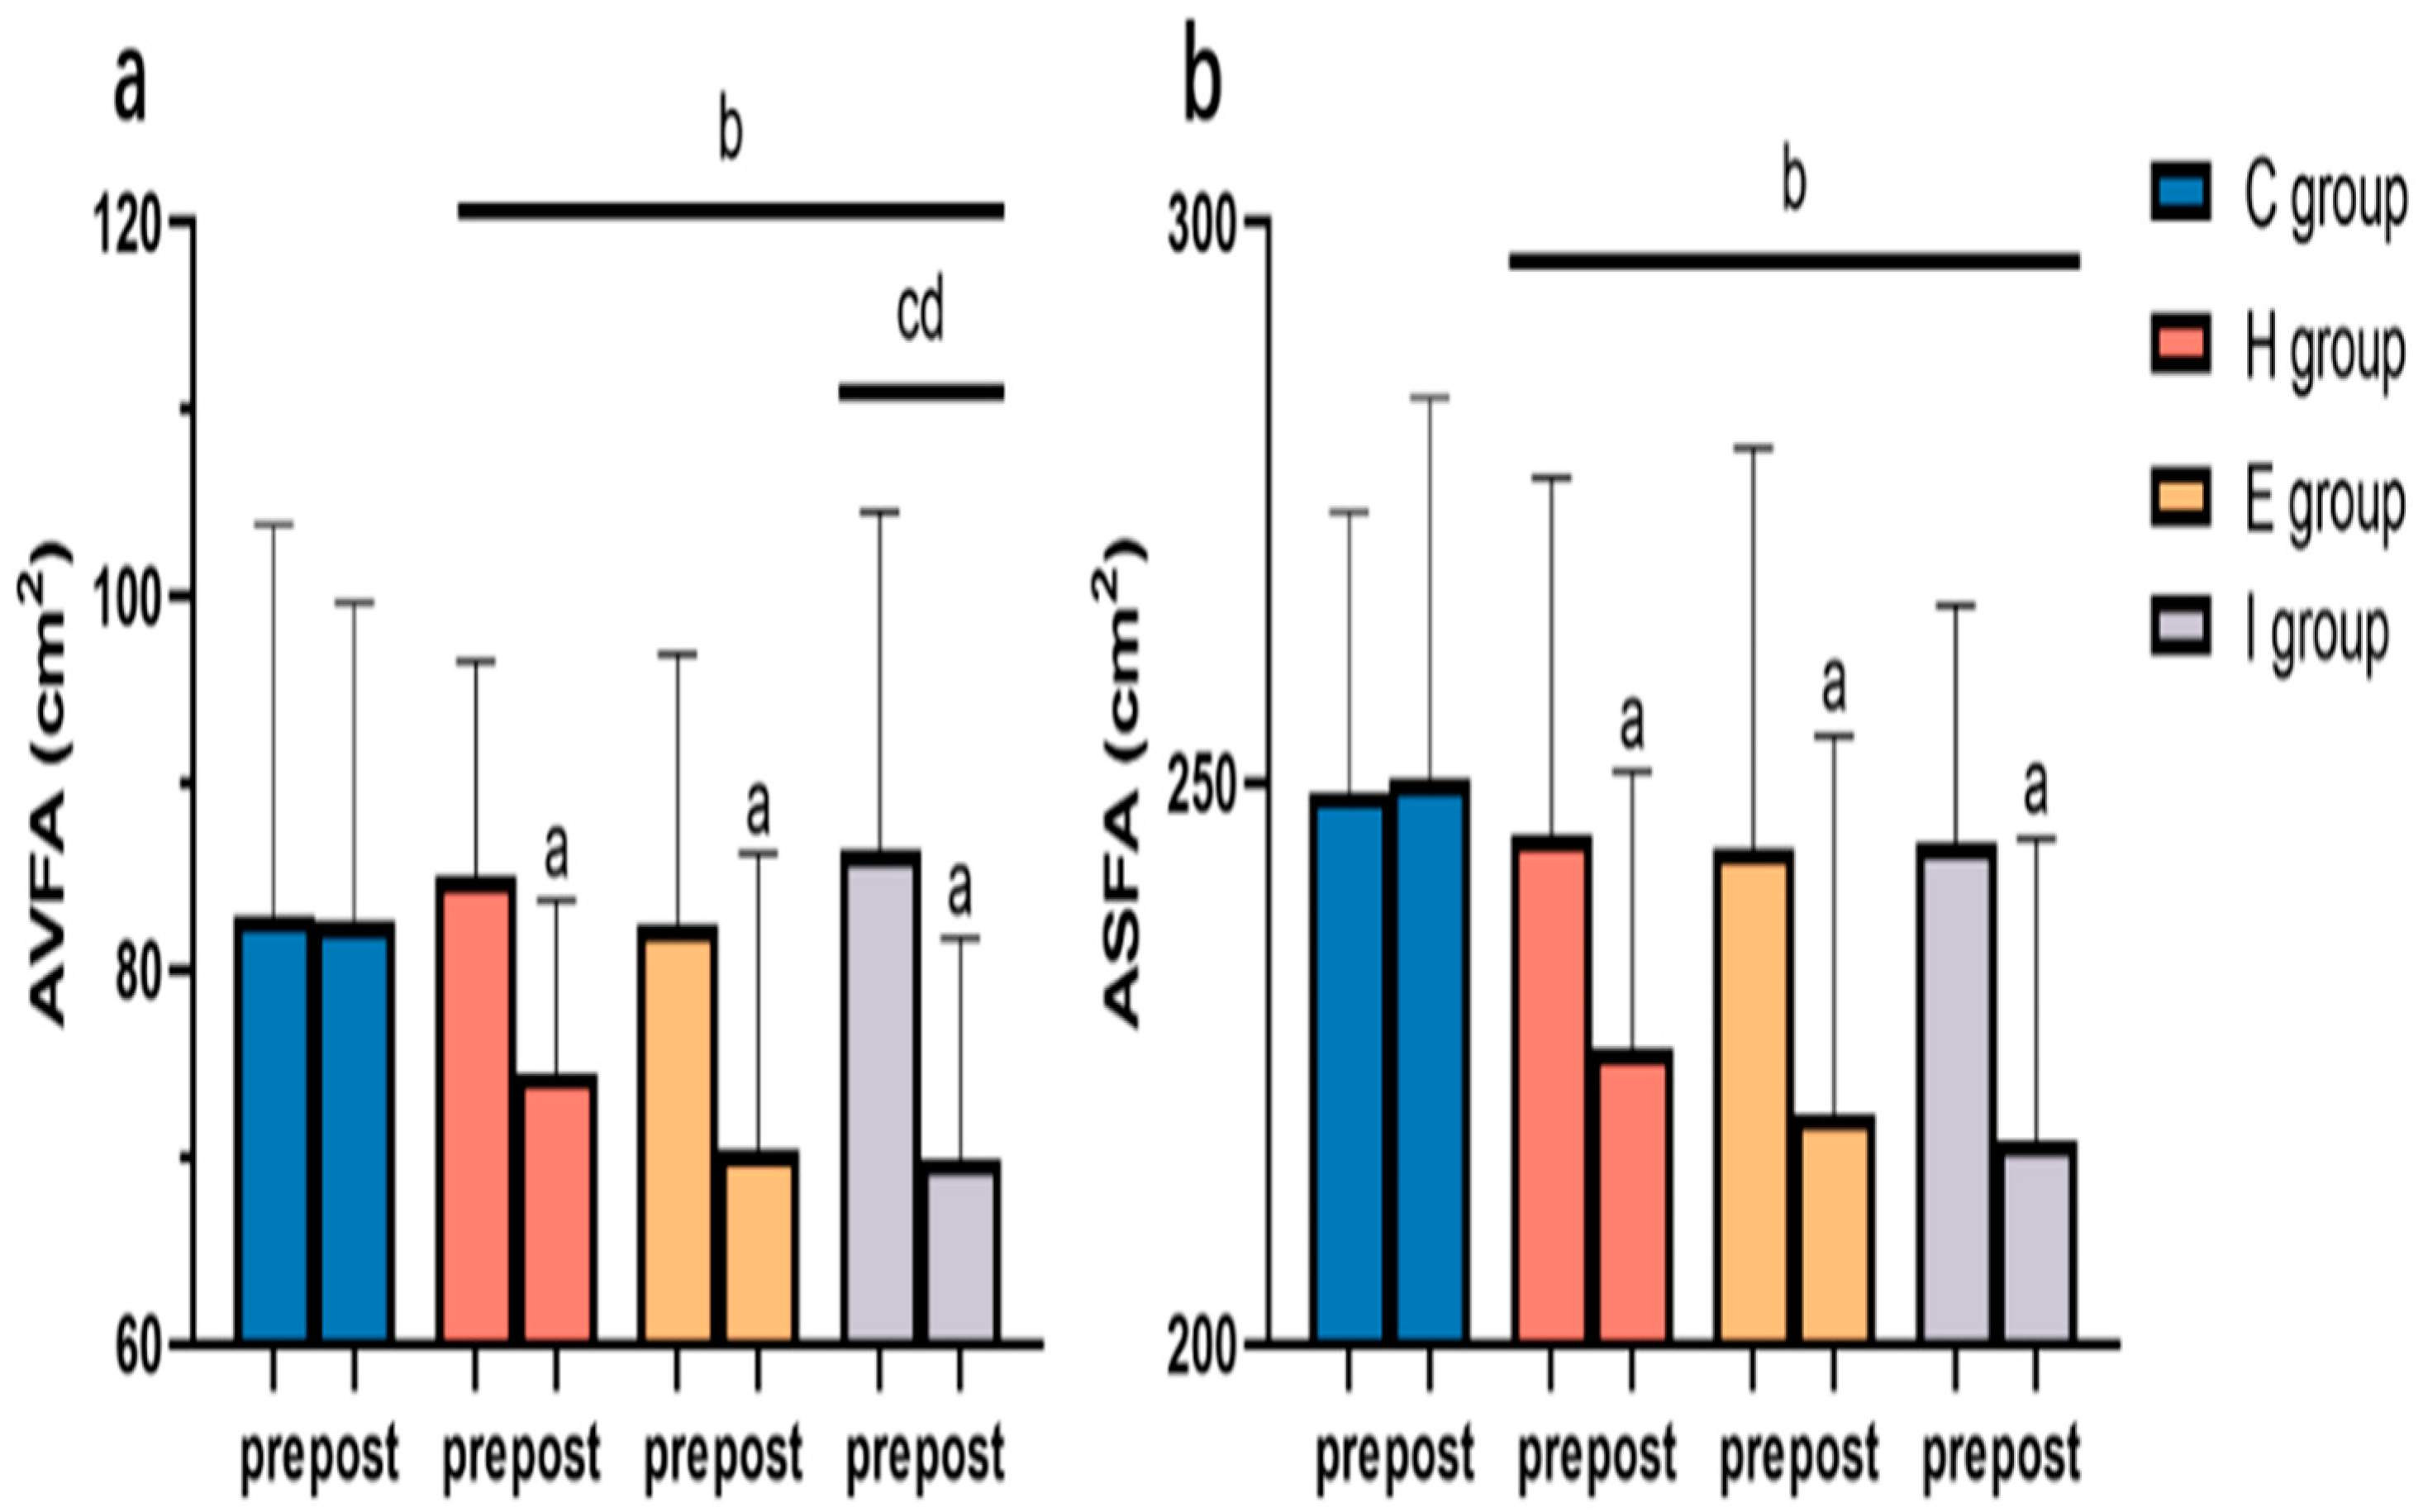
3.4.2. Abdominal Visceral and Subcutaneous Fat
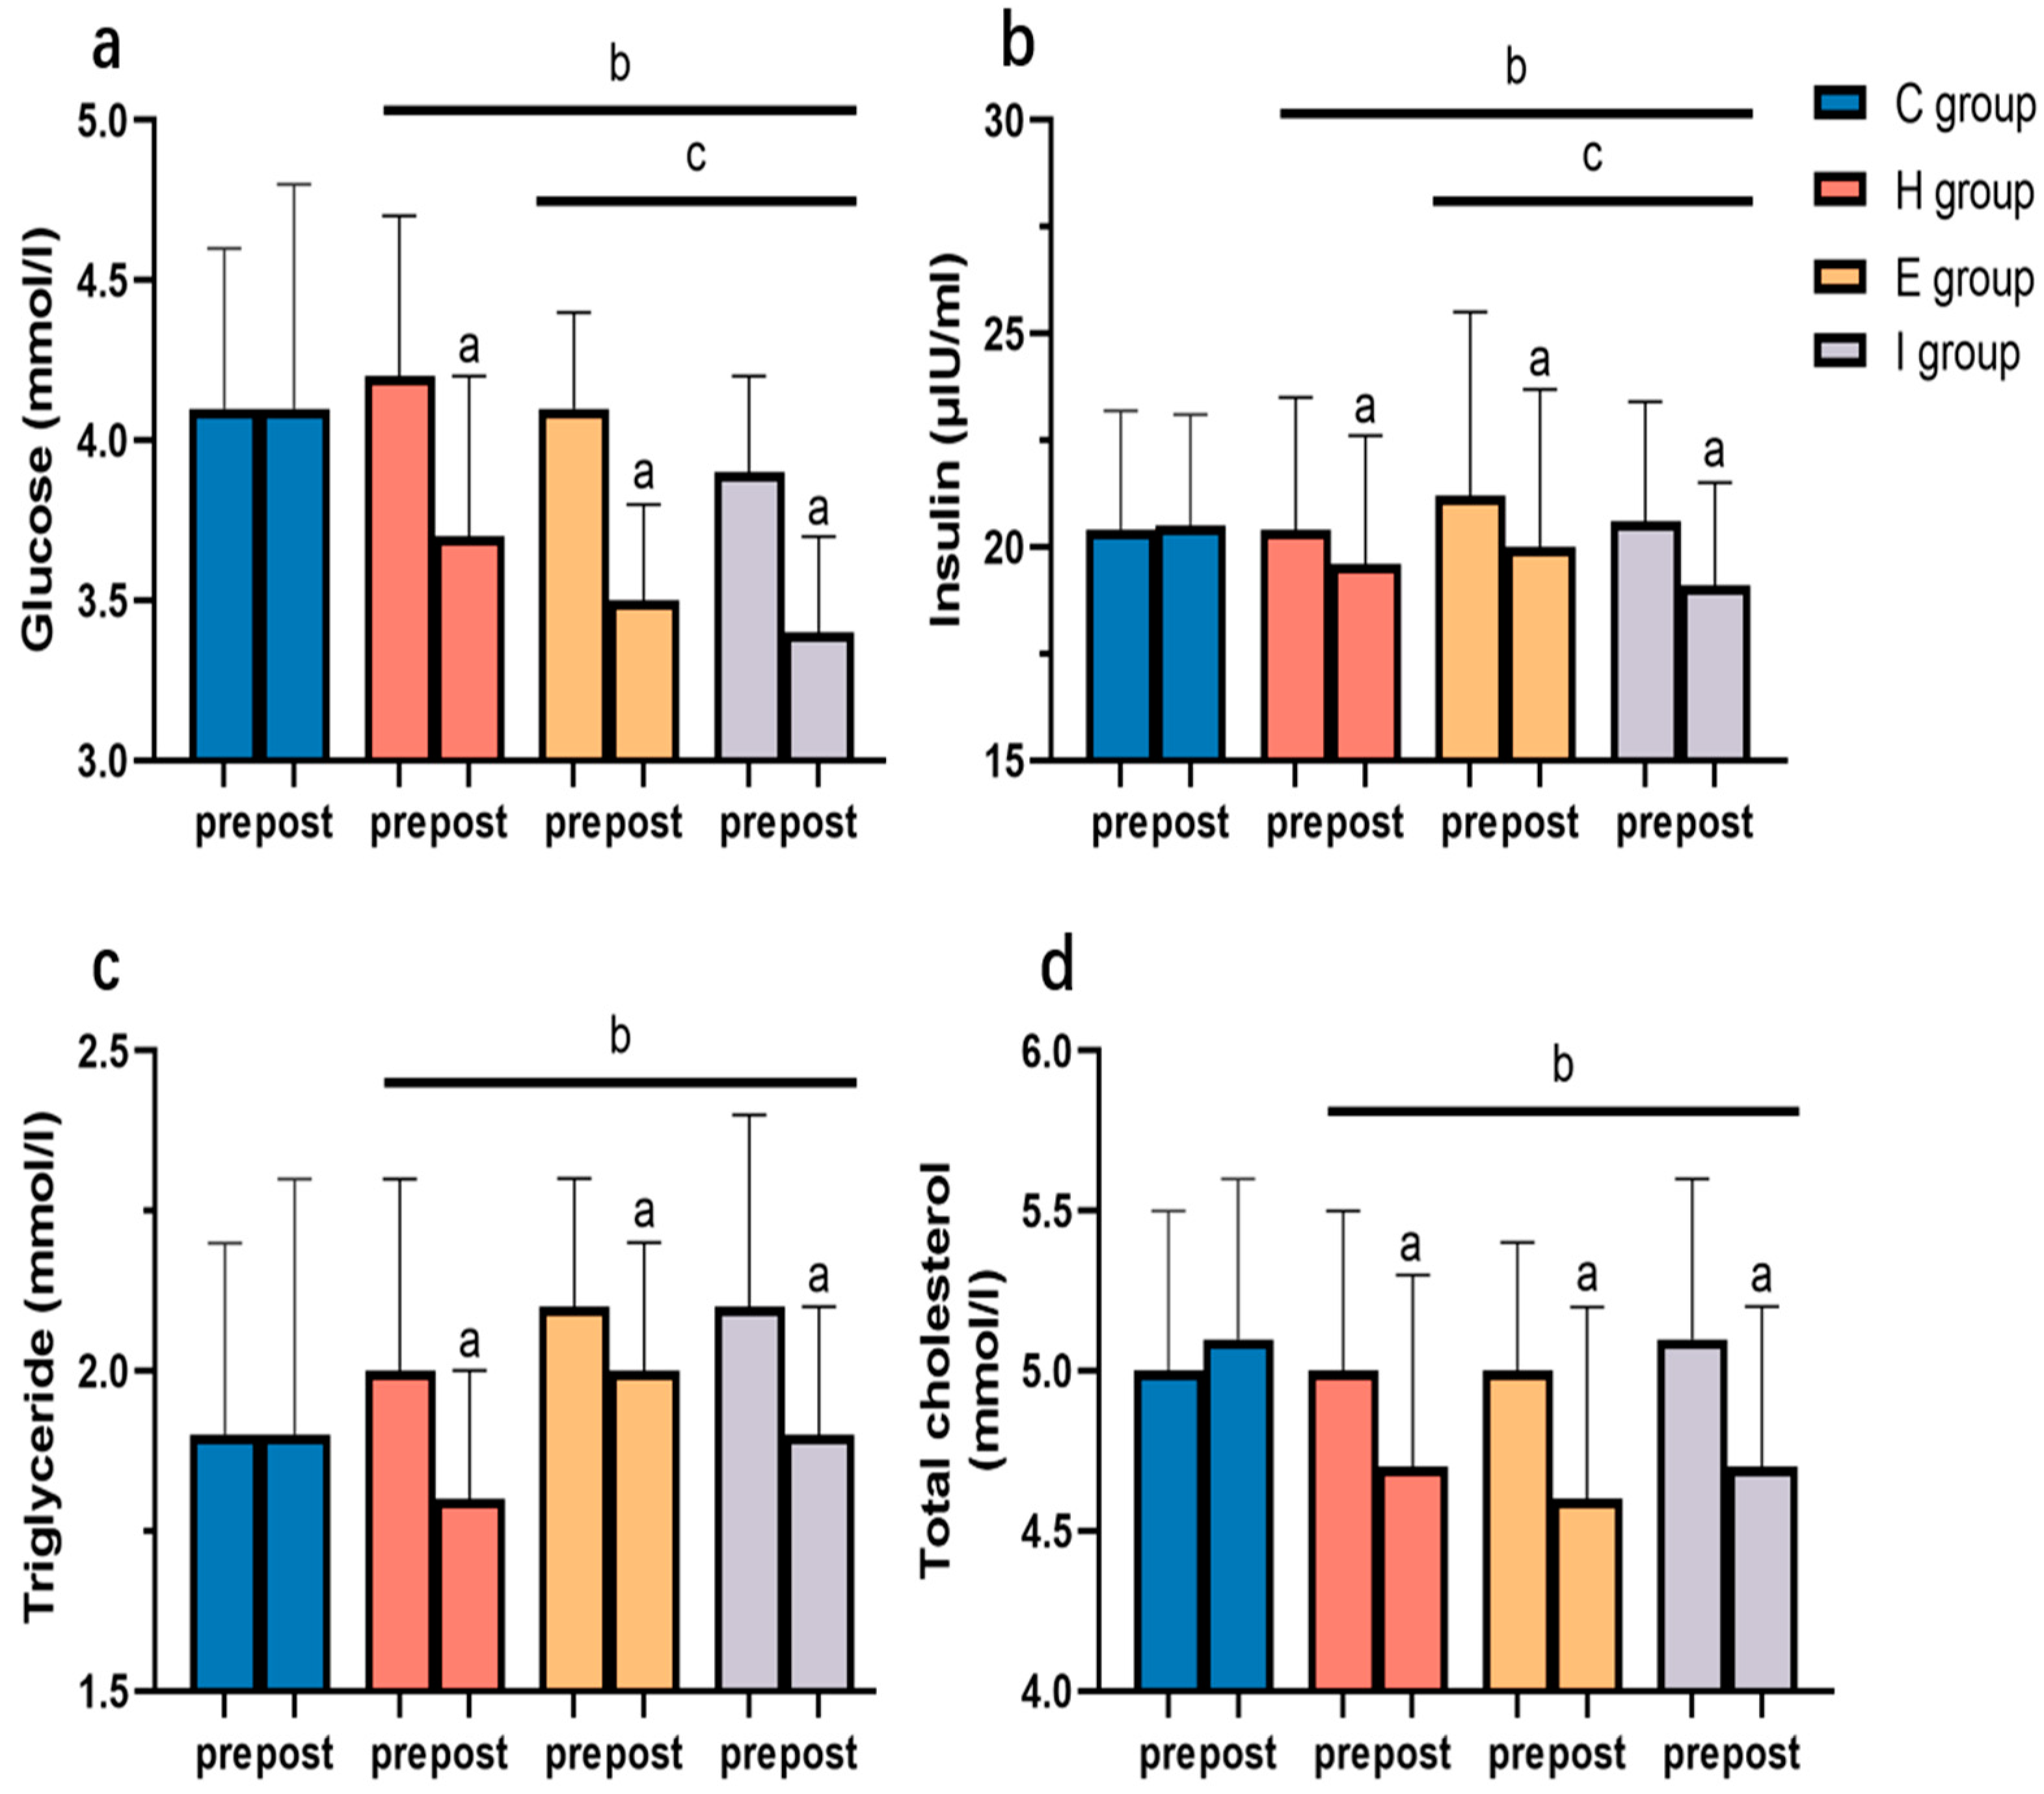
3.4.3. Blood Glucose and Lipid Variables
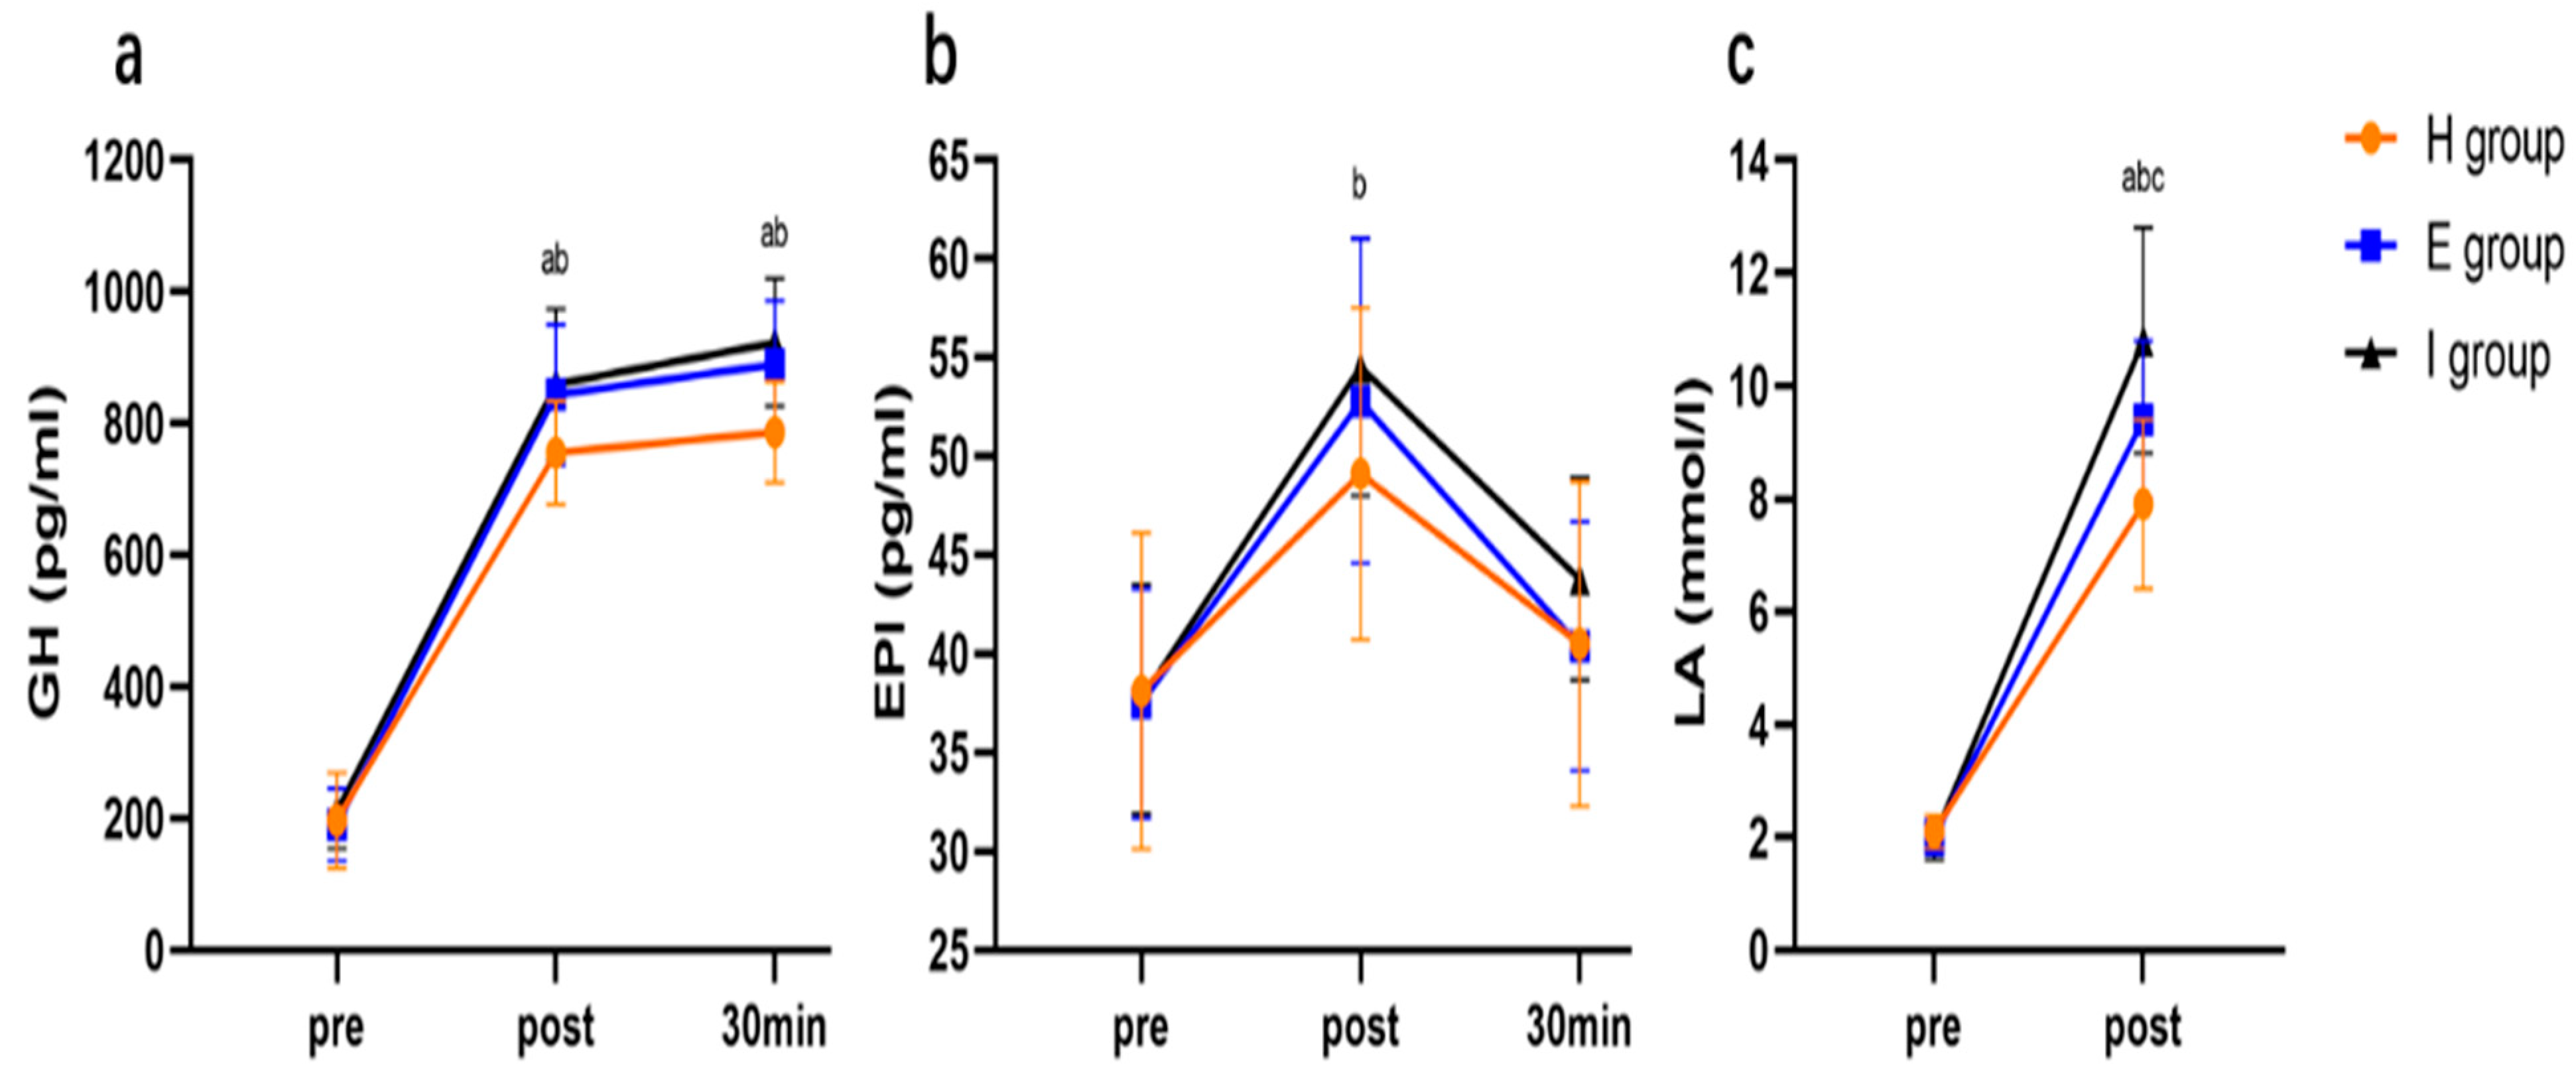
3.4.4. Lipolytic Hormones and Blood Lactate
4. Discussion
5. Conclusions
Author Contributions
Funding
Institutional Review Board Statement
Informed Consent Statement
Data Availability Statement
Conflicts of Interest
References
- Ibrahim, M.M. Subcutaneous and visceral adipose tissue: Structural and functional differences. Obes. Rev. 2010, 11, 11–18. [Google Scholar] [CrossRef] [PubMed]
- Alonso-Fernández, D.; Fernández-Rodríguez, R.; Taboada-Iglesias, Y.; Gutiérrez-Sánchez, Á. Impact of High-Intensity Interval Training on Body Composition and Depressive Symptoms in Adults under Home Confinement. Int. J. Environ. Res. Public Health 2022, 19, 6145. [Google Scholar] [CrossRef] [PubMed]
- Amaro-Gahete, F.J.; De-la-O, A.; Jurado-Fasoli, L.; Ruiz, J.R.; Castillo, M.J.; Gutiérrez, Á. Effects of different exercise training programs on body composition: A randomized control trial. Scand. J. Med. Sci. Sports 2019, 29, 968–979. [Google Scholar] [CrossRef]
- Koster, A.; Murphy, R.A.; Eiriksdottir, G.; Aspelund, T.; Sigurdsson, S.; Lang, T.F.; Gudnason, V.; Launer, L.J.; Harris, T.B. Fat distribution and mortality: The AGES-Reykjavik study. Obesity 2015, 23, 893–897. [Google Scholar] [CrossRef] [PubMed]
- Park, H.S.; Lee, K. Greater beneficial effects of visceral fat reduction compared with subcutaneous fat reduction on parameters of the metabolic syndrome: A study of weight reduction programmes in subjects with visceral and subcutaneous obesity. Diabet. Med. 2005, 22, 266–272. [Google Scholar] [CrossRef] [PubMed]
- Hong, H.-R.; Jeong, J.-O.; Kong, J.-Y.; Lee, S.-H.; Yang, S.-H.; Ha, C.-D.; Kang, H.-S. Effect of walking exercise on abdominal fat, insulin resistance and serum cytokines in obese women. J. Exerc. Nutr. Biochem. 2014, 18, 277–285. [Google Scholar] [CrossRef]
- Maillard, F.; Pereira, B.; Boisseau, N. Effect of High-Intensity Interval Training on Total, Abdominal and Visceral Fat Mass: A Meta-Analysis. Sports Med. 2018, 48, 269–288. [Google Scholar] [CrossRef]
- Zhang, H.; Tong, T.K.; Kong, Z.; Shi, Q.; Liu, Y.; Nie, J. Exercise training-induced visceral fat loss in obese women: The role of training intensity and modality. Scand. J. Med. Sci. Sports 2021, 31, 30–43. [Google Scholar] [CrossRef]
- Alonso-Fernández, D.; Fernández-RodrÍguez, R.; Gutiérrez-Sánchez, Á. Efecto de un programa HIIT versus entrenamiento continuo extensivo en individuos inexpertos. Apunt. Educ. Física Y Deport. 2017, 4, 84–94. [Google Scholar] [CrossRef]
- Arner, P. Regional adipocity in man. J. Endocrinol. 1997, 155, 191–192. [Google Scholar] [CrossRef]
- Arner, P. Catecholamine-induced lipolysis in obesity. Int. J. Obes. 1999, 23, S10–S13. [Google Scholar] [CrossRef] [PubMed]
- Liu, Y.; Li, Y.; Cheng, B.; Feng, S.; Zhu, X.; Chen, W.; Zhang, H. Comparison of visceral fat lipolysis adaptation to high-intensity interval training in obesity-prone and obesity-resistant rats. Diabetol. Metab. Syndr. 2022, 14, 62. [Google Scholar] [CrossRef] [PubMed]
- Aniceto, R.R.; da Silva Leandro, L. Practical Blood Flow Restriction Training: New Methodological Directions for Practice and Research. Sports Med.-Open 2022, 8, 87. [Google Scholar] [CrossRef] [PubMed]
- Yinghao, L.; Jing, Y.; Yongqi, W.; Jianming, Z.; Zeng, G.; Yiting, T.; Shuoqi, L. Effects of a blood flow restriction exercise under different pressures on testosterone, growth hormone, and insulin-like growth factor levels. J. Int. Med. Res. 2021, 49, 030006052110395. [Google Scholar] [CrossRef] [PubMed]
- Chen, Y.; Ma, C.; Wang, J.; Gu, Y.; Gao, Y. Effects of 40% of Maximum Oxygen Uptake Intensity Cycling Combined with Blood Flow Restriction Training on Body Composition and Serum Biomarkers of Chinese College Students with Obesity. Int. J. Environ. Res. Public Health 2021, 19, 168. [Google Scholar] [CrossRef]
- Kargaran, A.; Abedinpour, A.; Saadatmehr, Z.; Yaali, R.; Amani-Shalamzari, S.; Gahreman, D. Effects of dual-task training with blood flow restriction on cognitive functions, muscle quality, and circulatory biomarkers in elderly women. Physiol. Behav. 2021, 239, 113500. [Google Scholar] [CrossRef]
- Teixeira, E.L.; Barroso, R.; Silva-Batista, C.; Laurentino, G.C.; Loenneke, J.P.; Roschel, H.; Ugrinowitsch, C.; Tricoli, V. Blood Flow Restriction Increases Metabolic Stress but Decreases Muscle Activation during High-Load Resistance Exercise. Muscle Nerve 2018, 57, 107–111. [Google Scholar] [CrossRef]
- Ainsworth, B.E.; Haskell, W.L.; Herrmann, S.D.; Meckes, N.; Bassett, D.R. Compendium of Physical Activities. Med. Sci. Sport. Exerc. 2011, 43, 1575–1581. [Google Scholar] [CrossRef]
- Keating, S.E.; Machan, E.A.; O’Connor, H.T.; Gerofi, J.A.; Sainsbury, A.; Caterson, I.D.; Johnson, N.A. Continuous Exercise but Not High Intensity Interval Training Improves Fat Distribution in Overweight Adults. J. Obes. 2014, 2014, 834865. [Google Scholar] [CrossRef]
- Kobayashi, J.; Tadokoro, N.; Watanabe, M.; Shinomiya, M. A novel method of measuring intra-abdominal fat volume using helical computed tomography. Int. J. Obes. 2002, 26, 398–402. [Google Scholar] [CrossRef]
- Libardi, C.; Chacon-Mikahil, M.; Cavaglieri, C.; Tricoli, V.; Roschel, H.; Vechin, F.; Conceição, M.; Ugrinowitsch, C. Effect of Concurrent Training with Blood Flow Restriction in the Elderly. Int. J. Sports Med. 2015, 36, 395–399. [Google Scholar] [CrossRef] [PubMed]
- Ganesan, G.; Cotter, J.A.; Reuland, W.; Cerussi, A.E.; Tromberg, B.J.; Galassetti, P. Effect of Blood Flow Restriction on Tissue Oxygenation during Knee Extension. Med. Sci. Sport. Exerc. 2015, 47, 185–193. [Google Scholar] [CrossRef] [PubMed]
- Robergs, R.A.; Ghiasvand, F.; Parker, D. Biochemistry of exercise-induced metabolic acidosis. Am. J. Physiol. Integr. Comp. Physiol. 2004, 287, R502–R516. [Google Scholar] [CrossRef]
- Suga, T.; Okita, K.; Takada, S.; Omokawa, M.; Kadoguchi, T.; Yokota, T.; Hirabayashi, K.; Takahashi, M.; Morita, N.; Horiuchi, M.; et al. Effect of multiple set on intramuscular metabolic stress during low-intensity resistance exercise with blood flow restriction. Eur. J. Appl. Physiol. 2012, 112, 3915–3920. [Google Scholar] [CrossRef] [PubMed]
- de Aguiar, R.A.; Cruz, R.S.D.O.; Turnes, T.; Pereira, K.L.; Caputo, F. Relationships between VO2 and blood lactate responses after all-out running exercise. Appl. Physiol. Nutr. Metab. 2015, 40, 263–268. [Google Scholar] [CrossRef]
- Moniz, S.C.; Islam, H.; Hazell, T.J. Mechanistic and methodological perspectives on the impact of intense interval training on post-exercise metabolism. Scand. J. Med. Sci. Sports 2020, 30, 638–651. [Google Scholar] [CrossRef] [PubMed]
- da Silva, J.C.G.; Freitas, E.D.S.; Aniceto, R.R.; Silva, K.F.; Araújo, J.P.; Bembem, M.G.; Batista, G.R.; Sousa, M.S.C. Aerobic exercise with blood flow restriction: Energy expenditure, excess postexercise oxygen consumption, and respiratory exchange ratio. Clin. Physiol. Funct. Imaging 2022, 42, 241–249. [Google Scholar] [CrossRef] [PubMed]
- Tallman, C.I.; Darracq, M.; Young, M. Analysis of intraosseous blood samples using an EPOC point of care analyzer during resuscitation. Am. J. Emerg. Med. 2017, 35, 499–501. [Google Scholar] [CrossRef]
- de Freitas, A.L.; Marangon, A.F.C. Consumo excessivo de oxigênio após atividade física—EPOC: Uma breve explanação. Univ. Ciências Saúde 2008, 2, 307–322. [Google Scholar] [CrossRef]
- Imamura, H.; Shibuya, S.; Uchida, K.; Teshima, K.; Masuda, R.; Miyamoto, N. Effect of moderate exercise on excess post-exercise oxygen consumption and catecholamines in young women. J. Sports Med. Phys. Fit. 2004, 44, 23–29. [Google Scholar]
- Sedlock, D.A.; Lee, M.-G.; Flynn, M.G.; Park, K.-S.; Kamimori, G.H. Excess Postexercise Oxygen Consumption After Aerobic Exercise Training. Int. J. Sport Nutr. Exerc. Metab. 2010, 20, 336–349. [Google Scholar] [CrossRef] [PubMed]
- Frey, G.C.; Byrnes, W.C.; Mazzeo, R.S. Factors influencing excess postexercise oxygen consumption in trained and untrained women. Metabolism 1993, 42, 822–828. [Google Scholar] [CrossRef]
- Gonzalez-Gil, A.M.; Elizondo-Montemayor, L. The Role of Exercise in the Interplay between Myokines, Hepatokines, Osteokines, Adipokines, and Modulation of Inflammation for Energy Substrate Redistribution and Fat Mass Loss: A Review. Nutrients 2020, 12, 1899. [Google Scholar] [CrossRef]
- Kuo, C.-H.; Harris, M.B. Abdominal fat reducing outcome of exercise training: Fat burning or hydrocarbon source redistribution? Can. J. Physiol. Pharmacol. 2016, 94, 695–698. [Google Scholar] [CrossRef] [PubMed]
- Zhu, R.; Wen, C.; Li, J.; Harris, M.B.; Liu, Y.-Y.; Kuo, C.-H. Lipid storage changes in human skeletal muscle during detraining. Front. Physiol. 2015, 6, 309. [Google Scholar] [CrossRef] [PubMed]
- Thompson, D.; Karpe, F.; Lafontan, M.; Frayn, K. Physical activity and exercise in the regulation of human adipose tissue physiology. Physiol. Rev. 2012, 92, 157–191. [Google Scholar] [CrossRef]
- Mora-Rodriguez, R.; Coyle, E.F. Effects of plasma epinephrine on fat metabolism during exercise: Interactions with exercise intensity. Am. J. Physiol. Metab. 2000, 278, E669–E676. [Google Scholar] [CrossRef]
- Pritzlaff, C.J.; Wideman, L.; Weltman, J.Y.; Abbott, R.D.; Gutgesell, M.E.; Hartman, M.L.; Veldhuis, J.D.; Weltman, A. Impact of acute exercise intensity on pulsatile growth hormone release in men. J. Appl. Physiol. 1999, 87, 498–504. [Google Scholar] [CrossRef]
- Hattori, A.; Mawatari, K.; Tsuzuki, S.; Yoshioka, E.; Toda, S.; Yoshida, M.; Yasui, S.; Furukawa, H.; Morishima, M.; Ono, K.; et al. β-Adrenergic-AMPK Pathway Phosphorylates Acetyl-CoA Carboxylase in a High-epinephrine Rat Model, SPORTS. Obesity 2010, 18, 48–54. [Google Scholar] [CrossRef]
- Koh, H.-J.; Hirshman, M.F.; He, H.; Li, Y.; Manabe, Y.; Balschi, J.A.; Goodyear, L.J. Adrenaline is a critical mediator of acute exercise-induced AMP-activated protein kinase activation in adipocytes. Biochem. J. 2007, 403, 473–481. [Google Scholar] [CrossRef]
- Watt, M.J.; Holmes, A.G.; Pinnamaneni, S.K.; Garnham, A.P.; Steinberg, G.R.; Kemp, B.E.; Febbraio, M.A. Regulation of HSL serine phosphorylation in skeletal muscle and adipose tissue. Am. J. Physiol. Metab. 2006, 290, E500–E508. [Google Scholar] [CrossRef] [PubMed]
- Egan, J.J.; Greenberg, A.S.; Chang, M.K.; Wek, S.A.; Moos, M.C.; Londos, C. Mechanism of hormone-stimulated lipolysis in adipocytes: Translocation of hormone-sensitive lipase to the lipid storage droplet. Proc. Natl. Acad. Sci. USA 1992, 89, 8537–8541. [Google Scholar] [CrossRef] [PubMed]
- Kratky, D.; Strauss, J.G.; Zechner, R. Tissue-specific activity of lipoprotein lipase in skeletal muscle regulates the expression of uncoupling protein 3 in transgenic mouse models. Biochem. J. 2001, 355, 647–652. [Google Scholar] [CrossRef] [PubMed]

 = phase of blood flow restriction;
  = fasting blood collection in the morning;
  = dual-energy X-ray test;
  = maximum oxygen uptake test;
  = computed tomography test;
  = blood collection before and after acute exercise.
= phase of blood flow restriction; = fasting blood collection in the morning; = dual-energy X-ray test; = maximum oxygen uptake test; = computed tomography test; = blood collection before and after acute exercise.
= blood collection before and after acute exercise.
= phase of blood flow restriction; = fasting blood collection in the morning; = dual-energy X-ray test; = maximum oxygen uptake test; = computed tomography test; = blood collection before and after acute exercise.


| C Group (n = 16) | H Group (n = 18) | E Group (n = 17) | I Group (n = 16) | |
|---|---|---|---|---|
| Age (years) | 21.5 ± 1.5 | 21.8 ± 1.8 | 22.1 ± 2.0 | 21.6 ± 1.9 |
| Height (cm) | 166.7 ± 9.0 | 168.0 ± 8.5 | 166.2 ± 8.9 | 166.6 ± 9.2 |
| Weight (kg) | 74.6 ± 7.5 | 74.4 ± 7.4 | 73.5 ± 9.3 | 75.4 ± 9.7 |
| BMI (kg/m2) | 26.8 ± 2.0 | 26.3 ± 1.1 | 26.5 ± 1.4 | 27.1 ± 1.5 |
| VO2max (mL/kg/min) | ||||
| 0 weeks | 31.3 ± 5.1 | 32.9 ± 5.1 | 32.0 ± 4.8 | 32.6 ± 6.1 |
| 4 weeks | 34.7 ± 4.7 a | 34.2 ± 5.1 a | 34.9 ± 4.1 a | |
| 8 weeks | 36.1 ± 4.4 a,b | 36.0 ± 5.4 a,b | 37.1 ± 6.1 a,b | |
| 12 weeks | 31.7 ± 5.2 | 36.9 ± 5.9 a,b,d | 37.8 ± 5.3 a,b,c,d | 38.6 ± 6.2 a,b,c,d |
| C Group | H Group | E Group | I Group | |||||
|---|---|---|---|---|---|---|---|---|
| Pre | 12 Weeks | Pre | 12 Weeks | Pre | 12 Weeks | Pre | 12 Weeks | |
| Estimated daily energy intake (kJ/day) | 8236.9 ± 555.3 | 8288.9 ± 556.2 | 8113.9 ± 571.5 | 8066.4 ± 595.4 | 8159.0 ± 725.8 | 8220.0 ± 698.3 | 8123.6 ± 587.7 | 8162.1 ± 627.4 |
| Estimated daily energy expenditure (kJ/day) | 1952.9 ± 252.1 | 2002.8 ± 277.8 | 2016.4 ± 286.1 | 1929.6 ± 233.4 | 2024.1 ± 311.8 | 2033.5 ± 309.9 | 2004.2 ± 285.8 | 2041.4 ± 278.5 |
| H Group | E Group | I Group | |||||||
|---|---|---|---|---|---|---|---|---|---|
| 1–4 Weeks | 4–8 Weeks | 8–12 Weeks | 1–4 Weeks | 4–8 Weeks | 8–12 Weeks | 1–4 Weeks | 4–8 Weeks | 8–12 Weeks | |
| Exercise intensity (W) | 143.2 ± 31.5 | 159.4 ± 27.7 a | 175.4 ± 25.2 a,b | 146.8 ± 30.8 | 161.9 ± 27.1 a | 173.0 ± 26.9 a,b | 144.6 ± 32.5 | 167.4 ± 29.8 a | 177.1 ± 28.7 a,b |
| HR (beats/min) | 168.9 ± 12.5 | 171.1 ± 6.9 | 171.7 ± 12.1 | 173.8 ± 10.8 | 176.5 ± 9.1 | 174.1 ± 7.7 | 178.4 ± 11.0 c | 181.6 ± 9.2 c | 181.4 ± 13.4 c |
| RPE | 16.6 ± 0.9 | 16.5 ± 0.6 | 16.4 ± 0.9 | 16.5 ± 0.7 | 16.9 ± 0.7 | 16.6 ± 0.9 | 16.6 ± 1.1 | 16.9 ± 0.8 | 16.9 ± 0.9 |
| LOP | 204.8 ± 10.8 | 202.4 ± 10.3 | 203.8 ± 8.8 | 203.4 ± 13.3 | 208.8 ± 10.3 | 207.7 ± 13.6 | |||
| 40% LOP | 81.9 ± 4.3 | 80.9 ± 4.1 | 81.5 ± 3.5 | 81.4 ± 5.3 | 83.5 ± 4.1 | 83.1 ± 5.4 | |||
| C Group | H Group | E Group | I Group | Two-Way ANOVA (Group, Time, Interaction) | |||||
|---|---|---|---|---|---|---|---|---|---|
| Pre | Post | Pre | Post | Pre | Post | Pre | Post | ||
| % Body fat (%) | 40.8 ± 3.5 | 41.0 ± 3.5 | 40.6 ± 3.6 | 38.4 ± 3.5 a | 40.2 ± 2.5 | 37.2 ± 2.4 a | 40.6 ± 2.6 | 37.5 ± 2.6 a | (0.209, 0.001, 0.001) |
| 0.2 ± 0.6 | −2.1 ± 0.9 b | −3.0 ± 1.1 bc | −3.1 ± 0.9 b,c | ||||||
| Whole-body FM (kg) | 31.2 ± 5.7 | 31.3 ± 5.6 | 31.3 ± 4.4 | 28.8 ± 4.6 a | 30.9 ± 5.0 | 27.8 ± 4.8 a | 30.7 ± 3.8 | 27.3 ± 4.4 a | (0.566, 0.001, 0.001) |
| 0.1 ± 0.6 | −2.5 ± 1.1 b | −3.1 ± 1.2 b | −3.4 ± 1.2 b,c | ||||||
| Android FM (kg) | 2.5 ± 0.5 | 2.5 ± 0.5 | 2.6 ± 0.6 | 2.4 ± 0.5 a | 2.5 ± 0.6 | 2.3 ± 0.5 a | 2.7 ± 0.6 | 2.4 ± 0.6 a | (0.904, 0.001, 0.001) |
| 0.0 ± 0.1 | −0.2 ± 0.1 b | −0.2 ± 0.1 b | −0.3 ± 0.1 b,c | ||||||
| Gynoid FM (kg) | 5.7 ± 0.4 | 5.7 ± 0.5 | 5.9 ± 0.6 | 5.5 ± 0.5 a | 5.8 ± 0.6 | 5.4 ± 0.6 a | 6.0 ± 0.6 | 5.6 ± 0.6 a | (0.875, 0.001, 0.001) |
| 0.0 ± 0.1 | −0.4 ± 0.2 b | −0.4 ± 0.1 b | −0.4 ± 0.2 b | ||||||
| Trunk FM (kg) | 16.6 ± 2.3 | 16.6 ± 2.2 | 16.9 ± 2.2 | 15.6 ± 2.0 a | 17.0 ± 1.8 | 15.1 ± 1.7 a | 17.5 ± 2.0 | 15.6 ± 2.1 a | (0.867, 0.001, 0.001) |
| 0.0 ± 0.2 | −1.3 ± 0.6 b | −1.9 ± 0.4 b,c | −1.9 ± 0.7 b,c | ||||||
Publisher’s Note: MDPI stays neutral with regard to jurisdictional claims in published maps and institutional affiliations. |
© 2022 by the authors. Licensee MDPI, Basel, Switzerland. This article is an open access article distributed under the terms and conditions of the Creative Commons Attribution (CC BY) license (https://creativecommons.org/licenses/by/4.0/).
Share and Cite
Li, S.; Guo, R.; Yu, T.; Li, S.; Han, T.; Yu, W. Effect of High-Intensity Interval Training Combined with Blood Flow Restriction at Different Phases on Abdominal Visceral Fat among Obese Adults: A Randomized Controlled Trial. Int. J. Environ. Res. Public Health 2022, 19, 11936. https://doi.org/10.3390/ijerph191911936
Li S, Guo R, Yu T, Li S, Han T, Yu W. Effect of High-Intensity Interval Training Combined with Blood Flow Restriction at Different Phases on Abdominal Visceral Fat among Obese Adults: A Randomized Controlled Trial. International Journal of Environmental Research and Public Health. 2022; 19(19):11936. https://doi.org/10.3390/ijerph191911936
Chicago/Turabian StyleLi, Shuoqi, Rong Guo, Tao Yu, Shiming Li, Tenghai Han, and Wenbing Yu. 2022. "Effect of High-Intensity Interval Training Combined with Blood Flow Restriction at Different Phases on Abdominal Visceral Fat among Obese Adults: A Randomized Controlled Trial" International Journal of Environmental Research and Public Health 19, no. 19: 11936. https://doi.org/10.3390/ijerph191911936
APA StyleLi, S., Guo, R., Yu, T., Li, S., Han, T., & Yu, W. (2022). Effect of High-Intensity Interval Training Combined with Blood Flow Restriction at Different Phases on Abdominal Visceral Fat among Obese Adults: A Randomized Controlled Trial. International Journal of Environmental Research and Public Health, 19(19), 11936. https://doi.org/10.3390/ijerph191911936