
Trends in Occupational Infectious Diseases in South Korea and Classification of Industries According to the Risk of Biological Hazards Using K-Means Clustering


Abstract
1. Introduction
2. Materials and Methods
3. Results
4. Discussion
5. Conclusions
Author Contributions
Funding
Institutional Review Board Statement
Informed Consent Statement
Data Availability Statement
Conflicts of Interest
References
- Kim, T.J. COVID-19 news analysis using news big data: Focusing on topic modeling analysis. J. Korea Contents Assoc. 2020, 20, 457–466. [Google Scholar]
- Oh, M.A.; Jeon, J.A. Analysis of Major Issues Based on COVID-19 Social Big Data. In Health and Welfare Issue & Focus; Jo, H.S., Ed.; Korea Institute for Health and Social Affairs: Sejong, Korea, 2020; Volume 376, pp. 1–12. [Google Scholar]
- Lee, J.; Kim, M. Estimation of the number of working population at high-risk of COVID-19 Infection in Korea. Epidemiol. Health 2020, 42, e2020051. [Google Scholar] [CrossRef]
- Hong, J.; Choi, S.; Park, J. Vulnerable occupations to COVID-19 and measures for protecting workers from infectious biological hazards at workplaces. J. Korean Soc. Occup. Environ. Hyg. 2020, 30, 256–269. [Google Scholar]
- Baker, M.G.; Peckham, T.K.; Seixas, N.S. Estimating the burden of United States workers exposed to infection or disease: A key factor in containing risk of COVID-19 infection. PLoS ONE 2020, 15, e0232452. [Google Scholar] [CrossRef] [PubMed]
- Watterson, A. COVID-19 in the UK and occupational health and safety: Predictable not inevitable failures by government, and trade union and nongovernmental organization responses. New Solut. 2020, 30, 86–94. [Google Scholar] [CrossRef] [PubMed]
- Santos, J.; Ramos, C.; Vaz-Velho, M.; Vasconcelos Pinto, M. Occupational exposure to biological agents. Proceedings of International Conference on Applied Human Factors and Ergonomics, Orlando, FL, USA, 1 July 2020. [Google Scholar]
- Chung, Y.K.; Ahn, Y.S.; Jeong, J.S. Occupational infection in Korea. J. Korean Med. Sci. 2010, 25, S53–S61. [Google Scholar] [CrossRef] [PubMed]
- Su, C.P.; de Perio, M.A.; Cummings, K.J.; McCague, A.B.; Luckhaupt, S.E.; Sweeney, M.H. Case investigations of infectious diseases occurring in workplaces, United States, 2006–2015. Emerg. Infect. Dis. 2019, 25, 397–405. [Google Scholar] [CrossRef]
- Turner, S.; Lines, S.; Chen, Y.; Hussey, L.; Agius, R. Work-related infectious disease reported to the occupational disease intelligence network and the health and occupation reporting network in the UK (2000–2003). Occup. Med. 2005, 55, 275–281. [Google Scholar] [CrossRef][Green Version]
- Haagsma, J.A.; Tariq, L.; Heederik, D.J.; Havelaar, A.H. Infectious disease risks associated with occupational exposure: A systematic review of the literature. Occup. Environ. Med. 2012, 69, 140–146. [Google Scholar] [CrossRef]
- Acke, S.; Couvreur, S.; Bramer, W.M.; Schmickler, M.N.; De Schryver, A.; Haagsma, J.A. Global infectious disease risks associated with occupational exposure among non-healthcare workers: A systematic review of the literature. Occup. Environ. Med. 2022, 79, 63–71. [Google Scholar] [CrossRef]
- Burzoni, S.; Duquenne, P.; Mater, G.; Ferrari, L. Workplace biological risk assessment: Review of existing and description of a comprehensive approach. Atmosphere 2020, 11, 741. [Google Scholar] [CrossRef]
- Park, D.; Choi, S.; Byun, H.; Kim, Y.; Kim, S.; Ha, K.; Kang, T. Comprehensive review of standard occupational classification (SOC) as used in the occupational safety and health field. J. Korean Soc. Occup. Environ. Hyg. 2013, 23, 11–19. [Google Scholar]
- EFSA Panel on Biological Hazards (BIOHAZ). Scientific opinion on the development of a risk ranking framework on biological hazards. EFSA J. 2012, 10, 2724. [Google Scholar] [CrossRef]
- Fosse, J.; Seegers, H.S.; Magras, C. Foodborne zoonoses due to meat: A quantitative approach for a comparative risk assessment applied to pig slaughtering in Europe. Vet. Res. 2008, 39, 1. [Google Scholar] [CrossRef]
- KOSIS; Ministry of Employment and Labor. Current State of Industrial Accidents, Total Accidents Status and Analysis—By Industry (Division). Available online: https://kosis.kr/statHtml/statHtml.do?orgId=118&tblId=DT_11806_N000&conn_path=I2 (accessed on 30 June 2022).
- KOSIS; Ministry of Employment and Labor. Current State of Industrial Accidents, Occupational Disease Incidence Status—By Detailed Disease Type. Vol. I2. Available online: https://kosis.kr/statHtml/statHtml.do?orgId=118&tblId=DT_11806_N038& conn _ path= (accessed on 30 June 2022).
- KOSIS; Ministry of Employment and Labor. Current State of Industrial Accidents, Occupational Disease Fatal Accident Status—By Detailed Disease Type. Available online: https://kosis.kr/statHtml/statHtml.do?orgId=118&tblId=DT_11806_N055 &conn_path=I2 (accessed on 30 June 2022).
- Sreedhar, C.; Kasiviswanath, N.; Chenna Reddy, P. Clustering large datasets using k-means modified inter and intra clustering(KM-I2C) in Hadoop. J. Big Data 2017, 4, 1–19. [Google Scholar] [CrossRef]
- Abdullah, D.; Susilo, S.; Ahmar, A.S.; Rusli, R.; Hidayat, R. The application of k-means clustering for province clustering in indonesia of the risk of the COVID-19 pandemic based on COVID-19 data. Qual. Quant. 2022, 56, 1283–1291. [Google Scholar] [CrossRef]
- Zhu, Z.; Liu, N. Early Warning of financial risk based on k-means clustering algorithm. Complexity 2021, 2021, 1–12. [Google Scholar] [CrossRef]
- Li, C.; Sun, L.; Jia, J.; Cai, Y.; Wang, X. Risk assessment of water pollution sources based on an integrated k-means clustering and set pair analysis method in the region of Shiyan, China. Sci. Total Environ. 2016, 557–558, 307–316. [Google Scholar] [CrossRef]
- Khorshidi, N.; Parsa, M.; Lentz, D.R.; Sobhanverdi, J. Identification of heavy metal pollution sources and its associated risk assessment in an industrial town using the k-means clustering technique. Appl. Geochem. 2021, 135, 105113. [Google Scholar] [CrossRef]
- Shi, W.; Zeng, W. Application of k-means clustering to environmental risk zoning of the chemical industrial area. Front. Environ. Sci. Eng. 2014, 8, 117–127. [Google Scholar] [CrossRef]
- Bholowalia, P.; Kumar, A. EBK-Means: A clustering technique based on elbow method and k-means in WSN. Int. J. Comput. Appl. 2014, 105, 17–24. [Google Scholar]
- Kodinariya, T.M.; Makwana, P.R. Review on determining number of cluster in k-means clustering. Int. J. Adv. Res. Comput. Sci. Manag. Stud. 2013, 1, 90–95. [Google Scholar]
- Ekwaru, J.P.; Veugelers, P.J. The overlooked importance of constants added in log transformation of independent variables with zero values: A proposed approach for determining an optimal constant. Stat. Biopharm. Res. 2018, 10, 26–29. [Google Scholar] [CrossRef]
- Kim, H.J.; Fay, M.P.; Feuer, E.J.; Midthune, D.N. Permutation tests for joinpoint regression with applications to cancer rates. Stat. Med. 2000, 19, 335–351. [Google Scholar] [CrossRef]
- Charrad, M.; Ghazzali, N.; Boiteau, V.; Niknafs, A. NbClust: An R package for determining the relevant number of clusters in a data set. J. Stat. Soft. 2014, 61, 1–36. [Google Scholar] [CrossRef]
- Duda, R.O.; Hart, P.E.; Stock, D.G. Pattern Classification and Scene Analysis, 2nd ed.; Wiley New York: Menlo Park, CA, USA, 1973; p. 15. [Google Scholar]
- Bielicki, J.A.; Duval, X.; Gobat, N.; Goossens, H.; Koopmans, M.; Tacconelli, E.; van der Werf, S. Monitoring approaches for health-care workers during the COVID-19 pandemic. Lancet Infect. Dis. 2020, 20, e261–e267. [Google Scholar] [CrossRef]
- Corrao, C.R.N.; Mazzotta, A.; La Torre, G.; De Giusti, M. Biological risk and occupational health. Ind. Health 2012, 50, 326–337. [Google Scholar] [CrossRef]
- Rim, K.T.; Lim, C.H. Biologically hazardous agents at work and efforts to protect workers’ health: A review of recent reports. Saf. Health Work. 2014, 5, 43–52. [Google Scholar] [CrossRef]
- Land, C.J.; Hult, K.; Fuchs, R.; Hagelberg, S.; Lundström, H. Tremorgenic mycotoxins from aspergillus fumigatus as a possible occupational health problem in sawmills. Appl. Environ. Microbiol. 1987, 53, 787–790. [Google Scholar] [CrossRef]
- Dias, M.; Gomes, B.; Cervantes, R.; Pena, P.; Viegas, S.; Viegas, C. Microbial occupational exposure assessments in sawmills—A review. Atmosphere 2022, 13, 266. [Google Scholar] [CrossRef]
- Straumfors, A.; Foss, O.A.H.; Fuss, J.; Mollerup, S.K.; Kauserud, H.; Mundra, S. The inhalable mycobiome of sawmill workers: Exposure characterization and diversity. Appl. Environ. Microbiol. 2019, 85, e01448-e19. [Google Scholar] [CrossRef] [PubMed]
- Terho, E.O.; Husman, K.; Kotimaa, M.; Sjöblom, T. Extrinsic allergic alveolitis in a sawmill worker. A Case Report. Scand. J. Work Environ. Health 1980, 6, 153–157. [Google Scholar] [CrossRef] [PubMed]
- Dutkiewicz, J.; Krysińska-Traczyk, E.; Prażmo, Z.; Skórska, C.; Sitkowska, J. Exposure to airborne microorganisms in Polish sawmills. Ann. Agric. Environ. Med. 2001, 8, 71–80. [Google Scholar] [PubMed]
- Klarić, M.Š.; Varnai, V.M.; Calušić, A.L.; Macan, J. Occupational exposure to airborne fungi in two Croatian sawmills and atopy in exposed workers. Ann. Agric. Environ. Med. 2012, 19, 213–219. [Google Scholar]
- Nadal, M.; Inza, I.; Schuhmacher, M.; Figueras, M.J.; Domingo, J.L. Health risks of the occupational exposure to microbiological and chemical pollutants in a municipal waste organic fraction treatment plant. Int. J. Hyg. Environ. Health 2009, 212, 661–669. [Google Scholar] [CrossRef] [PubMed]
- Malmros, P.; Sigsgaard, T.; Bach, B. Occupational health problems due to garbage sorting. Waste Manag. Res. 1992, 10, 227–234. [Google Scholar] [CrossRef]
- Szulc, J.; Okrasa, M.; Majchrzycka, K.; Sulyok, M.; Nowak, A.; Szponar, B.; Górczyńska, A.; Ryngajłło, M.; Gutarowska, B. Microbiological and toxicological hazard assessment in a waste sorting plant and proper respiratory protection. J. Environ. Manag. 2022, 303, 114257. [Google Scholar] [CrossRef]
- Anderson, J.M. Biological responses to materials. Annu. Rev. Mater. Res. 2001, 31, 81–110. [Google Scholar] [CrossRef]


| Condition of Legal Management | Basis Clause in Occupational Safety and Health Regulation | |
|---|---|---|
| Classification | Content | |
| Task | Medical practice | Article 593 paragraph 1 |
| Blood test | Article 593 paragraph 2 | |
| Handling of patient’s specimen | Article 593 paragraph 3 | |
| Handling of pathogens for research | Article 593 paragraph 4 | |
| Cattle-breeding | Article 593 paragraph 6 (citing article 592 paragraph 4 sub-paragraph c) | |
| Slaughtering | Article 593 paragraph 6 (citing article 592 paragraph 4 sub-paragraph c) | |
| Workplace | Group accommodation | Article 593 paragraph 5 |
| Field | Article 593 paragraph 6 (citing article 592 paragraph 4 sub-paragraph a) | |
| Work environment | Possibility of direct or indirect contact with wild rodents | Article 593 paragraph 6 (citing article 592 paragraph 4 sub-paragraph b) |
| Detailed Classification of Occupational Disease | Number | Rate | |||
|---|---|---|---|---|---|
| Name | Code of Korean Statistical Information Service | Illness | Fatality | Incidence (per 100,000) | Case Fatality (%) |
| Total occupational disease | 15118AC3BM | 44,733 | 9821 | 15.26 | 21.95 |
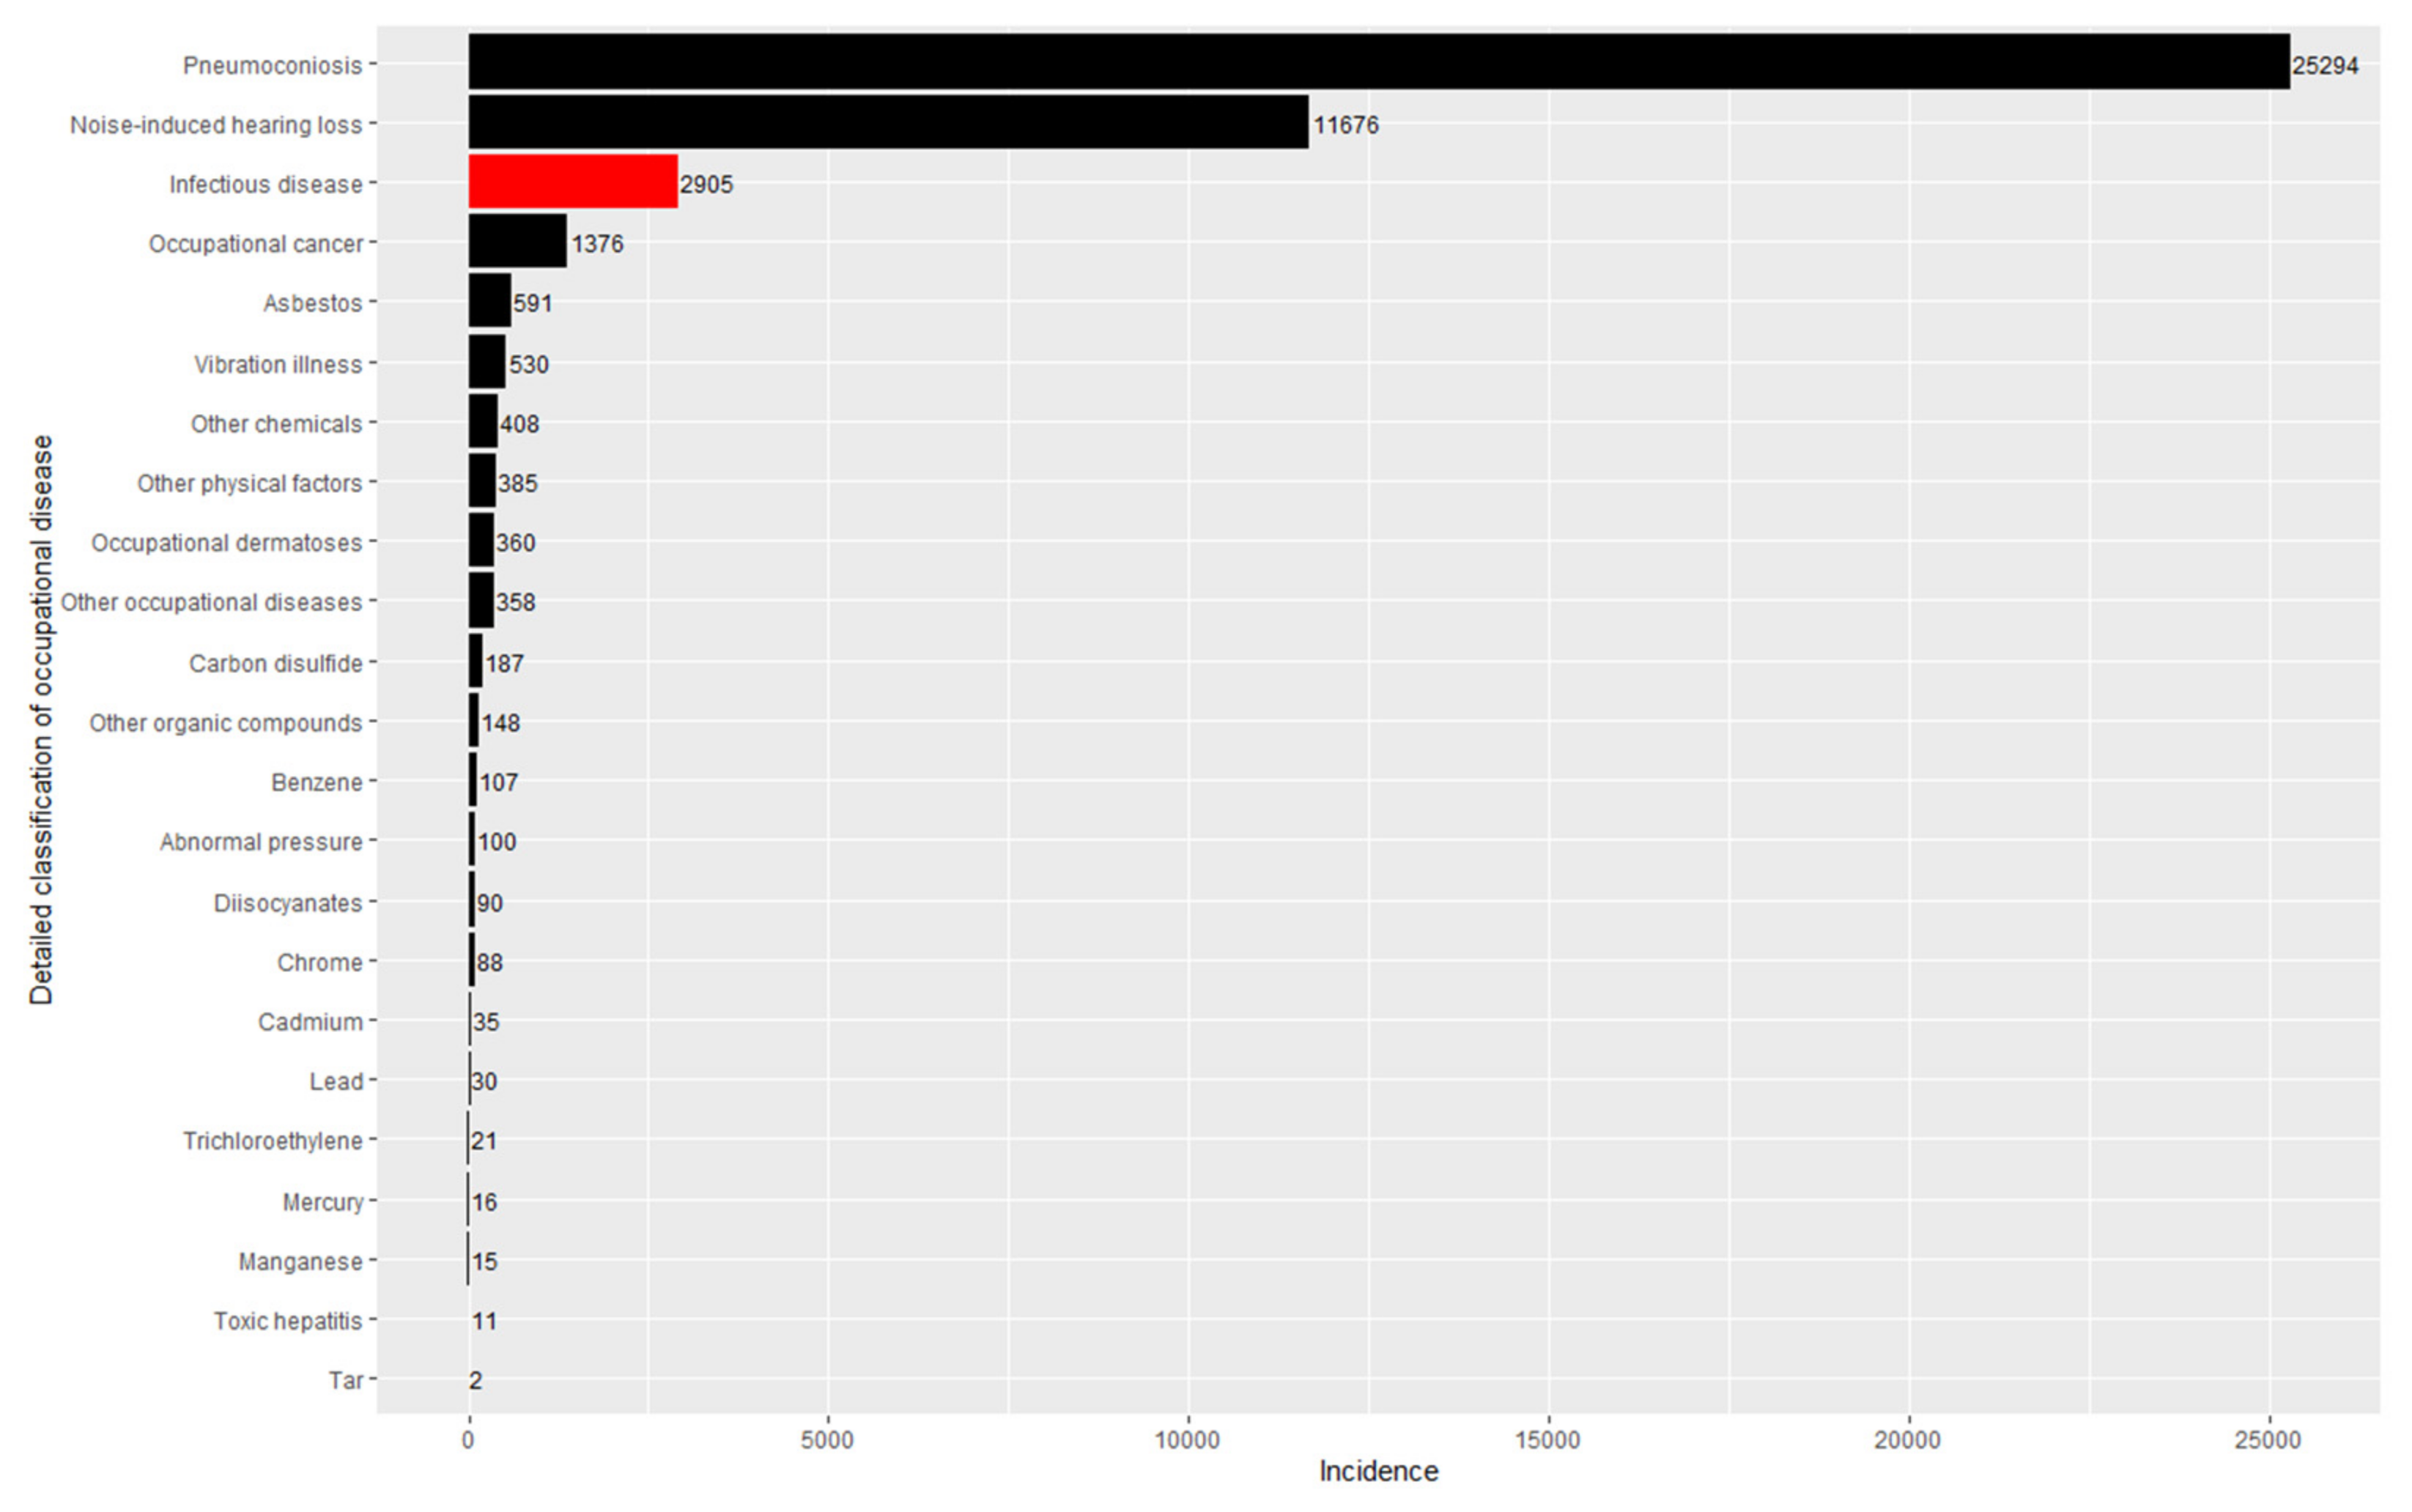
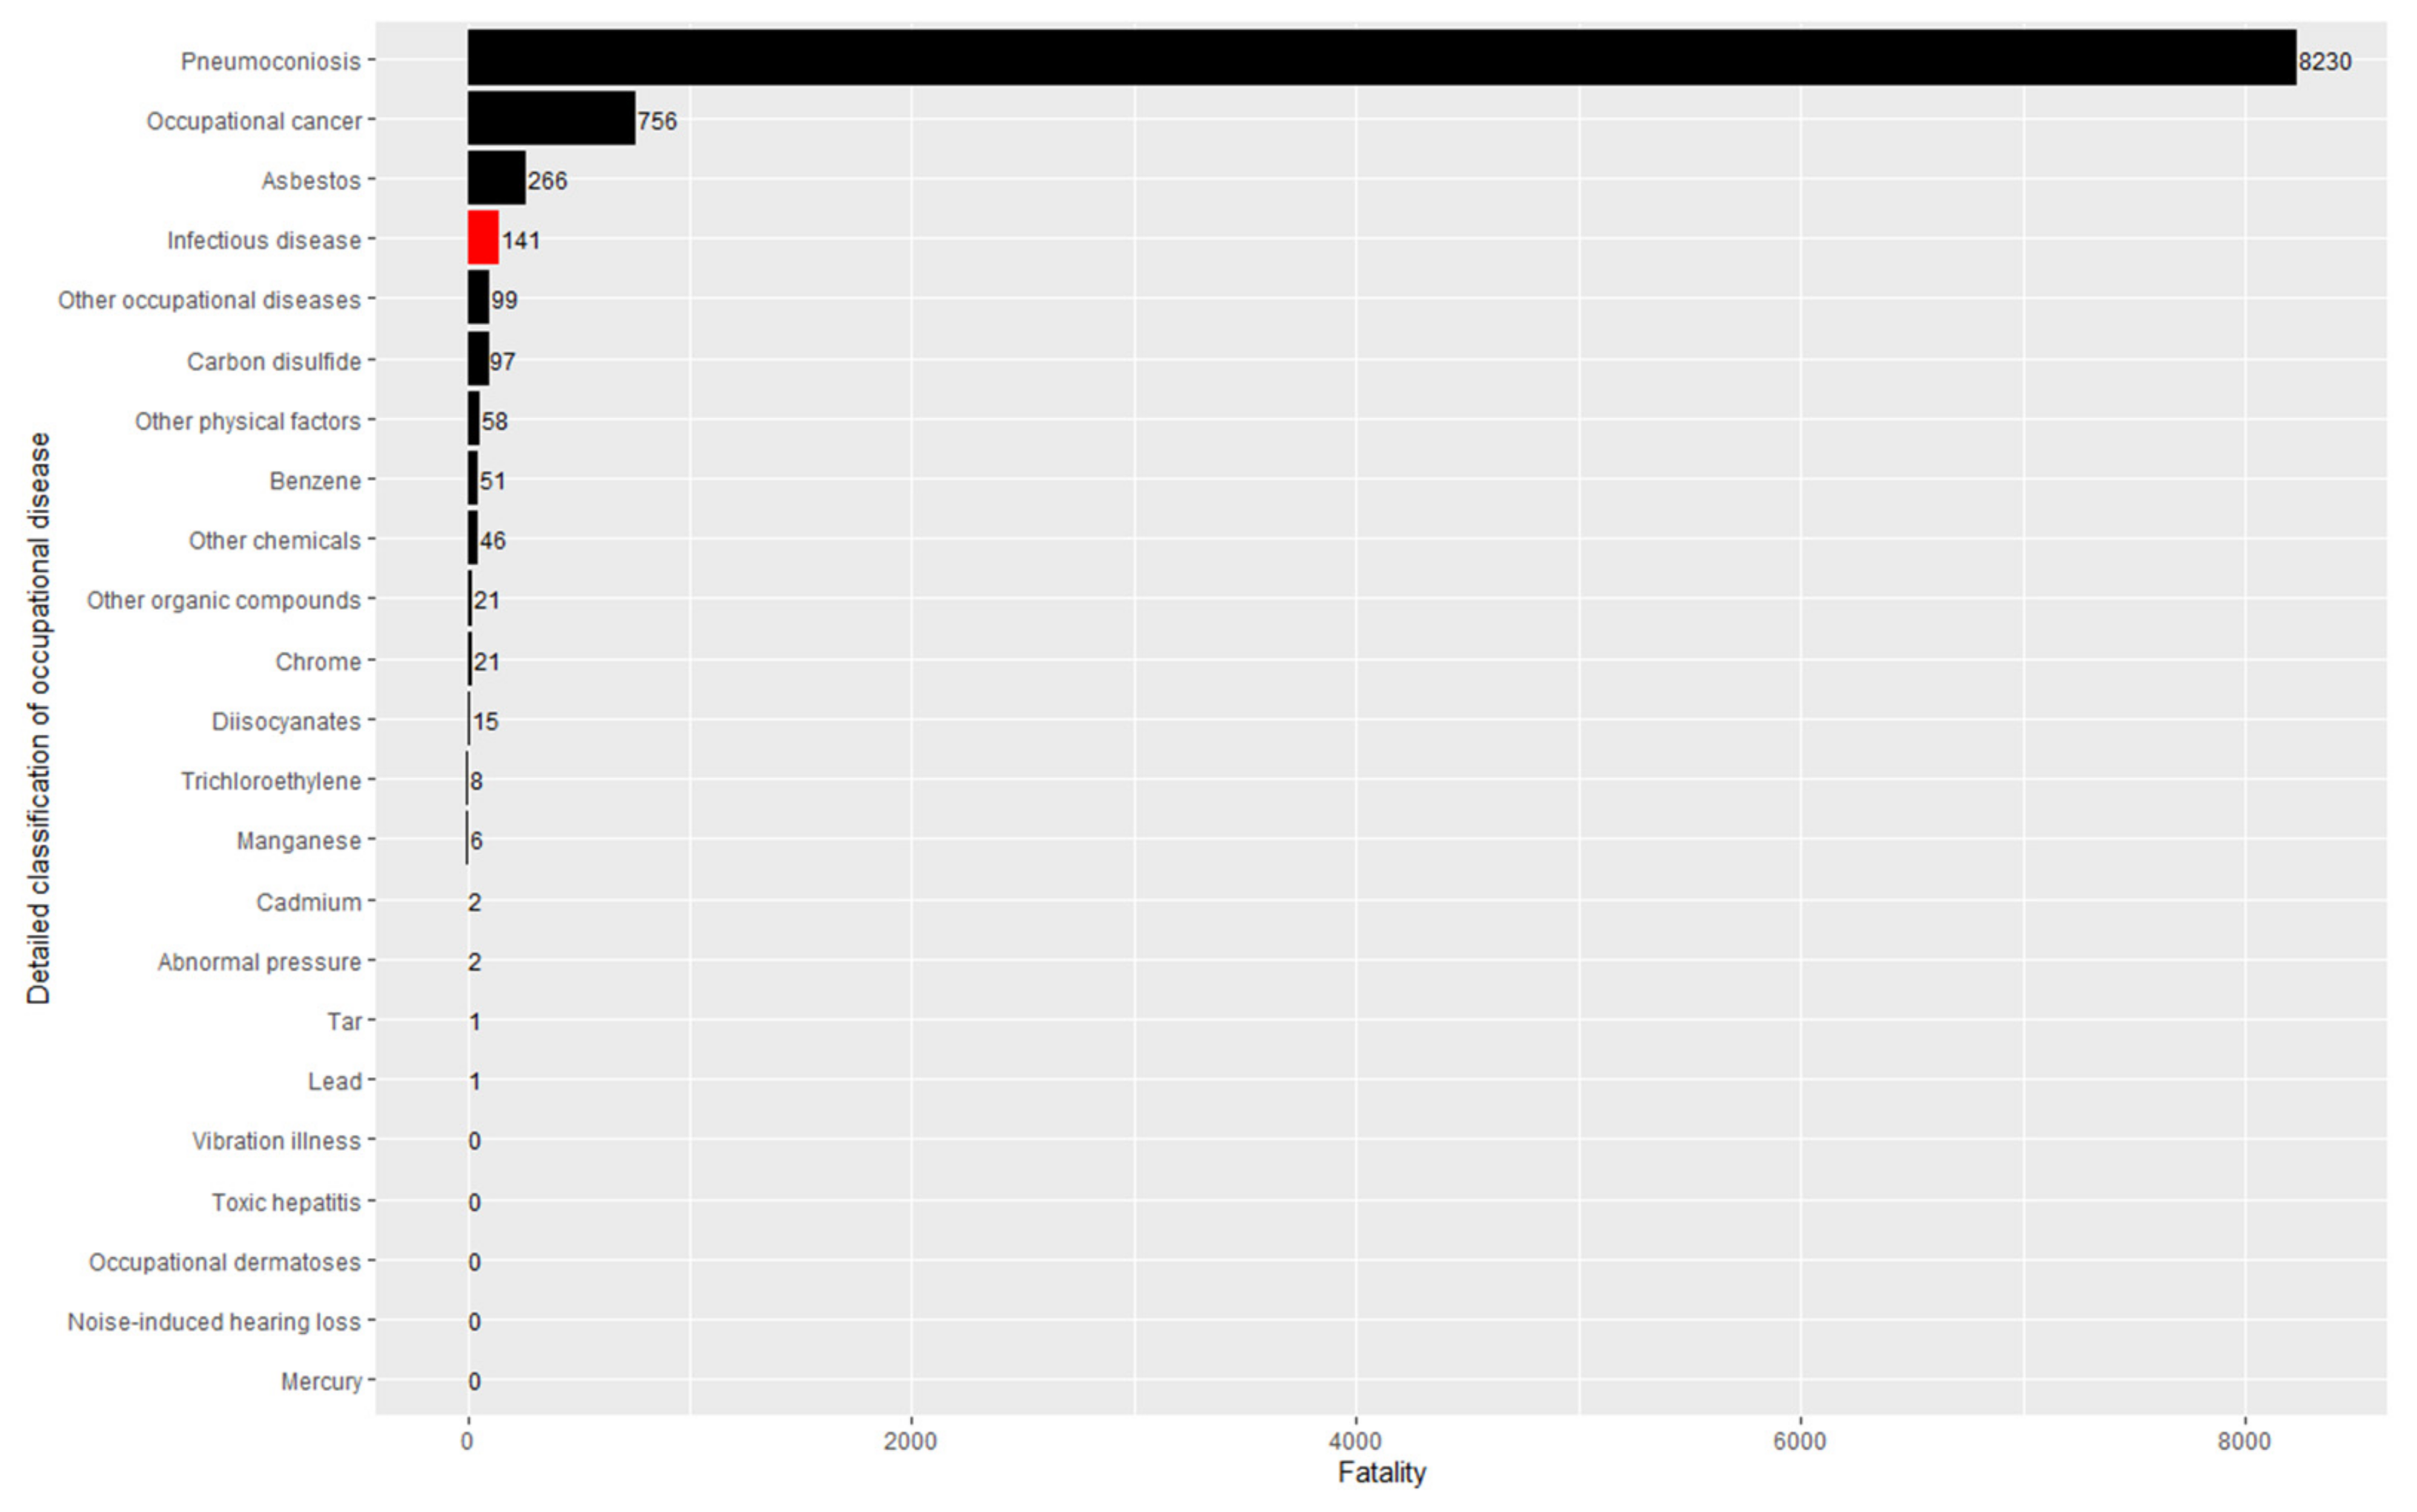
| Pneumoconiosis | 15118AC3BMAA | 25,294 | 8230 | 8.63 | 32.54 |
| Noise-induced hearing loss | 15118AC3BMAB | 11,676 | 0 | 3.98 | 0 |
| Abnormal pressure | 15118AC3BMAC | 100 | 2 | 3.41 × 10⁻² | 2.00 |
| Vibration illness | 15118AC3BMAD | 530 | 0 | 1.81 × 10⁻¹ | 0 |
| Other physical factors | 15118AC3BMAE | 385 | 58 | 1.31 × 10⁻¹ | 15.06 |
| Carbon disulfide | 15118AC3BMAF | 187 | 97 | 6.38 × 10⁻² | 51.87 |
| Trichloroethylene | 15118AC3BMAG | 21 | 8 | 7.16 × 10⁻³ | 38.10 |
| Other organic compounds | 15118AC3BMAH | 148 | 21 | 5.05 × 10⁻² | 14.19 |
| Benzene | 15118AC3BMAI | 107 | 51 | 3.65 × 10⁻² | 47.66 |
| Tar | 15118AC3BMAJ | 2 | 1 | 6.82 × 10⁻⁴ | 50.00 |
| Diisocyanates | 15118AC3BMAL | 90 | 15 | 3.07 × 10⁻² | 16.67 |
| Asbestos | 15118AC3BMAM | 591 | 266 | 2.02 × 10⁻¹ | 45.01 |
| Other chemicals | 15118AC3BMAN | 408 | 46 | 1.39 × 10⁻¹ | 11.27 |
| Lead | 15118AC3BMAO | 30 | 1 | 1.02 × 10⁻² | 3.33 |
| Mercury | 15118AC3BMAP | 16 | 0 | 5.46 × 10⁻³ | 0 |
| Chrome | 15118AC3BMAQ | 88 | 21 | 3.00 × 10⁻² | 3.86 |
| Cadmium | 15118AC3BMAR | 35 | 2 | 1.19 × 10⁻² | 5.71 |
| Manganese | 15118AC3BMAS | 15 | 6 | 5.12 × 10⁻³ | 40.00 |
| Infectious disease | 15118AC3BMAT | 2905 | 141 | 9.91 × 10⁻¹ | 4.85 |
| Toxic hepatitis | 15118AC3BMAV01 | 11 | 0 | 3.75 × 10⁻³ | 0 |
| Occupational dermatoses | 15118AC3BMAU | 360 | 0 | 1.23 × 10⁻¹ | 0 |
| Occupational cancer | 15118AC3BMAU00 | 1376 | 756 | 4.69 × 10⁻¹ | 54.95 |
| Other occupational diseases | 15118AC3BMAV | 358 | 99 | 1.22 × 10⁻¹ | 27.65 |
| Year | Illness | Fatality | Number of Workers | Incidence Rate (per 100,000) | Case Fatality Rate (%) | Change in Incidence Rate (%) | Change in Case Fatality Rate (%) |
|---|---|---|---|---|---|---|---|
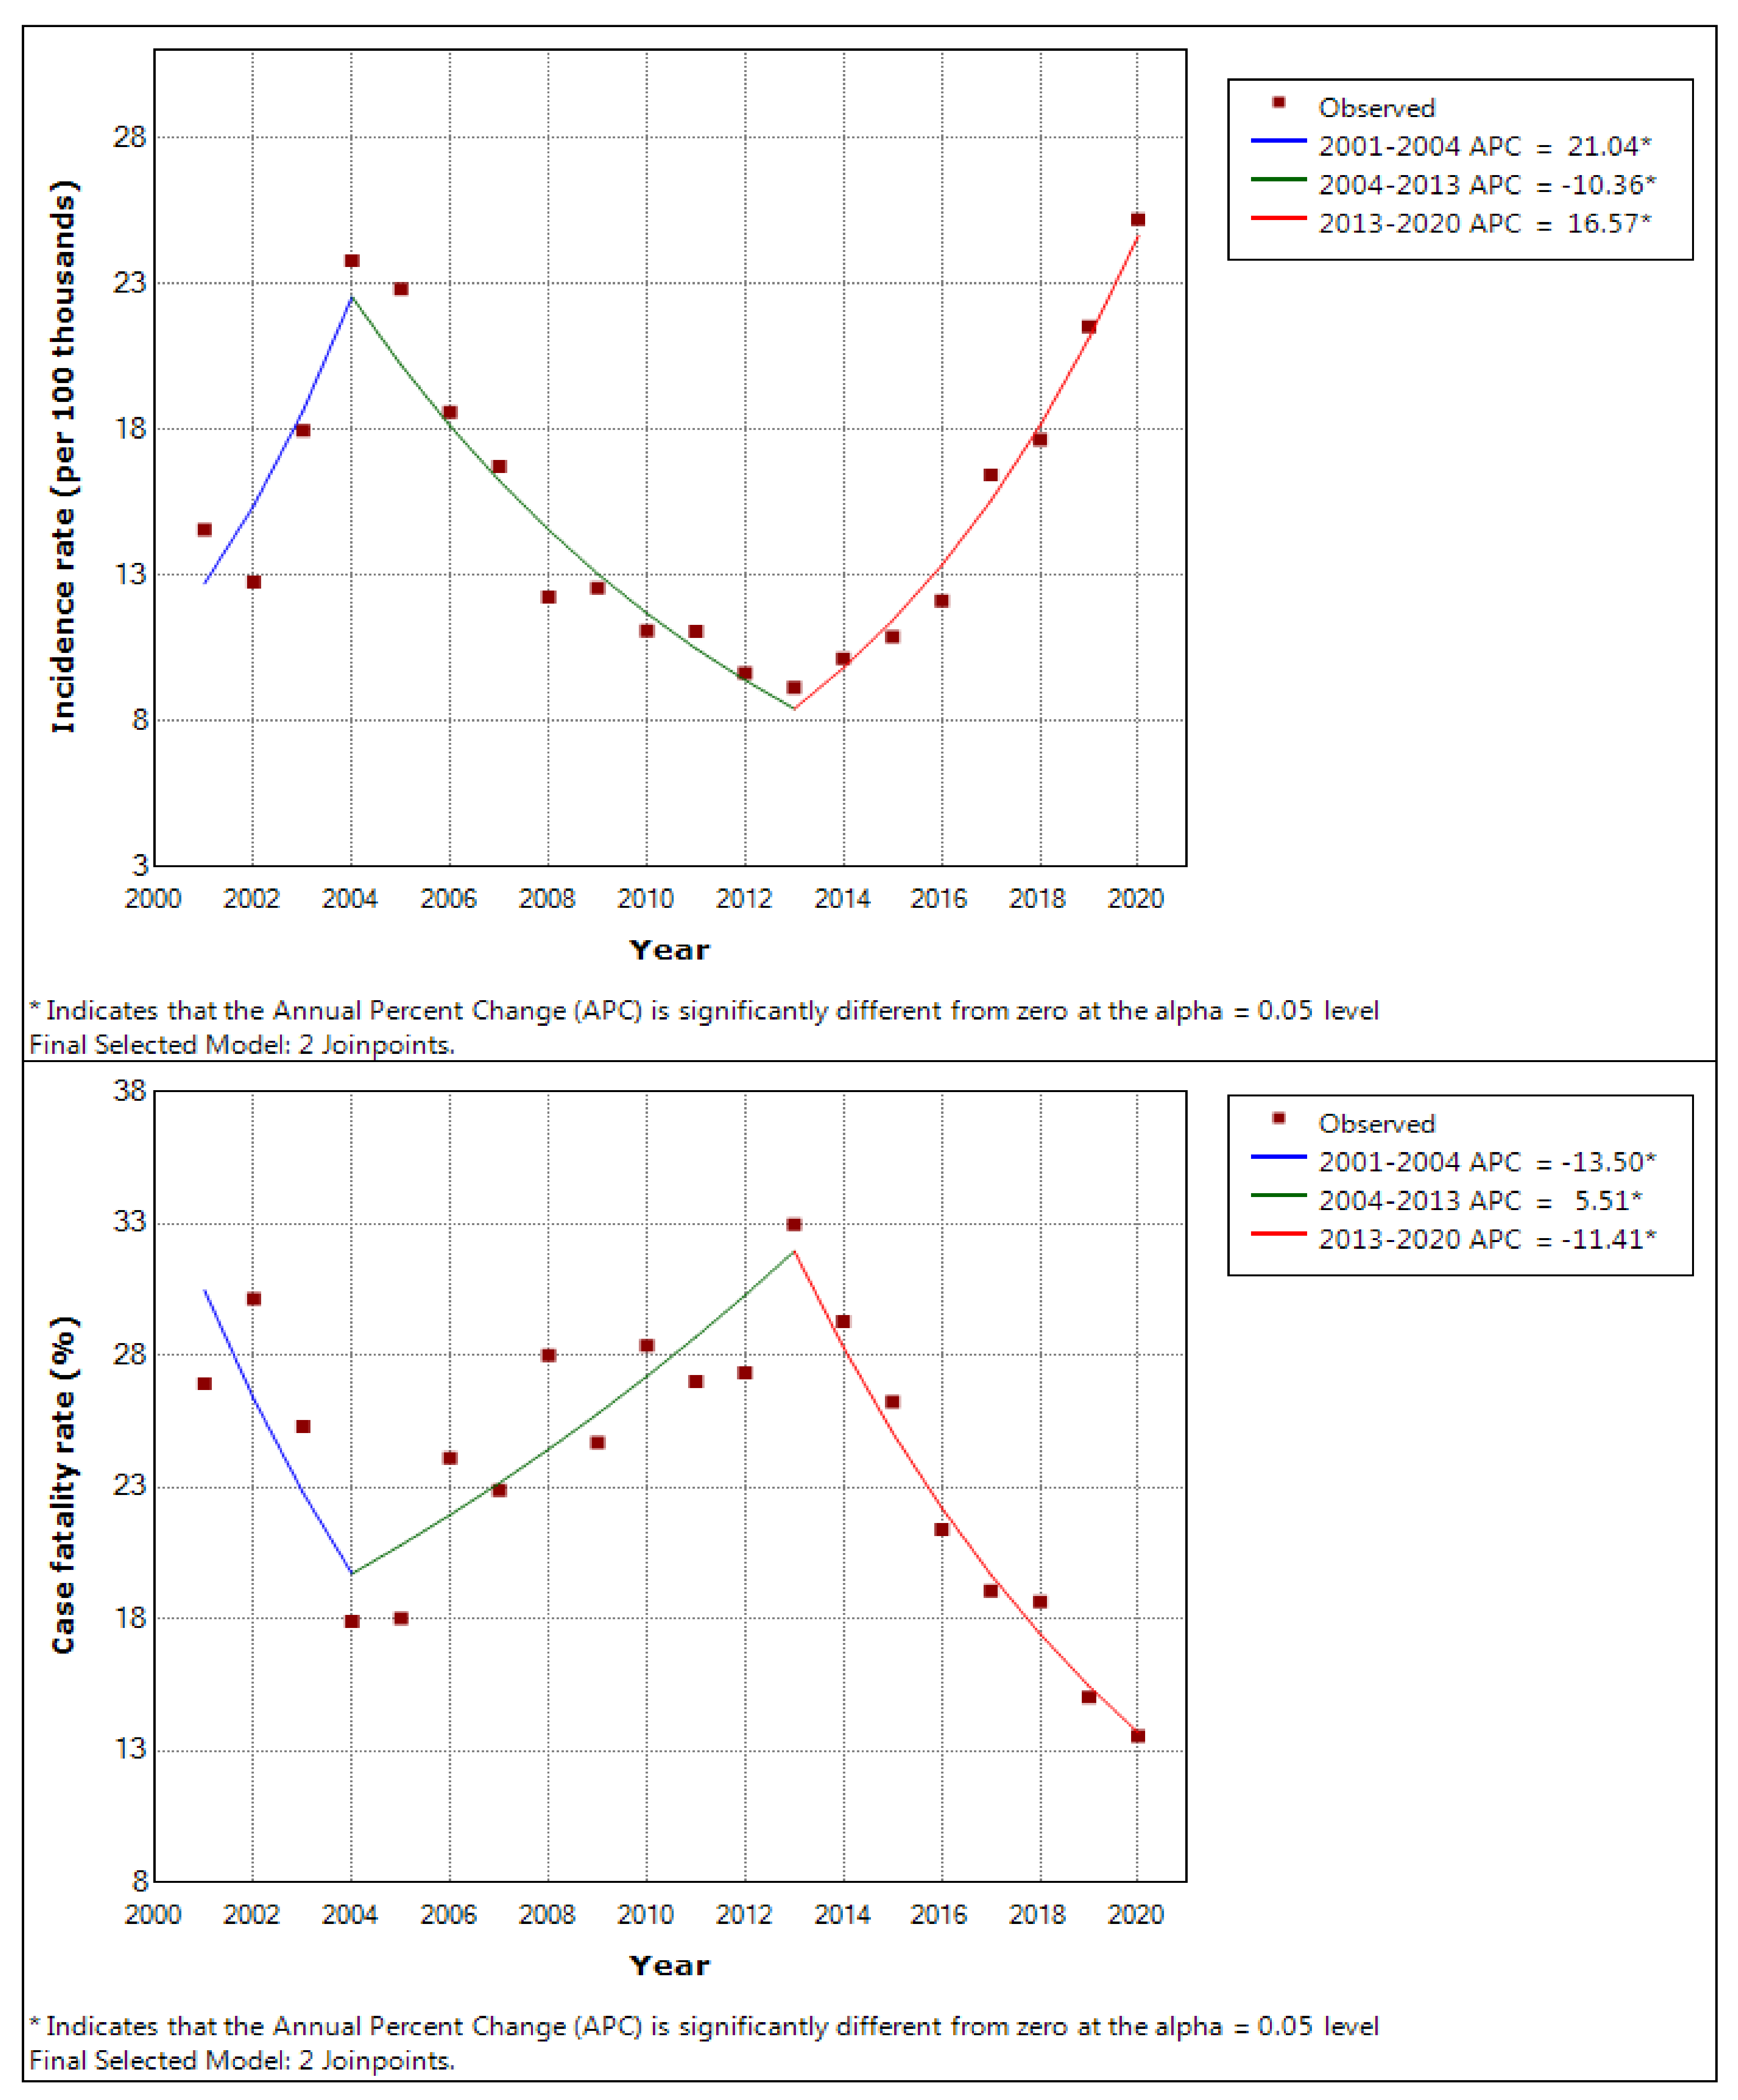
| 2001 | 108 | 6 | 10,581,186 | 1.02 | 5.56 | - | - |
| 2002 | 93 | 7 | 10,571,279 | 8.80 × 10⁻¹ | 7.53 | −13.81 | 35.48 |
| 2003 | 132 | 5 | 10,599,345 | 1.25 | 3.79 | 41.56 | −49.68 |
| 2004 | 167 | 2 | 10,473,090 | 1.59 | 1.20 | 28.04 | −68.38 |
| 2005 | 100 | 1 | 11,059,193 | 9.04 × 10⁻¹ | 1.00 | −43.29 | −16.50 |
| 2006 | 131 | 6 | 11,688,797 | 1.12 | 4.58 | 23.94 | 358.02 |
| 2007 | 188 | 7 | 12,528,879 | 1.50 | 3.72 | 33.89 | −18.71 |
| 2008 | 134 | 5 | 13,489,986 | 9.93 × 10⁻¹ | 3.73 | −33.80 | 0.21 |
| 2009 | 427 | 8 | 13,884,927 | 3.08 | 1.87 | 209.59 | −49.79 |
| 2010 | 228 | 17 | 14,198,748 | 1.61 | 7.46 | −47.78 | 297.97 |
| 2011 | 168 | 11 | 14,362,372 | 1.17 | 6.55 | −27.16 | −12.18 |
| 2012 | 133 | 8 | 15,548,423 | 8.55 × 10⁻¹ | 6.02 | −26.87 | −8.13 |
| 2013 | 134 | 8 | 15,449,228 | 8.67 × 10⁻¹ | 5.97 | 1.40 | −0.75 |
| 2014 | 107 | 14 | 17,062,308 | 6.27 × 10⁻¹ | 13.08 | −27.70 | 119.16 |
| 2015 | 77 | 3 | 17,968,931 | 4.29 × 10⁻¹ | 3.90 | −31.67 | −70.22 |
| 2016 | 80 | 7 | 18,431,716 | 4.34 × 10⁻¹ | 8.75 | 1.29 | 124.58 |
| 2017 | 95 | 4 | 18,560,142 | 5.12 × 10⁻¹ | 4.21 | 17.93 | −51.88 |
| 2018 | 79 | 7 | 19,073,438 | 4.14 × 10⁻¹ | 8.86 | −19.08 | 110.44 |
| 2019 | 84 | 9 | 18,725,160 | 4.49 × 10⁻¹ | 10.71 | 8.31 | 20.92 |
| 2020 | 240 | 6 | 18,974,513 | 1.26 | 2.50 | 181.96 | −76.67 |
| Year | Illness | Fatality | Number of Workers | Incidence Rate (per 100,000) | Case Fatality Rate (%) | Incidence Ratio of Infectious Diseases to All Occupational Diseases (%) | Fatal Ratio of Infectious Diseases to All Occupational Diseases (%) |
|---|---|---|---|---|---|---|---|
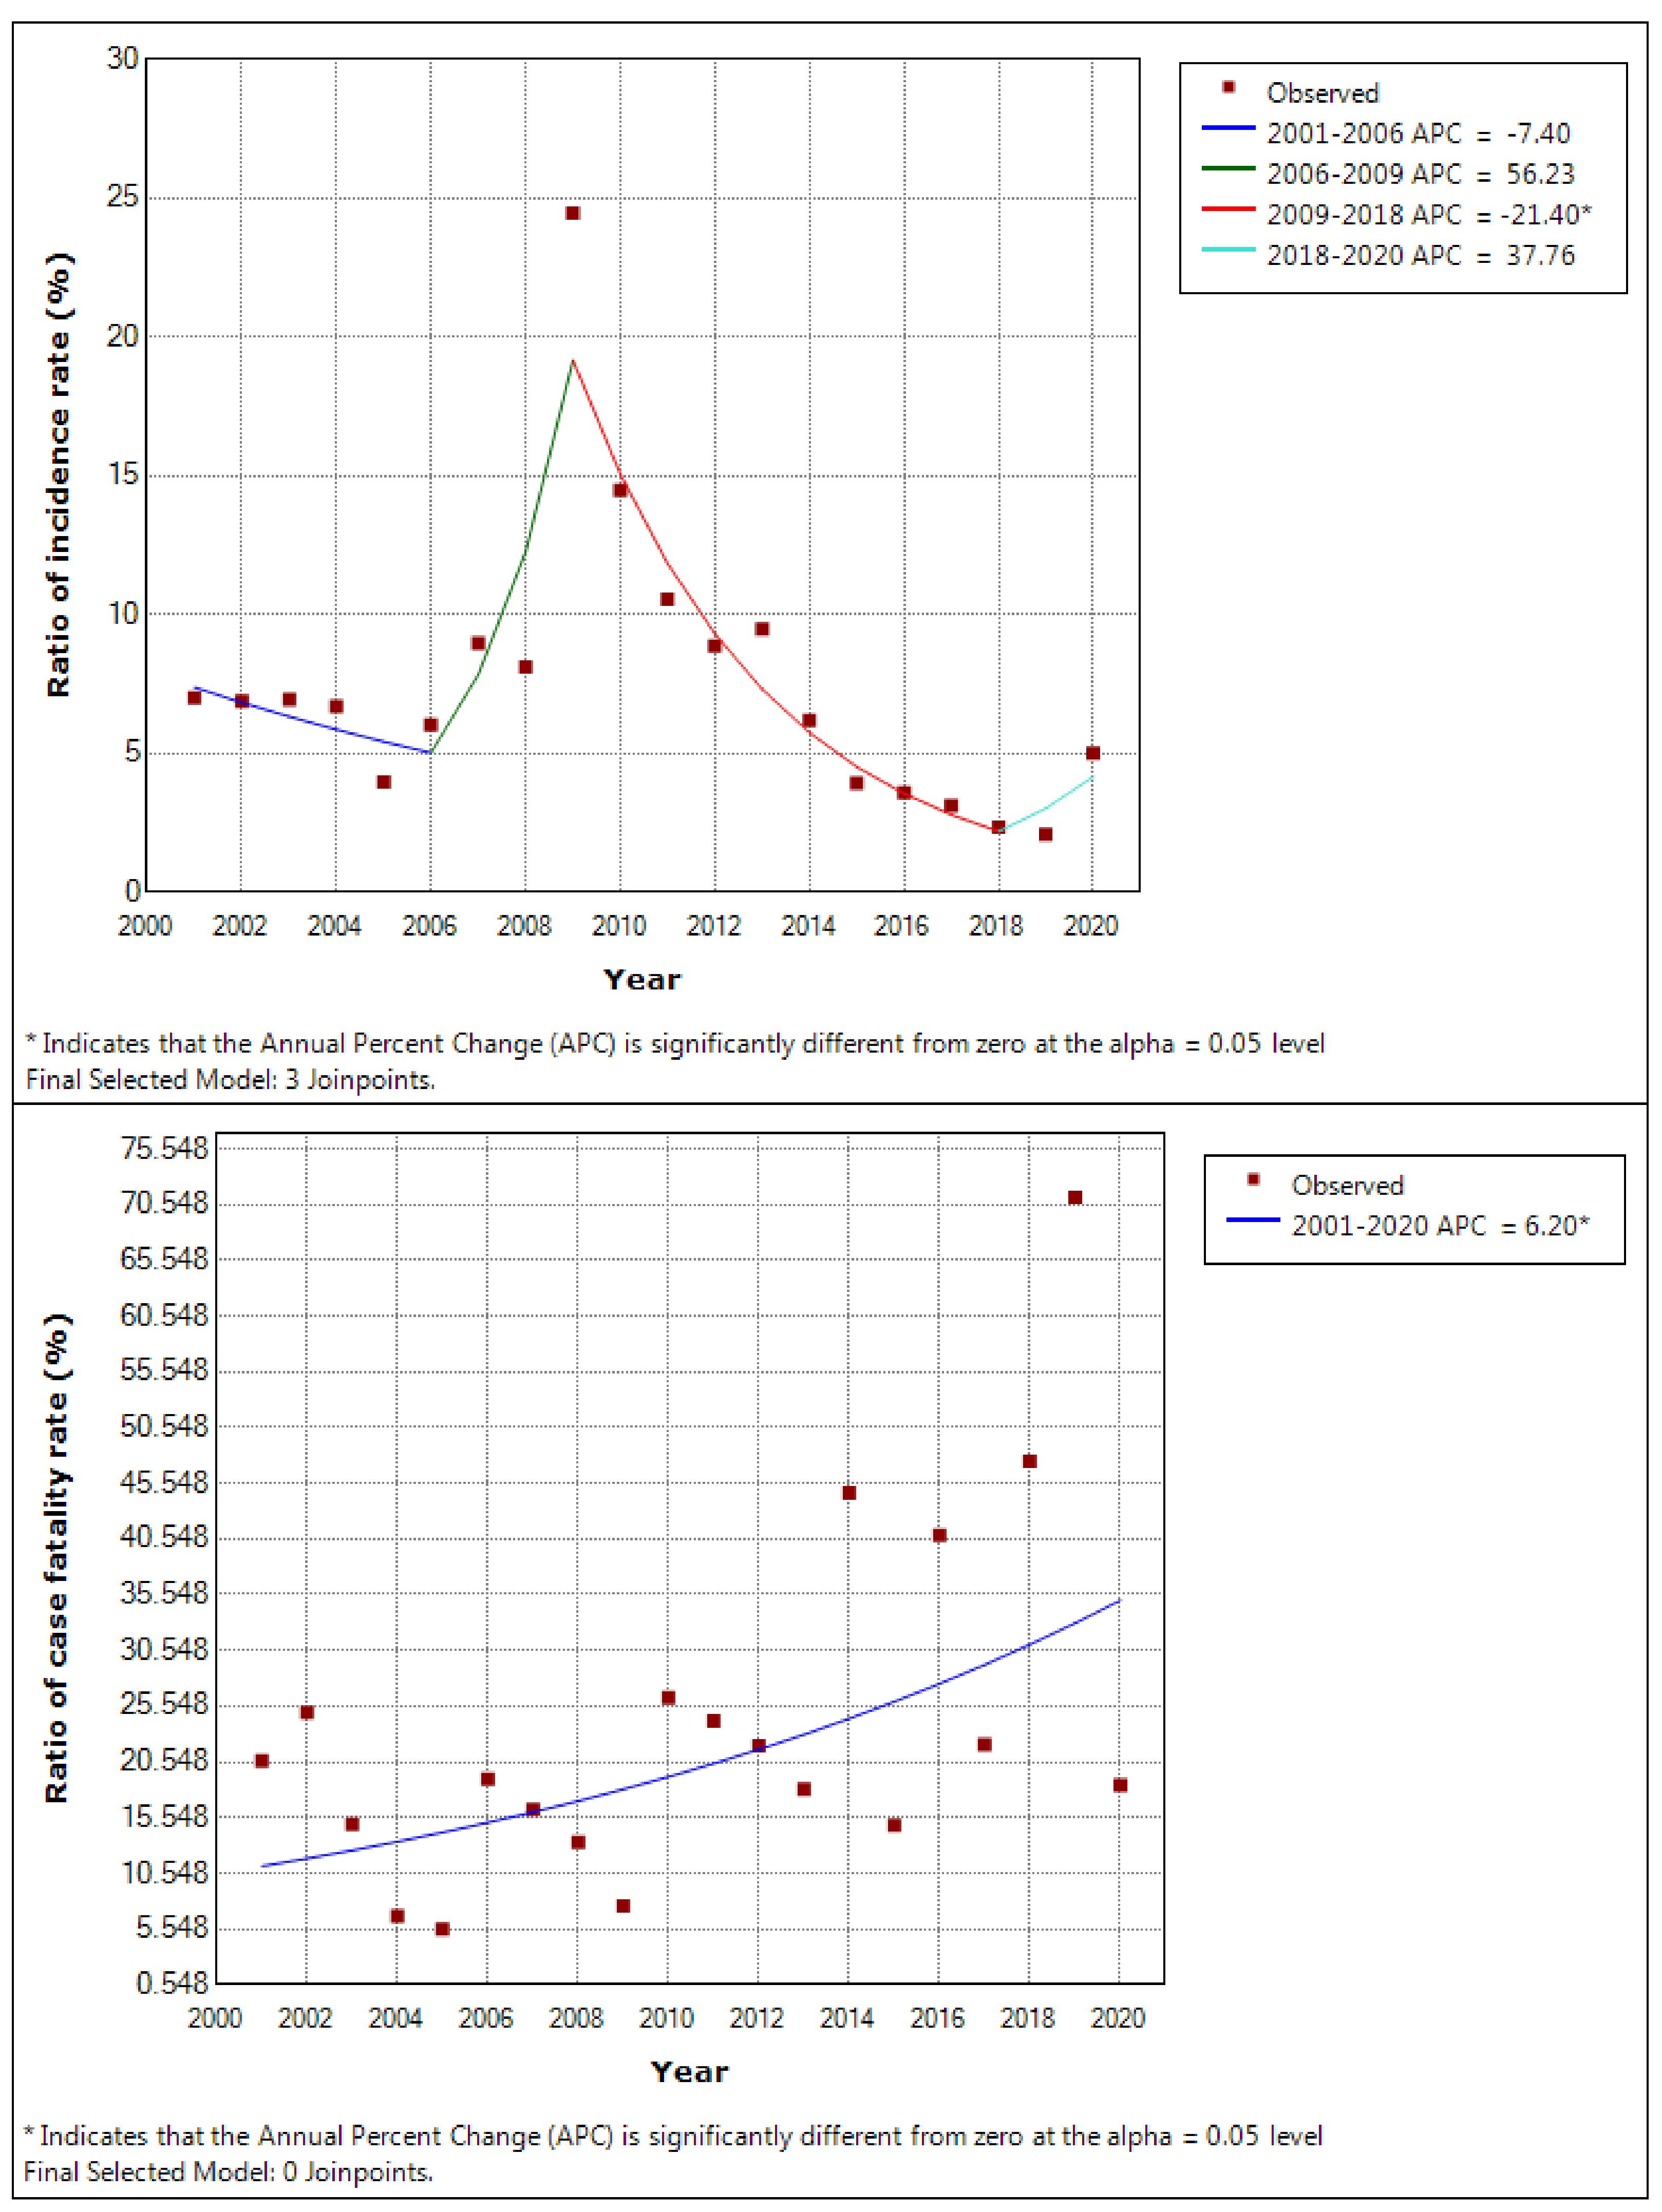
| 2001 | 1542 | 415 | 10,581,186 | 14.57 | 26.91 | 7.00 | 1.45 |
| 2002 | 1351 | 407 | 10,571,279 | 12.78 | 30.13 | 6.88 | 1.72 |
| 2003 | 1905 | 482 | 10,599,345 | 17.97 | 25.30 | 6.93 | 1.04 |
| 2004 | 2492 | 446 | 10,473,090 | 23.79 | 17.90 | 6.70 | 0.45 |
| 2005 | 2524 | 455 | 11,059,193 | 22.82 | 18.03 | 3.96 | 0.22 |
| 2006 | 2174 | 524 | 11,688,797 | 18.60 | 24.10 | 6.03 | 1.15 |
| 2007 | 2098 | 480 | 12,528,879 | 16.75 | 22.88 | 8.96 | 1.46 |
| 2008 | 1653 | 463 | 13,489,986 | 12.25 | 28.01 | 8.11 | 1.08 |
| 2009 | 1746 | 431 | 13,884,927 | 12.57 | 24.68 | 24.46 | 1.86 |
| 2010 | 1576 | 447 | 14,198,748 | 11.10 | 28.36 | 14.47 | 3.80 |
| 2011 | 1592 | 430 | 14,362,372 | 11.10 | 27.01 | 10.55 | 2.56 |
| 2012 | 1500 | 410 | 15,548,423 | 9.65 | 27.33 | 8.87 | 1.95 |
| 2013 | 1414 | 466 | 15,449,228 | 9.15 | 32.96 | 9.48 | 1.72 |
| 2014 | 1732 | 507 | 17,062,308 | 10.15 | 29.27 | 6.18 | 2.76 |
| 2015 | 1959 | 514 | 17,968,931 | 10.90 | 26.24 | 3.93 | 0.58 |
| 2016 | 2234 | 478 | 18,431,716 | 12.12 | 21.40 | 3.58 | 1.46 |
| 2017 | 3054 | 582 | 18,560,142 | 16.45 | 19.06 | 3.11 | 0.69 |
| 2018 | 3368 | 628 | 19,073,438 | 17.66 | 18.65 | 2.35 | 1.11 |
| 2019 | 4035 | 607 | 18,725,160 | 21.55 | 15.04 | 2.08 | 1.48 |
| 2020 | 4784 | 649 | 18,974,513 | 25.21 | 13.57 | 5.02 | 0.92 |
| Group | Character | Incidence Rate (per 100,000) | Case Fatality Rate (%) | ||||
|---|---|---|---|---|---|---|---|
| Min. | Max. | Mean | Min. | Max. | Mean | ||
| 1 | (Almost) Risk zero | 0 | 5.46 × 10⁻² | 1.82 × 10⁻³ | 0 | 0 | 0 |
| 2 | Low incidence/low fatality | 9.65 × 10⁻² | 6.10 × 10⁻¹ | 2.39 × 10⁻¹ | 0 | 0 | 0 |
| 3 | Low incidence/high fatality | 4.58 × 10⁻² | 5.06 × 10⁻¹ | 2.52 × 10⁻¹ | 5.00 | 100 | 40.28 |
| 4 | High incidence/low fatality | 1.07 | 23.57 | 6.49 | 0 | 3.92 | 1.61 |
| 5 | High incidence/high fatality | 6.56 × 10⁻¹ | 8.63 | 2.54 | 7.69 | 100 | 35.02 |
| Group | Industry Division (Code Identifier of Korean Statistical Information Service, Survey Period) | Incidence Rate (per 100,000) | Case Fatality Rate (%) |
|---|---|---|---|
| 1 | Mining of limestone, metals, non-metals and other mining (AAG, 2017–2020) | 0 | 0 |
| Mining of metals and non-metals (AAB, 2001–2016) | 0 | 0 | |
| Quarrying (AAC, 2001–2016) | 0 | 0 | |
| Mining of limestone (AAD, 2001–2016) | 0 | 0 | |
| Tobacco manufacturing (BAn, 2001–2017) | 0 | 0 | |
| Wood and paper products manufacturing (BAC000, 2019–2020) | 0 | 0 | |
| Pulp and paper manufacturing and bookbinding and printed matter processing industry (BAp, 2001–2017) | 0 | 0 | |
| Pulp and paper manufacturing industry (BAp0, 2018–2018) | 0 | 0 | |
| Publishing, printing, bookbinding and print processing industry (BAD0, 2018–2020) | 0 | 0 | |
| Printing (BAE, 2001–2011) | 0 | 0 | |
| Chemical and rubber product manufacturing (BAF0, 2019–2020) | 0 | 0 | |
| Pharmaceuticals, cosmetics, briquettes and petroleum products manufacturing (BAH00, 2020–2020) | 0 | 0 | |
| Coke and coal gas manufacturing industry (BAJ, 2001–2011) | 0 | 0 | |
| Glass, porcelain and cement manufacturing (BAq0, 2019–2019) | 0 | 0 | |
| Ceramics, other ceramic products and cement manufacturing (BAK0, 2018–2018) | 0 | 0 | |
| Cement manufacturing (BAM, 2001–2017) | 0 | 0 | |
| Electric machine equipment, electronic products, meters, optical machinery, and other precision equipment manufacturing (BAQ0, 2020–2020) | 5.46 × 10⁻² | 0 | |
| Coke, briquettes and petroleum refineries manufacturing (BAZ00, 2012–2019) | 0 | 0 | |
| Briquette and coagulated solid fuel manufacturing (BAX, 2001–2011) | 0 | 0 | |
| Electricity, gas and water business (CAA, 2001–2011) | 0 | 0 | |
| Electricity, gas, steam and water business (CAA00, 2012–2020) | 0 | 0 | |
| Automobile transport, courier and quick service business (EAN, 2017–2018) | 0 | 0 | |
| Air transportation business (EAH, 2001–2017) | 0 | 0 | |
| Warehouse and transportation related service business (EAI0, 2019–2019) | 0 | 0 | |
| Small cargo transport, courier and quick service business (EAM, 2001–2016) | 0 | 0 | |
| Fishery, aquaculture and fishery related services (GAC, 2017–2018) | 0 | 0 | |
| Fishing (GAD, 2019–2020) | 0 | 0 | |
| Fishing (GAA, 2001–2016) | 0 | 0 | |
| Consignment sales of agricultural and marine products (JAP, dummy code) | 0 | 0 | |
| United States Forces Korea (JAJ, 2001–2020) | 0 | 0 | |
| 2 | Textile or textile product manufacturing business (A) (BAo, 2001–2018) | 1.49 × 10⁻¹ | 0 |
| Textile or textile product manufacturing business (BAoo, 2019–2020) | 2.83 × 10⁻¹ | 0 | |
| Newspaper/money issuance, publishing business and printing business (BAD, 2001–2017) | 1.85 × 10⁻¹ | 0 | |
| Pharmaceuticals, cosmetics, fragrances and tobacco manufacturing (BAH0, 2018–2019) | 6.10 × 10⁻¹ | 0 | |
| Rubber product manufacturing (BAG, 2001–2018) | 9.65 × 10⁻² | 0 | |
| Glass manufacturing (BAq, 2001–2018) | 1.93 × 10⁻¹ | 0 | |
| Ceramics and other ceramic products manufacturing (BAK, 2001–2017) | 1.36 × 10⁻¹ | 0 | |
| Machine tools, non-metallic mineral products, metal products manufacturing and metal processing (BAr0, 2018–2018) | 1.06 × 10⁻¹ | 0 | |
| Machine tools, non-metallic minerals and metal products manufacturing (BAr00, 2019–2019) | 2.05 × 10⁻¹ | 0 | |
| Machine tools, metal and non-metallic minerals products manufacturing (BAr000, 2020–2020) | 4.64 × 10⁻¹ | 0 | |
| Plating (BAO, 2001–2018) | 1.34 × 10⁻¹ | 0 | |
| Electric machine equipment, precision equipment, and electronic products manufacturing (BAQ00, 2020–2020) | 1.09 × 10⁻¹ | 0 | |
| Transportation machinery and equipment manufacturing, automobile and motorcycle repairing (BAT0, 2018–2018) | 2.02 × 10⁻¹ | 0 | |
| Handicraft manufacturing (BAV, 2001–2018) | 3.57 × 10⁻¹ | 0 | |
| Handicraft and other products manufacturing (BAV0, 2019–2020) | 3.66 × 10⁻¹ | 0 | |
| Automobile and motorcycle repairing (BAZ, 2001–2017) | 1.42 × 10⁻¹ | 0 | |
| Railroad, track and ropeway transportation business (EAA, 2001–2017) | 2.37 × 10⁻¹ | 0 | |
| Railroad, track, ropeway and air transportation business (EAA0, 2018–2019) | 4.13 × 10⁻¹ | 0 | |
| Land and water transport business (EAN0, 2019–2020) | 1.40 × 10⁻¹ | 0 | |
| Water transport, port unloading and cargo handling business (EAF, 2001–2018) | 1.63 × 10⁻¹ | 0 | |
| Warehousing business (EAJ, 2001–2018) | 1.78 × 10⁻¹ | 0 | |
| Education service business (JAG. 2001–2019) | 3.94 × 10⁻¹ | 0 | |
| 3 | Wood products manufacturing (BAC00, 2012–2018) | 2.47 × 10⁻¹ | 100.00 |
| Chemical manufacturing (BAF, 2001–2018) | 2.81 × 10⁻¹ | 25.00 | |
| Pharmaceutical and cosmetic fragrance manufacturing (BAH, 2001–2017) | 2.39 × 10⁻¹ | 100.00 | |
| Non-metallic mineral products and metal products manufacturing and metal processing industry (BAr, 2001–2017) | 4.43 × 10⁻¹ | 22.22 | |
| Metal smelting (BAL, 2001–2020) | 1.45 × 10⁻¹ | 100.00 | |
| Metal material manufacturing (BAN, 2001–2016) | 2.10 × 10⁻¹ | 50.00 | |
| Machine tool manufacturing (BAP, 2001–2017) | 2.94 × 10⁻¹ | 5.00 | |
| Electrical machinery manufacturing (BAQ, 2001–2017) | 1.72 × 10⁻¹ | 20.00 | |
| Electronics manufacturing (BAR, 2001–2017) | 4.58 × 10⁻² | 75.00 | |
| Shipbuilding and repairing (BAS, 2001–2020) | 2.20 × 10⁻¹ | 57.14 | |
| Transportation machinery and equipment manufacturing (BAT, 2001–2017) | 3.54 × 10⁻¹ | 9.52 | |
| Textile or textile product manufacturing (B) (BAY, 2001–2018) | 1.51 × 10⁻¹ | 33.33 | |
| Other manufacturing (BAs, 2001–2018) | 1.53 × 10⁻¹ | 66.67 | |
| Construction industry (DAB, 2001–2020) | 3.23 × 10⁻¹ | 7.18 | |
| Passenger car transport business (EAB, 2001–2016) | 1.76 × 10⁻¹ | 25.00 | |
| Freight car transportation business (EAC, 2001–2016) | 3.17 × 10⁻¹ | 100.00 | |
| Transportation-related service business (EAI, 2001–2018) | 3.75 × 10⁻¹ | 25.00 | |
| Telecommunications business (EAK, 2001–2020) | 4.97 × 10⁻¹ | 25.00 | |
| Finance and insurance (KAA, 2001–2020) | 9.52 × 10⁻² | 27.27 | |
| Professional technical service business (JAE, 2001–2019) | 1.74 × 10⁻¹ | 15.79 | |
| Wholesale, retail and consumer goods repairing business (JAH, 2001-2019) | 1.47 × 10⁻¹ | 20.51 | |
| Wholesale, retail, food and lodging business (JAH0, 2020–2020) | 4.54 × 10⁻¹ | 6.67 | |
| Real estate business and rental business (JAI, 2001–2020) | 1.16 × 10⁻¹ | 50.00 | |
| Business service (CAA03, 2018–2019) | 1.55 × 10⁻¹ | 33.33 | |
| Various other business (JAD, 2001–2020) | 5.06 × 10⁻¹ | 7.34 | |
| 4 | Wood product manufacturing (BAC, 2001–2011) | 3.42 | 0 |
| Railroad, air transportation, warehousing and transportation-related service business (EAA00, 2020–2020) | 2.90 | 0 | |
| Forestry (FAA, 2001–2020) | 23.57 | 2.06 | |
| Aquaculture and fishery related services (GAB, 2001–2016) | 1.80 | 0 | |
| Agriculture (HAA, 2001–2020) | 10.81 | 1.83 | |
| Comprehensive management of buildings, etc. business (JAA, 2001–2018) | 1.07 | 3.74 | |
| Facility management business and business service (JAA00, 2020–2020) | 1.57 | 0 | |
| Sanitation and similar service business (JAB, 2001–2018) | 13.90 | 3.24 | |
| Professional technical, health, education, recreation service business (JAE0, 2020–2020) | 3.38 | 1.63 | |
| Health and social welfare business (JAF, 2001–2019) | 4.64 | 1.23 | |
| Business of the state and local governments (CAA02, 2012–2020) | 4.36 | 3.92 | |
| 5 | Coal mining and quarrying (AAF, 2017–2020) | 8.63 | 100.00 |
| Coal mining (AAA, 2001–2016) | 1.29 | 100.00 | |
| Other mining (AAE, 2001–2016) | 3.78 | 25.00 | |
| Food manufacturing (BAA, 2001–2020) | 6.97 × 10⁻¹ | 12.50 | |
| Sawmill and veneer manufacturing (BAB, 2001–2011) | 4.32 | 25.00 | |
| Measuring instruments, optical instruments, and other precision instruments manufacturing (BAU, 2001–2017) | 6.70 × 10⁻¹ | 22.22 | |
| Comprehensive building management, sanitation and similar service business (JAA0, 2019–2019) | 8.39 × 10⁻¹ | 12.50 | |
| Golf course and racetrack operation business (JAC, 2001–2011) | 2.27 | 16.67 | |
| Overseas dispatcher (JAL, 2001–2020) | 2.26 | 28.57 | |
| Entertainment, culture and sports related business (CAA01, 2012–2019) | 6.56 × 10⁻¹ | 7.69 |
Publisher’s Note: MDPI stays neutral with regard to jurisdictional claims in published maps and institutional affiliations. |
© 2022 by the authors. Licensee MDPI, Basel, Switzerland. This article is an open access article distributed under the terms and conditions of the Creative Commons Attribution (CC BY) license (https://creativecommons.org/licenses/by/4.0/).
Share and Cite
Shin, S.; Yoon, W.S.; Byeon, S.-H. Trends in Occupational Infectious Diseases in South Korea and Classification of Industries According to the Risk of Biological Hazards Using K-Means Clustering. Int. J. Environ. Res. Public Health 2022, 19, 11922. https://doi.org/10.3390/ijerph191911922
Shin S, Yoon WS, Byeon S-H. Trends in Occupational Infectious Diseases in South Korea and Classification of Industries According to the Risk of Biological Hazards Using K-Means Clustering. International Journal of Environmental Research and Public Health. 2022; 19(19):11922. https://doi.org/10.3390/ijerph191911922
Chicago/Turabian StyleShin, Saemi, Won Suck Yoon, and Sang-Hoon Byeon. 2022. "Trends in Occupational Infectious Diseases in South Korea and Classification of Industries According to the Risk of Biological Hazards Using K-Means Clustering" International Journal of Environmental Research and Public Health 19, no. 19: 11922. https://doi.org/10.3390/ijerph191911922
APA StyleShin, S., Yoon, W. S., & Byeon, S.-H. (2022). Trends in Occupational Infectious Diseases in South Korea and Classification of Industries According to the Risk of Biological Hazards Using K-Means Clustering. International Journal of Environmental Research and Public Health, 19(19), 11922. https://doi.org/10.3390/ijerph191911922