
Estimation of Shipping Emissions in Developing Country: A Case Study of Mohammad Bin Qasim Port, Pakistan

 , and
, and
Abstract
:1. Introduction
2. Literature Review
3. Materials and Methods
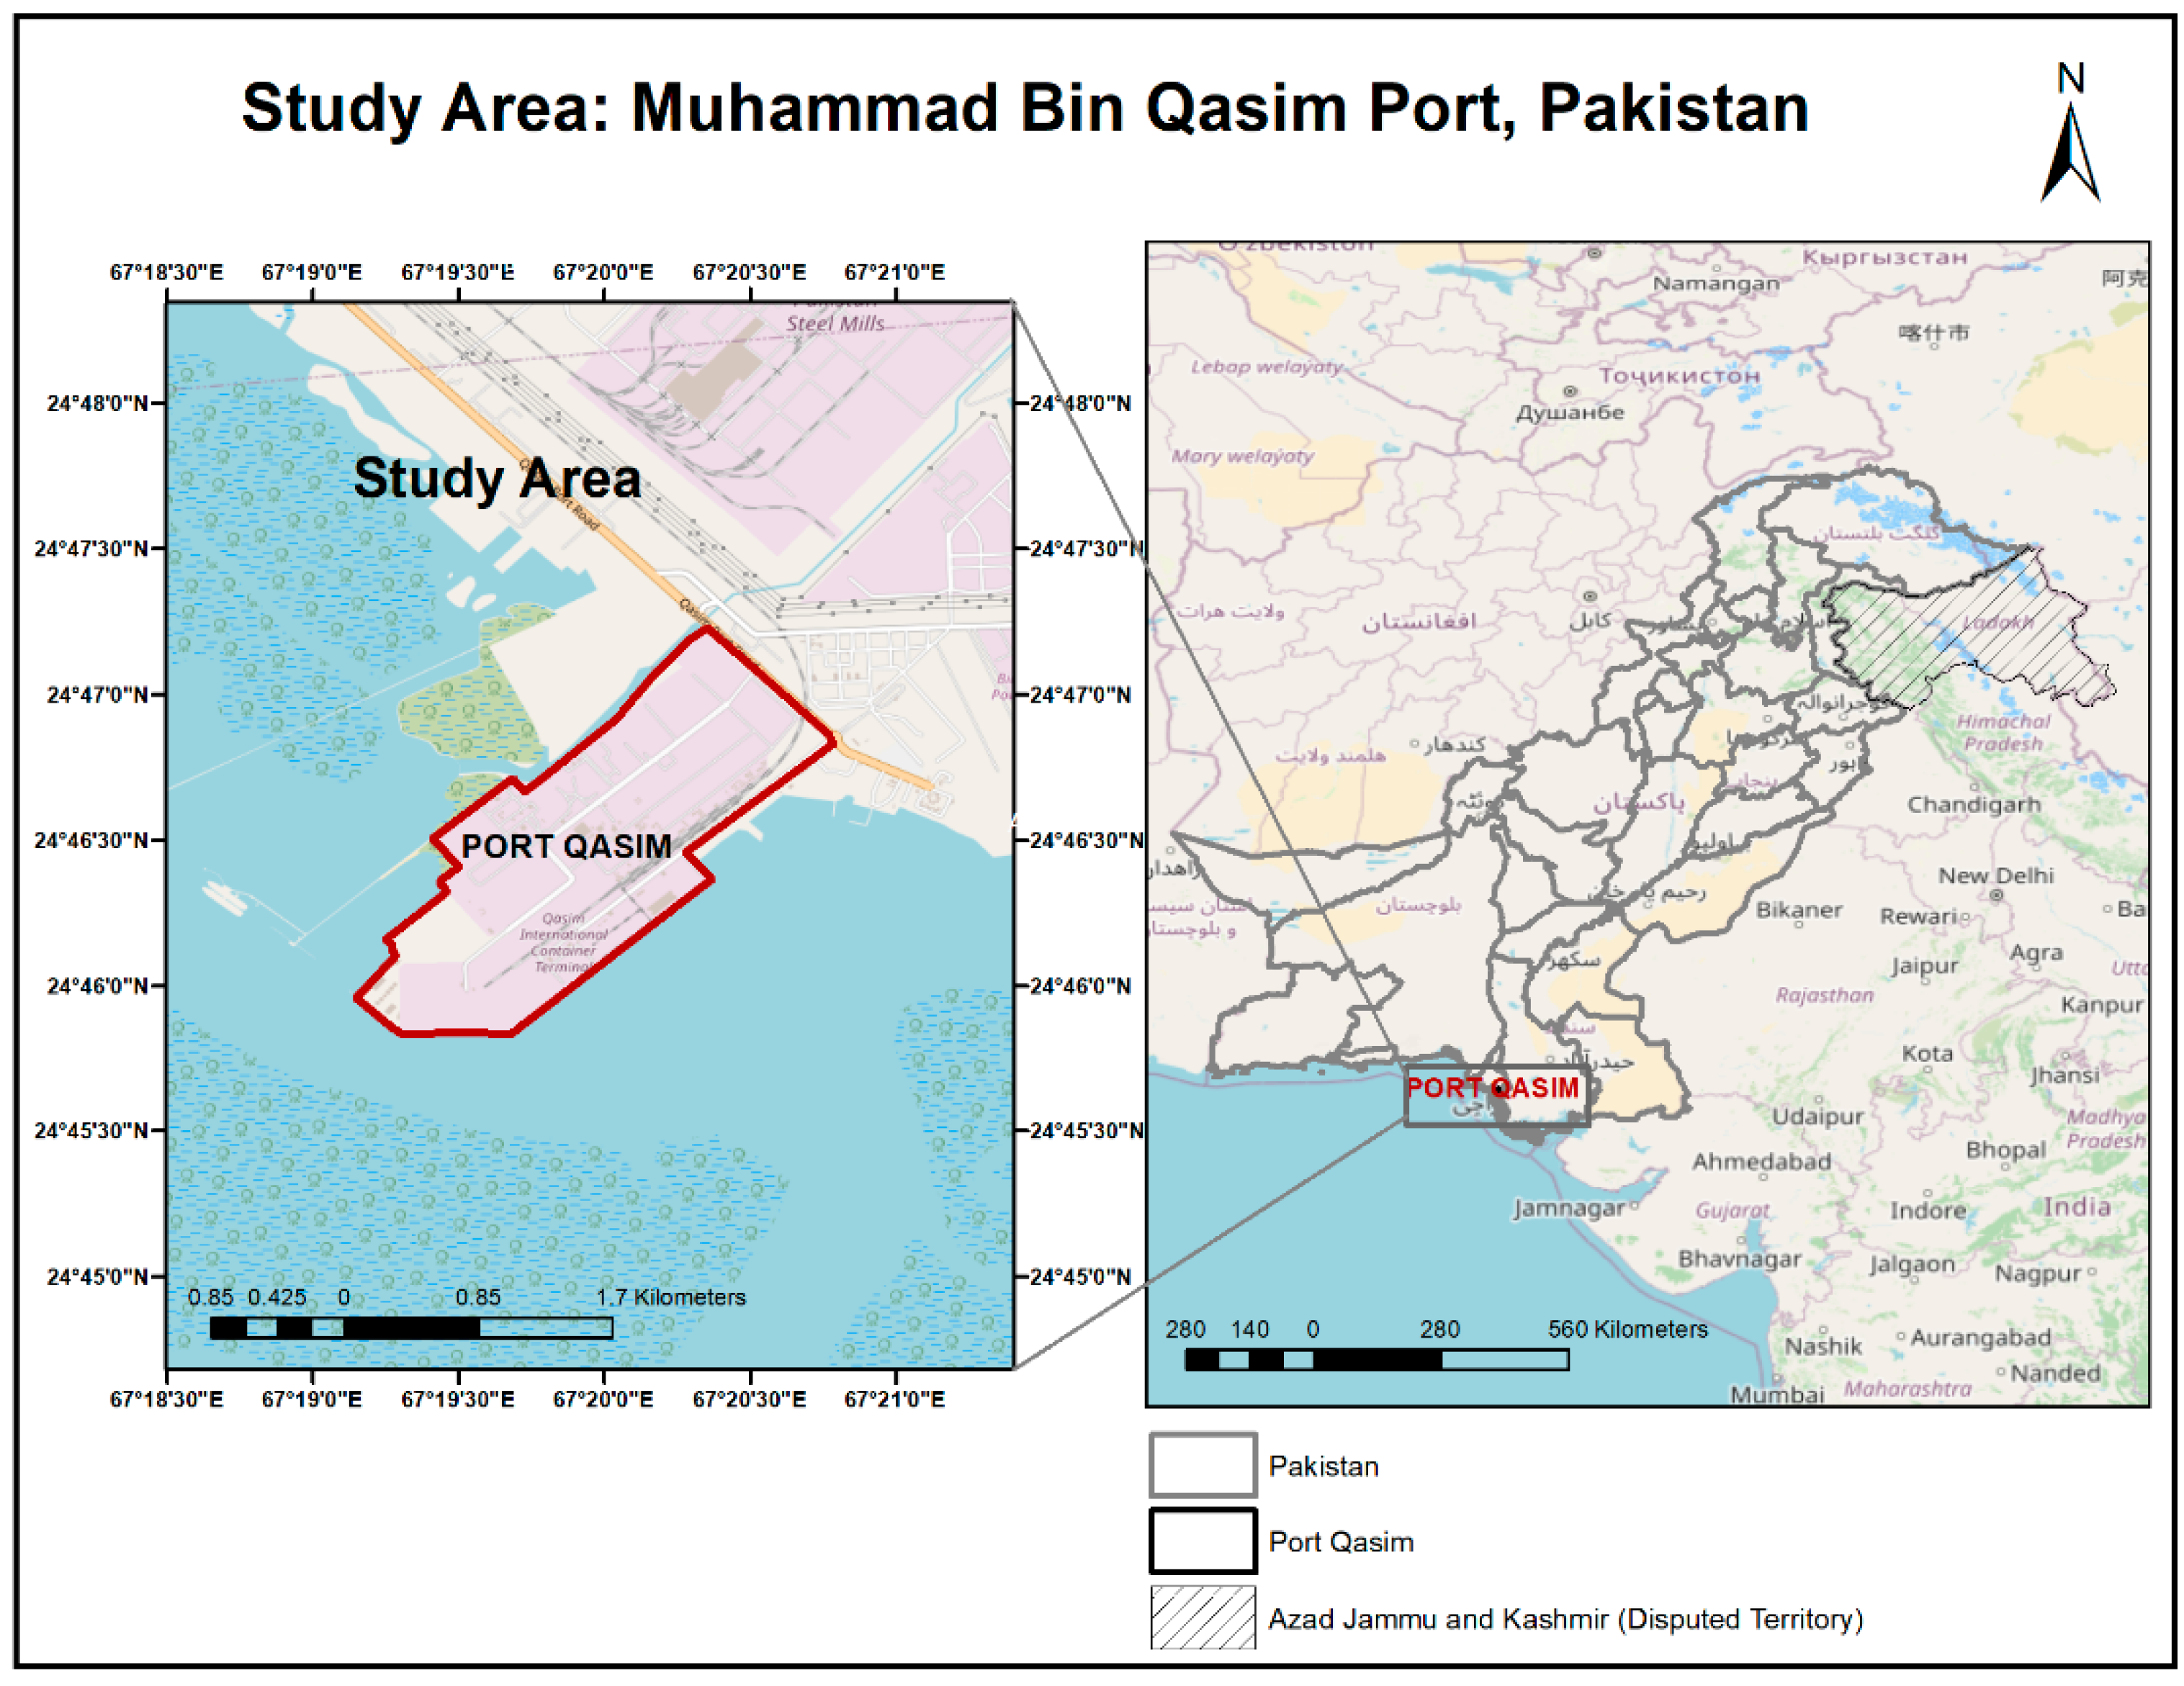
3.1. Study Area
3.2. Data Collection
3.3. Research Methodology
3.3.1. Emission Inventory Methodology
- —
- E = emissions;
- —
- EF = emission factor (g/kWh);
- —
- LF = engine load factor (%);
- —
- P = engine power (kW);
- —
- T = time spent (h);
- —
- e = engine category (main, auxiliary);
- —
- i = pollutant;
- —
- j = engine type (slow-, medium-, high-speed diesel);
- —
- f = fuel type (BFO, MDO); and
- —
- p = operation mode of trip (port, maneuvering, anchorage).
- (a)
- Emissions at hoteling stage
- —
- Thott = the time spend by vessels at the berthing stage (h);
- —
- ME = the maximum main engine power (kW);
- —
- LFME = the load factor of the main engine (%);
- —
- AE = the auxiliary engine power (kW);
- —
- LFAE = the load factor of auxiliary engine (%);
- —
- B is the auxiliary boiler energy default; and
- —
- EF = emission factors associated with each engine type in hoteling mode (g/kWh);
- (b)
- Emissions at maneuvering stage
- —
- Tman = the time spend by vessels at maneuvering stage (h);
- —
- ME = the maximum main engine power (kW);
- —
- LFME = the load factor of the main engine (%);
- —
- AE = the auxiliary engine power (kW);
- —
- LFAE = the load factor of auxiliary engine (%);
- —
- B is the auxiliary boiler energy default; and
- —
- EFME, EFAE, and EFB are emission factors associated with each engine type in maneuvering mode(g/kWh).
- (c)
- Emissions at reduced speed zone
- —
- TRSZ = the time spend by vessels at the reduced speed zone stage (h);
- —
- ME = the maximum main engine power (kW);
- —
- LFME = the load factor of the main engine (%);
- —
- AE = the auxiliary engine power (kW);
- —
- LFAE = the load factor of auxiliary engine; and
- —
- EFAE are emission factors associated with each engine type in the RSZ mode.
- (d)
- Emission social cost
- —
- Social Cost = total calculated monetary value in dollar ($);
- —
- Emission = emission totals per pollutant type (a);
- —
- SCF = value of pollutant ($/ton); and
- —
- i = pollutant type.
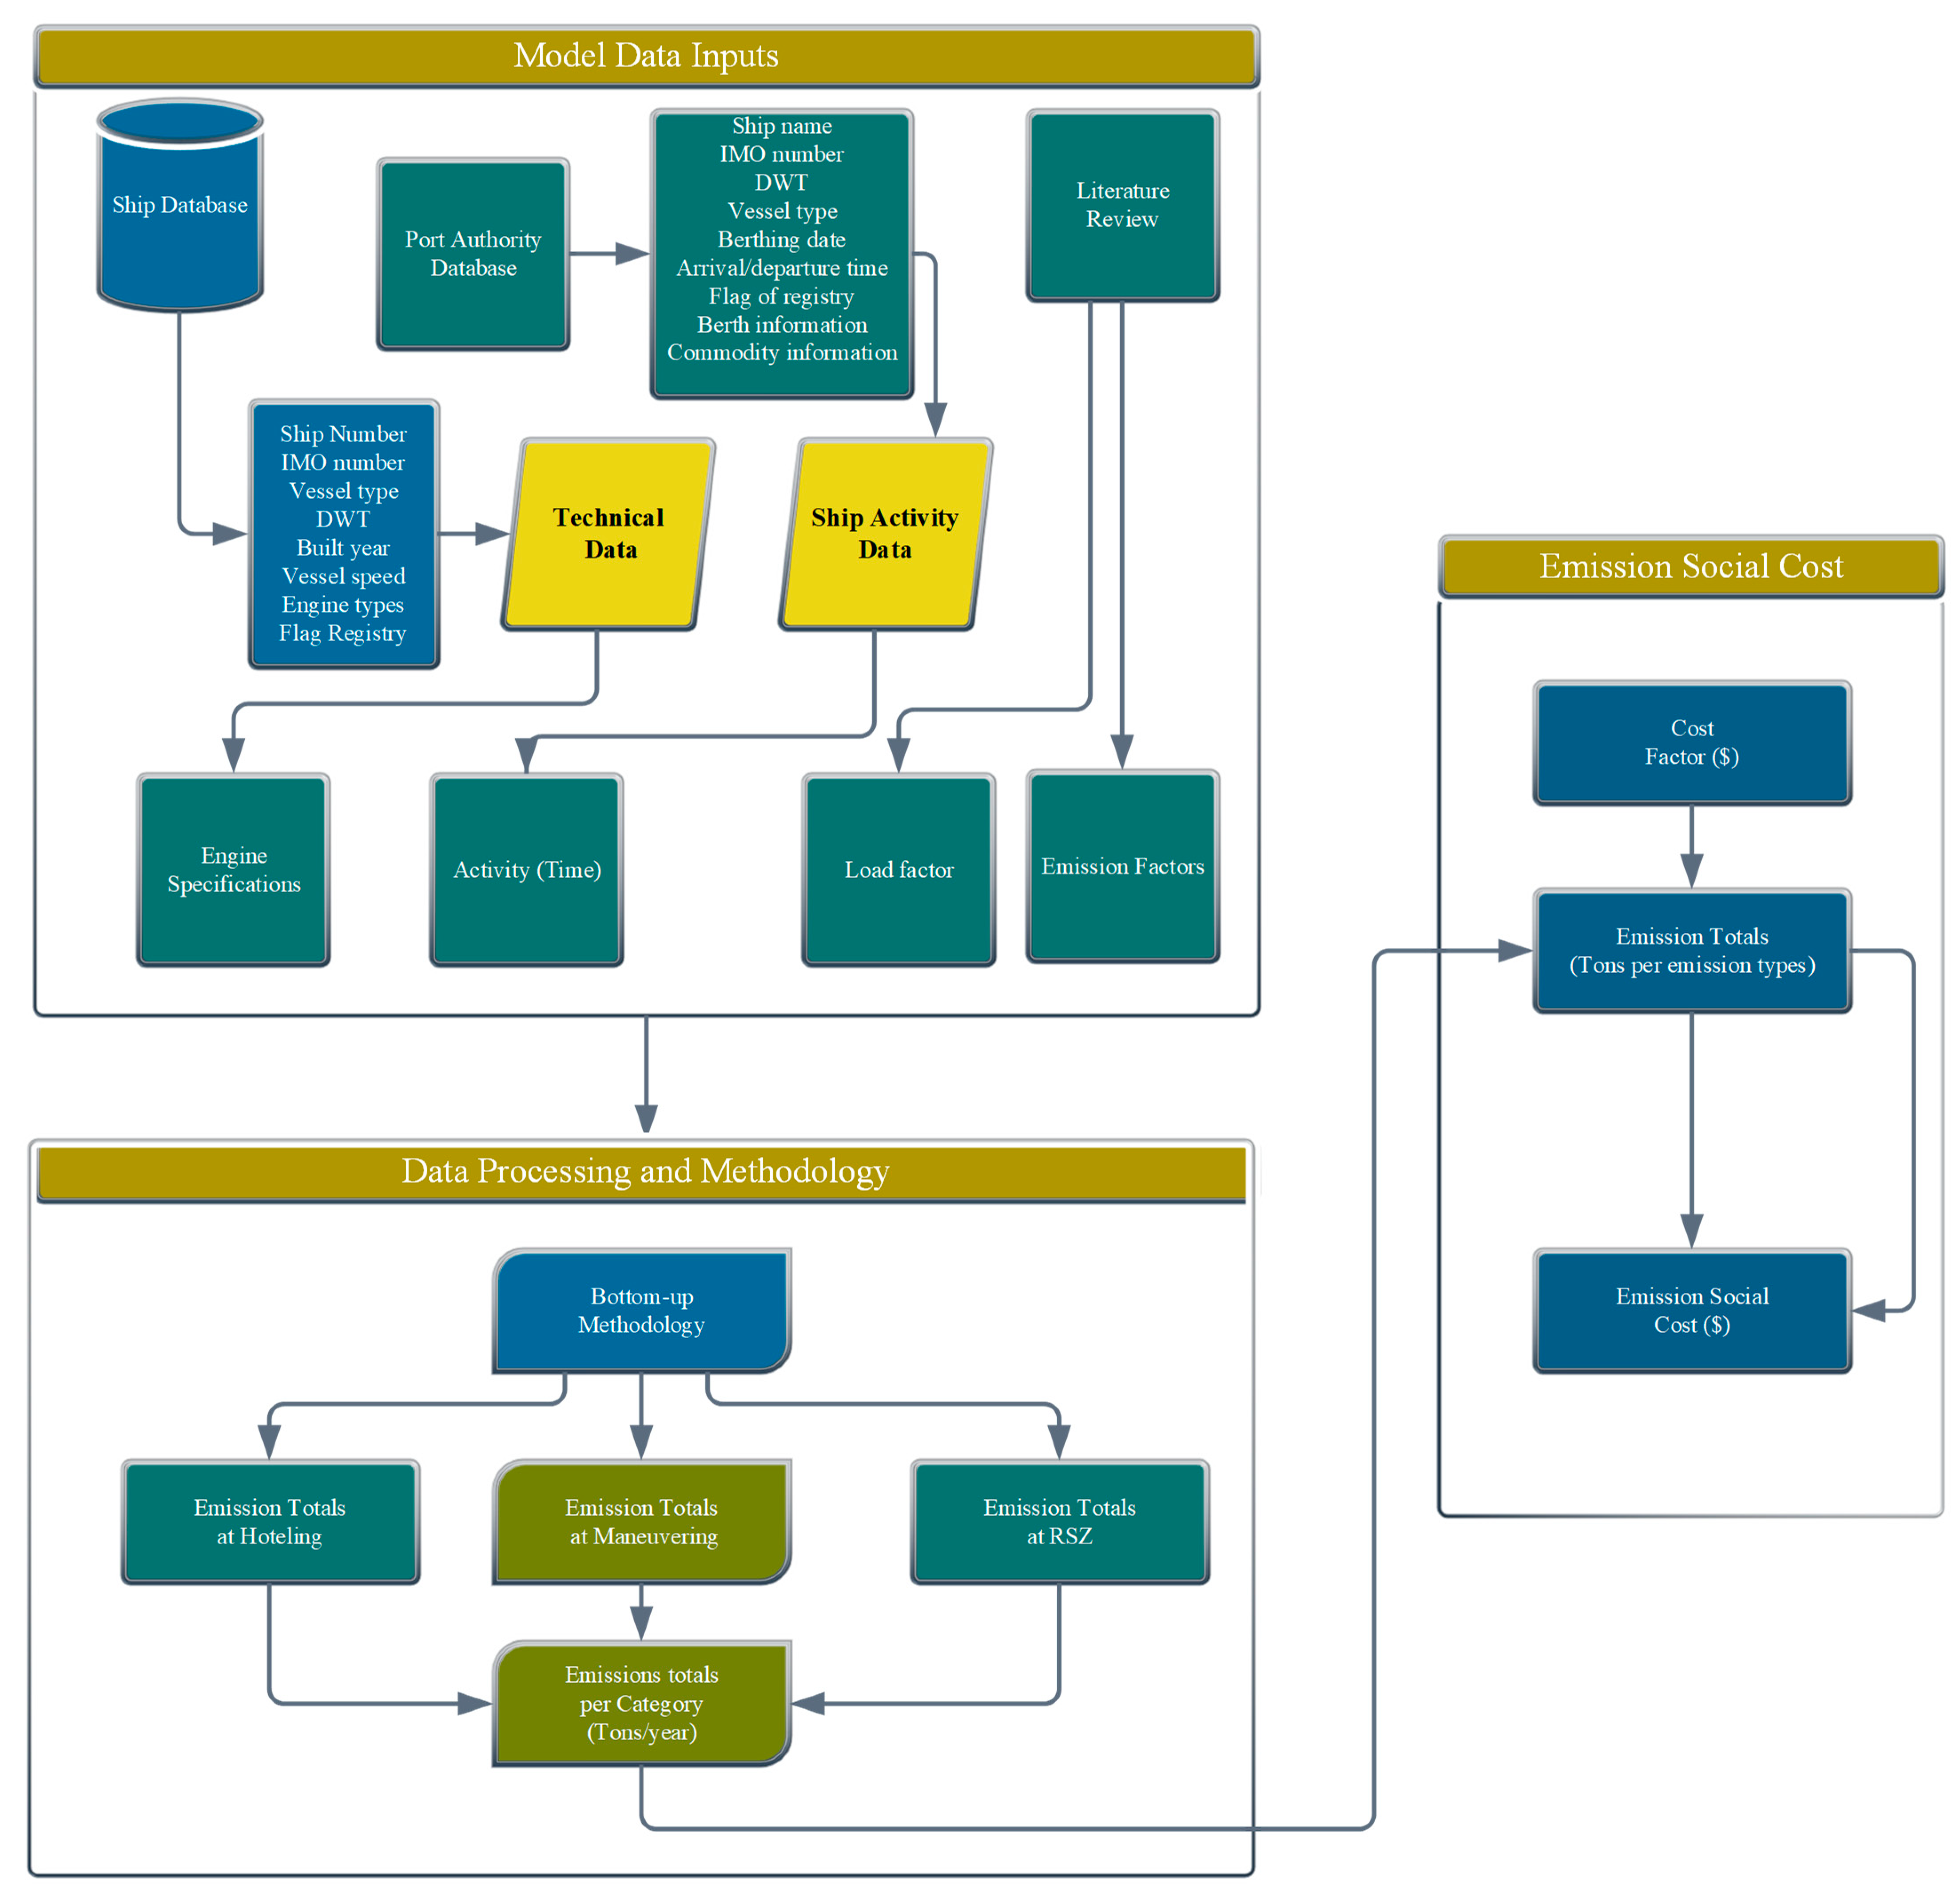
3.3.2. Research Framework
3.3.3. Engine Powers and Load Factors
4. Results and Discussion
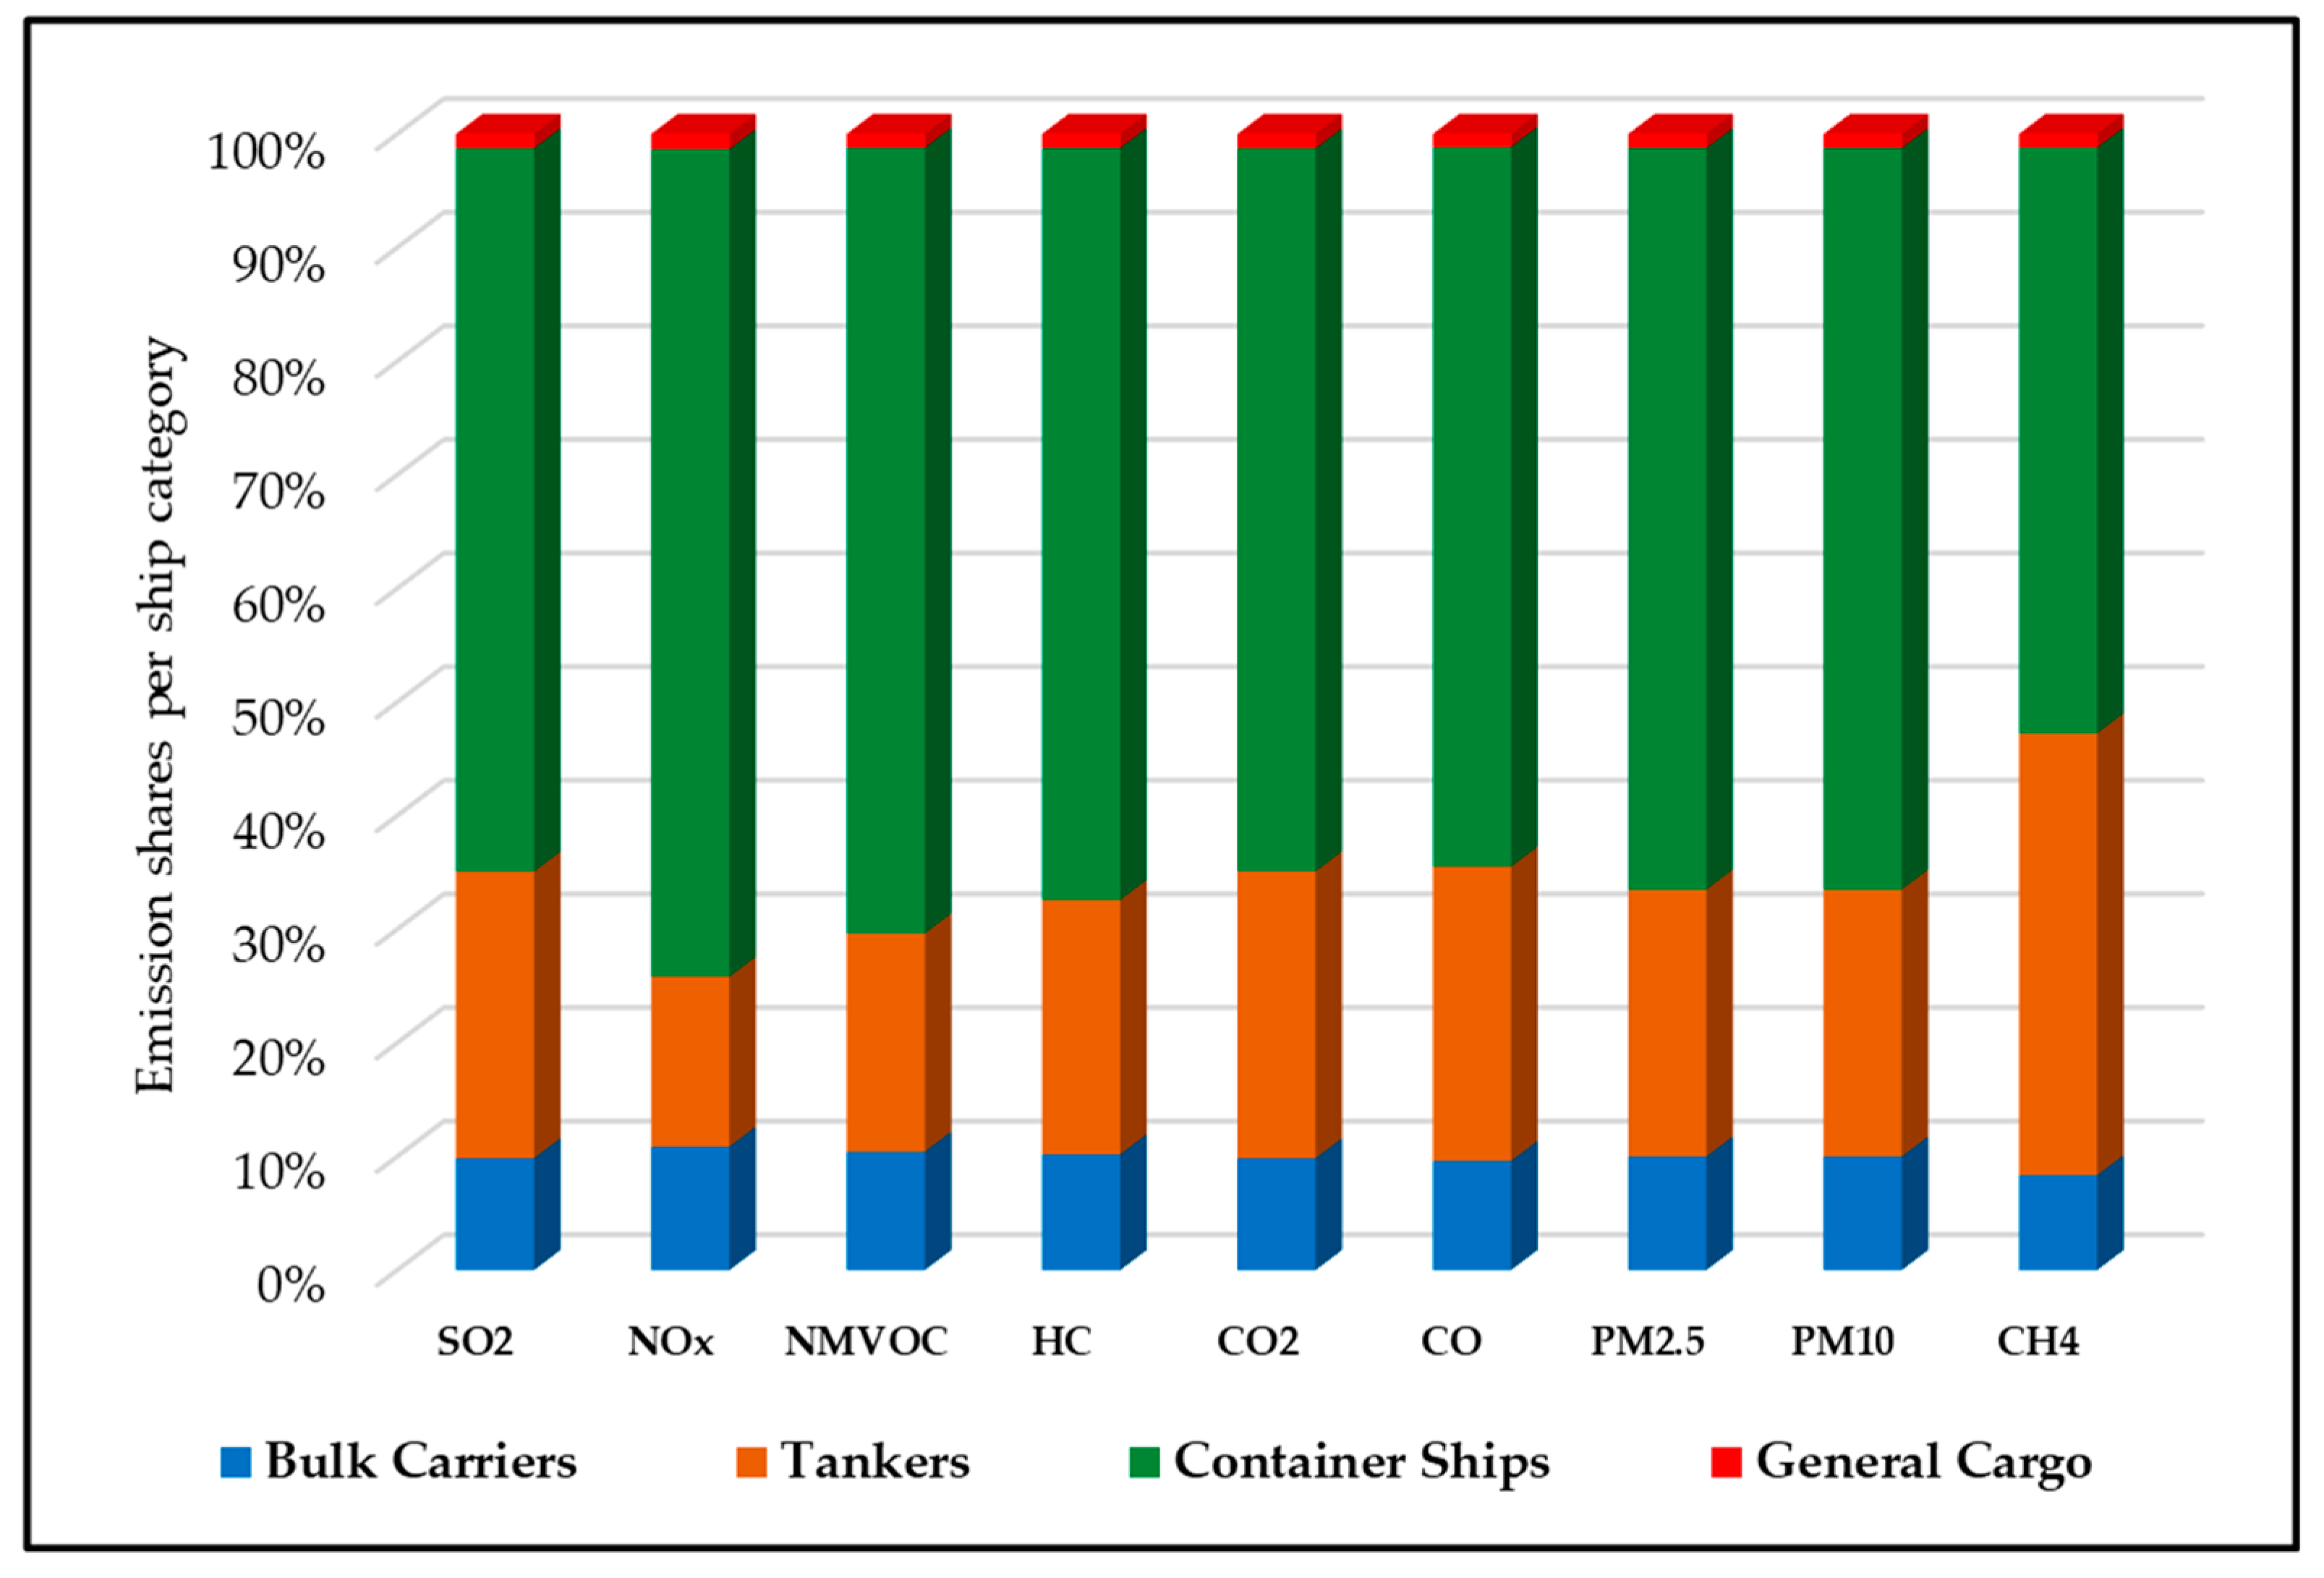
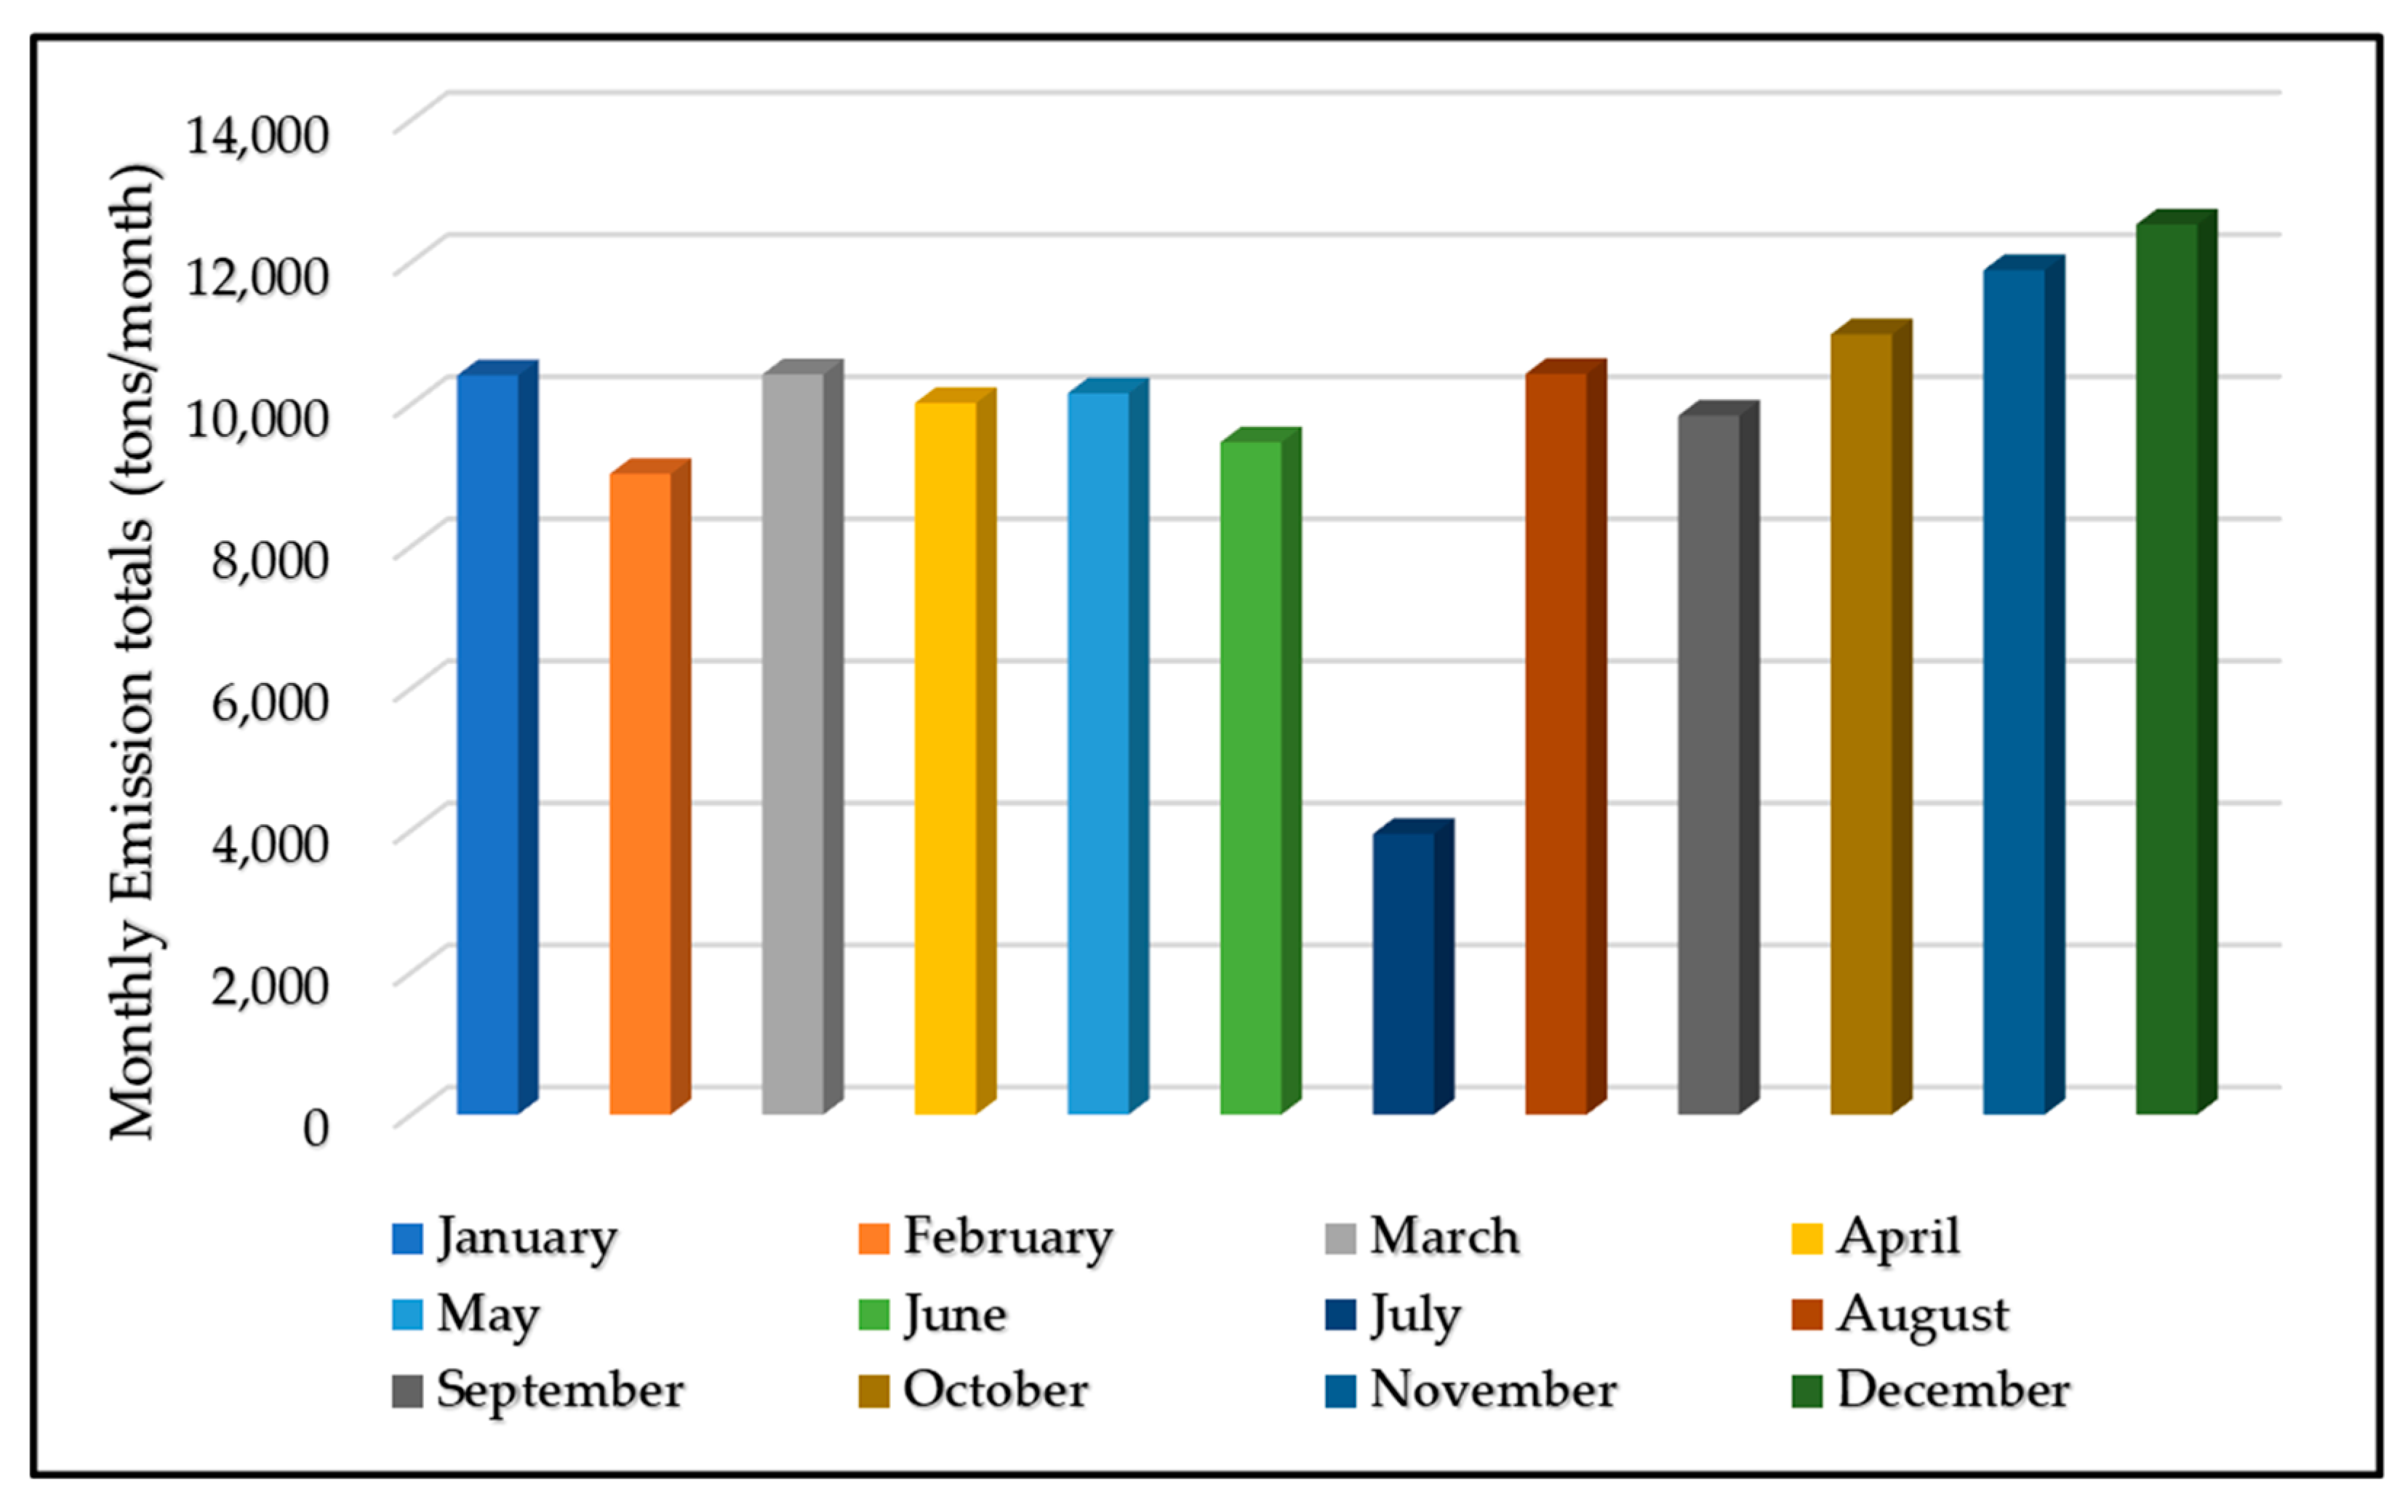
4.1. Emissions at Three Different Operational Stages
4.2. Ship Emissions Studies Comparison with Other Ports
4.3. Emission Social Cost
5. Conclusions
Author Contributions
Funding
Institutional Review Board Statement
Informed Consent Statement
Data Availability Statement
Acknowledgments
Conflicts of Interest
Appendix A

| Ship Type | IMO No. | MMSI | Manufacturing Data | ME (kW) | AE (kW) | DWT | GT |
|---|---|---|---|---|---|---|---|
| Bulk Carrier | 97,321 ** | 5,656,550 ** | 2014 | 8100 | 1552 | 57,945 | 32,750 |
| Bulk Carrier | 93,952 ** | 5,380,069 ** | 2009 | 8425 | 2527 | 53,428 | 31,094 |
| Bulk Carrier | 97,232 ** | 3,719,650 ** | 2019 | 9150 | 2745 | 63,539 | 36,353 |
| Bulk Carrier | 93,002 ** | 5,642,200 ** | 2005 | 8200 | 1552 | 55,862 | 30,822 |
| Bulk Carrier | 97,089 ** | 5,489,120 ** | 2015 | 8200 | 1560 | 57,811 | 32,399 |
| Bulk Carrier | 92,384 ** | 5,647,240 ** | 2002 | 7800 | 1340 | 52,383 | 30,303 |
| Bulk Carrier | 98,527 ** | 6,360,186 ** | 2019 | 8686 | 2605 | 63,555 | 35,832 |
| Emission | Range (US$/ton) | Value Used in This Study (US$/ton) |
|---|---|---|
| CO2 | 15–42 | 29 |
| CH4 | 250–2500 | 812 |
| CO | 160–3200 | 1146 |
| PM10 | 2000–498,791 | 76,867 |
| PM2.5 | 1000–554,229 | 85,771 |
| NOx | 269–58,300 | 10,687 |
| SOx, SO2 | 379–64,997 | 12,329 |
| HC | 750–3824 | 2985 |
| Engine | Phase | Engine Type | Fuel Type | Sulphur % | SO2 | NOx | NMVOC | HC | CO2 | CO | PM2.5 | PM10 | CH4 |
|---|---|---|---|---|---|---|---|---|---|---|---|---|---|
| Main | RSZ | SSD | RO | 2.70% | 10.5 | 16.9 | 0.6 | 0.6 | 620 | 0.5 | 1.31 | 1.42 | 0.006 |
| SSD | MDO | 1.00% | 3.7 | 15.8 | 0.6 | 0.6 | 588 | 0.5 | 0.45 | 0.42 | 0.006 | ||
| SSD | MGO | 0.50% | 0.9 | 15.8 | 0.6 | 0.6 | 588 | 0.5 | 0.31 | 0.28 | 0.006 | ||
| MSD | RO | 2.70% | 11.5 | 13.0 | 0.5 | 0.5 | 677 | 1.1 | 1.43 | 1.32 | 0.004 | ||
| MSD | MDO | 1.00% | 4.1 | 12.3 | 0.5 | 0.5 | 645 | 1.1 | 0.47 | 0.43 | 0.004 | ||
| MSD | MGO | 0.50% | 1.0 | 12.3 | 0.5 | 0.5 | 645 | 1.1 | 0.31 | 0.29 | 0.004 | ||
| HSD | RO | 2.70% | 11.5 | 11.8 | 0.2 | 0.2 | 677 | 1.1 | 1.47 | 1.35 | 0.004 | ||
| HSD | MDO | 1.00% | 4.1 | 11.2 | 0.2 | 0.2 | 645 | 1.1 | 0.58 | 0.53 | 0.004 | ||
| HSD | MGO | 0.50% | 1.0 | 11.2 | 0.2 | 0.2 | 645 | 1.1 | 0.35 | 0.32 | 0.004 | ||
| Maneuvering Hoteling | SSD | RO | 2.70% | 11.6 | 4.7 | 2.5 | 1.8 | 682 | 1.0 | 1.32 | 1.43 | 0.012 | |
| SSD | MDO | 1.00% | 4.1 | 4.7 | 2.6 | 1.8 | 647 | 1.0 | 0.44 | 0.47 | 0.012 | ||
| SSD | MGO | 0.50% | 1.0 | 4.7 | 2.6 | 1.8 | 647 | 1.0 | 0.29 | 0.31 | 0.012 | ||
| MSD | RO | 2.70% | 12.7 | 44.6 | 6.3 | 1.5 | 745 | 2.2 | 1.32 | 1.44 | 0.008 | ||
| MSD | MDO | 1.00% | 4.5 | 44.3 | 6.6 | 1.5 | 710 | 2.2 | 0.46 | 0.50 | 0.008 | ||
| MSD | MGO | 0.50% | 1.1 | 44.3 | 6.6 | 1.5 | 710 | 2.2 | 0.30 | 0.32 | 0.008 | ||
| HSD | RO | 2.70% | 12.7 | 40.6 | 8.2 | 0.6 | 745 | 2.2 | 1.32 | 1.44 | 0.008 | ||
| HSD | MDO | 1.00% | 4.5 | 40.1 | 8.6 | 0.6 | 710 | 2.2 | 0.46 | 0.50 | 0.008 | ||
| HSD | MGO | 0.50% | 1.1 | 40.1 | 8.6 | 0.6 | 710 | 2.2 | 0.30 | 0.32 | 0.008 | ||
| Auxiliary | Maneuvering Hoteling | MSD | RO | 2.70% | 12.3 | 60.4 | 1.7 | 0.4 | 722 | 0.9 | 1.32 | 1.44 | 0.004 |
| MSD | MDO | 1.00% | 4.3 | 59.7 | 1.8 | 0.4 | 690 | 0.9 | 0.45 | 0.49 | 0.004 | ||
| MSD | MGO | 0.50% | 1.1 | 59.7 | 1.8 | 0.4 | 690 | 0.9 | 0.29 | 0.32 | 0.004 | ||
| HSD | RO | 2.70% | 12.3 | 47.6 | 1.7 | 0.4 | 722 | 1.3 | 1.32 | 1.44 | 0.01 | ||
| HSD | MDO | 1.00% | 4.3 | 46.8 | 1.8 | 0.4 | 690 | 0.8 | 0.45 | 0.49 | 0.01 | ||
| HSD | MGO | 0.50% | 1.1 | 46.8 | 1.8 | 0.4 | 690 | 0.8 | 0.29 | 0.32 | 0.01 | ||
| Boilers | Maneuvering Hoteling | - | RO | 2.70% | 18.1 | 1.6 | 0.3 | 0.3 | 1067 | 0.4 | 1.35 | 1.47 | 0.02 |
References
- Massar, M.; Reza, I.; Rahman, S.M.; Abdullah, S.M.H.; Jamal, A.; Al-Ismail, F.S. Impacts of Autonomous Vehicles on Greenhouse Gas Emissions—Positive or Negative? Int. J. Environ. Res. Public Health 2021, 18, 5567. [Google Scholar] [CrossRef] [PubMed]
- Paschalidou, A.K.; Petrou, I.; Fytianos, G.; Kassomenos, P. Anatomy of the atmospheric emissions from the transport sector in Greece: Trends and challenges. Environ. Sci. Pollut. Res. 2022, 29, 34670–34684. [Google Scholar] [CrossRef]
- Ullah, I.; Liu, K.; Yamamoto, T.; Zahid, M.; Jamal, A. Electric vehicle energy consumption prediction using stacked generalization: An ensemble learning approach. Int. J. Green Energy 2021, 18, 896–909. [Google Scholar] [CrossRef]
- Transport Improving the Sustainability of Passenger and Freight Transport. Available online: https://www.iea.org/topics/transport (accessed on 5 March 2022).
- Nunes, R.A.O.; Alvim-Ferraz, M.C.M.; Martins, F.G.; Sousa, S.I.V. Assessment of shipping emissions on four ports of Portugal. Environ. Pollut. 2017, 231, 1370–1379. [Google Scholar] [CrossRef] [PubMed]
- Cao, Y.; Yin, K.; Li, X.; Zhai, C. Forecasting CO2 emissions from Chinese marine fleets using multivariable trend interaction grey model. Appl. Soft Comput. 2021, 104, 107220. [Google Scholar] [CrossRef]
- Buber, M.; Toz, A.C.; Sakar, C.; Koseoglu, B. Mapping the spatial distribution of emissions from domestic shipping in Izmir Bay. Ocean Eng. 2020, 210, 107576. [Google Scholar] [CrossRef]
- Lee, H.; Pham, H.T.; Chen, M.; Choo, S. Bottom-Up Approach Ship Emission Inventory in Port of Incheon Based on VTS Data. J. Adv. Transp. 2021, 2021, 5568777. [Google Scholar] [CrossRef]
- Wang, Z.; Safdar, M.; Zhong, S.; Liu, J.; Xiao, F. Public Preferences of Shared Autonomous Vehicles in Developing Countries: A Cross-National Study of Pakistan and China. J. Adv. Transp. 2021, 2021, 5141798. [Google Scholar] [CrossRef]
- Ali Aden, W.; Zheng, J.; Ullah, I.; Safdar, M. Public preferences towards car sharing service: The case of Djibouti. Front. Environ. Sci. 2022, 449. [Google Scholar] [CrossRef]
- Raza, A.; Zhong, M.; Safdar, M. Evaluating Locational Preference of Urban Activities with the Time-Dependent Accessibility Using Integrated Spatial Economic Models. Int. J. Environ. Res. Public Health 2022, 19, 8317. [Google Scholar] [CrossRef]
- Ullah, I.; Liu, K.; Yamamoto, T.; Zahid Khattak, M.; Jamal, A. Prediction of electric vehicle charging duration time using ensemble machine learning algorithm and Shapley additive explanations. Int. J. Energy Res. 2022, 46, 15211–15230. [Google Scholar] [CrossRef]
- Fahad, S.; Wang, J. Climate change, vulnerability, and its impacts in rural Pakistan: A review. Environ. Sci. Pollut. Res. 2020, 27, 1334–1338. [Google Scholar] [CrossRef] [PubMed]
- Ullah, S.; Ullah, N.; Rajper, S.A.; Ahmad, I.; Li, Z. Air pollution and associated self-reported effects on the exposed students at Malakand division, Pakistan. Env. Monit. Assess 2021, 193, 708. [Google Scholar] [CrossRef] [PubMed]
- Bilal, M.; Mhawish, A.; Nichol, J.E.; Qiu, Z.; Nazeer, M.; Ali, M.A.; de Leeuw, G.; Levy, R.C.; Wang, Y.; Chen, Y.; et al. Air pollution scenario over Pakistan: Characterization and ranking of extremely polluted cities using long-term concentrations of aerosols and trace gases. Remote Sens. Environ. 2021, 264, 112617. [Google Scholar] [CrossRef]
- Safdar, M.; Jamal, A.; Al-Ahmadi, H.M.; Rahman, M.T.; Almoshaogeh, M. Analysis of the Influential Factors towards Adoption of Car-Sharing: A Case Study of a Megacity in a Developing Country. Sustainability 2022, 14, 2778. [Google Scholar] [CrossRef]
- Anjum, M.S.; Ali, S.M.; Imad-ud-din, M.; Subhani, M.A.; Anwar, M.N.; Nizami, A.-S.; Ashraf, U.; Khokhar, M.F. An Emerged Challenge of Air Pollution and Ever-Increasing Particulate Matter in Pakistan; A Critical Review. J. Hazard. Mater. 2021, 402, 123943. [Google Scholar] [CrossRef]
- Severe Heatwave’ Set to Grip Entire Sindh Including Karachi. Available online: https://www.dawn.com/news/1688617 (accessed on 11 May 2022).
- Clark, X.; Dollar, D.; Micco, A. Port efficiency, maritime transport costs, and bilateral trade. J. Dev. Econ. 2004, 75, 417–450. [Google Scholar] [CrossRef]
- Deniz, C.; Kilic, A.; Cıvkaroglu, G. Estimation of shipping emissions in Candarli Gulf, Turkey. Environ. Monit. Assess. 2010, 171, 219–228. [Google Scholar] [CrossRef]
- Tai, H.-H.; Chang, Y.-H. Reducing pollutant emissions from vessel maneuvering in port areas. Marit. Econ. Logist. 2022, 24, 651–671. [Google Scholar] [CrossRef]
- Shahid, M.; Ullah, K.; Imran, K.; Masroor, N.; Sajid, M.B. Economic and environmental analysis of green transport penetration in Pakistan. Energy Policy 2022, 166, 113040. [Google Scholar] [CrossRef]
- Ullah, A.; Sam, A.S.; Sathyan, A.R.; Mahmood, N.; Zeb, A.; Kächele, H. Role of local communities in forest landscape restoration: Key lessons from the Billion Trees Afforestation Project, Pakistan. Sci. Total Environ. 2021, 772, 145613. [Google Scholar] [CrossRef] [PubMed]
- Coello, J.; Williams, I.; Hudson, D.A.; Kemp, S. An AIS-based approach to calculate atmospheric emissions from the UK fishing fleet. Atmos. Environ. 2015, 114, 1–7. [Google Scholar] [CrossRef]
- McArthur, D.P.; Osland, L. Ships in a city harbour: An economic valuation of atmospheric emissions. Transp. Res. Part D Transp. Environ. 2013, 21, 47–52. [Google Scholar] [CrossRef]
- Papaefthimiou, S.; Maragkogianni, A.; Andriosopoulos, K. Evaluation of cruise ships emissions in the Mediterranean basin: The case of Greek ports. Int. J. Sustain. Transp. 2016, 10, 985–994. [Google Scholar] [CrossRef]
- Goldsworthy, L.; Goldsworthy, B. Modelling of ship engine exhaust emissions in ports and extensive coastal waters based on terrestrial AIS data—An Australian case study. Environ. Model. Softw. 2015, 63, 45–60. [Google Scholar] [CrossRef]
- Lonati, G.; Cernuschi, S.; Sidi, S. Air quality impact assessment of at-berth ship emissions: Case-study for the project of a new freight port. Sci. Total Environ. 2010, 409, 192–200. [Google Scholar] [CrossRef]
- Song, S. Ship emissions inventory, social cost and eco-efficiency in Shanghai Yangshan port. Atmos. Environ. 2014, 82, 288–297. [Google Scholar] [CrossRef]
- Song, S.-K.; Shon, Z.-H. Current and future emission estimates of exhaust gases and particles from shipping at the largest port in Korea. Environ. Sci. Pollut. Res. 2014, 21, 6612–6622. [Google Scholar] [CrossRef]
- Fan, Q.; Zhang, Y.; Ma, W.; Ma, H.; Feng, J.; Yu, Q.; Yang, X.; Ng, S.K.W.; Fu, Q.; Chen, L. Spatial and Seasonal Dynamics of Ship Emissions over the Yangtze River Delta and East China Sea and Their Potential Environmental Influence. Environ. Sci. Technol. 2016, 50, 1322–1329. [Google Scholar] [CrossRef]
- Ng, S.K.W.; Loh, C.; Lin, C.; Booth, V.; Chan, J.W.M.; Yip, A.C.K.; Li, Y.; Lau, A.K.H. Policy change driven by an AIS-assisted marine emission inventory in Hong Kong and the Pearl River Delta. Atmos. Environ. 2013, 76, 102–112. [Google Scholar] [CrossRef]
- Wan, Z.; Ji, S.; Liu, Y.; Zhang, Q.; Chen, J.; Wang, Q. Shipping emission inventories in China’s Bohai Bay, Yangtze River Delta, and Pearl River Delta in 2018. Mar. Pollut. Bull. 2020, 151, 110882. [Google Scholar] [CrossRef] [PubMed]
- Saraçoğlu, H.; Deniz, C.; Kılıç, A. An Investigation on the Effects of Ship Sourced Emissions in Izmir Port, Turkey. Sci. World J. 2013, 2013, 218324. [Google Scholar] [CrossRef] [PubMed]
- Yau, P.S.; Lee, S.C.; Corbett, J.J.; Wang, C.; Cheng, Y.; Ho, K.F. Estimation of exhaust emission from ocean-going vessels in Hong Kong. Sci. Total Environ. 2012, 431, 299–306. [Google Scholar] [CrossRef] [PubMed]
- Kuzu, S.L.; Bilgili, L.; Kiliç, A. Estimation and dispersion analysis of shipping emissions in Bandirma Port, Turkey. Environ. Dev. Sustain. 2021, 23, 10288–10308. [Google Scholar] [CrossRef]
- Ghauri, B.; Lodhi, A.; Mansha, M. Development of baseline (air quality) data in Pakistan. Environ. Monit. Assess. 2007, 127, 237–252. [Google Scholar] [CrossRef]
- Lodhi, A.; Ghauri, B.M.; Khan, M.; Rahmana, S.; Shafique, S. Particulate Matter (PM2.5) Concentration and Source Apportionment in Lahore. J. Braz. Chem. Soc. 2009, 20, 1811–1820. [Google Scholar] [CrossRef]
- Colbeck, I.; Nasir, Z.; Ali, Z. Characteristics of indoor/outdoor particulate pollution in urban and rural residential environment of Pakistan. Indoor Air 2009, 20, 40–51. [Google Scholar] [CrossRef]
- Sughis, M.; Nawrot, T.S.; Ihsan-ul-Haque, S.; Amjad, A.; Nemery, B. Blood pressure and particulate air pollution in schoolchildren of Lahore, Pakistan. BMC Public Health 2012, 12, 378. [Google Scholar] [CrossRef]
- Khokhar, M.F.; Mehdi, H.; Abbas, Z.; Javed, Z. Temporal Assessment of NO2 Pollution Levels in Urban Centers of Pakistan by Employing Ground-Based and Satellite Observations. Aerosol Air Qual. Res. 2016, 16, 1854–1867. [Google Scholar] [CrossRef]
- Niaz, E.D.Y.; Zhou, J.; Awan, A.; Dong, B. Comparitive study of particulate matter (PM10 and PM2.5) in Dalian-China and Faisalabad-Pakistan. Pak. J. Agric. Sci. 2016, 53, 97–106. [Google Scholar] [CrossRef]
- Hassan, A.; Ilyas, S.Z.; Jalil, A.; Ullah, Z. Monetization of the environmental damage caused by fossil fuels. Environ. Sci. Pollut. Res. 2021, 28, 21204–21211. [Google Scholar] [CrossRef] [PubMed]
- Jalees, M.I.; Asim, Z. Statistical modeling of atmospheric trace metals in Lahore, Pakistan for correlation and source identification. Environ. Earth Sci. 2016, 75, 842. [Google Scholar] [CrossRef]
- Radford, A.; Geddes, J.A.; Gallagher, K.; Larson, B.A. Open-source methods for estimating health risks of fine particulate matter from coal-fired power plants: A demonstration from Karachi, Pakistan. Environ. Impact Assess. Rev. 2021, 91, 106638. [Google Scholar] [CrossRef]
- Tzannatos, E. Ship emissions and their externalities for the port of Piraeus—Greece. Atmos. Environ. 2010, 44, 400–407. [Google Scholar] [CrossRef]
- Ho, Q.B.; Vu, H.N.K.; Nguyen, T.T.; Nguyen, T.T.H.; Nguyen, T.T.T. A combination of bottom-up and top-down approaches for calculating of air emission for developing countries: A case of Ho Chi Minh City, Vietnam. Air Qual. Atmos. Health 2019, 12, 1059–1072. [Google Scholar] [CrossRef]
- Kiliç, A.; Deniz, C. Inventory of shipping emissions in Izmit Gulf, Turkey. Environ. Prog. Sustain. Energy 2010, 29, 221–232. [Google Scholar] [CrossRef]
- Zhao, T.; Chen, M.; Lee, H. A Study on the Framework for Estimating Ship Air Pollutant Emissions- Focusing on Ports of South Korea. Atmosphere 2022, 13, 1141. [Google Scholar] [CrossRef]
- Port Qasim Authority. Available online: https://www.pqa.gov.pk/en/about-us/introduction (accessed on 5 March 2022).
- Port Qasim. Available online: https://en.wikipedia.org/wiki/Port_Qasim (accessed on 5 March 2022).
- Ministry of Maritime Affairs Government of Pakistan. Available online: https://www.moma.gov.pk/ (accessed on 5 March 2022).
- Bhatti, B.A. Ports and Their Importance for Pakistan—Maritime Study Forum. 2020. Available online: https://www.maritimestudyforum.org/prospects-of-maritime-economy-for-pakistan/ (accessed on 5 March 2022).
- Equasis, Electronic Shipping Information System. Available online: https://www.equasis.org/EquasisWeb/public/HomePage (accessed on 20 March 2020).
- EMEP/EEA Air Pollutant Emission Inventory Guidebook 2016. Available online: https://www.eea.europa.eu/publications/emep-eea-guidebook-2016 (accessed on 10 March 2020).
- Entec, U.K.L. Quantification of emissions from ships associated with ship movements between ports in the European Community. In European Commission, Final Report; European Commission: Brussels, Belgium, 2002. [Google Scholar]
- Cooper, D.; Gustafsson, T. Methodology for Calculating Emissions from Ships: Update on Emission Factors; Prepared by IVL Swedish Environmental Research Institute; Swedish Environmental Protection Agency: Norrköping, Sweden, 2004. [Google Scholar]
- Epa, I.C.F. Current Methodologies in Preparing Mobile Source Port-Related Emission Inventories; US Environmental Protection Agency (USEPA): Washington, DC, USA, 2009. [Google Scholar]
- Whall, C.; Scarbrough, T.; Stavrakaki, A.; Green, C.; Squire, J.; Noden, R. UK Ship Emissions Inventory; Final Report; Entec: London, UK, 2010. [Google Scholar]
- Trozzi, C. Emission Estimate Methodology for Maritime Navigation; Techne Consulting: Rome, Italy, 2010. [Google Scholar]
- Toz, A.C.; Buber, M.; Koseoglu, B.; Sakar, C. An estimation of shipping emissions to analysing air pollution density in the Izmir Bay. Air Qual. Atmos. Health 2021, 14, 69–81. [Google Scholar] [CrossRef]
- Nguyen, P.-N.; Woo, S.-H.; Kim, H. Ship emissions in hotelling phase and loading/unloading in Southeast Asia ports. Transp. Res. Part D Transp. Environ. 2022, 105, 103223. [Google Scholar] [CrossRef]
- López-Aparicio, S.; Tønnesen, D.; Thanh, T.N.; Neilson, H. Shipping emissions in a Nordic port: Assessment of mitigation strategies. Transp. Res. Part D Transp. Environ. 2017, 53, 205–216. [Google Scholar] [CrossRef]
- Berechman, J.; Tseng, P.-H. Estimating the environmental costs of port related emissions: The case of Kaohsiung. Transp. Res. Part D Transp. Environ. 2012, 17, 35–38. [Google Scholar] [CrossRef]
- Muller, N.Z.; Mendelsohn, R. Measuring the damages of air pollution in the United States. J. Environ. Econ. Manag. 2007, 54, 1–14. [Google Scholar] [CrossRef]
- Tovar, B.; Tichavska, M. Environmental cost and eco-efficiency from vessel emissions under diverse SOx regulatory frameworks: A special focus on passenger port hubs. Transp. Res. Part D Transp. Environ. 2019, 69, 1–12. [Google Scholar] [CrossRef]
- Dragović, B.; Tzannatos, E.; Tselentis, V.; Meštrović, R.; Škurić, M. Ship emissions and their externalities in cruise ports. Transp. Res. Part D Transp. Environ. 2018, 61, 289–300. [Google Scholar] [CrossRef]

| Ship Type | Non-Linear Regression of 2010 World Fleet | AE Power Ratio |
|---|---|---|
| Bulk Carrier | 14.755 × GT0.6082 | 0.30 |
| Container Ship | 2.9165 × GT0.8719 | 0.25 |
| General Cargo | 5.56482 × GT0.7425 | 0.23 |
| Tankers | 35.912 × GT0.5276 | 0.30 |
| Types of Ships | Total Number |
|---|---|
| Bulk Carriers | 321 |
| Tankers | 579 |
| Container ships | 481 |
| General Cargo ships | 53 |
| Engine Type | SO2 | NOx | NMVOC | HC | CO2 | CO | PM2.5 | PM10 | CH4 |
|---|---|---|---|---|---|---|---|---|---|
| Main Engine | 10.4 | 14.7 | 0.9 | 0.8 | 614.7 | 0.6 | 1.3 | 1.4 | 0.1 |
| Auxiliary Engine | 1304.4 | 6170.2 | 180.3 | 42.4 | 76,568.2 | 103.0 | 140.0 | 152.7 | 0.5 |
| Boiler | 560.5 | 49.6 | 9.3 | 9.3 | 33,044.1 | 12.4 | 41.8 | 45.5 | 0.6 |
| Emissions Total | 1875.3 | 6234.5 | 190.5 | 52.5 | 110,227 | 116 | 183.1 | 199.6 | 1.2 |
| Operation Mode | CO2 | NOx | NMVOC | HC | SO2 | CO | PM2.5 | PM10 | CH4 |
|---|---|---|---|---|---|---|---|---|---|
| Hoteling | 106,970.9 | 6027.7 | 183.9 | 50.4 | 1819.9 | 112.1 | 177.1 | 193.2 | 1.04 |
| Maneuvering | 1735.9 | 111.4 | 3.4 | 1.1 | 29.5 | 2.0 | 3.1 | 3.3 | 0.2 |
| Reduced Speed Zone | 1520.1 | 99.2 | 0.9 | 0.08 | 25.8 | 1.8 | 2.7 | 3.0 | 0.005 |
| Port | Inventory Period | Operation Analyzed | Pollutants Studies | Study | Emission (Tons/Year) |
|---|---|---|---|---|---|
| Muhammad Bin Qasim Port Pakistan | 2020 | RSZ, M, H | PM10, PM2.5, NOx, SO2, CO, CO2, CH4, NMVOC, and HC | Current Study | 119,079 |
| Bohai Bay, Yangtze River Delta, and Pearl River Delta China | 2018 | C, RSZ, M, H | PM10, PM2.5, NOx, SOx, CO, CO2, N2O, and HC | Wan et al. [33] | 7,715,172.03 11,049,016.09 4,329,337.25 |
| Izmir Bay, Turkey | 2018 | C, M, H | SO2, NOx, CO2, PM10, HC | Toz et al. [61] | 20,425.8 |
| Bandirma Port, Turkey | 2018 | H | PM10, NOx, SO2, and CO | Kuzu et al. [36] | 282,685.3 |
| Izmir Bay, Turkey | 2018 | C, M, H | SO2, NOx, CO2, PM, HC | Buber et al. [7] | 64,222.6 |
| Pollutant Type | Emission Social Costs ($) |
|---|---|
| NOx | 66,628,101.50 |
| SO2 | 23,120,574 |
| HC | 156,712.50 |
| CO2 | 3,196,583 |
| CO | 132,936 |
| PM2.5 | 15,704,670 |
| PM10 | 15,342,653 |
| Total | 124,282,230 |
Publisher’s Note: MDPI stays neutral with regard to jurisdictional claims in published maps and institutional affiliations. |
© 2022 by the authors. Licensee MDPI, Basel, Switzerland. This article is an open access article distributed under the terms and conditions of the Creative Commons Attribution (CC BY) license (https://creativecommons.org/licenses/by/4.0/).
Share and Cite
Hussain, I.; Wang, H.; Safdar, M.; Ho, Q.B.; Wemegah, T.D.; Noor, S. Estimation of Shipping Emissions in Developing Country: A Case Study of Mohammad Bin Qasim Port, Pakistan. Int. J. Environ. Res. Public Health 2022, 19, 11868. https://doi.org/10.3390/ijerph191911868
Hussain I, Wang H, Safdar M, Ho QB, Wemegah TD, Noor S. Estimation of Shipping Emissions in Developing Country: A Case Study of Mohammad Bin Qasim Port, Pakistan. International Journal of Environmental Research and Public Health. 2022; 19(19):11868. https://doi.org/10.3390/ijerph191911868
Chicago/Turabian StyleHussain, Iftikhar, Haiyan Wang, Muhammad Safdar, Quoc Bang Ho, Tina D. Wemegah, and Saima Noor. 2022. "Estimation of Shipping Emissions in Developing Country: A Case Study of Mohammad Bin Qasim Port, Pakistan" International Journal of Environmental Research and Public Health 19, no. 19: 11868. https://doi.org/10.3390/ijerph191911868
APA StyleHussain, I., Wang, H., Safdar, M., Ho, Q. B., Wemegah, T. D., & Noor, S. (2022). Estimation of Shipping Emissions in Developing Country: A Case Study of Mohammad Bin Qasim Port, Pakistan. International Journal of Environmental Research and Public Health, 19(19), 11868. https://doi.org/10.3390/ijerph191911868