Article

Prevalence and Correlates of Underweight among Women of Reproductive Age in Nepal: A Cross-Sectional Study

by
Kritika Rana
1,2,3,4,†,
Ritesh Chimoriya
1,3,4,5,†,
Nabila Binte Haque
6,
Milan K. Piya
1,5,7,
Romila Chimoriya
4,8,
Michael Ekholuenetale
9 and
Amit Arora
1,2,3,10,11,*
1
Translational Health Research Institute, Western Sydney University, Campbelltown, NSW 2560, Australia
2
School of Health Sciences, Western Sydney University, Penrith, NSW 2751, Australia
3
Health Equity Laboratory, Campbelltown, NSW 2560, Australia
4
Philanthropy Nepal (Paropakari Nepal) Research Collaboration, Auburn, NSW 2144, Australia
5
School of Medicine, Western Sydney University, Campbelltown, NSW 2560, Australia
6
Department of Health Systems and Populations, Macquarie University, Macquarie Park, Sydney, NSW 2109, Australia
7
Macarthur Diabetes Endocrinology and Metabolism Service, Camden and Campbelltown Hospitals, Campbelltown, NSW 2560, Australia
8
Department of Pediatrics, Nepal Medical College Teaching Hospital, Kathmandu 44600, Nepal
9
Department of Epidemiology and Medical Statistics, Faculty of Public Health, College of Medicine, University of Ibadan, Ibadan 200214, Nigeria
10
Discipline of Child and Adolescent Health, The Children’s Hospital at Westmead Clinical School, Faculty of Medicine and Health, The University of Sydney, Westmead, NSW 2145, Australia
11
Oral Health Services, Sydney Local Health District and Sydney Dental Hospital, NSW Health, Surry Hills, NSW 2010, Australia
*
Author to whom correspondence should be addressed.
These authors contributed equally to this work and should be considered equal first authors.
Int. J. Environ. Res. Public Health 2022, 19(18), 11737; https://doi.org/10.3390/ijerph191811737
Submission received: 24 July 2022 / Revised: 7 September 2022 / Accepted: 16 September 2022 / Published: 17 September 2022

Abstract

:
This study aimed to examine the prevalence of underweight and determine the sociodemographic and household environmental correlates of underweight among women of reproductive age in Nepal. This study also compared the time trends in the prevalence of underweight with the trends in the prevalence of overweight and obesity. This cross-sectional study was a secondary data analysis of the nationally representative population-based Nepal Demographic and Health Surveys (NDHSs). Firstly, the time trends of the prevalence of underweight (body mass index (BMI) < 18.5 kg/m2) among women aged 15–49 years were examined at five-year intervals, from the 1996, 2001, 2006, 2011, and 2016 NDHSs (n = 33,507). Secondly, the sociodemographic and household environmental correlates of underweight were examined from the latest NDHS 2016 (n = 6165). Univariable and multivariable logistic regression analyses were performed to examine the sociodemographic and household environmental correlates of underweight. From 1996 to 2016, the prevalence of underweight decreased from 25.3% (95% confidence interval (CI) 23.8%, 26.8%) to 16.9% (95%CI 16.0%, 17.8%), while the prevalence of overweight and obesity increased from 1.6% (95%CI 1.2%, 2.1%) to 15.6% (95%CI 14.7%, 16.5%) and 0.2% (95%CI 0.1%, 0.4%) to 4.1% (95%CI 3.6%, 4.6%), respectively. Sociodemographic factors, such as age, educational status, marital status, wealth index, and religion, were independently associated with the risk of underweight. Similarly, household environmental factors, such as province of residence, ecological zone, type of toilet facility, and household possessions, including television and mobile phone, were independently associated with the risk of underweight. Despite the declining trends, the prevalence of underweight among Nepalese women remains a public health challenge. Understanding the key sociodemographic and household environmental correlates of underweight may assist in streamlining the content of health promotion campaigns to address undernutrition and potentially mitigate adverse health outcomes.

1. Introduction

Undernutrition and overnutrition are both major global public health challenges contributing towards increased risk of morbidity and mortality [1,2]. Globally, approximately 462 million adults are affected by underweight (body mass index (BMI) < 18.5 kg/m2), while 1.9 billion adults are affected by overweight or obesity (BMI ≥ 25 kg/m2) [3]. According to an estimation by the World Health Organization (WHO), 149 million children across the world aged under five years are affected by stunting (low height for age), 45 million by wasting (low weight for height), and 38.9 million by overweight or obesity [1]. Alarmingly, undernutrition alone is responsible for 45% of global deaths in children under five years of age [1]. Malnutrition has consistently been recognised as a major health burden in low- and middle-income countries (LMICs) [4,5], particularly in Southern Asia and sub-Saharan Africa [4,6]. In today’s context, most LMICs are affected by the double burden of malnutrition, where undernutrition (i.e., underweight, micronutrient deficiencies) and overweight or obesity manifest simultaneously [2]. South Asian countries, such as Nepal, Bangladesh, Pakistan, and India, have had historically high levels of undernutrition, yet these countries also experience a double burden of malnutrition [7,8].
Women have been found to have a higher prevalence of undernutrition compared to men across the South Asian region, and over one-third of the world’s women with anaemia live in this region [7,8,9]. One of the potential reasons for the higher prevalence of undernutrition may be linked with the social and economic disparities where men have higher priority to nutritious food compared to women [10]. A clear gender disparity is evident within the low wealth index societies of South Asian countries because of the patriarchal social structures that still prevails [11]. Moreover, women of reproductive age (15–49 years) are more susceptible to developing undernutrition [11,12], potentially due to the unmet increased nutritional requirements during successive pregnancies. Maternal undernutrition has been recognised as a key determinant of adverse health outcomes for both mothers and their offspring [13,14], including increased rates of infant and maternal morbidity and mortality [12,14,15,16,17]. Despite progresses in reducing underweight among women in South and Southeast Asian countries, the overall pooled prevalence of underweight has been estimated to be 22.9%, which is projected to decrease to 6.6% in 2030 [18]. The prevalence of underweight as projected for 2030 in South Asian countries threatens the progress towards achieving the Sustainable Development Goals (SDGs), particularly Goal 2, which includes a target of ending all forms of malnutrition by 2030 [18,19].
Nepal is a developing country in South Asia with a growing population that has doubled from 15 million in 1981 to 29 million in 2016 [20]. Despite efforts by various local, national, and international entities towards improving nutritional status of the population as a whole, nutrition among women remains one of the major health and social concerns [21]. Similar to other countries in the region, Nepalese women are often overlooked and under-prioritised, not just within the society but in many cases within their own families [22]. Although the prevalence of underweight has been declining gradually among Nepalese population attributed to several health promotion initiatives, the prevalence of underweight among Nepalese women of has remained high for a few decades [9,21]. According to the most recent Nepal Demographic and Health Survey (NDHS) 2016, an estimated 17% of women of reproductive age (15–49 years) were affected by underweight, with a BMI < 18.5 kg/m2 [20]. Additionally, around 12% of children were of low birth weight, and an approximate 27% of children under-five were affected by underweight, 36% by stunting, and 10% by wasting [20]. Given the profound impacts of maternal nutritional status on maternal and child health outcomes, it is essential to determine the underlying cause of underweight among women of reproductive age in Nepal.
Underweight is a multifactorial issue resulting from a complex interplay of several causes, and it is often linked with various determinants, such as health behaviours, biological factors, food environment, social environment, and household environment [9,23]. Sociodemographic factors, including age, educational status, marital status, religion, and employment status, are often closely linked with nutritional status in South Asian countries, such as Nepal [12,24,25]. On the other hand, household environmental factors, such as place of residence, cooking fuel, type of toilet facility, source of drinking water, and housing characteristics, have been shown to influence the nutritional status of women of reproductive age [13,24,26]. Determining the sociodemographic and household environmental correlates of underweight among Nepalese women of childbearing age is essential to identify the women who are at high-risk of being affected by underweight. This will also facilitate the integration of targeted interventions into nutrition programs [13], which may assist in reducing the burden of underweight and potentially mitigate any adverse maternal and child health outcomes.
To the best of our knowledge, no studies have explored the time trends in the prevalence of underweight among women of childbearing age. A few studies were identified that have explored the nutritional status of Nepalese adults [9,17,22,27,28], yet only one study [9] was solely focused on women of reproductive age. However, most prior studies only explored limited sociodemographic correlates of underweight, and none had an exclusive focus on underweight. Therefore, the aims of this study were to examine the time trends of the prevalence of underweight and determine the sociodemographic and household environmental correlates of underweight among women of reproductive age in Nepal. This study also compared the time trends in the prevalence of underweight with the trends in the prevalence of overweight and obesity.

2. Methods

2.1. Study Design and Data Sources

This study was a secondary data analysis of the publicly available datasets of the NDHS [29]. Firstly, the time trends of the prevalence of underweight among women of reproductive age (15–49 years) in Nepal were examined from the five-yearly (1996, 2001, 2006, 2011, and 2016) NDHSs. Secondly, the sociodemographic and household environmental correlates of underweight were examined from the latest NDHS in 2016.
The NDHS is a nationally representative population-based cross-sectional survey conducted with technical assistance from the Demographic and Health Surveys (DHS) Program [30]. The DHS Program is implemented by Inner City Fund (ICF) International and is funded by the United States Agency for International Development (USAID) [31]. The NDHSs are conducted every five years under the leadership of the Ministry of Health by New ERA Nepal [20,32,33,34,35].

2.2. Sampling Design

A two- or three-stage stratified cluster sampling design was employed in the NDHSs, covering all districts of Nepal, and further stratification into urban and rural areas. Using a probability proportional to size method, wards or sub-wards (i.e., subunits of municipalities) were chosen as the primary sampling units (PSUs). From each PSU, a sample enumeration area (EA) was selected. Finally, households were either chosen from the sample PSUs or the sample EAs. The sampling design and the methodology adopted for each NDHS have previously been described in detail [20,32,33,34,35].
Specifically for the 2016 NDHS, the sample was stratified and selected in two and three stages in the rural and urban areas, respectively [20]. In rural areas, wards were selected as the PSUs, and household were selected from these sample PSUs. In urban areas, wards were selected as the PSUs, followed by selection of one EA from each PSU, and then the selection of households from the sample EAs. Firstly, 383 wards were selected with probability proportional to ward size. Finally, a total of 30 households per cluster were selected with an equal probability systematic selection. Although a total of 11,473 households were selected for the sample, interviews were completed for 11,040 households [20].

2.3. Data Collection

Trained field staff interviewed the households using the household questionnaire to collect information on the household characteristics. Subsequently, individual interviews were conducted with woman aged 15–49 years in that household, using the woman’s questionnaire. In order to reflect the sociodemographic characteristics relevant to Nepal, an adapted version of the standard DHS woman’s questionnaire was used. Finally, anthropometric measurements were recorded using the biomarker questionnaire at participants’ homes. Using standard DHS procedures, trained female field-staff recorded the height and weight measurements [20,32,33,34,35].

2.4. Sample Size

The 1996, 2001, 2006, 2011, and 2016 NDHSs include a sample size of 8429, 8726, 10,793, 12,674, and 12,862 women, respectively. The 2006, 2011, and 2016 NDHSs included all women aged 15–49 years, while the 1996 and 2001 NDHSs excluded women aged 15–49 years who had never been married. Height and weight measurements were recorded only in women with children aged three years or below in the 1996 NDHS, while the 2001–2016 NDHSs collected anthropometric measurements for all interviewed women [20,32,33,34,35]. We excluded women with missing values for height and/or weight measurements and women who were pregnant at the time of the survey. A total sample of 33,507 women aged 15–49 years were extracted from the 1996 (n = 3420), 2001 (n = 7959), 2006 (n = 10,116), 2011 (n = 5847), and 2016 (n = 6165) NDHSs and were included in this study.

2.5. Outcome Variable

The primary outcome variable of this study was the prevalence of underweight. BMI was calculated by dividing the weight in kilograms by the height in meters squared (kg/m2). As per the World Health Organization BMI classification, BMI was categorised as follows: underweight (<18.5 kg/m2), normal weight (18.5 to 24.9 kg/m2), overweight (25 to 29.9 kg/m2), and obese (≥30 kg/m2) [36].

2.6. Explanatory Variables

The potential sociodemographic and household environmental correlates of underweight investigated in this study are based on the review of existing literature and available variables contained in the NDHSs datasets. The categorisation of explanatory variables based on the NDHS datasets was derived from our previous work [24].

2.6.1. Sociodemographic Factors

For individual-level factors, age (15–24, 25–34, 35–49 years), educational status (no formal education, primary, secondary, higher), and employment status (not currently employed, currently employed) were considered. For family-level factors, marital status (never married, married/living with a partner, widowed/divorced/separated), number of household members (≤5, >5), wealth index (poorest, poorer, middle, richer, richest), and religion (Hindu, Buddhist, Muslim, other) were considered. The categories for the wealth index used in this study are as provided by the DHS program and as used in the NDHSs [20]. The wealth index was computed and classified into the aforementioned categories by the DHS program using the principal component analysis technique, which has been described in detail [20,24].

2.6.2. Household Environmental Factors

Household environmental factors consist of environmental factors, household facilities, housing characteristics, and household possessions. For environmental factors, the place of residence (urban, rural), province of residence (Province 1 to Province 7), and ecological zone (Mountain, Hill, Terai) were considered. The categorisation of the province of residence was as per the categorisation used in the NDHSs [20]. For household facilities, source of drinking water (unimproved, improved), type of toilet facility (unimproved, improved), cooking fuel (solid fuel, clean fuel), and access to electricity (no, yes) were considered. For housing characteristics, the main floor, wall, and roof materials were categorised as unimproved and improved. For household possessions, refrigerator, television, mobile phone, bicycle, and motorised vehicle (motorcycle/scooter and car/truck) were considered and were classified as no and yes. Further details on the categorisations used are presented in Supplementary Table S1.

2.7. Statistical Analysis

For the statistical analysis, the Statistical Package for Social Sciences, Version 25 (SPSS for MacOS, SPSS Inc., Chicago, IL, USA) was used. Firstly, from the 1996, 2001, 2006, 2011, and 2016 NDHSs, the time trends of the prevalence of underweight (BMI < 18.5 kg/m2) among women of reproductive age in Nepal were calculated and are reported in the form of prevalence (%). The data from each survey are not matched and are not longitudinally followed up, so the prevalence reported in the study only denotes the prevalence at the cross-sectional point of the surveys. Secondly, the sociodemographic and household environmental correlates of underweight were examined from the latest NDHS in 2016. In the descriptive analyses, the characteristics of the study participants with respect to the sociodemographic and household environmental factors are reported in the form of frequency (n), percentages (%), and mean ± standard deviations. Univariable and multivariable logistic regression analyses were performed to examine the sociodemographic and household environmental correlates of underweight (BMI < 18.5 kg/m2). Variables that were significant at p < 0.2 in the univariable model were then included in the multivariable model. The model was then reduced using a backward stepwise procedure, while simultaneously assessing the model fitness, in order to prevent dropping of non-significant variables that may affect the model fitness. The goodness-of-fit of the model was assessed using the Hosmer–Lemeshow statistic [37]. The final model includes those variables, which when eliminated, cause a significant change in deviance (p < 0.05), compared with the corresponding X2 test statistic on the relevant degrees of freedom. The unadjusted crude odds ratio (COR) and adjusted odds ratio (AOR) with a 95% confidence interval (95%CI) are reported in the results.

2.8. Ethical Considerations

This study is a secondary data analysis of the open access datasets of the NDHSs [29]. Following registration with the DHS program and submission of an application indicating the intended use of the NDHSs datasets, permission was granted to access the datasets for the purpose of this study. The ethical approval for all NDHSs were obtained from the ethical review board of Nepal Health Research Council and human research ethics committee of ICF Macro International. The independent review boards of New ERA and ICF Macro International provided approval for the data collection procedures and tools used for the NDHSs. Prior to data collection, the DHS Program obtained informed consent from all study participants [20,32,33,34,35].

3. Results

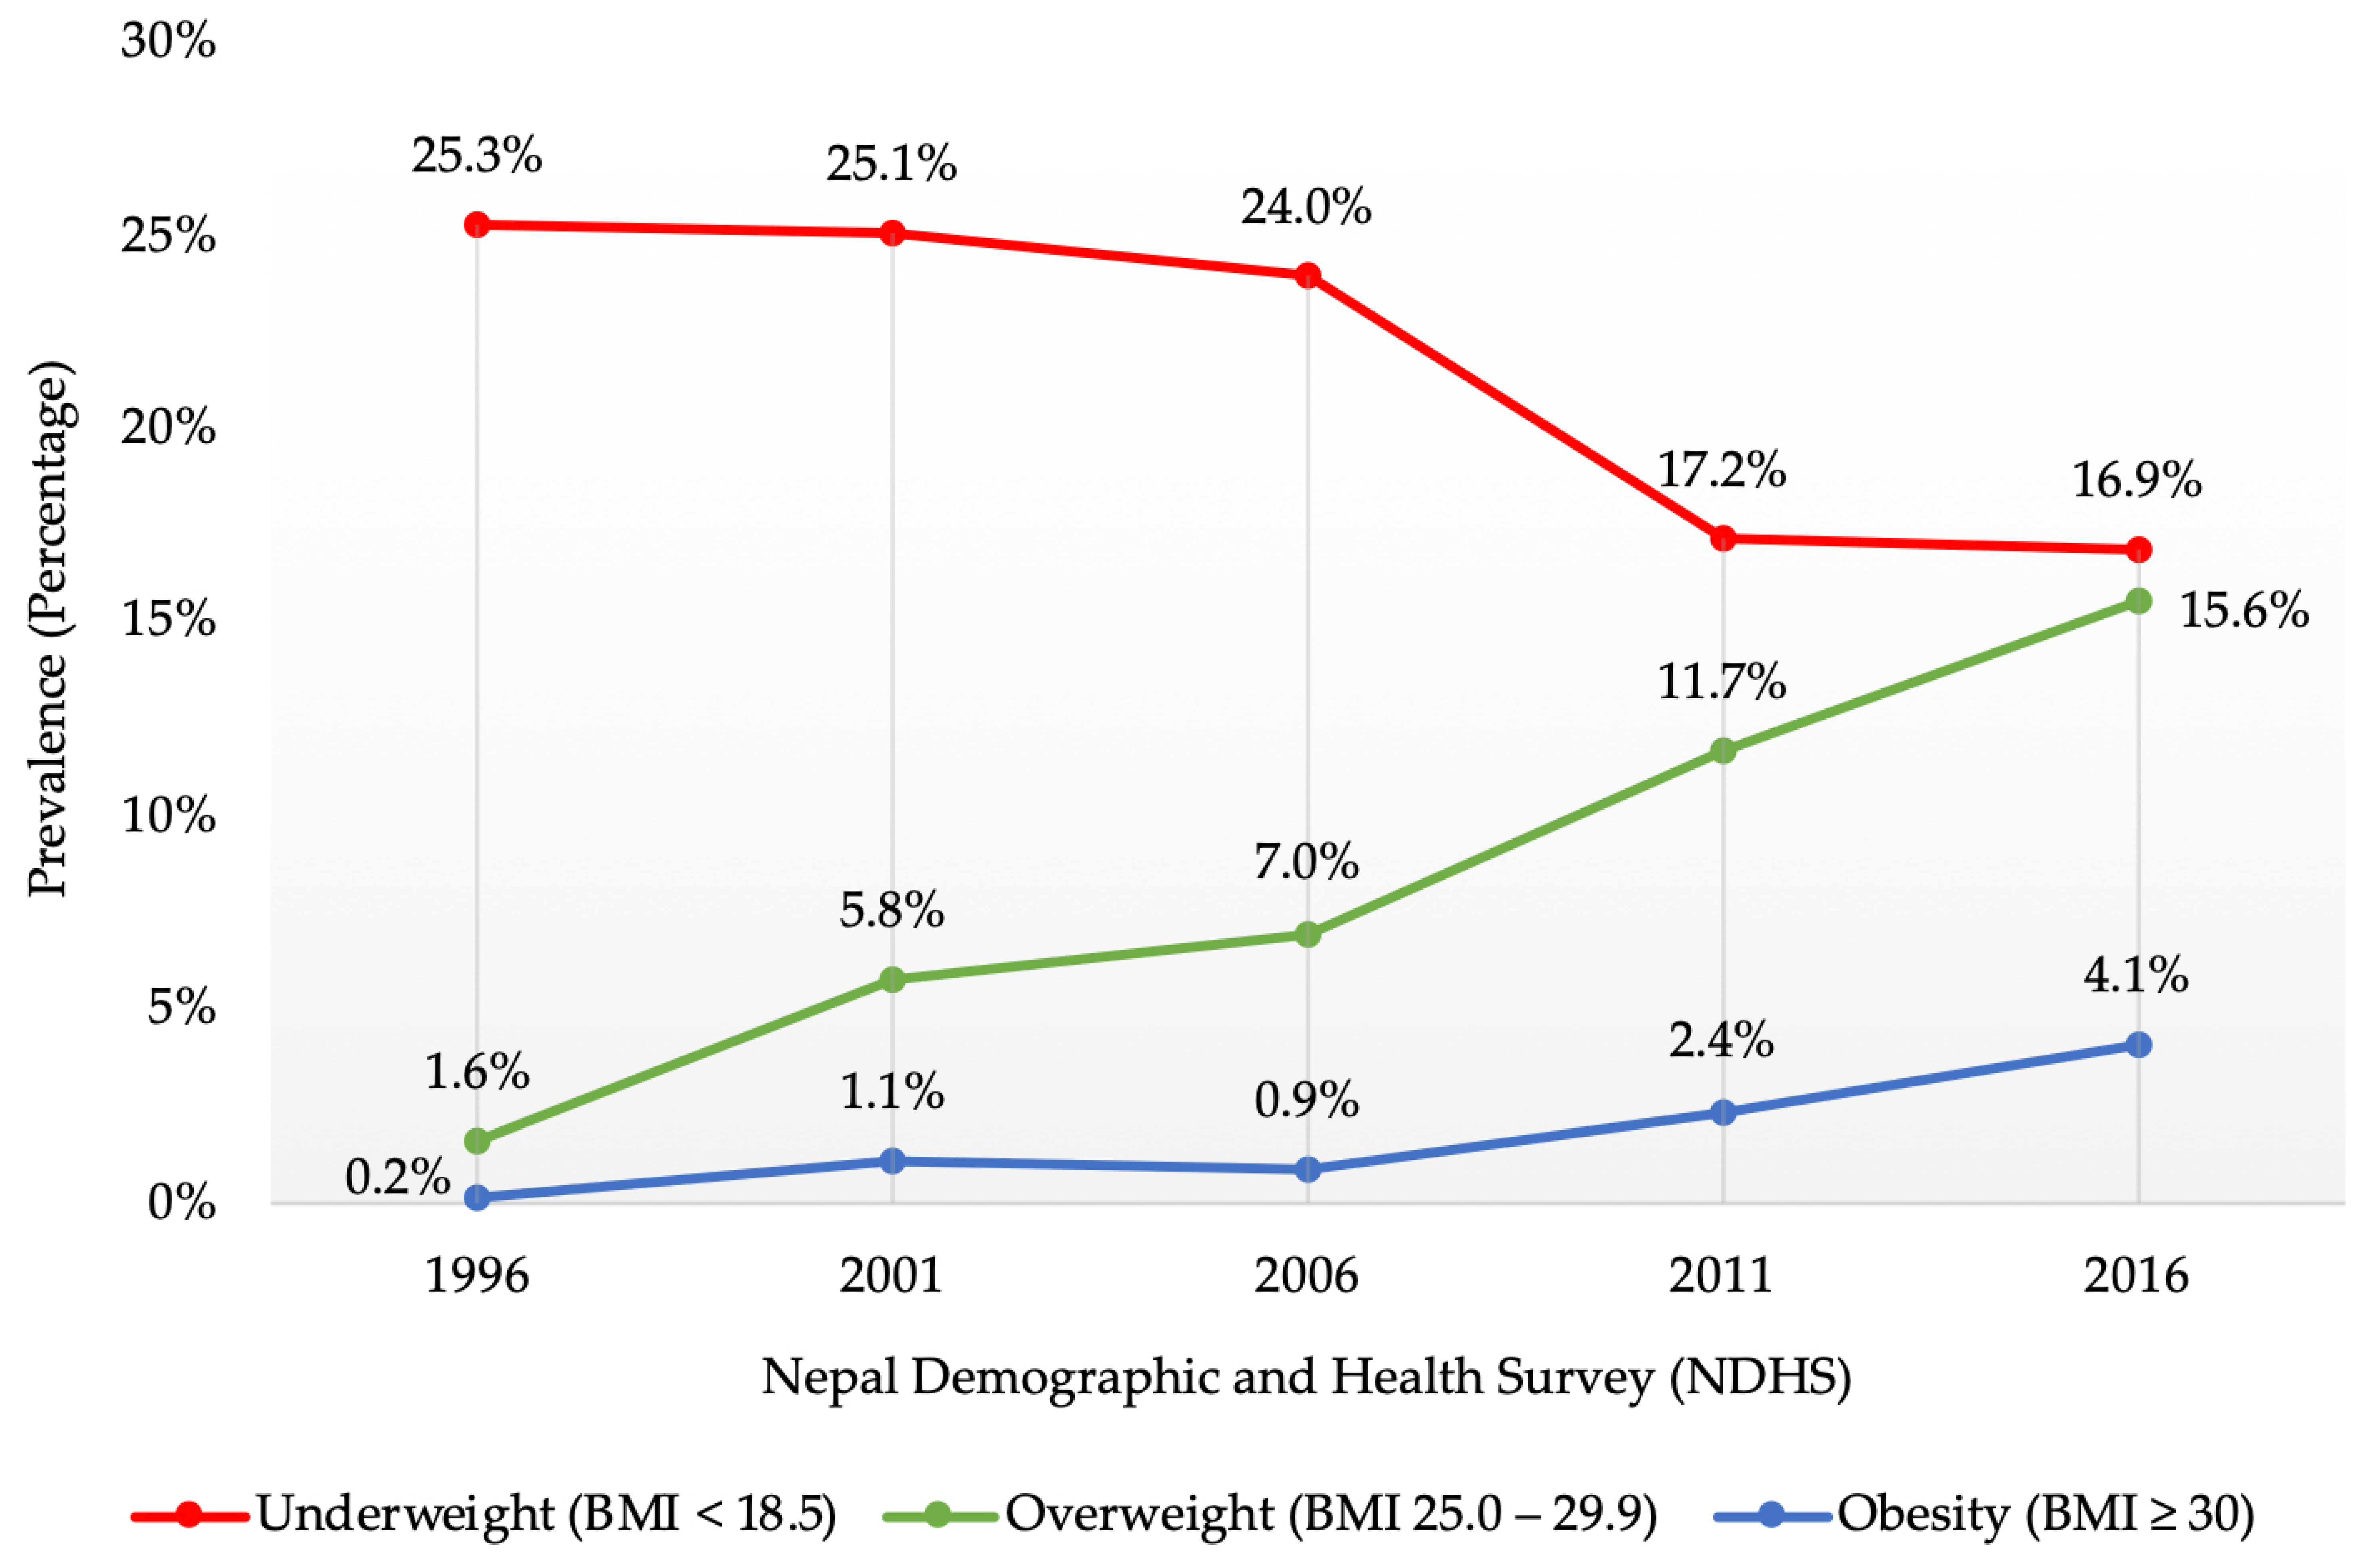
3.1. Time Trends of the Prevalence of Underweight from 1996 to 2016

Figure 1 illustrates the time trends of the prevalence of underweight as compared to overweight and obesity from 1996 to 2016 among women of reproductive age in Nepal. Between 1996 and 2016, the prevalence of underweight decreased from 25.3% (95%CI 23.8%, 26.8%) to 16.9% (95%CI 16.0%, 17.8%), while the prevalence of overweight and obesity increased from 1.6% (95%CI 1.2%, 2.1%) to 15.6% (95%CI 14.7%, 16.5%) and 0.2% (95%CI 0.1%, 0.4%) to 4.1% (95%CI 3.6%, 4.6%), respectively. With the significant increase in the prevalence of overweight and obesity over the 20-year period, there has been a simultaneous decline in the prevalence of underweight. The latest NDHS 2016 illustrated that more Nepalese women were still affected by underweight compared to overweight or obesity (16.9% vs. 15.6% and 4.1%).

3.2. Characteristics of NDHS 2016 Study Participants

A sample of 6165 women aged 15–49 years were extracted from the latest NDHS 2016 dataset. The characteristics of the study participants in relation to the sociodemographic and household environmental factors are outlined in Table 1. The total sample had a mean weight of 50.7 ± 9.6 kg, height of 151.7 ± 5.6 cm, and BMI of 22.0 ± 3.9 kg/m2. Of the total sample, 16.9% were affected by underweight (n = 1040).

3.3. Association of Sociodemographic and Household Environmental Factors with Underweight

Table 1 outlines the unadjusted association of sociodemographic and household environmental factors with underweight. In the univariable analysis, variables that were significant at p < 0.20 were age, educational status, employment status, marital status, number of household members, wealth index, religion, place of residence, province of residence, ecological zone, type of toilet facility, cooking fuel, access to electricity, main floor material, main wall material, and household possessions, including refrigerator, television, mobile phone, bicycle, and motorised vehicle.
Table 2 outlines the independent association of the sociodemographic and household environmental factors with underweight. In the multivariable analysis, age, educational status, marital status, wealth index, religion, province of residence, ecological zone, type of toilet facility, and household possessions, including television and mobile phone, were significantly associated with the risk of being underweight. As compared to women aged 15–24 years, those aged 35–49 years had 53% lower odds of being underweight (AOR = 0.47, 95%CI 0.37, 0.60). Women with secondary education had 27% lower likelihood of being underweight (AOR = 0.73, 95%CI 0.58, 0.93) than those with no formal education. Compared to women who were never married, those who were either widowed, divorced, or separated had 55% lower odds of being underweight (AOR = 0.45, 95%CI 0.26, 0.78). Women with the richest wealth index were 50% less likely to be affected by underweight (AOR = 0.50, 95%CI 0.35, 0.71) than those with poorest wealth index. In comparison with women who were Hindu, women who were Buddhist had 44% lower odds of being underweight (AOR = 0.56, 95%CI 0.36, 0.87). Women who resided in Province 2 had an over two-fold increase in the likelihood of being underweight (AOR = 2.04, 95%CI 1.54, 2.70) compared to women who resided in Province 1. Women living in the Terai ecological zone had 67% higher odds of being underweight (AOR =1.67, 95%CI 1.18, 2.36) than those living in the Mountain ecological zone. Compared to women with unimproved toilet facilities, those with improved toilet facilities had 30% lower odds of being underweight (AOR = 0.70, 95%CI 0.56, 0.86). Women who owned a television had 19% lower likelihood of being underweight (AOR = 0.81, 95%CI 0.67, 0.98) and women who owned a mobile phone had 37% lower odds of being underweight (AOR = 0.63, 95%CI 0.54, 0.74), compared to women who did not own a television and mobile phone, respectively.

4. Discussion

4.1. Summary of Key Findings

From the 1996, 2001, 2006, 2011, and 2016 NDHSs, the current study examined the time trends of the prevalence of underweight (<18.5 kg/m2) among women of reproductive age (15–49 years) in Nepal. From 1996 to 2016, the prevalence of underweight steadily decreased from 25.3% to 16.9%. However, in spite of significant increases in the prevalence of overweight and obesity, more Nepalese women were still affected by underweight than overweight or obesity (16.9% vs. 15.6% and 4.1%) in 2016. From the latest NDHS in 2016, this study examined a wide range of sociodemographic and household environmental correlates of underweight. Sociodemographic factors, such as age, educational status, marital status, wealth index, and religion, were independently associated with the risk of being underweight. Similarly, household environmental factors, such as province of residence, ecological zone, type of toilet facility, and household possessions, including television and mobile phone, were independently associated with the risk of being underweight.

4.2. Time Trends of the Prevalence of Underweight

The present study demonstrated a high prevalence of underweight (16.9%) among women of reproductive age in Nepal, which is consistent with the 17% presented in the NDHS 2016 report [20] and 16.8% presented in a prior study [8]. The prevalence of underweight reported in this study was higher than the rates reported for other South Asian countries, including Bangladesh (11.6%), Maldives (10.4%), and Pakistan (7.9%) [8]. These findings demonstrate that there is an urgent need to address the high prevalence of underweight among Nepalese women of reproductive age as this can lead to adverse health outcomes in women. Underweight mothers are also more likely to give birth to underweight children, causing the repetitive circle of underweight and undernutrition [15]. Moreover, being underweight may reduce a woman’s fertility while increasing her risks of adverse pregnancy outcomes, such as low birth weight, small for gestational age size, preterm birth, and neonatal death [16,17]. Undernutrition in women of reproductive age is also associated with various health complications, including pregnancy and birth related issues and uterine growth retardation leading to maternal and child mortality [12]. Therefore, there is a need to raise awareness at all levels of the society, from policymakers to families, on how maternal nutrition can have severe impacts on the development, health and survival of women and their children [12,38].
The present study identified that while there was a gradual decline in the prevalence of underweight from 1996 to 2016 (25.3% to 16.9%), there was a simultaneous gradual rise in the prevalence of overweight (1.6% to 15.6%) and obesity (0.2% to 4.1%). This finding is in line with the results for the South and Southeast Asian region, where the overall prevalence of underweight decreased from 33.2% in 1996–1999 to 21.6% in 2012–2016, whilst there was a rise in the prevalence of overweight and obesity [18]. This study also highlighted a dual burden of underweight and overweight or obesity among Nepalese women of reproductive age, which has also been confirmed by prior studies among Nepalese adults [22,27]. These findings indicate that while underweight is declining, it is still a major health burden in South Asian countries, including Nepal, and this requires development and implementation of policies and public health approaches that consider the double burden of underweight and overweight [39]. The high prevalence of underweight could be linked with the gaps in national policies, programmes, and care services particularly during pregnancy, combined with poverty and customary practices, which mean that women often fail to receive the nutritional care they need for a healthy pregnancy [40]. The lack of investment in maternal health services, the low prioritisation of nutrition services and the restricted reach of care for pregnant women further compound the difficulties [12,38]. Given the burden of women’s chronic undernutrition across generations, it is essential to prioritise women’s nutritional status, which could be the key to breaking the vicious cycle of underweight and undernutrition in Nepal [16,17].

4.3. Sociodemographic Factors Associated with Underweight

In the current study, sociodemographic factors, such as age, educational status, marital status, wealth index, and religion, were independently associated with the risk of being underweight. Younger women (15–24 years) in this study were more likely to be affected by underweight as compared to older women (25–34 years; 35–49 years). This is in line with the findings of prior studies conducted in Nepal and South Asian countries [39,41,42]. Similarly, women who were never married had higher odds of being underweight than women who were either married/living with a partner or widowed/divorced/separated. This is consistent with a study conducted in Bangladesh where women who were not in union had higher odds of being affected by underweight than currently married women [42]. The finding that older and married women were less likely to be affected by underweight could be linked with gestational weight gain [43], or weight gain with the use of hormonal contraceptives [44]. Therefore, interventions designed to address underweight among Nepalese women of reproductive age could be targeted towards younger and never married women who seem to be at a higher risk of being underweight.
Women with no formal education had higher odds of being underweight in this study than those with formal education (primary, secondary, or higher), which is consistent with the findings from Bangladesh [45] and South and Southeast Asian countries [18]. This finding could be linked with the manual and labour-intensive jobs that women with no formal education could be likely to engage in compared to educated women who may have sedentary occupations [24,46]. Women with the poorest wealth index were most likely to be affected by underweight, while women with the richest wealth index were least likely to be underweight. This is in line with the findings of previous studies in South Asian countries [18,39,45]. The lower odds of underweight among those with richest wealth index could be linked with the reduced likelihood of having labour-intensive jobs and increased income resulting in a greater purchasing ability and consumption of nutritious foods [24]. This study also found an association between religion and being underweight. Dietary patterns and traditional cultural beliefs may have played a vital role in this relationship [24,47]. For instance, pork and alcohol consumption is prohibited in Islam, while vegetarianism is encouraged in Hinduism, which could partly explain the study findings [24,47,48].

4.4. Household Environmental Factors Associated with Underweight

In the present study, household environmental factors, such as province of residence, ecological zone, type of toilet facility, and household possessions, including television and mobile phone, were independently associated with the risk of being underweight. The highest odds of having underweight was observed among women residing in Province 2 and the lowest odds among those residing in Province 4. This could be attributed to the fact that underweight is more prevalent in less affluent provinces while overweight and obesity have been found to be more prevalent in provinces with higher affluence [24,27]. For instance, Province 2 is one of the least developed provinces with human development index (HDI) of 0.422, while Province 4 is one of the most developed with HDI of 0.493 [27]. Women residing in the Terai region were more likely to be affected by underweight compared to those living in Mountain or Hill region, as found in a prior study among Nepalese adults [22]. These findings suggest that the geographical location of residence plays an essential role in the nutritional status of women of reproductive age and should be taken into consideration while developing health promotion interventions.
In this study, women with an unimproved toilet facility were more likely to be affected by underweight than those with an improved facility. An unimproved toilet facility may have a substantial impact on the nutritional status of women by predisposing them to acute respiratory infections, parasitic and helminth infections, diarrhoeal diseases, and undernutrition [13,24,49]. Therefore, continued efforts to increase access to improved toilet facilities is necessary in order to improve the nutritional status of Nepalese women [24]. In this study, women who did not own a television and mobile phone had higher odds of being underweight compared to those who did not. Corroborating the findings of this study, a prior study among Nepalese women found that women who owned a television and mobile phone were likely to have overweight or obesity [24]. However, televisions and mobile phones may be used as effective mediums to raise awareness about the dual burden of underweight and overweight among women of reproductive age in Nepal.

4.5. Limitations and Strengths

There are a few limitations of this study. As a secondary analysis of previously collected data, some factors which may be associated with underweight, such as dietary habits, total energy intake, and physical activity levels could not be explored in this study due to the unavailability of these variables in the NDHS datasets. The sociodemographic and household environmental correlates of underweight investigated in this study were also limited by the available variables contained in the NDHSs datasets. We also acknowledge that the results from the stepwise procedure may be affected by random variation, as many of the predictor variables may be correlated. Therefore, the variables that were excluded from the final model may still have some association with being affected by underweight. Lastly, the data from each survey are not matched, so the prevalence reported in the study only denotes the prevalence at the cross-sectional point of the surveys. Future longitudinal studies may enhance the understanding of the causal and risk factors associated with prolonged exposure.
Nonetheless, there are several strengths of this study. Firstly, the use of standardised procedures for data collection in all NDHS, such as the use of validated questionnaires, calibrated measurement tools and trained field staff, have minimised the possibility of measurement errors and confirms the validity of the study findings. Secondly, the inclusion of large nationally representative samples of women of reproductive age across urban and rural areas in Nepal across different provinces of residence, as well as ecological zones, ensures that the study findings are generalisable. Finally, this study has been successful in comprehensively exploring a broad range of sociodemographic factors and household environmental factors associated with the risk of underweight among women of reproductive age in Nepal, which may assist in streamlining the content of health promotion interventions. Furthermore, as Nepal is accelerating its universal health coverage, as well as restructuring its health structure to a newly constructed federal structure [50], the study findings may also guide policy reforms.

5. Conclusions

The prevalence of underweight among Nepalese women of reproductive age steadily decreased from 25.3% to 16.9% from 1996 to 2016, yet more women were still affected by underweight than overweight or obesity in 2016. Among the investigated sociodemographic factors, women who were younger (15–24 years), without any formal education, who were never married, and with the poorest wealth index had the highest odds of being underweight. Among the explored household environmental factors, women residing in Province 2, residing in the Terai region, with an unimproved toilet facility, and who did not own a television and a mobile phone had the highest odds of being underweight. The key sociodemographic and household environmental correlates of underweight presented in this study may assist in streamlining the content of health promotion campaigns to address undernutrition. The study findings may also facilitate the integration of targeted sociodemographic and household environmental interventions into nutrition programs, which may assist in reducing the burden of underweight and potentially mitigate any adverse maternal and child health outcomes.

Supplementary Materials

The following supporting information can be downloaded at: https://www.mdpi.com/article/10.3390/ijerph191811737/s1, Table S1: Explanatory variables categorisation based on the NDHS datasets.

Author Contributions

Conceptualisation, K.R., R.C. (Ritesh Chimoriya), and A.A.; data analysis, K.R. and R.C. (Ritesh Chimoriya); writing—original draft preparation, K.R., R.C. (Ritesh Chimoriya), N.B.H., R.C. (Romila Chimoriya), and A.A.; writing—critical review and editing, K.R., R.C. (Ritesh Chimoriya), M.K.P., M.E., and A.A. All authors have read and agreed to the published version of the manuscript.

Funding

This research received no external funding.

Institutional Review Board Statement

Ethical approval for all NDHSs were obtained by the DHS Program from the Ethical Review Board of Nepal Health Research Council and Human Research Ethics Committee of Inner City Fund (ICF) Macro International. The DHS Program granted approval to use the NDHSs datasets for the purpose of this registered research paper on 12 July 2022 (Authorisation Letter 171006).

Informed Consent Statement

The DHS Program obtained informed consent from all participants.

Data Availability Statement

Restrictions apply to the availability of the data used in this study. The data were obtained from the DHS Program website and are available at: https://dhsprogram.com/data/available-datasets.cfm (accessed on 10 June 2022) with permission of DHS Program.

Acknowledgments

The authors acknowledge the DHS Program for their permission to access and use the NDHSs datasets for this study. K.R., R.C. (Ritesh Chimoriya) and R.C. (Romila Chimoriya) would like to extend their appreciation to all members of Philanthropy Nepal (Paropakari Nepal) Research Collaboration for their continued support.

Conflicts of Interest

The authors declare no conflict of interest.

References

  1. United Nations Children’s Fund (UNICEF); World Health Organization; International Bank for Reconstruction and Development/The World Bank. Levels and Trends in Child Malnutrition: Key Findings of the 2021 Edition of the Joint Child Malnutrition Estimates; World Health Organization: Geneva, Switzerland, 2021.
  2. Popkin, B.M.; Corvalan, C.; Grummer-Strawn, L.M. Dynamics of the double burden of malnutrition and the changing nutrition reality. Lancet 2020, 395, 65–74. [Google Scholar] [CrossRef]
  3. Development Initiatives. 2020 Global Nutrition Report: Action on Equity to End Malnutrition; Development Initiatives: Bristol, UK, 2020. [Google Scholar]
  4. Müller, O.; Krawinkel, M. Malnutrition and health in developing countries. CMAJ 2005, 173, 279–286. [Google Scholar] [CrossRef] [PubMed]
  5. Levinson, F.J.; Bassett, L. Malnutrition Is Still a Major Contributor to Child Deaths; Population Reference Bureau: Washington, DC, USA, 2007. [Google Scholar]
  6. Black, R.E.; Allen, L.H.; Bhutta, Z.A.; Caulfield, L.E.; de Onis, M.; Ezzati, M.; Mathers, C.; Rivera, J. Maternal and child undernutrition: Global and regional exposures and health consequences. Lancet 2008, 371, 243–260. [Google Scholar] [CrossRef]
  7. Ford, N.D.; Patel, S.A.; Narayan, K.M. Obesity in Low- and Middle-Income Countries: Burden, Drivers, and Emerging Challenges. Annu. Rev. Public Health 2017, 38, 145–164. [Google Scholar] [CrossRef]
  8. Ferdausi, F.; Al-Zubayer, M.A.; Keramat, S.A.; Ahammed, B. Prevalence and associated factors of underweight and overweight/obesity among reproductive-aged women: A pooled analysis of data from South Asian countries (Bangladesh, Maldives, Nepal and Pakistan). Diabetes Metab. Syndr. 2022, 16, 102428. [Google Scholar] [CrossRef]
  9. Rai, A.; Gurung, S.; Thapa, S.; Saville, N.M. Correlates and inequality of underweight and overweight among women of reproductive age: Evidence from the 2016 Nepal demographic health survey. PLoS ONE 2019, 14, e0216644. [Google Scholar] [CrossRef]
  10. Nubé, M.; Van Den Boom, G.J. Gender and adult undernutrition in developing countries. Ann. Hum. Biol. 2003, 30, 520–537. [Google Scholar] [CrossRef]
  11. Seferidi, P.; Hone, T.; Duran, A.C.; Bernabe-Ortiz, A.; Millett, C. Global inequalities in the double burden of malnutrition and associations with globalisation: A multilevel analysis of Demographic and Health Surveys from 55 low-income and middle-income countries, 1992–2018. Lancet Glob. Health 2022, 10, e482–e490. [Google Scholar] [CrossRef]
  12. Biswas, T.; Townsend, N.; Magalhaes, R.; Hasan, M.M.; Mamun, A.A. Geographical and socioeconomic inequalities in the double burden of malnutrition among women in Southeast Asia: A population-based study. Lancet Reg. Health Southeast Asia 2022, 1, 100007. [Google Scholar] [CrossRef]
  13. Morakinyo, O.M.; Adebowale, A.S.; Obembe, T.A.; Oloruntoba, E.O. Association between household environmental conditions and nutritional status of women of childbearing age in Nigeria. PLoS ONE 2020, 15, e0243356. [Google Scholar] [CrossRef]
  14. Black, R.E.; Victora, C.G.; Walker, S.P.; Bhutta, Z.A.; Christian, P.; de Onis, M.; Ezzati, M.; Grantham-McGregor, S.; Katz, J.; Martorell, R.; et al. Maternal and child undernutrition and overweight in low-income and middle-income countries. Lancet 2013, 382, 427–451. [Google Scholar] [CrossRef]
  15. Mtumwa, A.H.; Paul, E.; Vuai, S.A.H. Determinants of undernutrition among women of reproductive age in Tanzania mainland. South Afr. J. Clin. Nutr. 2016, 29, 75–81. [Google Scholar] [CrossRef]
  16. Han, Z.; Mulla, S.; Beyene, J.; Liao, G.; McDonald, S.D. Maternal underweight and the risk of preterm birth and low birth weight: A systematic review and meta-analyses. Int. J. Epidemiol. 2011, 40, 65–101. [Google Scholar] [CrossRef] [PubMed]
  17. Al Kibria, G.M. Prevalence and factors affecting underweight, overweight and obesity using Asian and World Health Organization cutoffs among adults in Nepal: Analysis of the demographic and health survey 2016. Obes. Res. Clin. Pract. 2019, 13, 129–136. [Google Scholar] [CrossRef]
  18. Biswas, T.; Townsend, N.; Magalhaes, R.J.S.; Islam, M.S.; Hasan, M.M.; Mamun, A. Current progress and future directions in the double burden of malnutrition among women in South and Southeast Asian countries. Curr. Dev. Nutr. 2019, 3, nzz026. [Google Scholar] [CrossRef]
  19. United Nations. Transforming Our World: The 2030 Agenda for Sustainable Development; United Nations: New York, NY, USA, 2015.
  20. Ministry of Health Nepal; New ERA; ICF. Nepal Demographic and Health Survey 2016; MOH Nepal; New ERA; ICF: Kathmandu, Nepal, 2017.
  21. Schwinger, C.; Chandyo, R.K.; Ulak, M.; Hysing, M.; Shrestha, M.; Ranjitkar, S.; Strand, T.A. Prevalence of underweight, overweight, and obesity in adults in Bhaktapur, Nepal in 2015–2017. Front. Nutr. 2020, 7, 567164. [Google Scholar] [CrossRef]
  22. Rawal, L.B.; Kanda, K.; Mahumud, R.A.; Joshi, D.; Mehata, S.; Shrestha, N.; Poudel, P.; Karki, S.; Renzaho, A. Prevalence of underweight, overweight and obesity and their associated risk factors in Nepalese adults: Data from a nationwide survey, 2016. PLoS ONE 2018, 13, e0205912. [Google Scholar] [CrossRef]
  23. Haddad, L.; Cameron, L.; Barnett, I. The double burden of malnutrition in SE Asia and the Pacific: Priorities, policies and politics. Health Policy Plan 2015, 30, 1193–1206. [Google Scholar] [CrossRef]
  24. Rana, K.; Ghimire, P.; Chimoriya, R.; Chimoriya, R. Trends in the Prevalence of overweight and obesity and associated socioeconomic and household environmental factors among women in Nepal: Findings from the Nepal demographic and health surveys. Obesities 2021, 1, 113–135. [Google Scholar] [CrossRef]
  25. Jones-Smith, J.C.; Gordon-Larsen, P.; Siddiqi, A.; Popkin, B.M. Is the burden of overweight shifting to the poor across the globe? Time trends among women in 39 low- and middle-income countries (1991–2008). Int. J. Obes. 2012, 36, 1114–1120. [Google Scholar] [CrossRef] [Green Version]
  26. Rana, K.; Shrestha, V.; Chimoriya, R. The effect of housing on health and challenges of demographic changes. Glob. J. Sci. Front. Res. 2020, 20, 75–82. [Google Scholar]
  27. Shrestha, N.; Mishra, S.R.; Ghimire, S.; Gyawali, B.; Pradhan, P.M.S.; Schwarz, D. Application of single-level and multi-level modeling approach to examine geographic and socioeconomic variation in underweight, overweight and obesity in Nepal: Findings from NDHS 2016. Sci. Rep. 2020, 10, 2406. [Google Scholar] [CrossRef] [PubMed]
  28. Das Gupta, R.; Haider, S.S.; Hashan, M.R.; Hasan, M.; Sutradhar, I.; Sajal, I.H.; Joshi, H.; Haider, M.R.; Sarker, M. Association between the frequency of television watching and overweight and obesity among women of reproductive age in Nepal: Analysis of data from the Nepal Demographic and Health Survey 2016. PLoS One 2020, 15, e0228862. [Google Scholar] [CrossRef] [PubMed]
  29. DHS Program. The Demographic and Health Surveys (DHS) Program. Available online: https://dhsprogram.com/data/available-datasets.cfm (accessed on 17 June 2022).
  30. DHS Program. Demographic and Health Survey (DHS). Available online: https://dhsprogram.com/Methodology/Survey-Types/DHS.cfm (accessed on 10 June 2022).
  31. DHS Program. Team and Partners. Available online: https://dhsprogram.com/Who-We-Are/About-Us.cfm (accessed on 11 June 2022).
  32. Ministry of Health and Population Nepal; New ERA; ICF International. Nepal Demographic and Health Survey 2011; MOHP Nepal; New ERA; ICF International: Kathmandu, Nepal, 2012.
  33. Ministry of Health and Population Nepal; New ERA; Macro International. Nepal Demographic and Health Survey 2006; MOHP Nepal; New ERA; Macro International: Kathmandu, Nepal, 2007.
  34. Ministry of Health Nepal; New ERA; ORC Macro. Nepal Demographic and Health Survey 2001; MOH Nepal; New ERA; ORC Macro: Calverton, MD, USA, 2002.
  35. Pradhan, A.; Aryal, R.H.; Regmi, G.; Ban, B.; Govindasamy, P. Nepal Family Health Survey 1996; MOH Nepal; New ERA; Macro International: Kathmandu, Nepal, 1997.
  36. World Health Organization. Physical status: The use and interpretation of anthropometry. Report of a WHO Expert Committee. World Health Organ. Tech. Rep. Ser. 1995, 854, 1–452. [Google Scholar]
  37. Hosmer, D.W., Jr.; Lemeshow, S.; Sturdivant, R.X. Applied logistic regression, 3rd ed.; John Wiley & Sons: Hoboken, NJ, USA, 2013. [Google Scholar]
  38. Dewan, M. Malnutrition in women. Stud. Home Comm. Sci. 2008, 2, 7–10. [Google Scholar] [CrossRef]
  39. Biswas, T.; Magalhaes, R.J.S.; Townsend, N.; Das, S.K.; Mamun, A. Double burden of underweight and overweight among women in South and Southeast Asia: A systematic review and meta-analysis. Adv. Nutr. 2020, 11, 128–143. [Google Scholar] [CrossRef]
  40. FAO; IFAD; UNICEF; WFP; WHO. The State of Food Security and Nutrition in the World 2022; FAO: Rome, Italy, 2022. [Google Scholar]
  41. Bhandari, S.; Sayami, J.T.; Thapa, P.; Sayami, M.; Kandel, B.P.; Banjara, M.R. Dietary intake patterns and nutritional status of women of reproductive age in Nepal: Findings from a health survey. Arch. Public Health 2016, 74, 2. [Google Scholar] [CrossRef]
  42. Kamal, S.M.; Hassan, C.H.; Alam, G.M. Dual burden of underweight and overweight among women in Bangladesh: Patterns, prevalence, and sociodemographic correlates. J. Health Popul. Nutr. 2015, 33, 92–105. [Google Scholar]
  43. Kominiarek, M.A.; Peaceman, A.M. Gestational weight gain. Am. J. Obstet. Gynecol. 2017, 217, 642–651. [Google Scholar] [CrossRef]
  44. Marston, C.; Arjyal, A.; Maskey, S.; Regmi, S.; Baral, S. Using qualitative evaluation components to help understand context: Case study of a family planning intervention with female community health volunteers (FCHVs) in Nepal. BMC Health Serv. Res. 2020, 20, 685. [Google Scholar] [CrossRef]
  45. Khanam, M.; Osuagwu, U.L.; Sanin, K.I.; Haque, M.A.; Rita, R.S.; Agho, K.E.; Ahmed, T. Underweight, overweight and obesity among reproductive bangladeshi women: A nationwide survey. Nutrients 2021, 13, 4408. [Google Scholar] [CrossRef] [PubMed]
  46. Tanwi, T.S.; Chakrabarty, S.; Hasanuzzaman, S.; Saltmarsh, S.; Winn, S. Socioeconomic correlates of overweight and obesity among ever-married urban women in Bangladesh. BMC Public Health 2019, 19, 842. [Google Scholar] [CrossRef] [PubMed]
  47. Bharmal, N.H.; McCarthy, W.J.; Gadgil, M.D.; Kandula, N.R.; Kanaya, A.M. The association of religious affiliation with overweight/obesity among South Asians: The mediators of atherosclerosis in South Asians living in America (MASALA) study. J. Relig. Health 2018, 57, 33–46. [Google Scholar] [CrossRef] [PubMed]
  48. Tan, M.M.; Chan, C.K.; Reidpath, D.D. Religiosity and spirituality and the intake of fruit, vegetable, and fat: A systematic review. Evid. Based Complement Alternat. Med. 2013, 2013, 146214. [Google Scholar] [CrossRef] [PubMed]
  49. Van Minh, H.; Nguyen-Viet, H. Economic aspects of sanitation in developing countries. Environ. Health Insights 2011, 5, 63–70. [Google Scholar] [CrossRef] [PubMed]
  50. Thapa, R.; Bam, K.; Tiwari, P.; Sinha, T.K.; Dahal, S. Implementing federalism in the health system of Nepal: Opportunities and challenges. Int. J. Health Policy Manag. 2019, 8, 195–198. [Google Scholar] [CrossRef] [PubMed]
Figure 1. Time trends of the prevalence of underweight as compared to overweight and obesity from 1996 to 2016 among women of reproductive age in Nepal.
Ijerph 19 11737 g001
Table 1. Characteristics of the study participants and unadjusted association of sociodemographic and household environmental factors with underweight.
VariableTotal Sample (n = 6165)Underweight (BMI < 18.5)
n (%) or Mean ± SDCOR95%CIp-Value
Weight (kg)50.7 ± 9.6
Height (cm)151.7 ± 5.6
BMI (kg/m2)22.0 ± 3.9
Sociodemographic factors
Individual-level factors
Age (years)
15–242331 (37.8%)ref
25–341834 (29.7%)0.460.39–0.54<0.001
35–492000 (32.4%)0.440.38–0.52<0.001
Educational status
No formal education2126 (34.5%)ref
Primary965 (15.7%)0.790.64–0.980.030
Secondary2223 (36.1%)0.990.85–1.150.860
Higher851 (13.8%)0.690.55–0.870.001
Employment status
Not currently employed2498 (40.5%)ref
Currently employed3667 (59.5%)0.770.68–0.88<0.001
Family-level factors
Marital status
Never married1323 (21.5%)ref
Married/living with a partner4671 (75.7%)0.440.38–0.51<0.001
Widowed/divorced/separated171 (2.8%)0.330.20–0.55<0.001
Number of household members
≤ 53763 (61.0%)ref
> 52402 (39.0%)1.381.21–1.59<0.001
Wealth index*
Poorest1310 (21.2%)ref
Poorer1250 (20.3%)1.080.88–1.310.466
Middle1251 (20.3%)1.080.88–1.310.472
Richer1276 (20.7%)0.840.68–1.030.086
Richest1078 (17.5%)0.430.34–0.56<0.001
Religion
Hindu5369 (87.1%)ref
Buddhist296 (4.8%)0.450.30–0.68<0.001
Muslim267 (4.3%)1.861.41–2.45<0.001
Other233 (3.8%)0.510.32–0.790.003
Household environmental factors
Environmental factors
Place of residence
Urban3984 (64.6%)ref
Rural2181 (35.4%)1.201.05–1.380.008
Province of residence
Province 1878 (14.2%)ref
Province 2984 (16.0%)2.612.05–3.34<0.001
Province 3822 (13.3%)0.840.62–1.130.242
Province 4783 (12.7%)0.640.47–0.890.007
Province 5962 (15.6%)1.611.24–2.08<0.001
Province 6862 (14.0%)1.321.01–1.730.045
Province 7874 (14.2%)1.951.51–2.52<0.001
Ecological zone
Mountain441 (7.2%)ref
Hill2823 (45.7%)0.900.67–1.200.458
Terai2901 (47.1%)1.601.21–2.120.001
Household facilities
Source of drinking water
Unimproved344 (5.6%)ref
Improved5549 (90%)1.030.77–1.370.866
Type of toilet facility
Unimproved747 (12.1%)ref
Improved5146 (83.5%)0.440.37–0.52<0.001
Cooking fuel
Solid fuel4201 (68.1%)ref
Clean fuel1690 (27.4%)0.480.40–0.57<0.001
Access to electricity
No592 (9.6%)ref
Yes5301 (86.0%)0.620.50–0.75<0.001
Housing characteristics
Main floor material
Unimproved3815 (61.9%)ref
Improved2078 (33.7%)0.530.45–0.62<0.001
Main wall material
Unimproved3255 (52.8%)ref
Improved2638 (42.8%)0.700.61–0.80<0.001
Main roof material
Unimproved635 (10.3%)ref
Improved5258 (85.3%)0.880.71–1.090.232
Household possessions
Refrigerator
No5013 (81.3%)ref
Yes880 (14.3%)0.470.37–0.59<0.001
Television
No2793 (45.3%)ref
Yes3100 (50.3%)0.570.50–0.66<0.001
Mobile phone
No1747 (28.3%)ref
Yes4418 (71.7%)0.460.41–0.53<0.001
Bicycle
No3522 (57.1%)ref
Yes2371 (38.5%)1.451.26–1.66<0.001
Motorised vehicle
No4782 (77.6%)ref
Yes1111 (18.0%)0.750.62–0.900.002
The total of the categories might not always add up to the total sample due to missing data for some items. n: sample size. SD: standard deviation. BMI: body mass index. COR: crude odds ratio. 95%CI: 95% confidence interval. ref: reference category. * The categories for the wealth index are as provided by the DHS program.
Table 2. Independent association of the sociodemographic and household environmental factors with underweight.
VariableUnderweight (BMI < 18.5)
AOR95%CIp-Value
Sociodemographic factors
Individual-level factors
Age (years)
15–24ref
25–340.570.46–0.71<0.001
35–490.470.37–0.60<0.001
Educational status
No formal educationref
Primary0.760.60–0.970.027
Secondary0.730.58–0.930.010
Higher0.770.56–1.050.099
Family-level factors
Marital status
Never marriedref
Married/living with a partner0.540.44–0.67<0.001
Widowed/divorced/separated0.450.26–0.780.005
Wealth index*
Poorestref
Poorer0.990.79–1.230.894
Middle0.760.58–0.990.040
Richer0.750.56–1.010.055
Richest0.500.35–0.71<0.001
Religion
Hinduref
Buddhist0.560.36–0.870.011
Muslim1.080.78–1.480.655
Other0.560.35–0.900.016
Household environmental factors
Environmental factors
Province of residence
Province 1ref
Province 22.041.54–2.70<0.001
Province 31.080.77–1.510.671
Province 40.820.58–1.170.266
Province 51.411.07–1.860.016
Province 61.300.95–1.790.102
Province 71.671.27–2.21<0.001
Ecological zone
Mountainref
Hill1.240.91–1.690.176
Terai1.671.18–2.360.004
Household facilities
Type of toilet facility
Unimprovedref
Improved0.700.56–0.86<0.001
Household possessions
Television
Noref
Yes0.810.67–0.980.030
Mobile phone
Noref
Yes0.630.54–0.74<0.001
The final model includes those variables, which when eliminated, cause a significant change in deviance (p < 0.05), compared with the corresponding X2 test statistic on the relevant degrees of freedom. BMI: body mass index. AOR: adjusted odds ratio. 95%CI: 95% confidence interval. ref: reference category. * The categories for the wealth index are as provided by the DHS program.
Publisher’s Note: MDPI stays neutral with regard to jurisdictional claims in published maps and institutional affiliations.

