
Global Research Trends of Artificial Intelligence on Histopathological Images: A 20-Year Bibliometric Analysis

Abstract
1. Introduction
2. Materials and Methods
2.1. Search Methods
2.2. Bibliometric Analysis Methods
3. Results
3.1. Global Publications Trends
3.2. Countries and Regions
3.3. Institutions
3.4. Authors
3.5. Journals
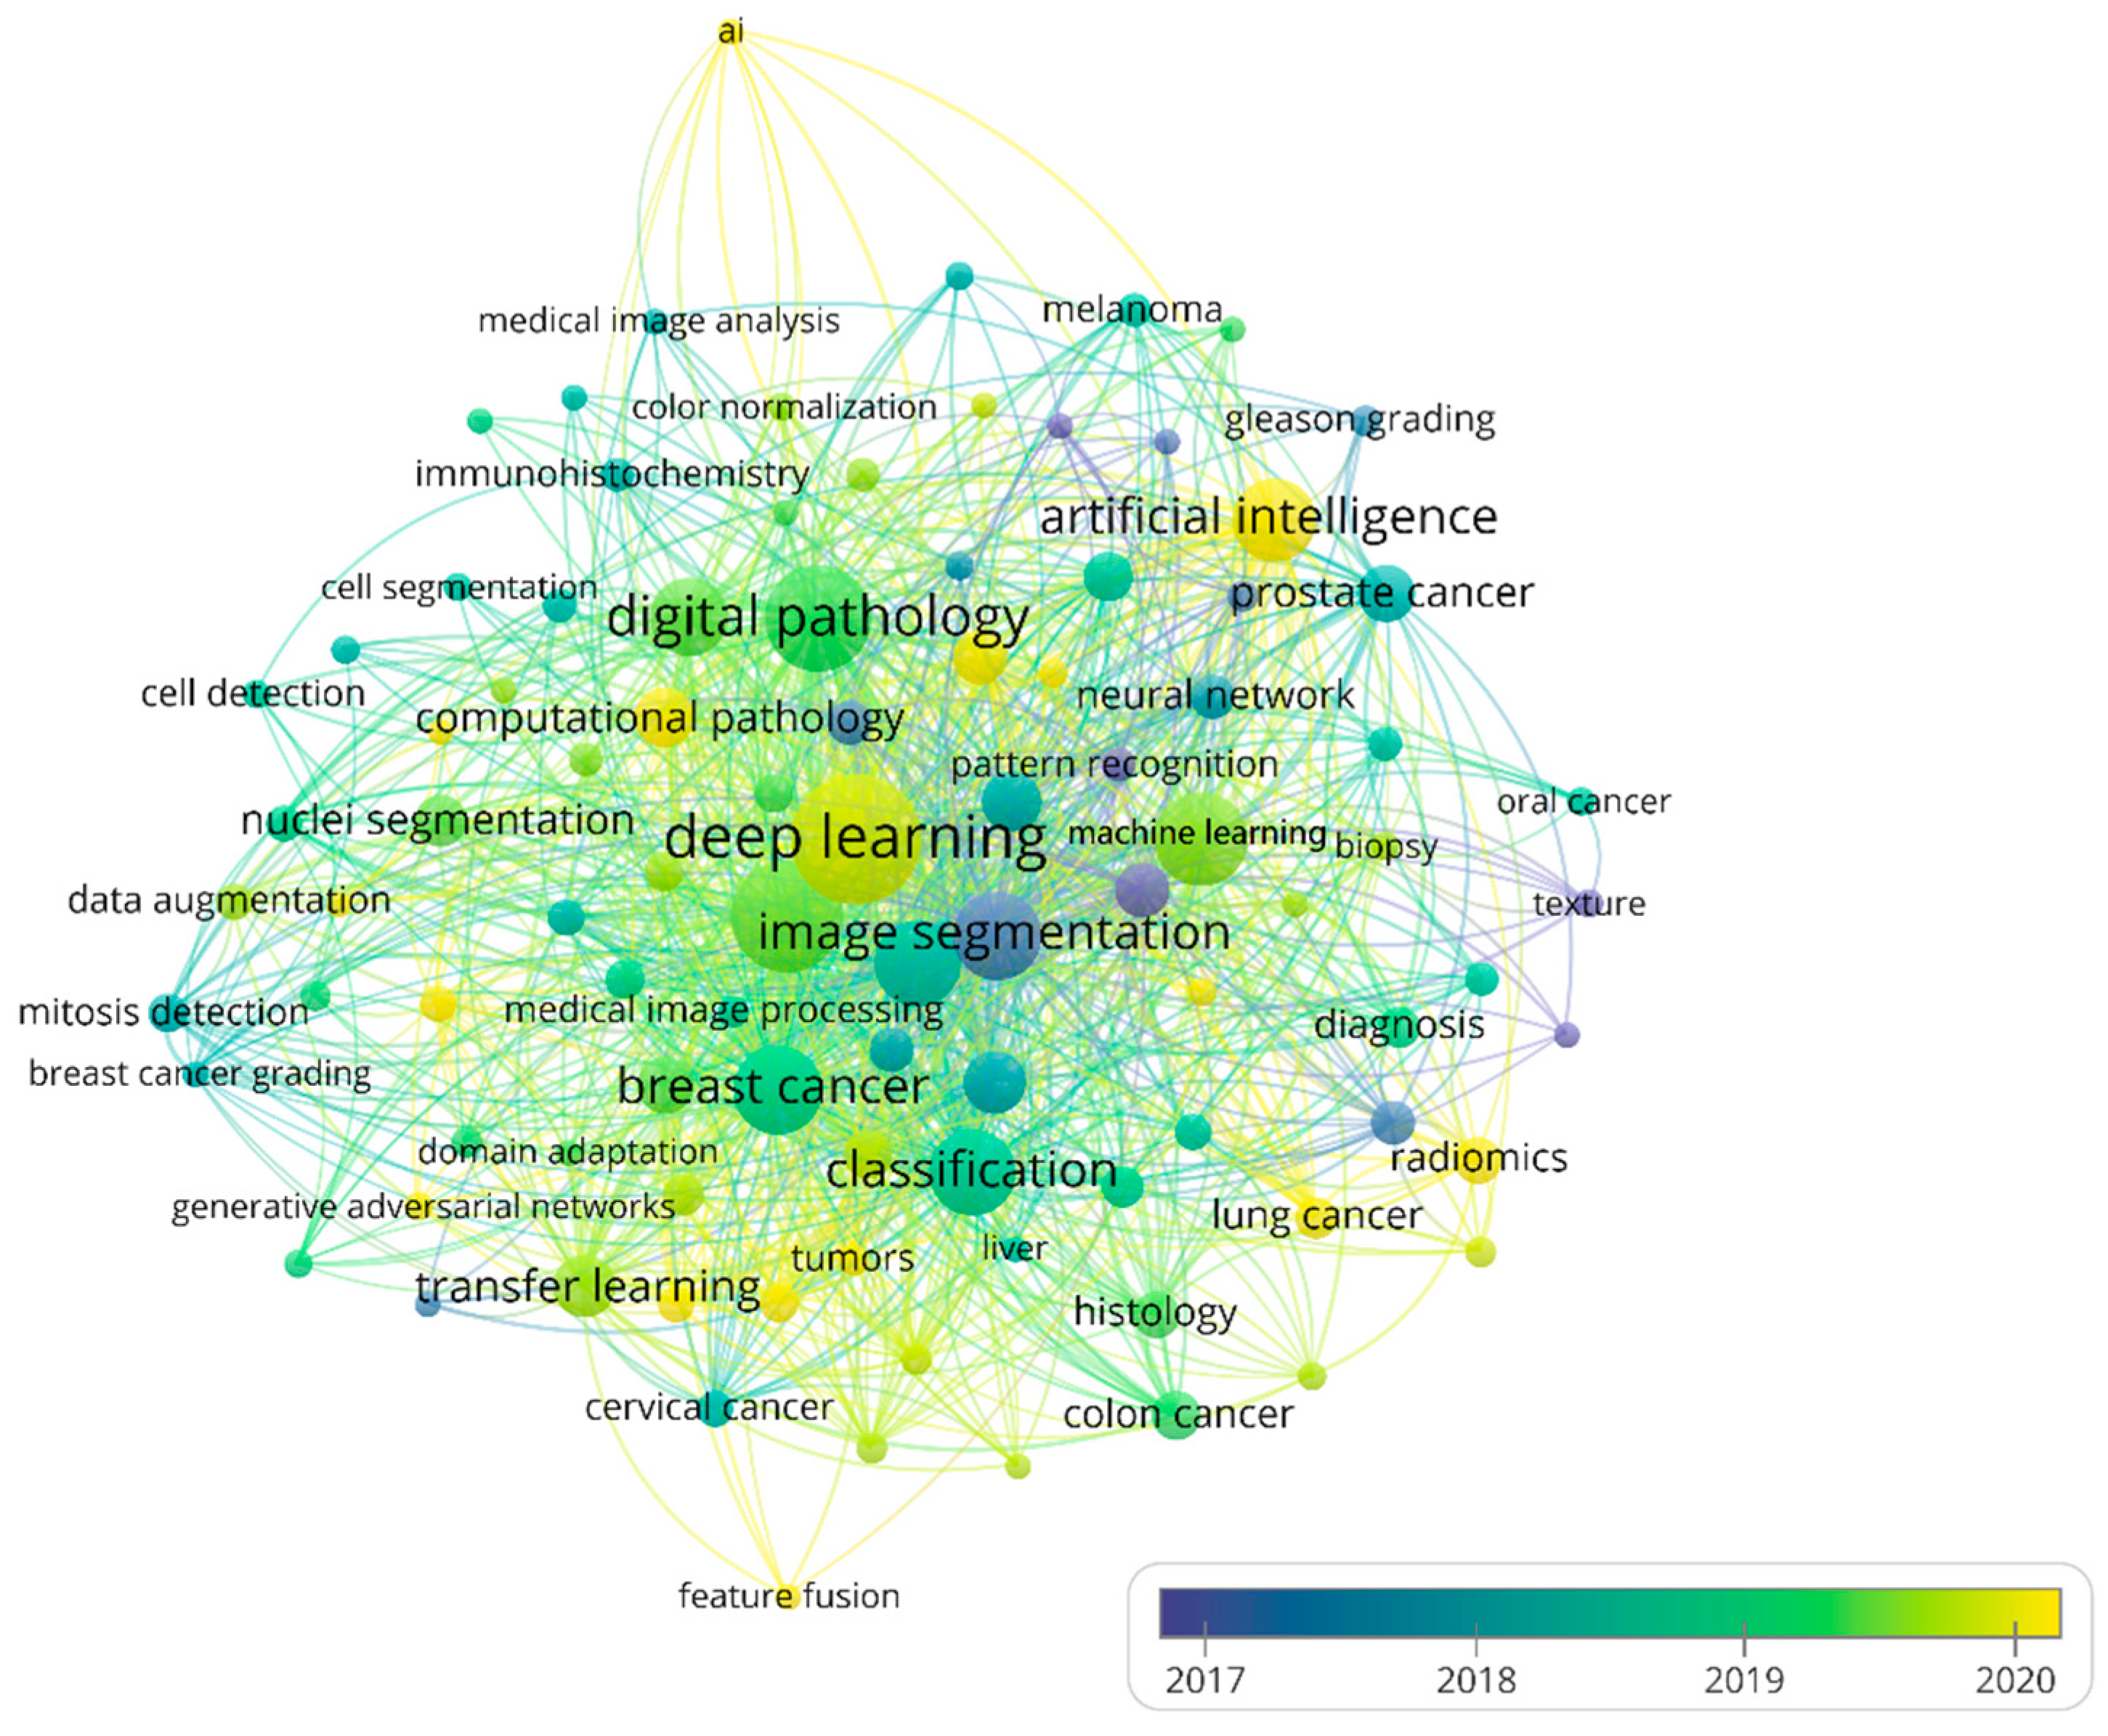
3.6. Keywords
3.7. Co-Citation References
4. Discussion
Limitations
5. Conclusions
Supplementary Materials
Author Contributions
Funding
Institutional Review Board Statement
Informed Consent Statement
Data Availability Statement
Acknowledgments
Conflicts of Interest
References
- Mao, J.J.; Pillai, G.G.; Andrade, C.J.; Ligibel, J.A.; Basu, P.; Cohen, L.; Khan, I.A.; Mustian, K.M.; Puthiyedath, R.; Dhiman, K.S. Integrative oncology: Addressing the global challenges of cancer prevention and treatment. CA Cancer J. Clin. 2022, 72, 144–164. [Google Scholar] [CrossRef] [PubMed]
- Underwood, J.C. More than meets the eye: The changing face of histopathology. Histopathology 2017, 70, 4–9. [Google Scholar] [CrossRef] [PubMed]
- Zhang, C.; Lu, Y. Study on artificial intelligence: The state of the art and future prospects. J. Ind. Inf. Integr. 2021, 23, 100224. [Google Scholar] [CrossRef]
- Wang, K.S.; Yu, G.; Xu, C.; Meng, X.H.; Zhou, J.; Zheng, C.; Deng, Z.; Shang, L.; Liu, R.; Su, S.; et al. Accurate diagnosis of colorectal cancer based on histopathology images using artificial intelligence. BMC Med. 2021, 19, 76. [Google Scholar] [CrossRef] [PubMed]
- Spanhol, F.A.; Oliveira, L.S.; Petitjean, C.; Heutte, L. A Dataset for Breast Cancer Histopathological Image Classification. IEEE Trans. Biomed. Eng. 2016, 63, 1455–1462. [Google Scholar] [CrossRef]
- Chen, M.Y.; Zhang, B.; Topatana, W.; Cao, J.S.; Zhu, H.P.; Juengpanich, S.; Mao, Q.J.; Yu, H.; Cai, X.J. Classification and mutation prediction based on histopathology H&E images in liver cancer using deep learning. NPJ Precis. Oncol. 2020, 4, 14. [Google Scholar] [CrossRef]
- Coudray, N.; Ocampo, P.S.; Sakellaropoulos, T.; Narula, N.; Snuderl, M.; Fenyo, D.; Moreira, A.L.; Razavian, N.; Tsirigos, A. Classification and mutation prediction from non-small cell lung cancer histopathology images using deep learning. Nat. Med. 2018, 24, 1559–1567. [Google Scholar] [CrossRef]
- Huang, J.J.; Wang, T.; Zheng, D.Q.; He, Y.J. Nucleus segmentation of cervical cytology images based on multi-scale fuzzy clustering algorithm. Bioengineered 2020, 11, 484–501. [Google Scholar] [CrossRef]
- Zhao, J.; Dai, L.; Zhang, M.; Yu, F.; Li, M.; Li, H.F.; Wang, W.J.; Zhang, L. PGU-net plus: Progressive Growing of U-net plus for Automated Cervical Nuclei Segmentation. In Proceedings of the 1st International Workshop on Multiscale Multimodal Medical Imaging (MMMI), Shenzhen, China, 13 October 2019; pp. 51–58. [Google Scholar]
- Wang, X.D.; Chen, Y.; Gao, Y.S.; Zhang, H.Q.; Guan, Z.H.; Dong, Z.; Zheng, Y.X.; Jiang, J.R.; Yang, H.Q.; Wang, L.M.; et al. Predicting gastric cancer outcome from resected lymph node histopathology images using deep learning. Nat. Commun. 2021, 12, 1637. [Google Scholar] [CrossRef]
- Wulczyn, E.; Steiner, D.F.; Moran, M.; Plass, M.; Reihs, R.; Tan, F.; Flament-Auvigne, I.; Brown, T.; Regitnig, P.; Chen, P.H.C.; et al. Interpretable survival prediction for colorectal cancer using deep learning. NPJ Digit. Med. 2021, 4, 71. [Google Scholar] [CrossRef]
- Ahmad, Z.; Rahim, S.; Zubair, M.; Abdul-Ghafar, J. Artificial intelligence (AI) in medicine, current applications and future role with special emphasis on its potential and promise in pathology: Present and future impact, obstacles including costs and acceptance among pathologists, practical and philosophical considerations. A comprehensive review. Diagn. Pathol. 2021, 16, 24. [Google Scholar] [PubMed]
- Försch, S.; Klauschen, F.; Hufnagl, P.; Roth, W. Artificial intelligence in pathology. Dtsch. Ärzteblatt Int. 2021, 118, 199. [Google Scholar]
- Steiner, D.F.; Nagpal, K.; Sayres, R.; Foote, D.J.; Wedin, B.D.; Pearce, A.; Cai, C.J.; Winter, S.R.; Symonds, M.; Yatziv, L. Evaluation of the use of combined artificial intelligence and pathologist assessment to review and grade prostate biopsies. JAMA Netw. Open 2020, 3, e2023267. [Google Scholar] [CrossRef] [PubMed]
- Donthu, N.; Kumar, S.; Mukherjee, D.; Pandey, N.; Lim, W.M. How to conduct a bibliometric analysis: An overview and guidelines. J. Bus. Res. 2021, 133, 285–296. [Google Scholar] [CrossRef]
- Duchene, D.A.; Lotan, Y.; Cadeddu, J.A.; Sagalowsky, A.I.; Koeneman, K.S. Histopathology of surgically managed renal tumors: Analysis of a contemporary series. Urology 2003, 62, 827–830. [Google Scholar] [CrossRef]
- Colling, R.; Pitman, H.; Oien, K.; Rajpoot, N.; Macklin, P.; CM-Path AI in Histopathology Working Group; Bachtiar, V.; Booth, R.; Bryant, A.; Bull, J. Artificial intelligence in digital pathology: A roadmap to routine use in clinical practice. J. Pathol. 2019, 249, 143–150. [Google Scholar] [CrossRef]
- Sultan, A.S.; Elgharib, M.A.; Tavares, T.; Jessri, M.; Basile, J.R. The use of artificial intelligence, machine learning and deep learning in oncologic histopathology. J. Oral Pathol. Med. 2020, 49, 849–856. [Google Scholar] [CrossRef]
- Kayser, K.; GĂśrtler, J.; Bogovac, M.; Bogovac, A.; Goldmann, T.; Vollmer, E.; Kayser, G. AI (artificial intelligence) in histopathology—From image analysis to automated diagnosis. Folia Histochem. Cytobiol. 2009, 47, 355–361. [Google Scholar] [CrossRef] [PubMed][Green Version]
- Khairi, S.S.M.; Abu Bakar, M.A.; Alias, M.A.; Abu Bakar, S.; Liong, C.Y.; Rosli, N.; Farid, M. Deep Learning on Histopathology Images for Breast Cancer Classification: A Bibliometric Analysis. Healthcare 2022, 10, 10. [Google Scholar] [CrossRef]
- Lin, T.; Shen, Z.; Wu, H.; Chen, Z.; Hu, J.; Pan, J.; Kong, J. The global research of artificial intelligence on prostate cancer: A 22-year bibliometric analysis. Front. Oncol. 2022, 12, 843735. [Google Scholar]
- Trujillo, C.M.; Long, T.M. Document co-citation analysis to enhance transdisciplinary research. Sci. Adv. 2018, 4, e1701130. [Google Scholar] [CrossRef] [PubMed]
- van Eck, N.J.; Waltman, L. Software survey: VOSviewer, a computer program for bibliometric mapping. Scientometrics 2010, 84, 523–538. [Google Scholar] [CrossRef]
- Chen, C. Searching for intellectual turning points: Progressive knowledge domain visualization. Proc. Natl. Acad. Sci. USA 2004, 101, 5303–5310. [Google Scholar] [CrossRef] [PubMed]
- Rawashdeh, M.; Ralescu, A. Center-wise intra-inter silhouettes. In Proceedings of the International Conference on Scalable Uncertainty Management, Marburg, Germany, 17–19 September 2012; pp. 406–419. [Google Scholar]
- Muff, S.; Rao, F.; Caflisch, A. Local modularity measure for network clusterizations. Phys. Rev. E 2005, 72, 056107. [Google Scholar] [CrossRef]
- Chen, C.; Leydesdorff, L. Patterns of connections and movements in dual-map overlays: A new method of publication portfolio analysis. J. Assoc. Inf. Sci. Technol. 2014, 65, 334–351. [Google Scholar] [CrossRef]
- Litjens, G.; Kooi, T.; Bejnordi, B.E.; Setio, A.A.A.; Ciompi, F.; Ghafoorian, M.; Van Der Laak, J.A.; Van Ginneken, B.; Sánchez, C.I. A survey on deep learning in medical image analysis. Med. Image Anal. 2017, 42, 60–88. [Google Scholar] [CrossRef]
- Tourassi, G.D.; Markey, M.K.; Lo, J.Y.; Floyd, C.E., Jr. A neural network approach to breast cancer diagnosis as a constraint satisfaction problem. Med. Phys. 2001, 28, 804–811. [Google Scholar] [CrossRef]
- Wang, Y.; Crookes, D.; Eldin, O.S.; Wang, S.; Hamilton, P.; Diamond, J. Assisted diagnosis of cervical intraepithelial neoplasia (CIN). IEEE J. Sel. Top. Signal Processing 2009, 3, 112–121. [Google Scholar] [CrossRef]
- Kothari, S.; Phan, J.H.; Stokes, T.H.; Wang, M.D. Pathology imaging informatics for quantitative analysis of whole-slide images. J. Am. Med. Inf. Assoc. 2013, 20, 1099–1108. [Google Scholar] [CrossRef]
- Mobadersany, P.; Yousefi, S.; Amgad, M.; Gutman, D.A.; Barnholtz-Sloan, J.S.; Vega, J.E.V.; Brat, D.J.; Cooper, L.A.D. Predicting cancer outcomes from histology and genomics using convolutional networks. Proc. Natl. Acad. Sci. USA 2018, 115, E2970–E2979. [Google Scholar] [CrossRef]
- Saltz, J.; Gupta, R.; Hou, L.; Kurc, T.; Singh, P.; Nguyen, V.; Samaras, D.; Shroyer, K.R.; Zhao, T.H.; Batiste, R.; et al. Spatial Organization and Molecular Correlation of Tumor-Infiltrating Lymphocytes Using Deep Learning on Pathology Images. Cell Rep. 2018, 23, 181–193. [Google Scholar] [CrossRef] [PubMed]
- Sirinukunwattana, K.; Raza, S.E.A.; Tsang, Y.W.; Snead, D.R.J.; Cree, I.A.; Rajpoot, N.M. Locality Sensitive Deep Learning for Detection and Classification of Nuclei in Routine Colon Cancer Histology Images. IEEE Trans. Med. Imaging 2016, 35, 1196–1206. [Google Scholar] [CrossRef] [PubMed]
- Graham, S.; Vu, Q.D.; Raza, S.E.A.; Azam, A.; Tsang, Y.W.; Kwak, J.T.; Rajpoot, N. Hover-Net: Simultaneous segmentation and classification of nuclei in multi-tissue histology images. Med. Image Anal. 2019, 58, 101563. [Google Scholar] [CrossRef] [PubMed]
- Qaiser, T.; Sirinukunwattana, K.; Nakane, K.; Tsang, Y.W.; Epstein, D.; Rajpoot, N. Persistent Homology for Fast Tumor Segmentation in Whole Slide Histology Images. In Proceedings of the 20th Conference on Medical Image Understanding and Analysis (MIUA), Loughborough Univ, Loughborough, UK, 6–8 July 2016; pp. 119–124. [Google Scholar]
- Esteva, A.; Kuprel, B.; Novoa, R.A.; Ko, J.; Swetter, S.M.; Blau, H.M.; Thrun, S. Dermatologist-level classification of skin cancer with deep neural networks. Nature 2017, 542, 115–118. [Google Scholar] [CrossRef] [PubMed]
- Agner, S.C.; Rosen, M.A.; Englander, S.; Tomaszewski, J.E.; Feldman, M.D.; Zhang, P.; Mies, C.; Schnall, M.D.; Madabhushi, A. Computerized image analysis for identifying triple-negative breast cancers and differentiating them from other molecular subtypes of breast cancer on dynamic contrast-enhanced MR images: A feasibility study. Radiology 2014, 272, 91. [Google Scholar] [CrossRef] [PubMed]
- Wang, H.; Roa, A.C.; Basavanhally, A.N.; Gilmore, H.L.; Shih, N.; Feldman, M.; Tomaszewski, J.; Gonzalez, F.; Madabhushi, A. Mitosis detection in breast cancer pathology images by combining handcrafted and convolutional neural network features. J. Med. Imaging 2014, 1, 034003. [Google Scholar] [CrossRef]
- Xu, J.; Xiang, L.; Liu, Q.; Gilmore, H.; Wu, J.; Tang, J.; Madabhushi, A. Stacked sparse autoencoder (SSAE) for nuclei detection on breast cancer histopathology images. IEEE Trans. Med. Imaging 2015, 35, 119–130. [Google Scholar] [CrossRef]
- Basavanhally, A.; Ganesan, S.; Shih, N.; Mies, C.; Feldman, M.; Tomaszewski, J.; Madabhushi, A. A boosted classifier for integrating multiple fields of view: Breast cancer grading in histopathology. In Proceedings of the 2011 IEEE International Symposium on Biomedical Imaging: From Nano to Macro, Chicago, IL, USA, 30 March–2 April 2011; pp. 125–128. [Google Scholar]
- Faust, O.; Hagiwara, Y.; Hong, T.J.; Lih, O.S.; Acharya, U.R. Deep learning for healthcare applications based on physiological signals: A review. Comput. Methods Programs Biomed. 2018, 161, 1–13. [Google Scholar] [CrossRef]
- Xia, C.F.; Dong, X.S.; Li, H.; Cao, M.M.; Sun, D.A.Q.; He, S.Y.; Yang, F.; Yan, X.X.; Zhang, S.L.; Li, N.; et al. Cancer statistics in China and United States, 2022: Profiles, trends, and determinants. Chin. Med. J. 2022, 135, 584–590. [Google Scholar] [CrossRef]
- Ronneberger, O.; Fischer, P.; Brox, T. U-net: Convolutional networks for biomedical image segmentation. In Proceedings of the International Conference on Medical Image Computing and Computer-Assisted Intervention, Munich, Germany, 5–9 October 2015; pp. 234–241. [Google Scholar]
- Chen, C.M.; Ibekwe-SanJuan, F.; Hou, J.H. The Structure and Dynamics of Cocitation Clusters: A Multiple-Perspective Cocitation Analysis. J. Am. Soc. Inf. Sci. Technol. 2010, 61, 1386–1409. [Google Scholar] [CrossRef]
- Guzmán, M.V.; Chen, C. CiteSpace: A Practical Guide for Mapping Scientific Literature; Nova Science: Hauppauge, NY, USA, 2016; 169p, ISBN 978-1-53610-280-2/978-1-53610-295-6. [Google Scholar]
- Naik, S.; Doyle, S.; Agner, S.; Madabhushi, A.; Feldman, M.; Tomaszewski, J. Automated gland and nuclei segmentation for grading of prostate and breast cancer histopathology. In Proceedings of the 2008 5th IEEE International Symposium on Biomedical Imaging: From Nano to Macro, Paris, France, 14–17 May 2008; pp. 284–287. [Google Scholar]
- Al-Kofahi, Y.; Lassoued, W.; Lee, W.; Roysam, B. Improved automatic detection and segmentation of cell nuclei in histopathology images. IEEE Trans. Biomed. Eng. 2009, 57, 841–852. [Google Scholar] [CrossRef] [PubMed]
- Sertel, O.; Kong, J.; Lozanski, G.; Shana’ah, A.; Catalyurek, U.; Saltz, J.; Gurcan, M. Texture classification using nonlinear color quantization: Application to histopathological image analysis. In Proceedings of the 2008 IEEE International Conference on Acoustics, Speech and Signal Processing, Las Vegas, NV, USA, 31 March–4 April 2008; pp. 597–600. [Google Scholar]
- Sertel, O.; Kong, J.; Catalyurek, U.V.; Lozanski, G.; Saltz, J.H.; Gurcan, M.N. Histopathological image analysis using model-based intermediate representations and color texture: Follicular lymphoma grading. J. Signal Processing Syst. 2009, 55, 169–183. [Google Scholar] [CrossRef]
- Srinidhi, C.L.; Kim, S.W.; Chen, F.D.; Martel, A.L. Self-supervised driven consistency training for annotation efficient histopathology image analysis. Med. Image Anal. 2022, 75, 102256. [Google Scholar] [CrossRef] [PubMed]
- Mahapatra, D.; Kuanar, S.; Bozorgtabar, B.; Ge, Z.Y. Self-supervised Learning of Inter-label Geometric Relationships for Gleason Grade Segmentation. In Proceedings of the 3rd MICCAI Workshop on Domain Adaptation and Representation Transfer (DART), Strasbourg, France, 27 September–1 October 2021; pp. 57–67. [Google Scholar]
- Li, C.; Xue, D.; Kong, F.J.; Hu, Z.J.; Chen, H.; Yao, Y.D.; Sun, H.Z.; Zhang, L.; Zhang, J.P.; Jiang, T.; et al. Cervical Histopathology Image Classification Using Ensembled Transfer Learning. In Proceedings of the 7th International Conference on Information Technology in Biomedicine (ITIB), Kamien Slaski, Poland, 17–19 June 2019; pp. 26–37. [Google Scholar]
- Buddhavarapu, V.G.; Jothi, J.A.A. An experimental study on classification of thyroid histopathology images using transfer learning. Pattern Recognit. Lett. 2020, 140, 1–9. [Google Scholar] [CrossRef]
- Bejnordi, B.E.; Veta, M.; van Diest, P.J.; van Ginneken, B.; Karssemeijer, N.; Litjens, G.; van der Laak, J.; Consortium, C. Diagnostic Assessment of Deep Learning Algorithms for Detection of Lymph Node Metastases in Women with Breast Cancer. JAMA—J. Am. Med. Assoc. 2017, 318, 2199–2210. [Google Scholar] [CrossRef]
- He, K.; Zhang, X.; Ren, S.; Sun, J. Deep residual learning for image recognition. In Proceedings of the IEEE Conference on Computer Vision and Pattern Recognition, Las Vegas, NV, USA, 27–30 June 2016; pp. 770–778. [Google Scholar]
- Simonyan, K.; Zisserman, A. Very Deep Convolutional Networks for Large-Scale Image Recognition. arXiv 2014, arXiv:1409.1556. [Google Scholar]
- LeCun, Y.; Bengio, Y.; Hinton, G. Deep learning. Nature 2015, 521, 436–444. [Google Scholar] [CrossRef]
- Janowczyk, A.; Madabhushi, A. Deep learning for digital pathology image analysis: A comprehensive tutorial with selected use cases. J. Pathol. Inform. 2016, 7, 29. [Google Scholar] [CrossRef]
- Cireşan, D.C.; Giusti, A.; Gambardella, L.M.; Schmidhuber, J. Mitosis detection in breast cancer histology images with deep neural networks. In Proceedings of the International Conference on Medical Image Computing and Computer-Assisted Intervention, Nagoya, Japan, 22–26 September 2013; pp. 411–418. [Google Scholar]
- Krizhevsky, A.; Sutskever, I.; Hinton, G.E. Imagenet classification with deep convolutional neural networks. In Proceedings of the Advances in Neural Information Processing Systems 25: 26th Annual Conference on Neural Information Processing Systems 2012, Lake Tahoe, NV, USA, 3–6 December 2012. [Google Scholar]
- Althnian, A.; AlSaeed, D.; Al-Baity, H.; Samha, A.; Bin Dris, A.; Alzakari, N.; Abou Elwafa, A.; Kurdi, H. Impact of Dataset Size on Classification Performance: An Empirical Evaluation in the Medical Domain. Appl. Sci. 2021, 11, 796. [Google Scholar] [CrossRef]
- Thian, Y.L.; Ng, D.W.; Hallinan, J.; Jagmohan, P.; Sia, S.Y.; Mohamed, J.S.A.; Quek, S.T.; Feng, M.L. Effect of Training Data Volume on Performance of Convolutional Neural Network Pneumothorax Classifiers. J. Digit. Imaging 2022. [Google Scholar] [CrossRef]
- Ben Hamida, A.; Devanne, M.; Weber, J.; Truntzer, C.; Derangere, V.; Ghiringhelli, F.; Forestier, G.; Wemmert, C. Deep learning for colon cancer histopathological images analysis. Comput. Biol. Med. 2021, 136, 104730. [Google Scholar] [CrossRef] [PubMed]
- Kaczmarzyk, J.R.; Kurç, T.M.; Abousamra, S.; Gupta, R.R.; Saltz, J.H.; Koo, P.K. Evaluating histopathology transfer learning with ChampKit. arXiv 2022, arXiv:2206.06862. [Google Scholar]
- Zheng, Y.; Li, C.; Zhou, X.; Chen, H.; Xu, H.; Li, Y.; Zhang, H.; Li, X.; Sun, H.; Huang, X.; et al. Application of Transfer Learning and Ensemble Learning in Image-level Classification for Breast Histopathology. arXiv 2022, arXiv:2204.08311. [Google Scholar] [CrossRef]
- Schirris, Y.; Gavves, E.; Nederlof, I.; Horlings, H.M.; Teuwen, J. DeepSMILE: Contrastive self-supervised pre-training benefits MSI and HRD classification directly from H&E whole-slide images in colorectal and breast cancer. Med. Image Anal. 2022, 79, 102464. [Google Scholar] [CrossRef]
- Mahapatra, D.; Poellinger, A.; Shao, L.; Reyes, M. Interpretability-Driven Sample Selection Using Self Supervised Learning for Disease Classification and Segmentation. IEEE Trans. Med. Imaging 2021, 40, 2548–2562. [Google Scholar] [CrossRef]
- Bulten, W.; Bandi, P.; Hoven, J.; van de Loo, R.; Lotz, J.; Weiss, N.; van der Laak, J.; van Ginneken, B.; Hulsbergen-van de Kaa, C.; Litjens, G. Epithelium segmentation using deep learning in H&E-stained prostate specimens with immunohistochemistry as reference standard. Sci. Rep. 2019, 9, 864. [Google Scholar] [CrossRef]
- Tellez, D.; Balkenhol, M.; Otte-Holler, I.; van de Loo, R.; Vogels, R.; Bult, P.; Wauters, C.; Vreuls, W.; Mol, S.; Karssemeijer, N.; et al. Whole-Slide Mitosis Detection in H & E Breast Histology Using PHH3 as a Reference to Train Distilled Stain-Invariant Convolutional Networks. IEEE Trans. Med. Imaging 2018, 37, 2126–2136. [Google Scholar] [CrossRef]
- Jackson, C.R.; Sriharan, A.; Vaickus, L.J. A machine learning algorithm for simulating immunohistochemistry: Development of SOX10 virtual IHC and evaluation on primarily melanocytic neoplasms. Mod. Pathol. 2020, 33, 1638–1648. [Google Scholar] [CrossRef] [PubMed]
- Elston, C.W.; Ellis, I.O. Pathological prognostic factors in breast cancer. I. The value of histological grade in breast cancer: Experience from a large study with long-term follow-up. Histopathology 1991, 19, 403–410. [Google Scholar] [CrossRef]
- Stierer, M.; Rosen, H.; Weber, R. Nuclear pleomorphism, a strong prognostic factor in axillary node-negative small invasive breast cancer. Breast Cancer Res. Treat. 1992, 20, 109–116. [Google Scholar] [CrossRef]
- Brieu, N.; Pauly, O.; Zimmermann, J.; Binnig, G.; Schmidt, G. Slide-Specific Models for Segmentation of Differently Stained Digital Histopathology Whole Slide Images. In Proceedings of the Conference on Medical Imaging—Image Processing, San Diego, CA, USA, 1–3 March 2016. [Google Scholar]
- Feng, Y.Q.; Zhang, L.; Yi, Z. Breast cancer cell nuclei classification in histopathology images using deep neural networks. Int. J. Comput. Assist. Radiol. Surg. 2018, 13, 179–191. [Google Scholar] [CrossRef] [PubMed]
- Xing, F.; Yang, L. Robust nucleus/cell detection and segmentation in digital pathology and microscopy images: A comprehensive review. IEEE Rev. Biomed. Eng. 2016, 9, 234–263. [Google Scholar] [CrossRef] [PubMed]
- Cordts, M.; Omran, M.; Ramos, S.; Rehfeld, T.; Enzweiler, M.; Benenson, R.; Franke, U.; Roth, S.; Schiele, B. The cityscapes dataset for semantic urban scene understanding. In Proceedings of the IEEE Conference on Computer Vision and Pattern Recognition, Las Vegas, NV, USA, 27–30 June 2016; pp. 3213–3223. [Google Scholar]
- Lin, T.-Y.; Maire, M.; Belongie, S.; Hays, J.; Perona, P.; Ramanan, D.; Dollár, P.; Zitnick, C.L. Microsoft coco: Common objects in context. In Proceedings of the European Conference on Computer Vision, Zurich, Switzerland, 6–12 September 2014; pp. 740–755. [Google Scholar]
- Everingham, M.; Van Gool, L.; Williams, C.K.; Winn, J.; Zisserman, A. The pascal visual object classes (VOC) challenge. Int. J. Comput. Vis. 2010, 88, 303–338. [Google Scholar] [CrossRef]
- Kumar, N.; Verma, R.; Anand, D.; Zhou, Y.; Onder, O.F.; Tsougenis, E.; Chen, H.; Heng, P.-A.; Li, J.; Hu, Z. A multi-organ nucleus segmentation challenge. IEEE Trans. Med. Imaging 2019, 39, 1380–1391. [Google Scholar] [CrossRef] [PubMed]
- Gamper, J.; Koohbanani, N.A.; Benes, K.; Graham, S.; Jahanifar, M.; Khurram, S.A.; Azam, A.; Hewitt, K.; Rajpoot, N. Pannuke dataset extension, insights and baselines. arXiv 2020, arXiv:2003.10778. [Google Scholar]
- Veeling, B.S.; Linmans, J.; Winkens, J.; Cohen, T.; Welling, M. Rotation equivariant CNNs for digital pathology. In Proceedings of the International Conference on Medical Image Computing and Computer-Assisted Intervention, Granada, Spain, 16–20 September 2018; pp. 210–218. [Google Scholar]
- Torrey, L.; Shavlik, J. Transfer learning. In Handbook of Research on Machine Learning Applications and Trends: Algorithms, Methods, and Techniques; IGI Global: Hershey, PA, USA, 2010; pp. 242–264. [Google Scholar]
- Kieffer, B.; Babaie, M.; Kalra, S.; Tizhoosh, H.R. Convolutional neural networks for histopathology image classification: Training vs using pre-trained networks. In Proceedings of the 2017 Seventh International Conference on Image Processing Theory, Tools and Applications (IPTA), Montreal, QC, Canada, 28 November–1 December 2017; pp. 1–6. [Google Scholar]
- Celik, Y.; Talo, M.; Yildirim, O.; Karabatak, M.; Acharya, U.R. Automated invasive ductal carcinoma detection based using deep transfer learning with whole-slide images. Pattern Recognit. Lett. 2020, 133, 232–239. [Google Scholar] [CrossRef]
- Talo, M. Automated classification of histopathology images using transfer learning. Artif. Intell. Med. 2019, 101, 101743. [Google Scholar] [CrossRef]
- Kora, P.; Ooi, C.P.; Faust, O.; Raghavendra, U.; Gudigar, A.; Chan, W.Y.; Meenakshi, K.; Swaraja, K.; Plawiak, P.; Acharya, U.R. Transfer learning techniques for medical image analysis: A review. Biocybern. Biomed. Eng. 2022, 42, 79–107. [Google Scholar] [CrossRef]
- Wang, P.; Li, P.F.; Li, Y.M.; Wang, J.X.; Xu, J. Histopathological image classification based on cross-domain deep transferred feature fusion. Biomed. Signal Process. Control 2021, 68, 102705. [Google Scholar] [CrossRef]
- Zoetmulder, R.; Gavves, E.; Caan, M.; Marquering, H. Domain- and task-specific transfer learning for medical segmentation tasks. Comput. Methods Programs Biomed. 2022, 214, 106539. [Google Scholar] [CrossRef]
- Shurrab, S.; Duwairi, R. Self-supervised learning methods and applications in medical imaging analysis: A survey. arXiv 2021, arXiv:2109.08685. [Google Scholar]
- Ohri, K.; Kumar, M. Review on self-supervised image recognition using deep neural networks. Knowl.-Based Syst. 2021, 224, 107090. [Google Scholar] [CrossRef]
- Koohbanani, N.A.; Unnikrishnan, B.; Khurram, S.A.; Krishnaswamy, P.; Rajpoot, N. Self-Path: Self-Supervision for Classification of Pathology Images With Limited Annotations. IEEE Trans. Med. Imaging 2021, 40, 2845–2856. [Google Scholar] [CrossRef] [PubMed]
- Yang, P.; Hong, Z.; Yin, X.; Zhu, C.; Jiang, R. Self-supervised visual representation learning for histopathological images. In Proceedings of the International Conference on Medical Image Computing and Computer-Assisted Intervention, Strasbourg, France, 27 September–1 October 2021; pp. 47–57. [Google Scholar]
- Krishnan, R.; Rajpurkar, P.; Topol, E.J. Self-supervised learning in medicine and healthcare. Nat. Biomed. Eng. 2022. [Google Scholar] [CrossRef] [PubMed]


| Rank | Title | Author | Count | Year | Reference |
|---|---|---|---|---|---|
| 1 | U-Net: Convolutional Networks for Biomedical Image Segmentation | Ronneberger, Olaf | 191 | 2015 | [44] |
| 2 | Diagnostic Assessment of Deep Learning Algorithms for Detection of Lymph Node Metastases in Women With Breast Cancer | Bejnordi, Babak Ehteshami | 164 | 2017 | [55] |
| 3 | Deep Residual Learning for Image Recognition | He, KM | 132 | 2016 | [56] |
| 4 | Very Deep Convolutional Networks for Large-Scale Image Recognition. | Simonyan, Karen | 129 | 2014 | [57] |
| 5 | Classification and mutation prediction from non-small cell lung cancer histopathology images using deep learning | Coudray, Nicolas | 119 | 2018 | [7] |
| 6 | Deep learning | LeCun, Yann | 118 | 2015 | [58] |
| 7 | Deep learning for digital pathology image analysis: A comprehensive tutorial with selected use cases | Janowczyk, Andrew | 116 | 2016 | [59] |
| 8 | Mitosis Detection in Breast Cancer Histology Images with Deep Neural Networks | Cireşan, DC | 115 | 2013 | [60] |
| 9 | ImageNet classification with deep convolutional neural networks | Krizhevsky, Alex | 112 | 2012 | [61] |
| 10 | Dermatologist-level classification of skin cancer with deep neural networks | Esteva, Andre | 110 | 2017 | [37] |
Publisher’s Note: MDPI stays neutral with regard to jurisdictional claims in published maps and institutional affiliations. |
© 2022 by the authors. Licensee MDPI, Basel, Switzerland. This article is an open access article distributed under the terms and conditions of the Creative Commons Attribution (CC BY) license (https://creativecommons.org/licenses/by/4.0/).
Share and Cite
Zhou, W.; Deng, Z.; Liu, Y.; Shen, H.; Deng, H.; Xiao, H. Global Research Trends of Artificial Intelligence on Histopathological Images: A 20-Year Bibliometric Analysis. Int. J. Environ. Res. Public Health 2022, 19, 11597. https://doi.org/10.3390/ijerph191811597
Zhou W, Deng Z, Liu Y, Shen H, Deng H, Xiao H. Global Research Trends of Artificial Intelligence on Histopathological Images: A 20-Year Bibliometric Analysis. International Journal of Environmental Research and Public Health. 2022; 19(18):11597. https://doi.org/10.3390/ijerph191811597
Chicago/Turabian StyleZhou, Wentong, Ziheng Deng, Yong Liu, Hui Shen, Hongwen Deng, and Hongmei Xiao. 2022. "Global Research Trends of Artificial Intelligence on Histopathological Images: A 20-Year Bibliometric Analysis" International Journal of Environmental Research and Public Health 19, no. 18: 11597. https://doi.org/10.3390/ijerph191811597
APA StyleZhou, W., Deng, Z., Liu, Y., Shen, H., Deng, H., & Xiao, H. (2022). Global Research Trends of Artificial Intelligence on Histopathological Images: A 20-Year Bibliometric Analysis. International Journal of Environmental Research and Public Health, 19(18), 11597. https://doi.org/10.3390/ijerph191811597