
Potential Impacts of Different Occupational Outdoor Heat Exposure Thresholds among Washington State Crop and Construction Workers and Implications for Other Jurisdictions

 , , , and
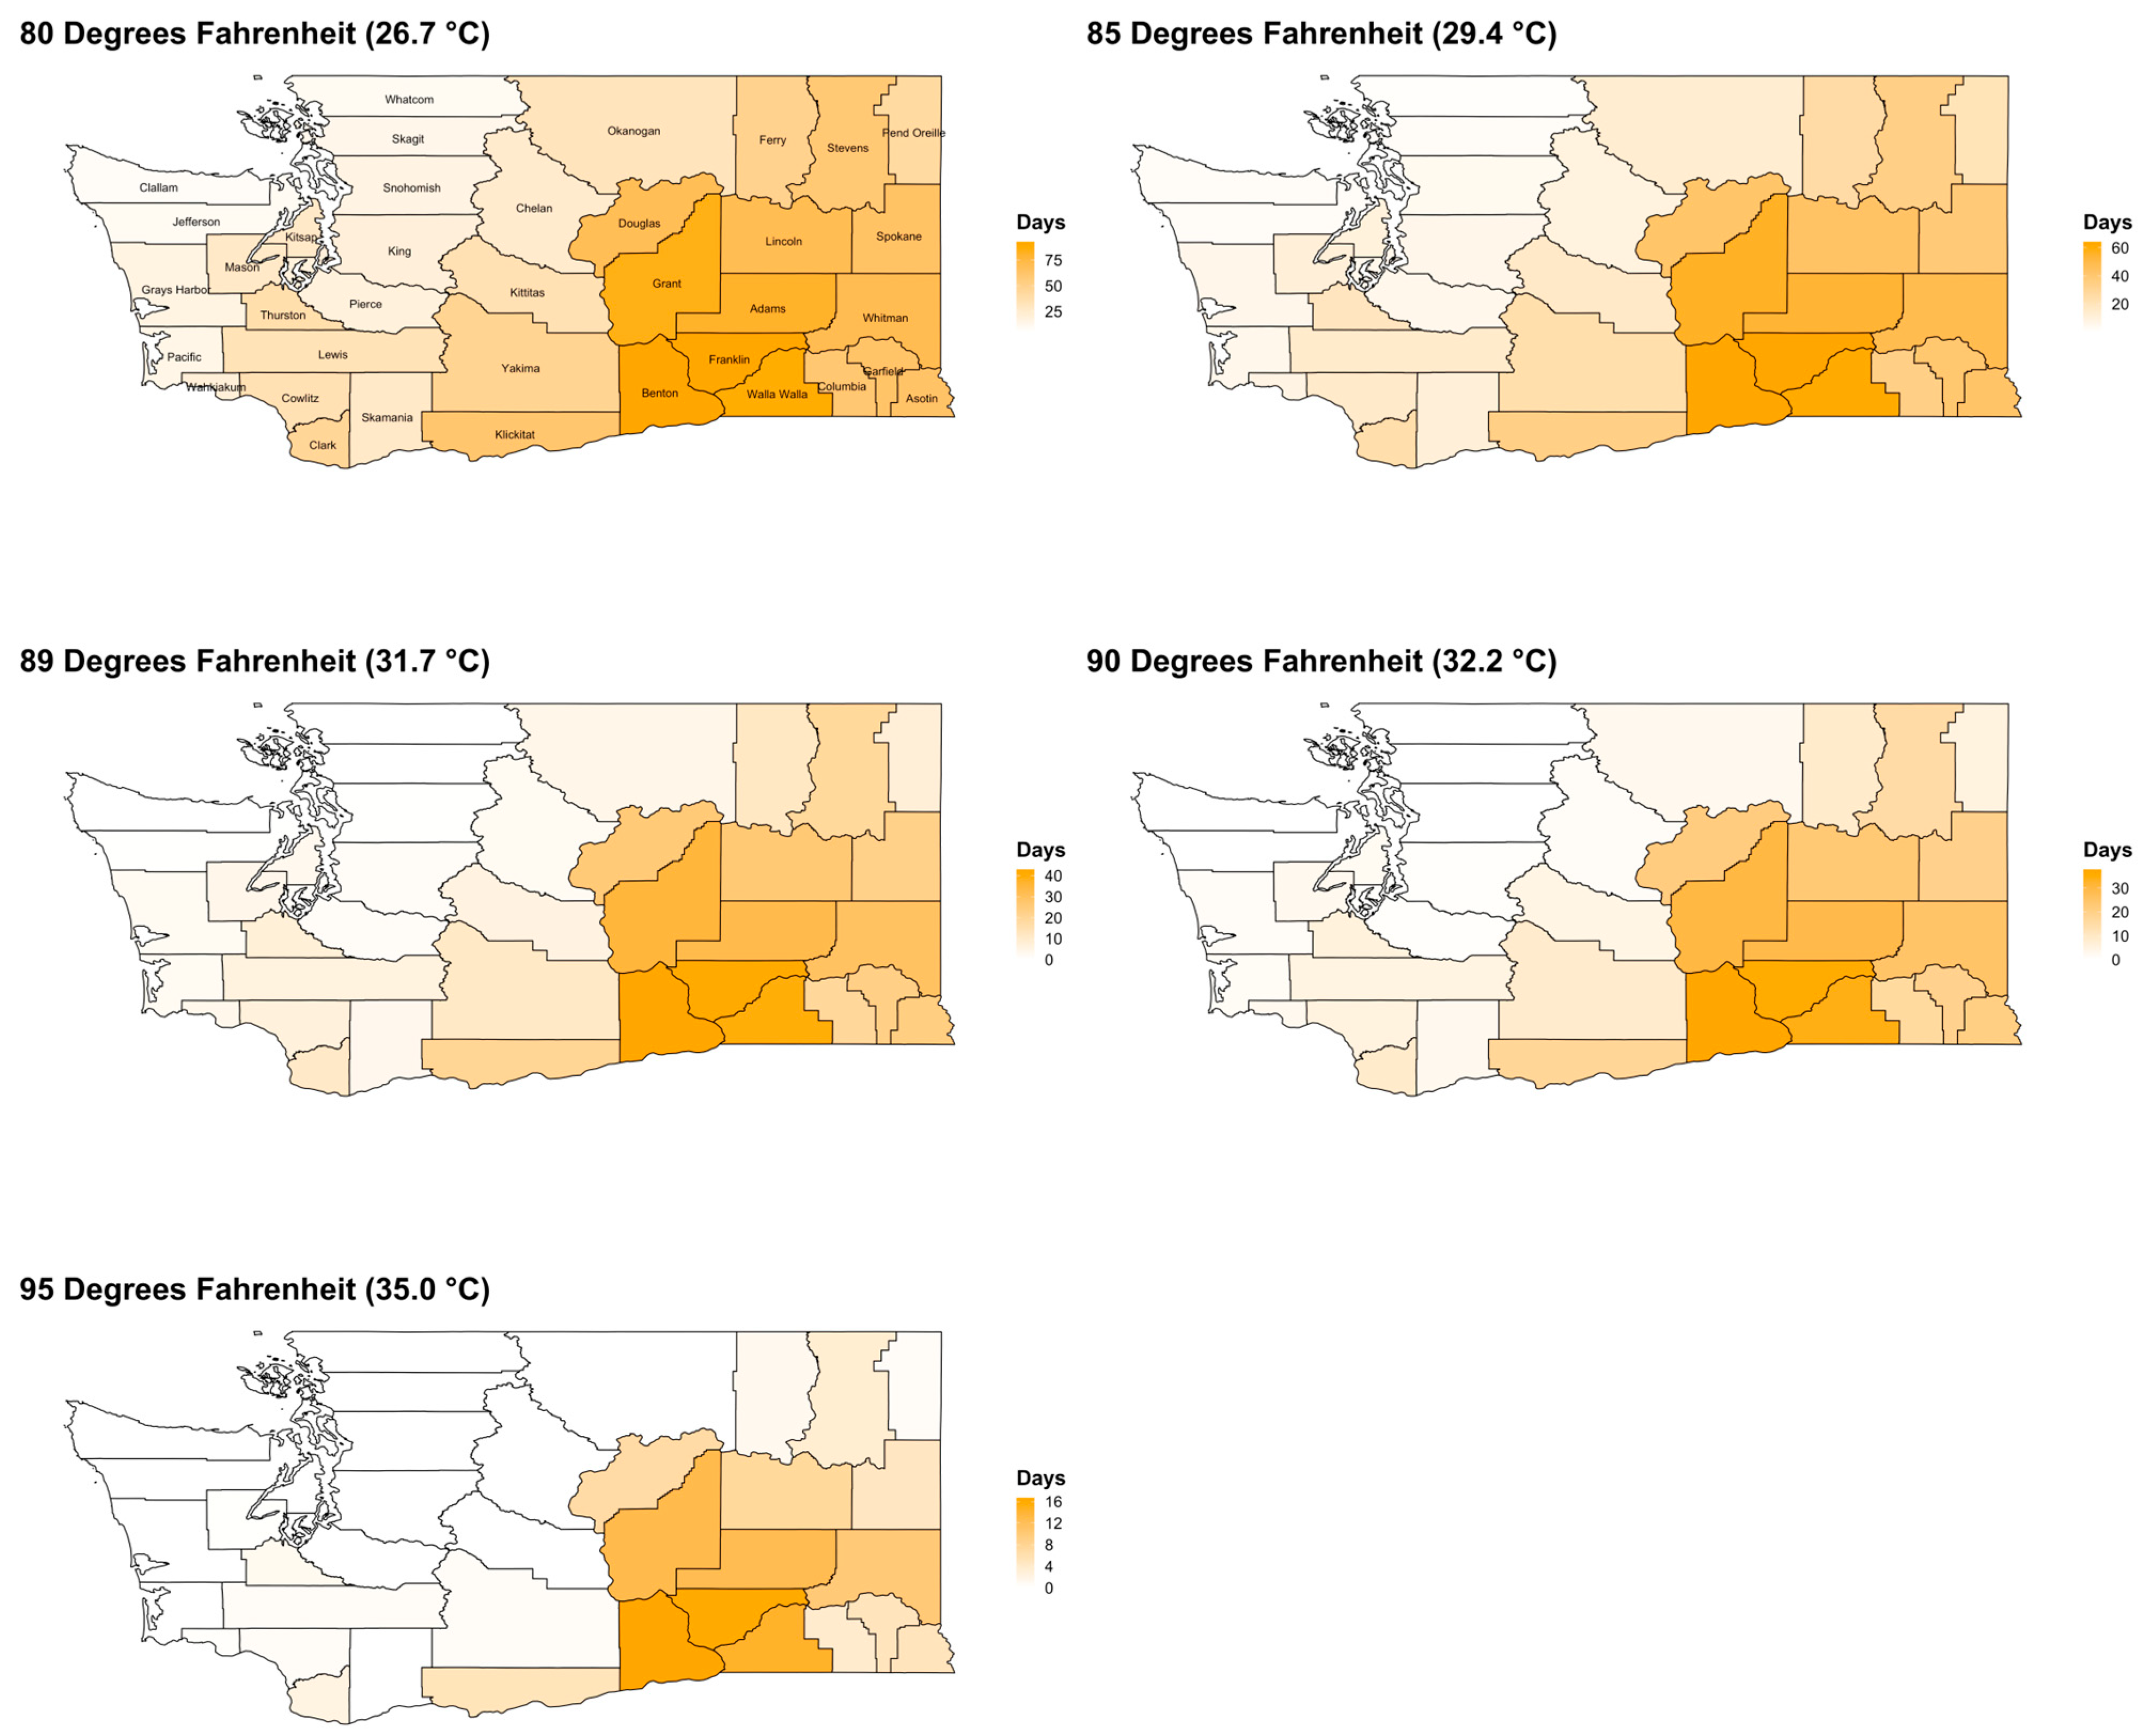
Abstract
:1. Introduction
2. Materials and Methods
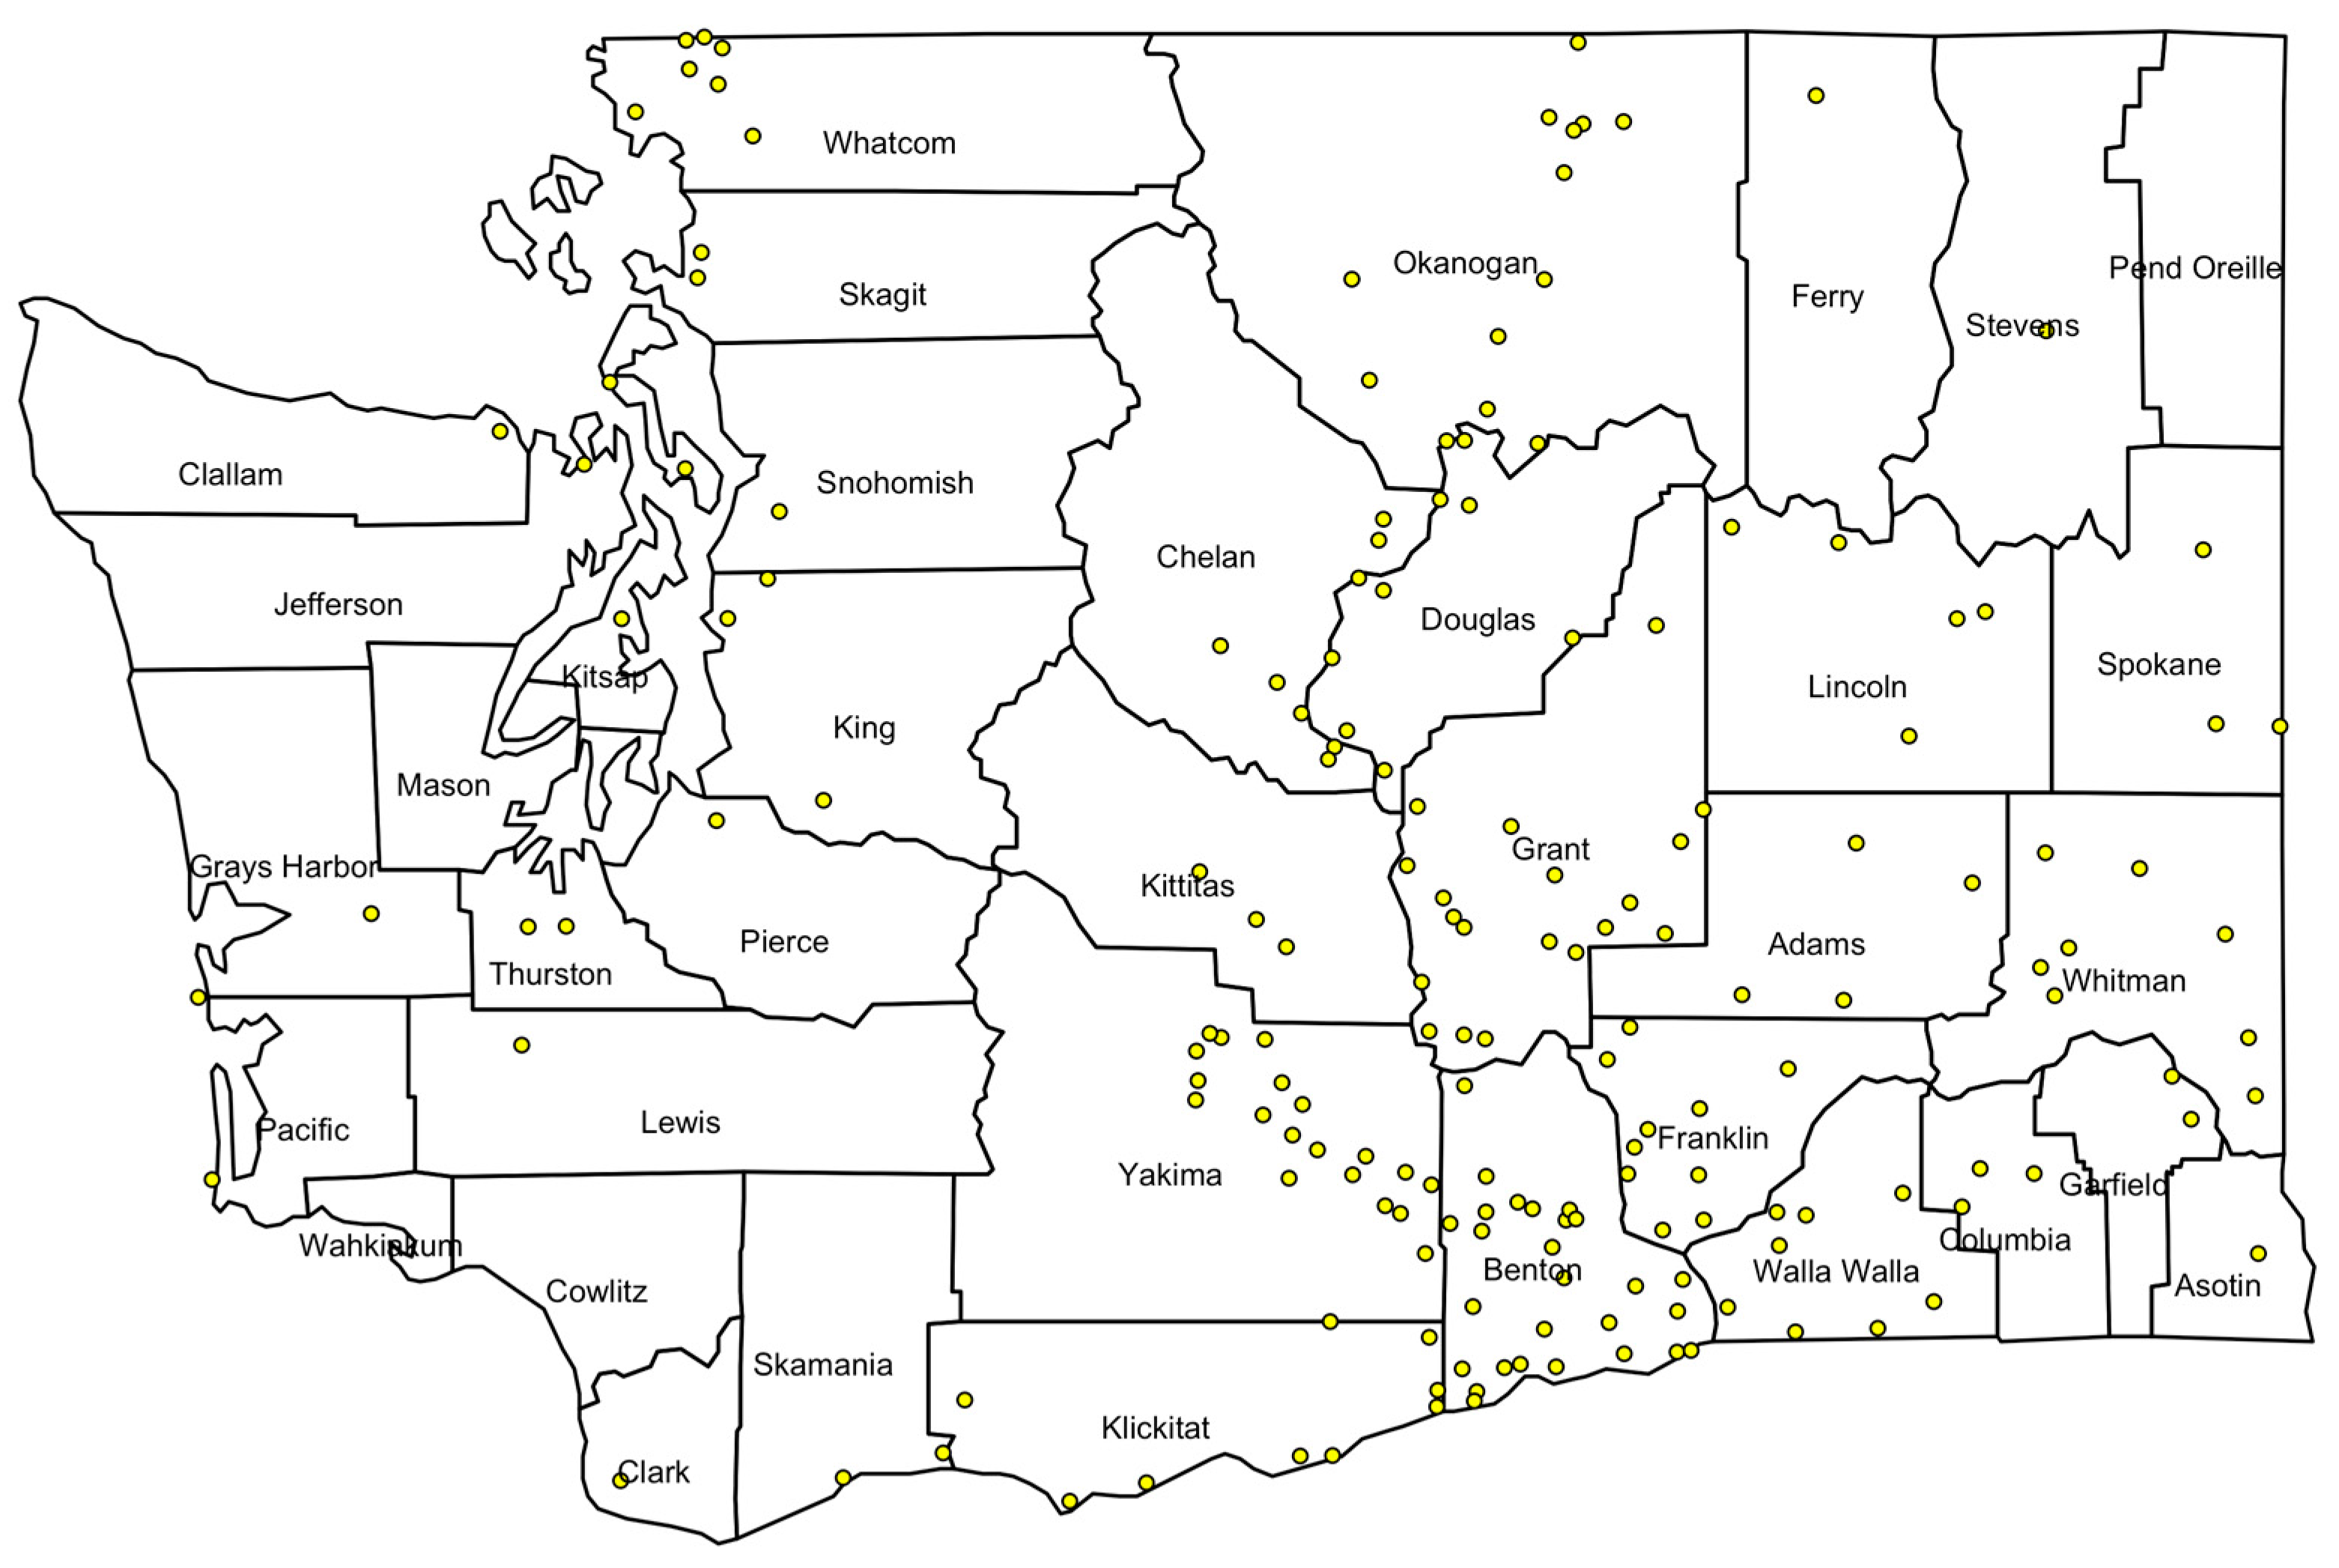
2.1. Study Area, Populations, and Setting
2.2. Data Sources
2.3. Approach to Selecting Exposure Data Sources
2.4. Exposure Data Sources
2.5. Employment Data Source
2.6. Data Analysis
3. Results
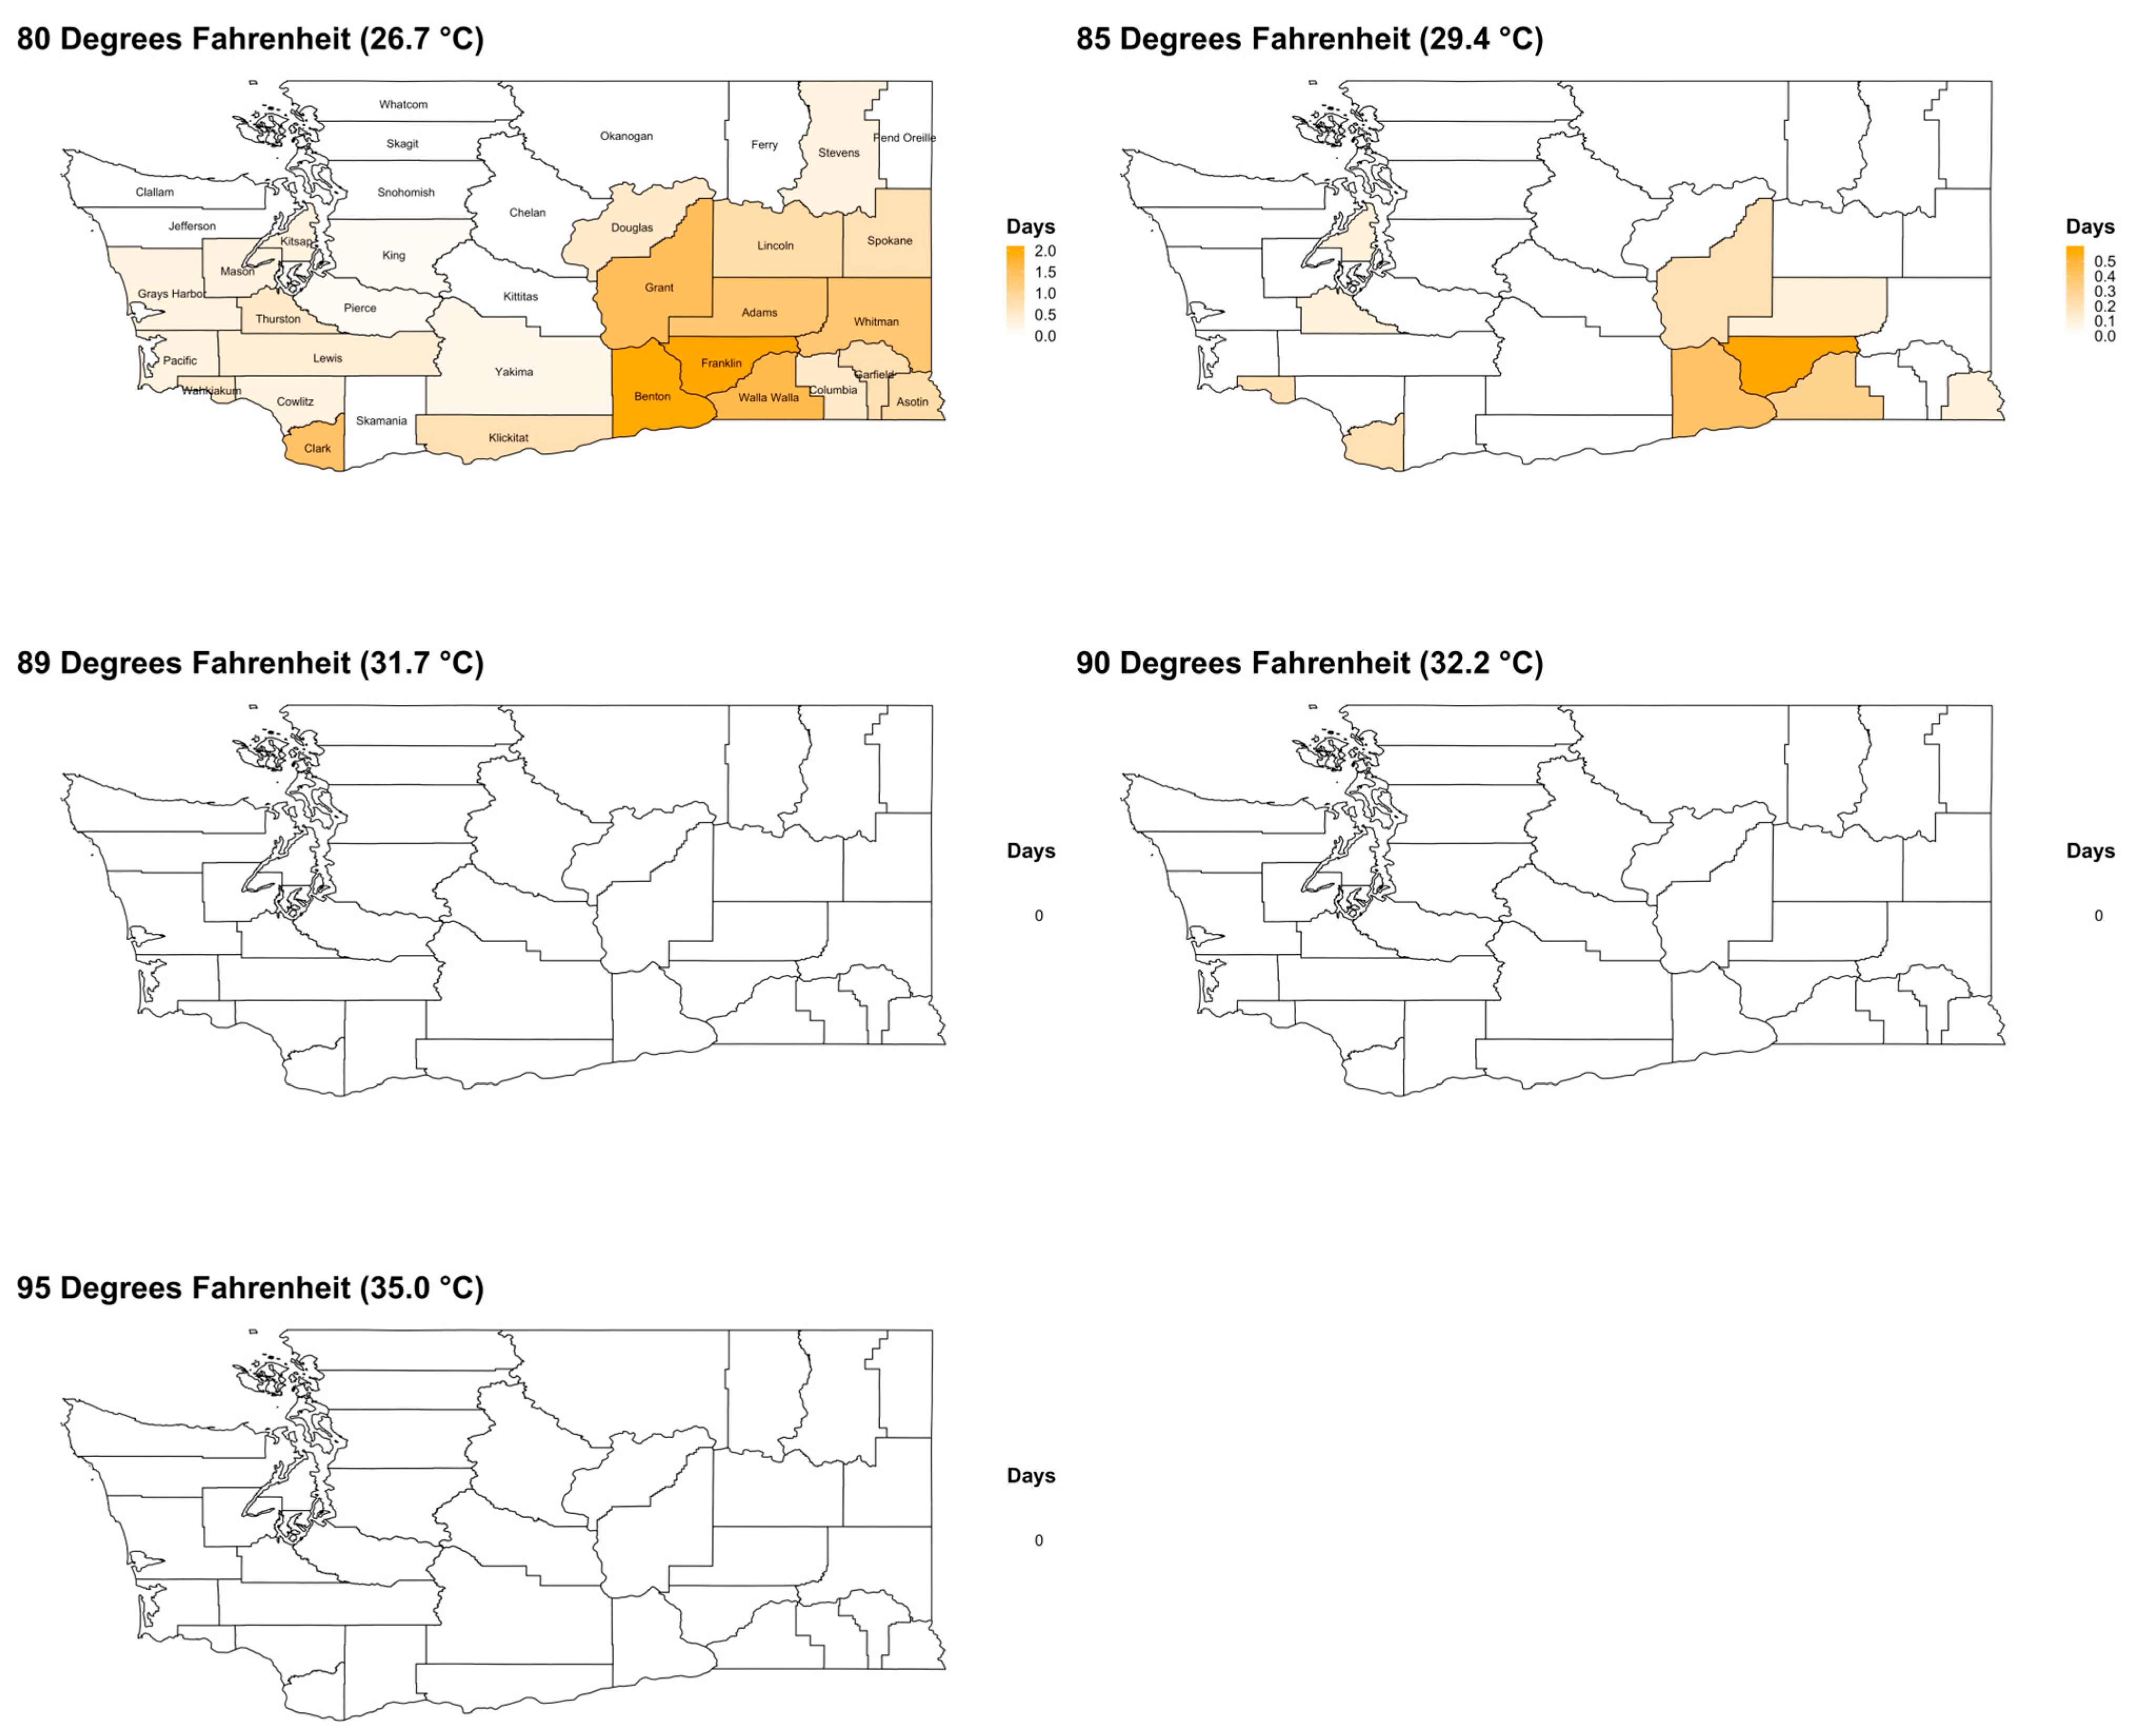
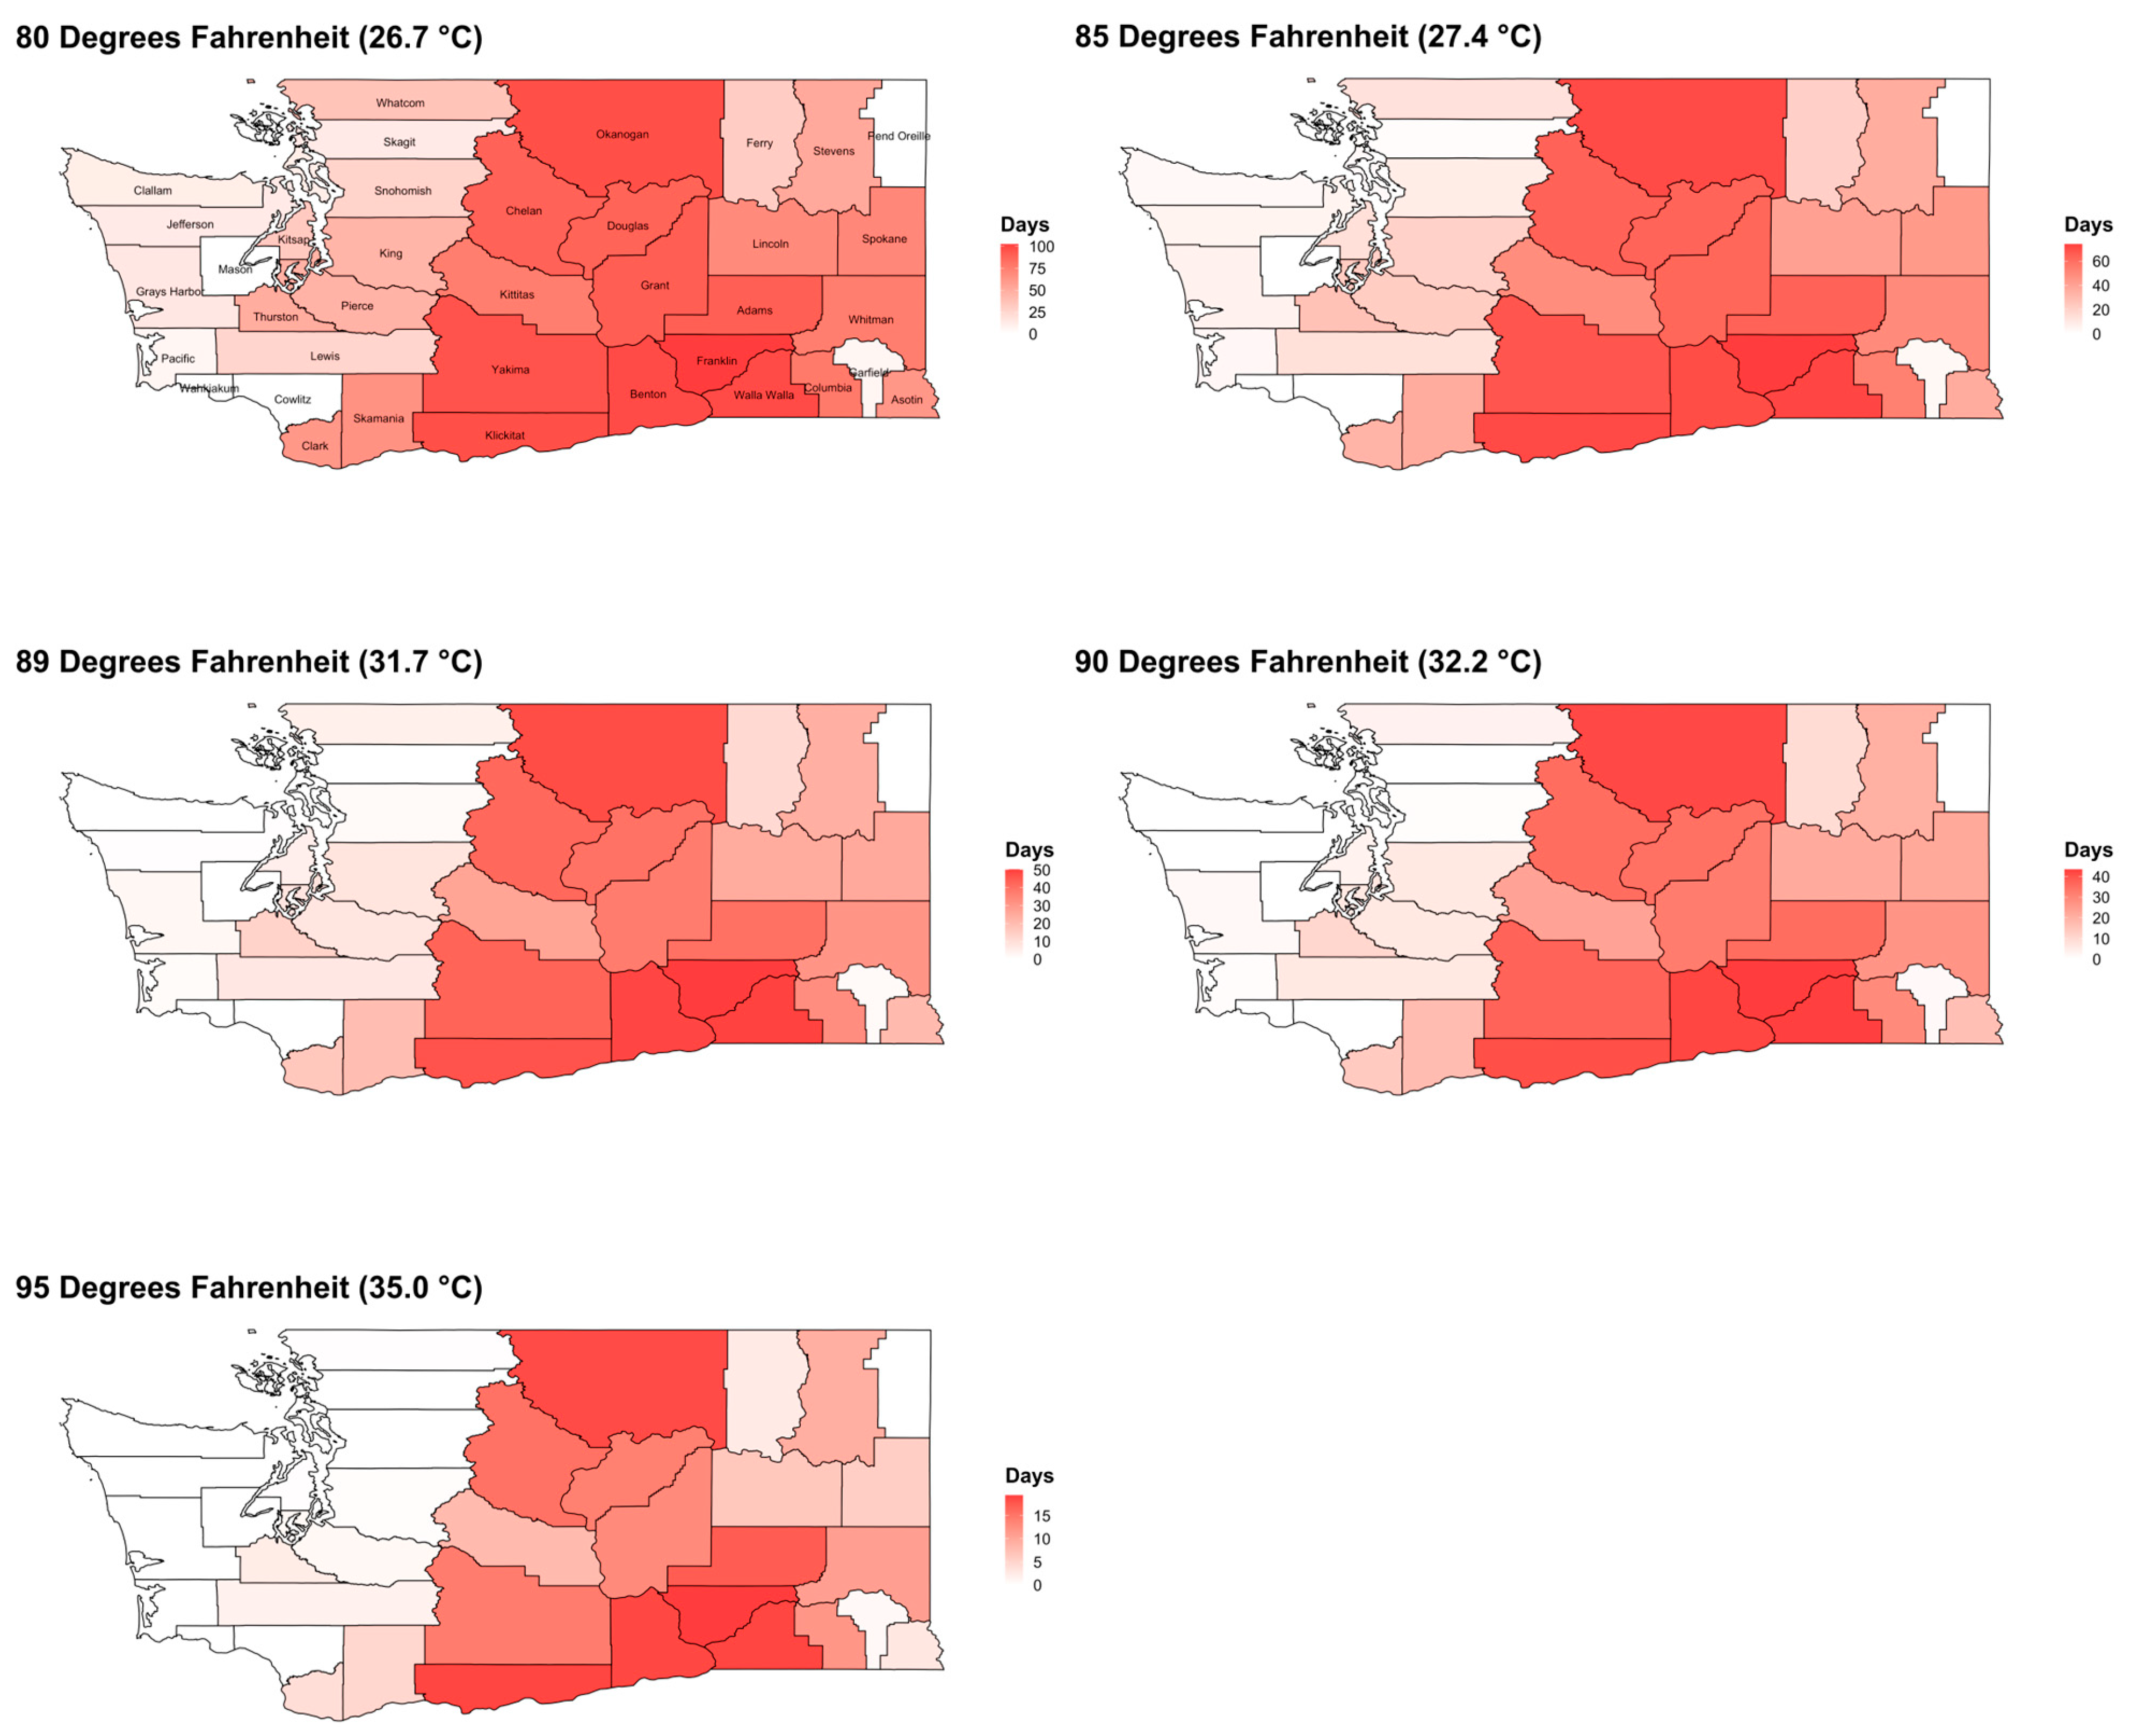
3.1. Temperature Threshold Exceedances (PRISM)
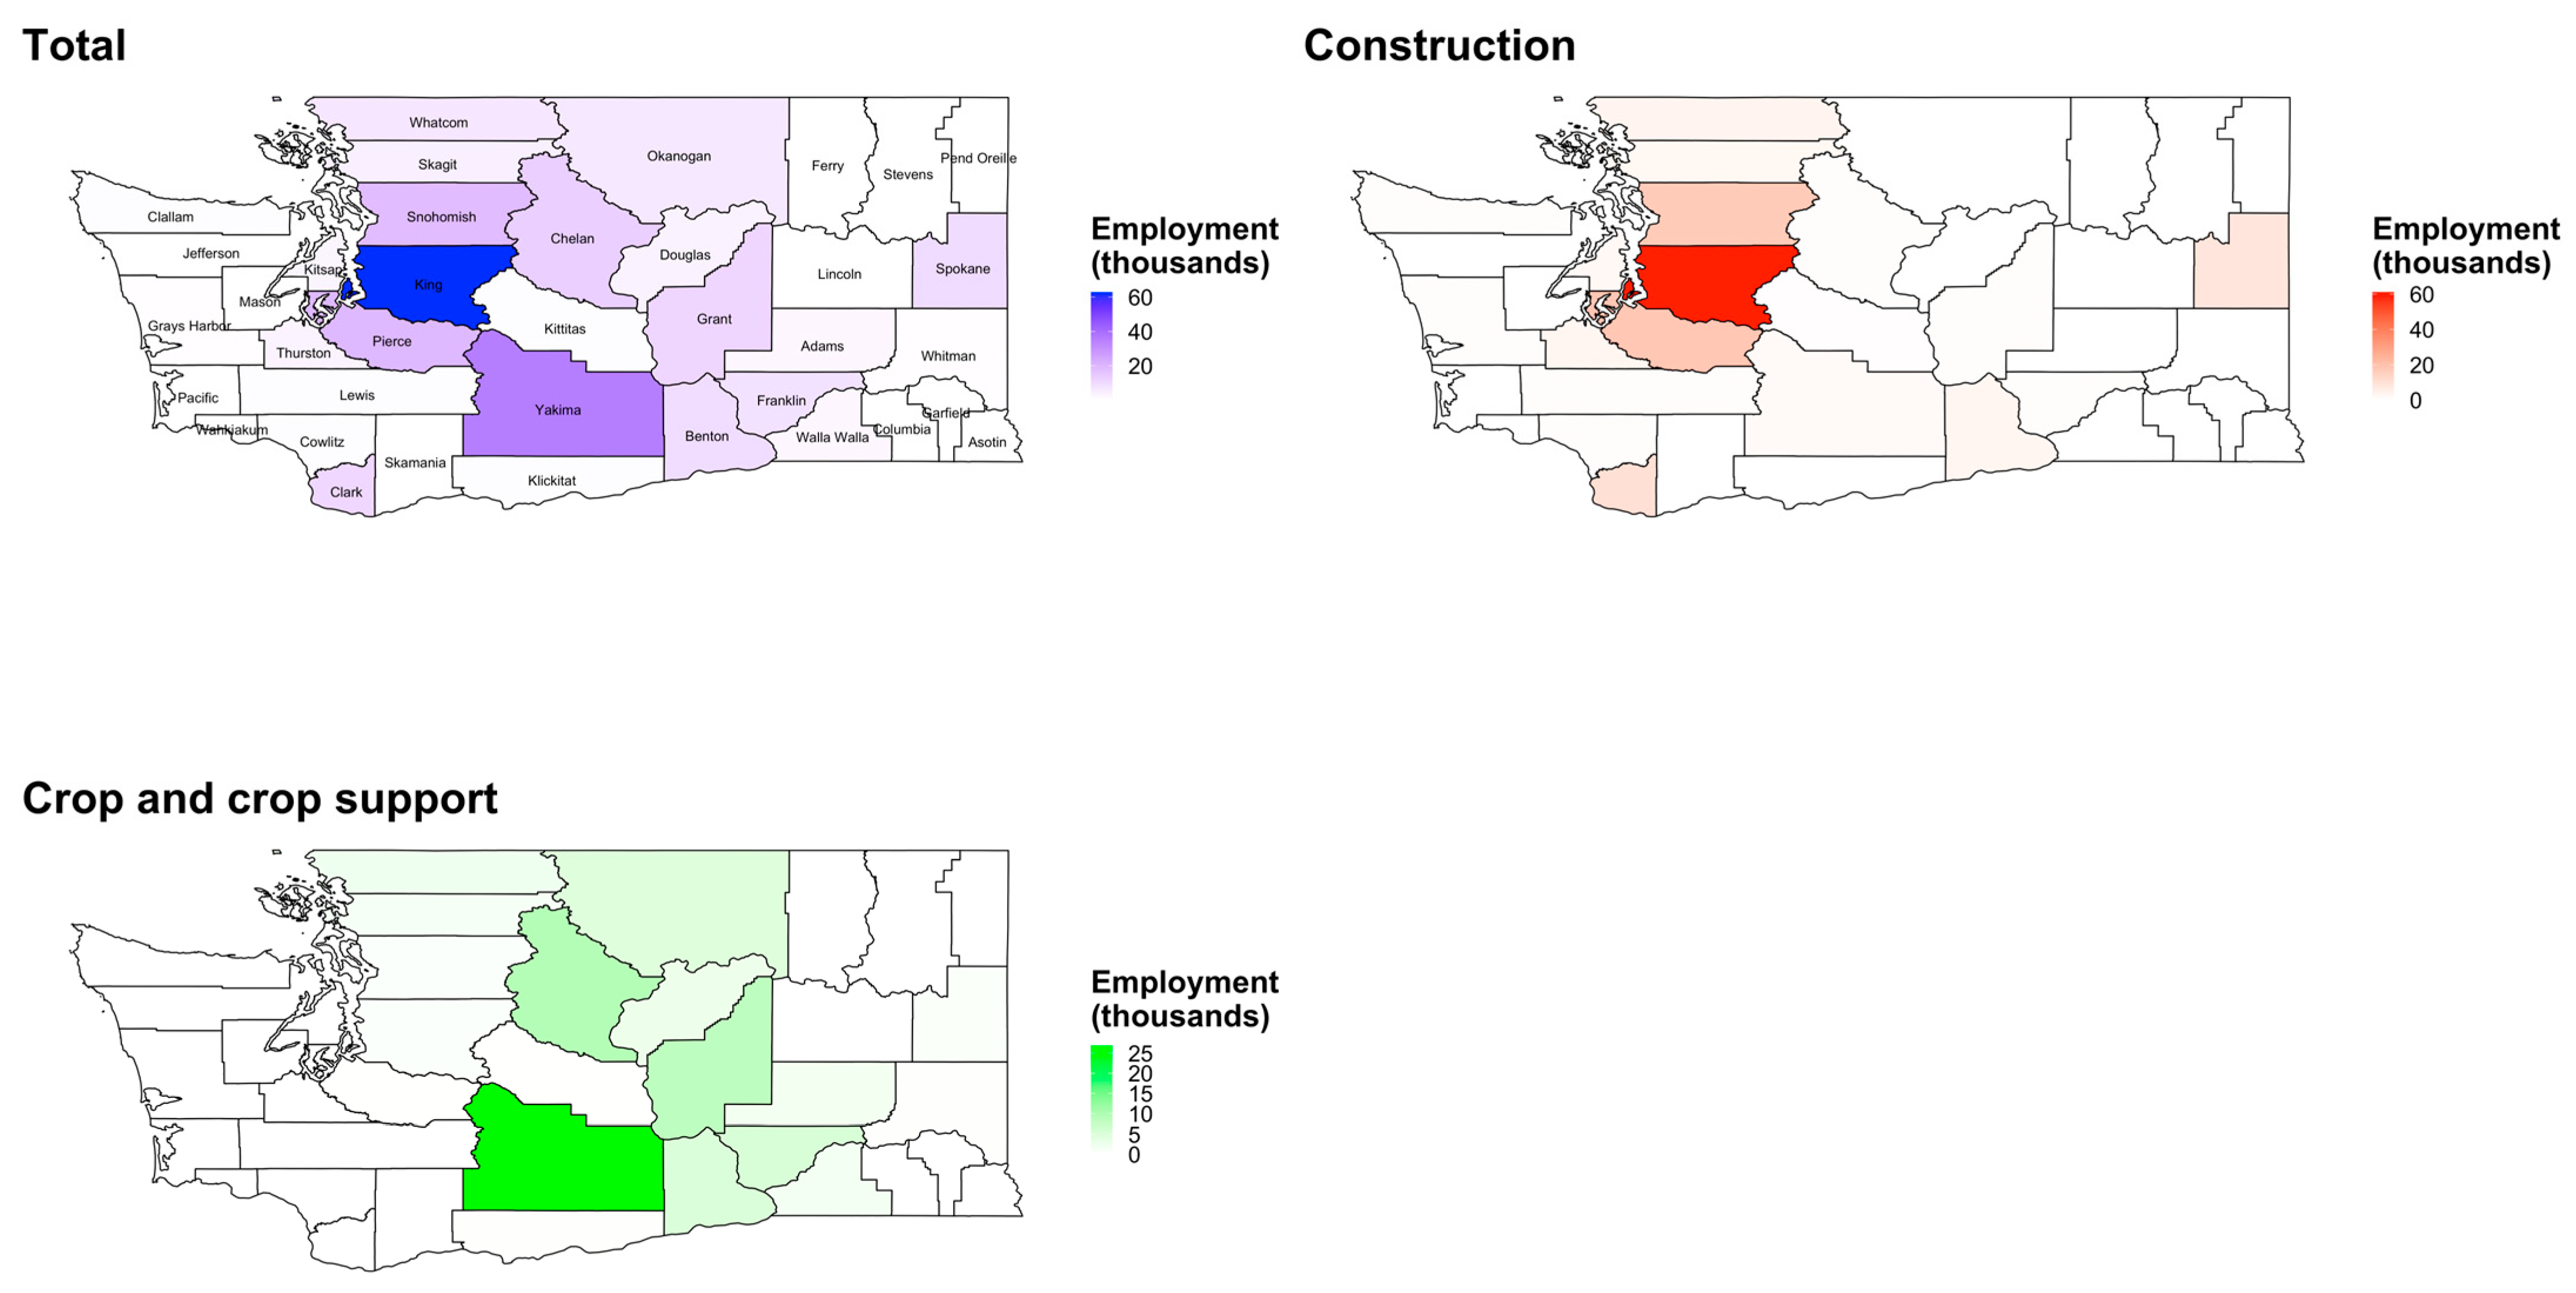
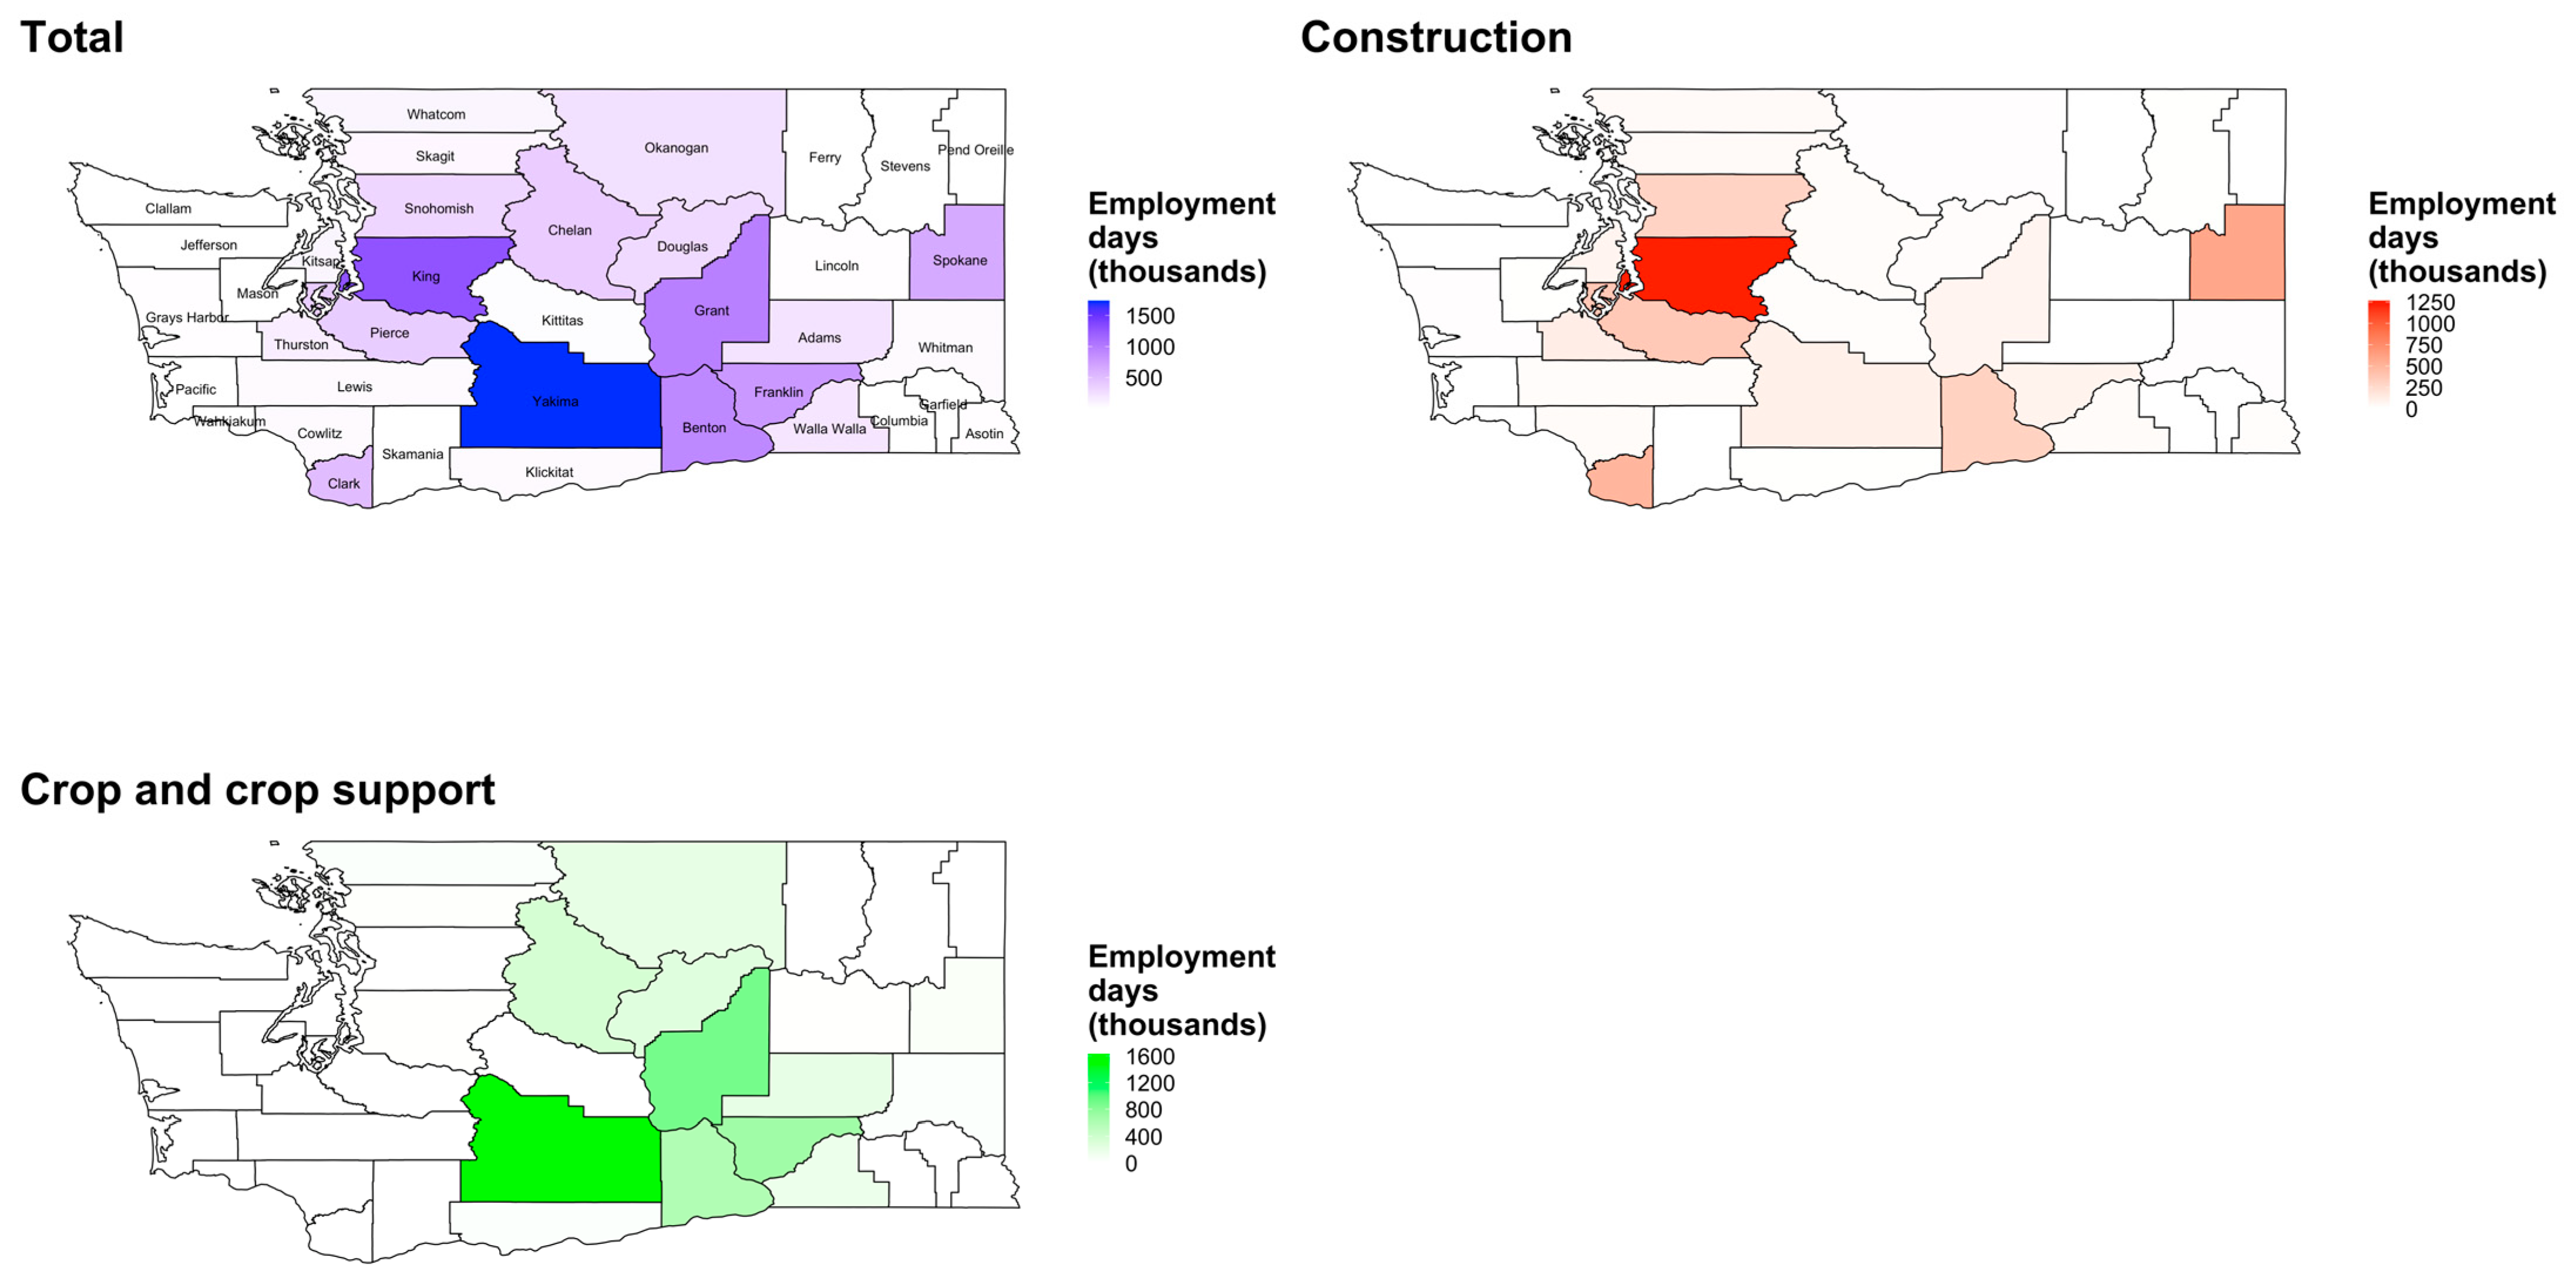
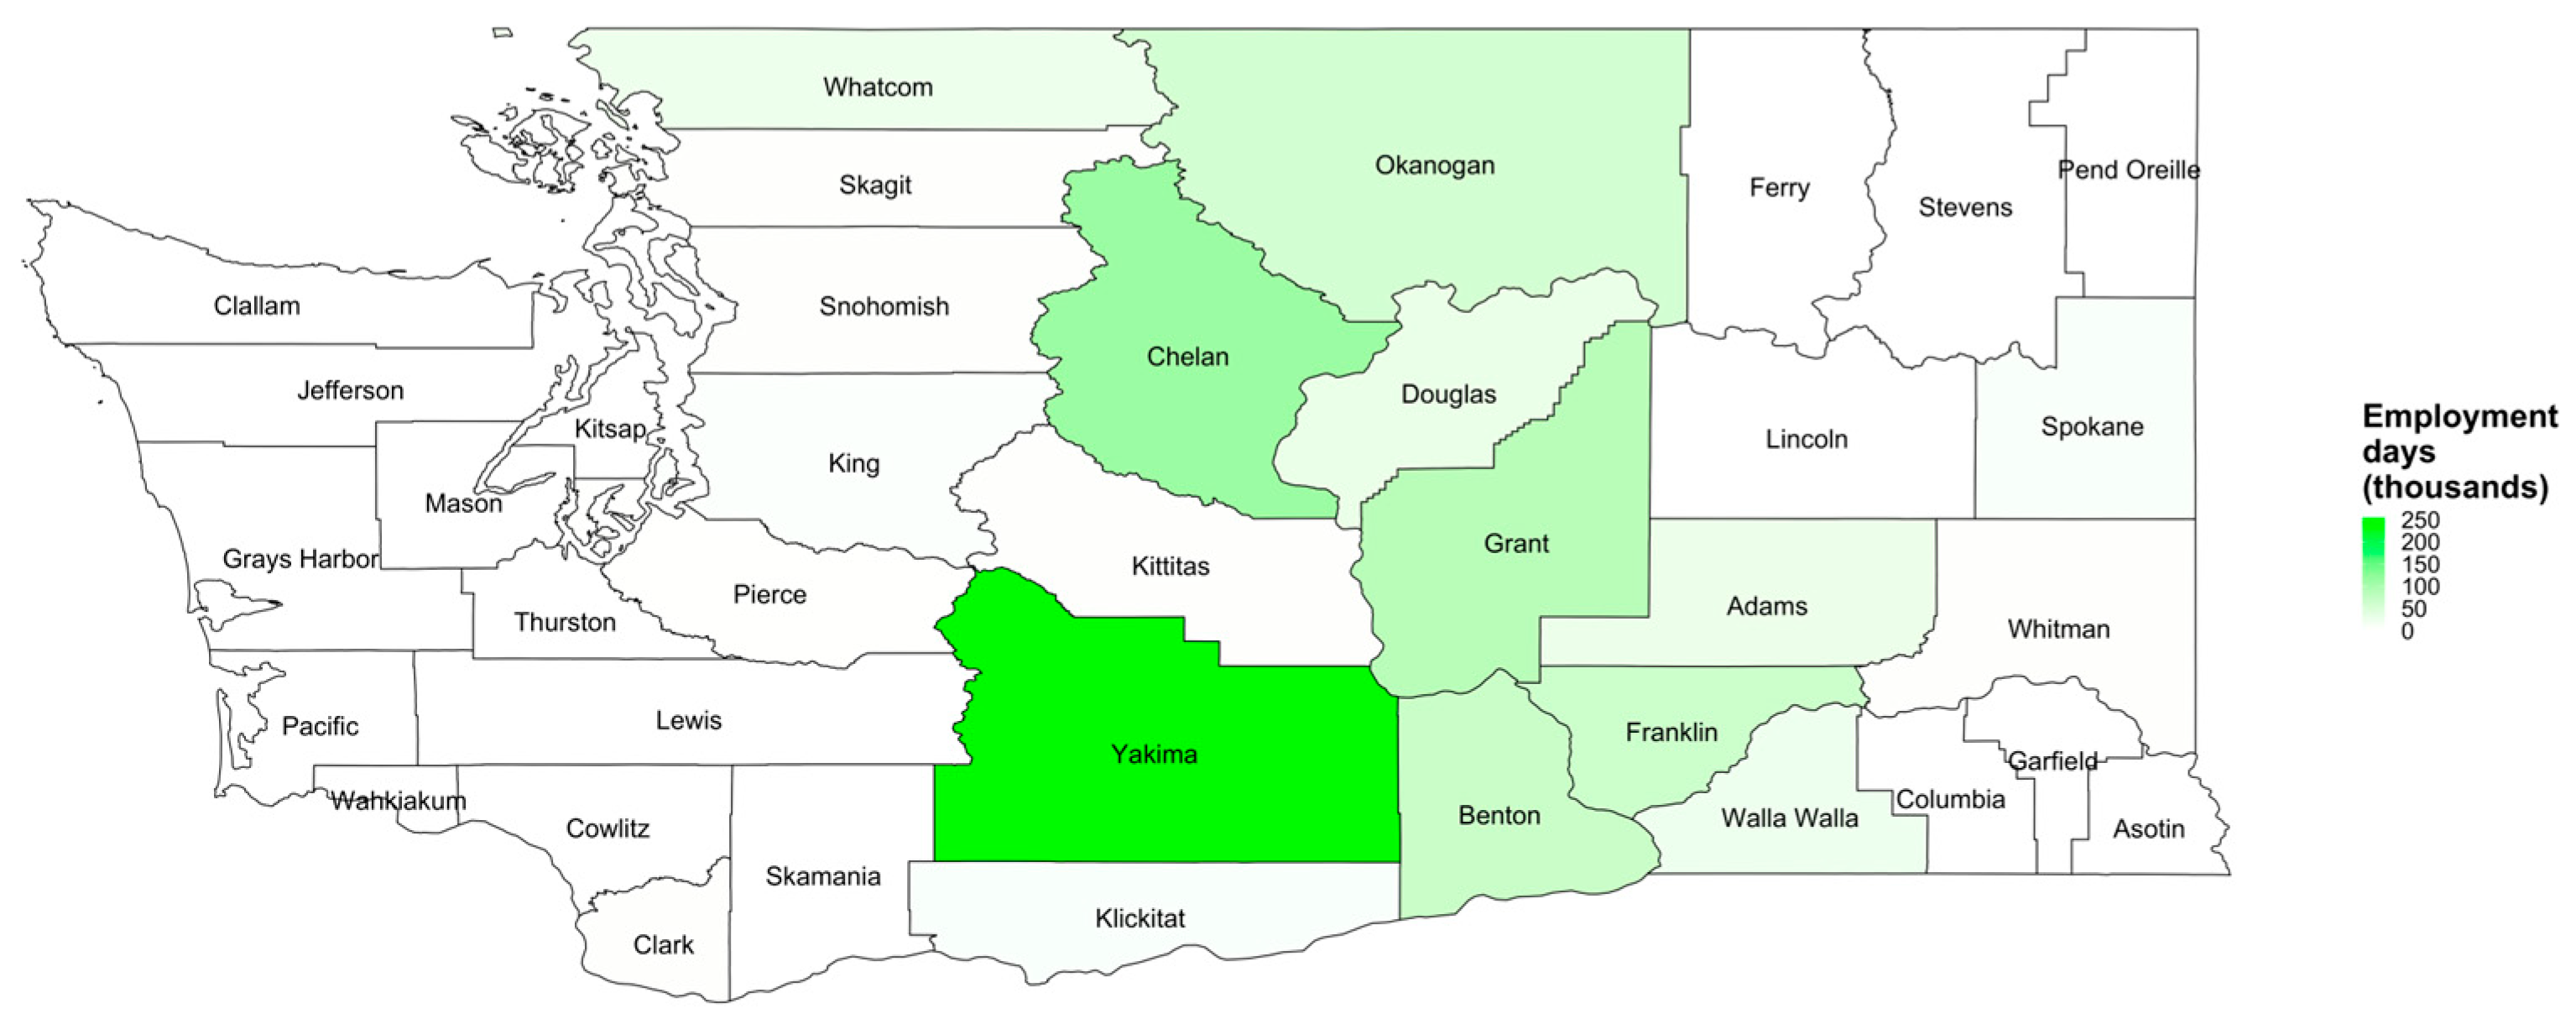
3.2. Employment
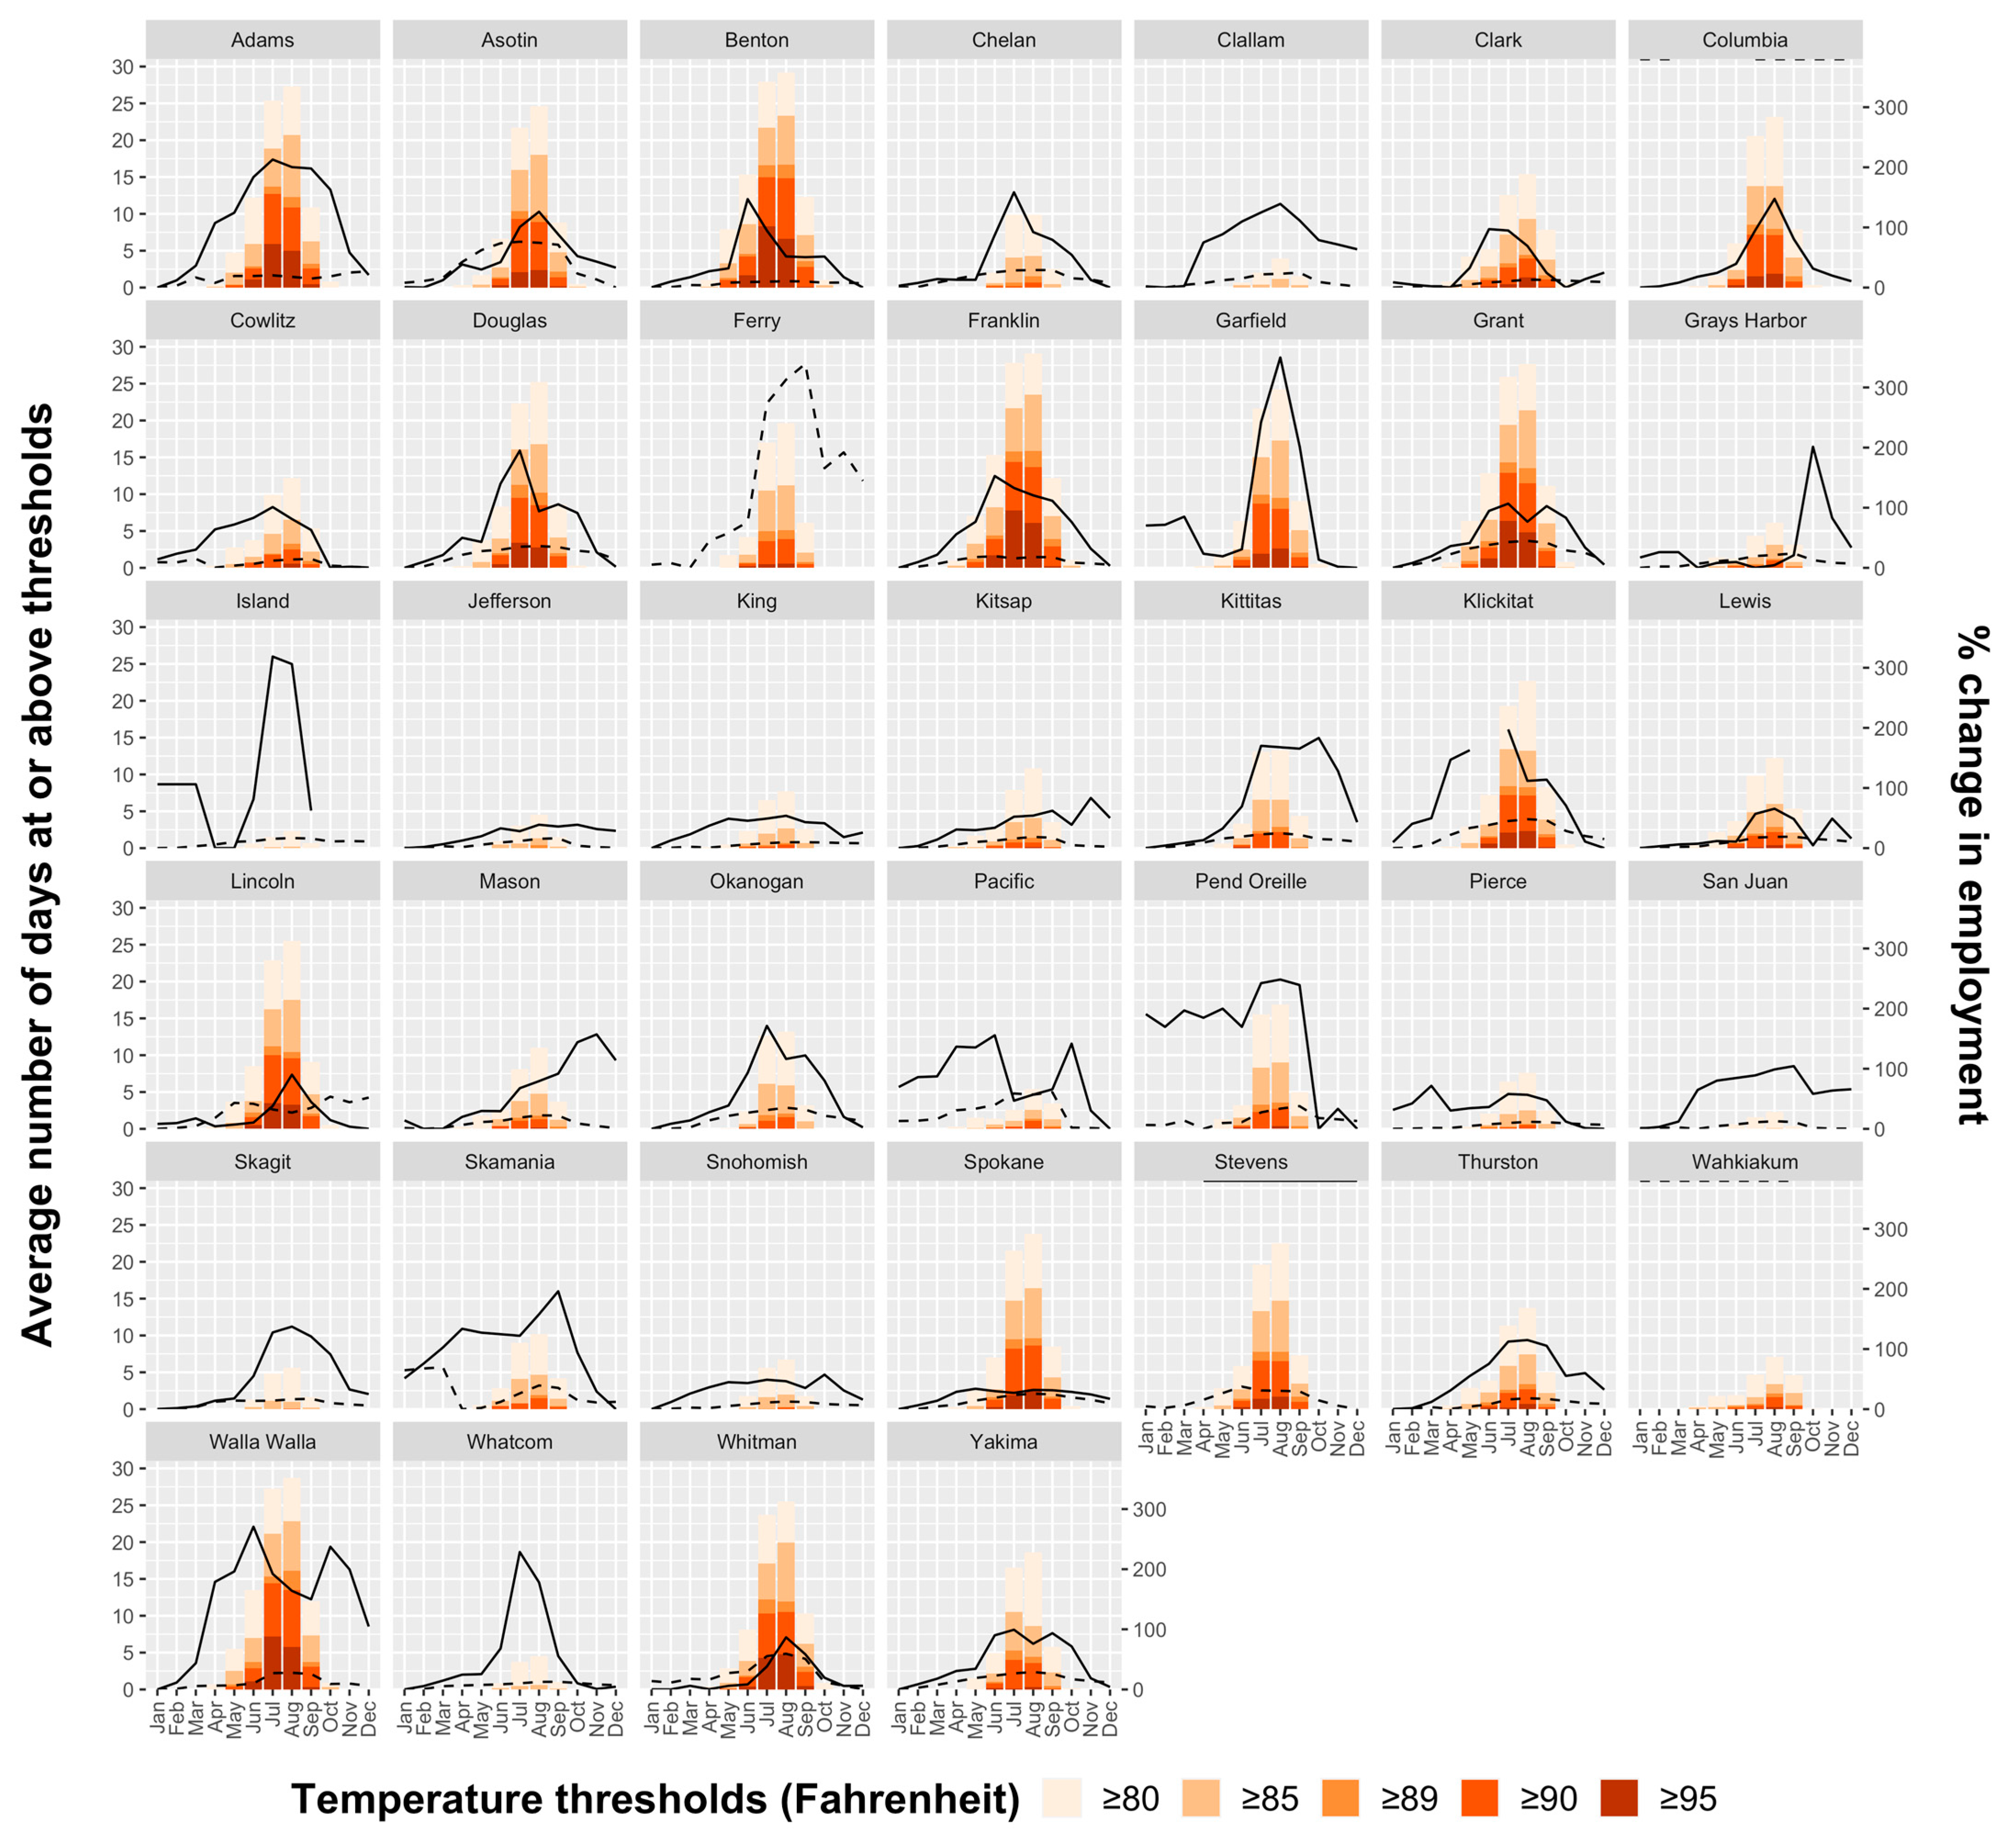
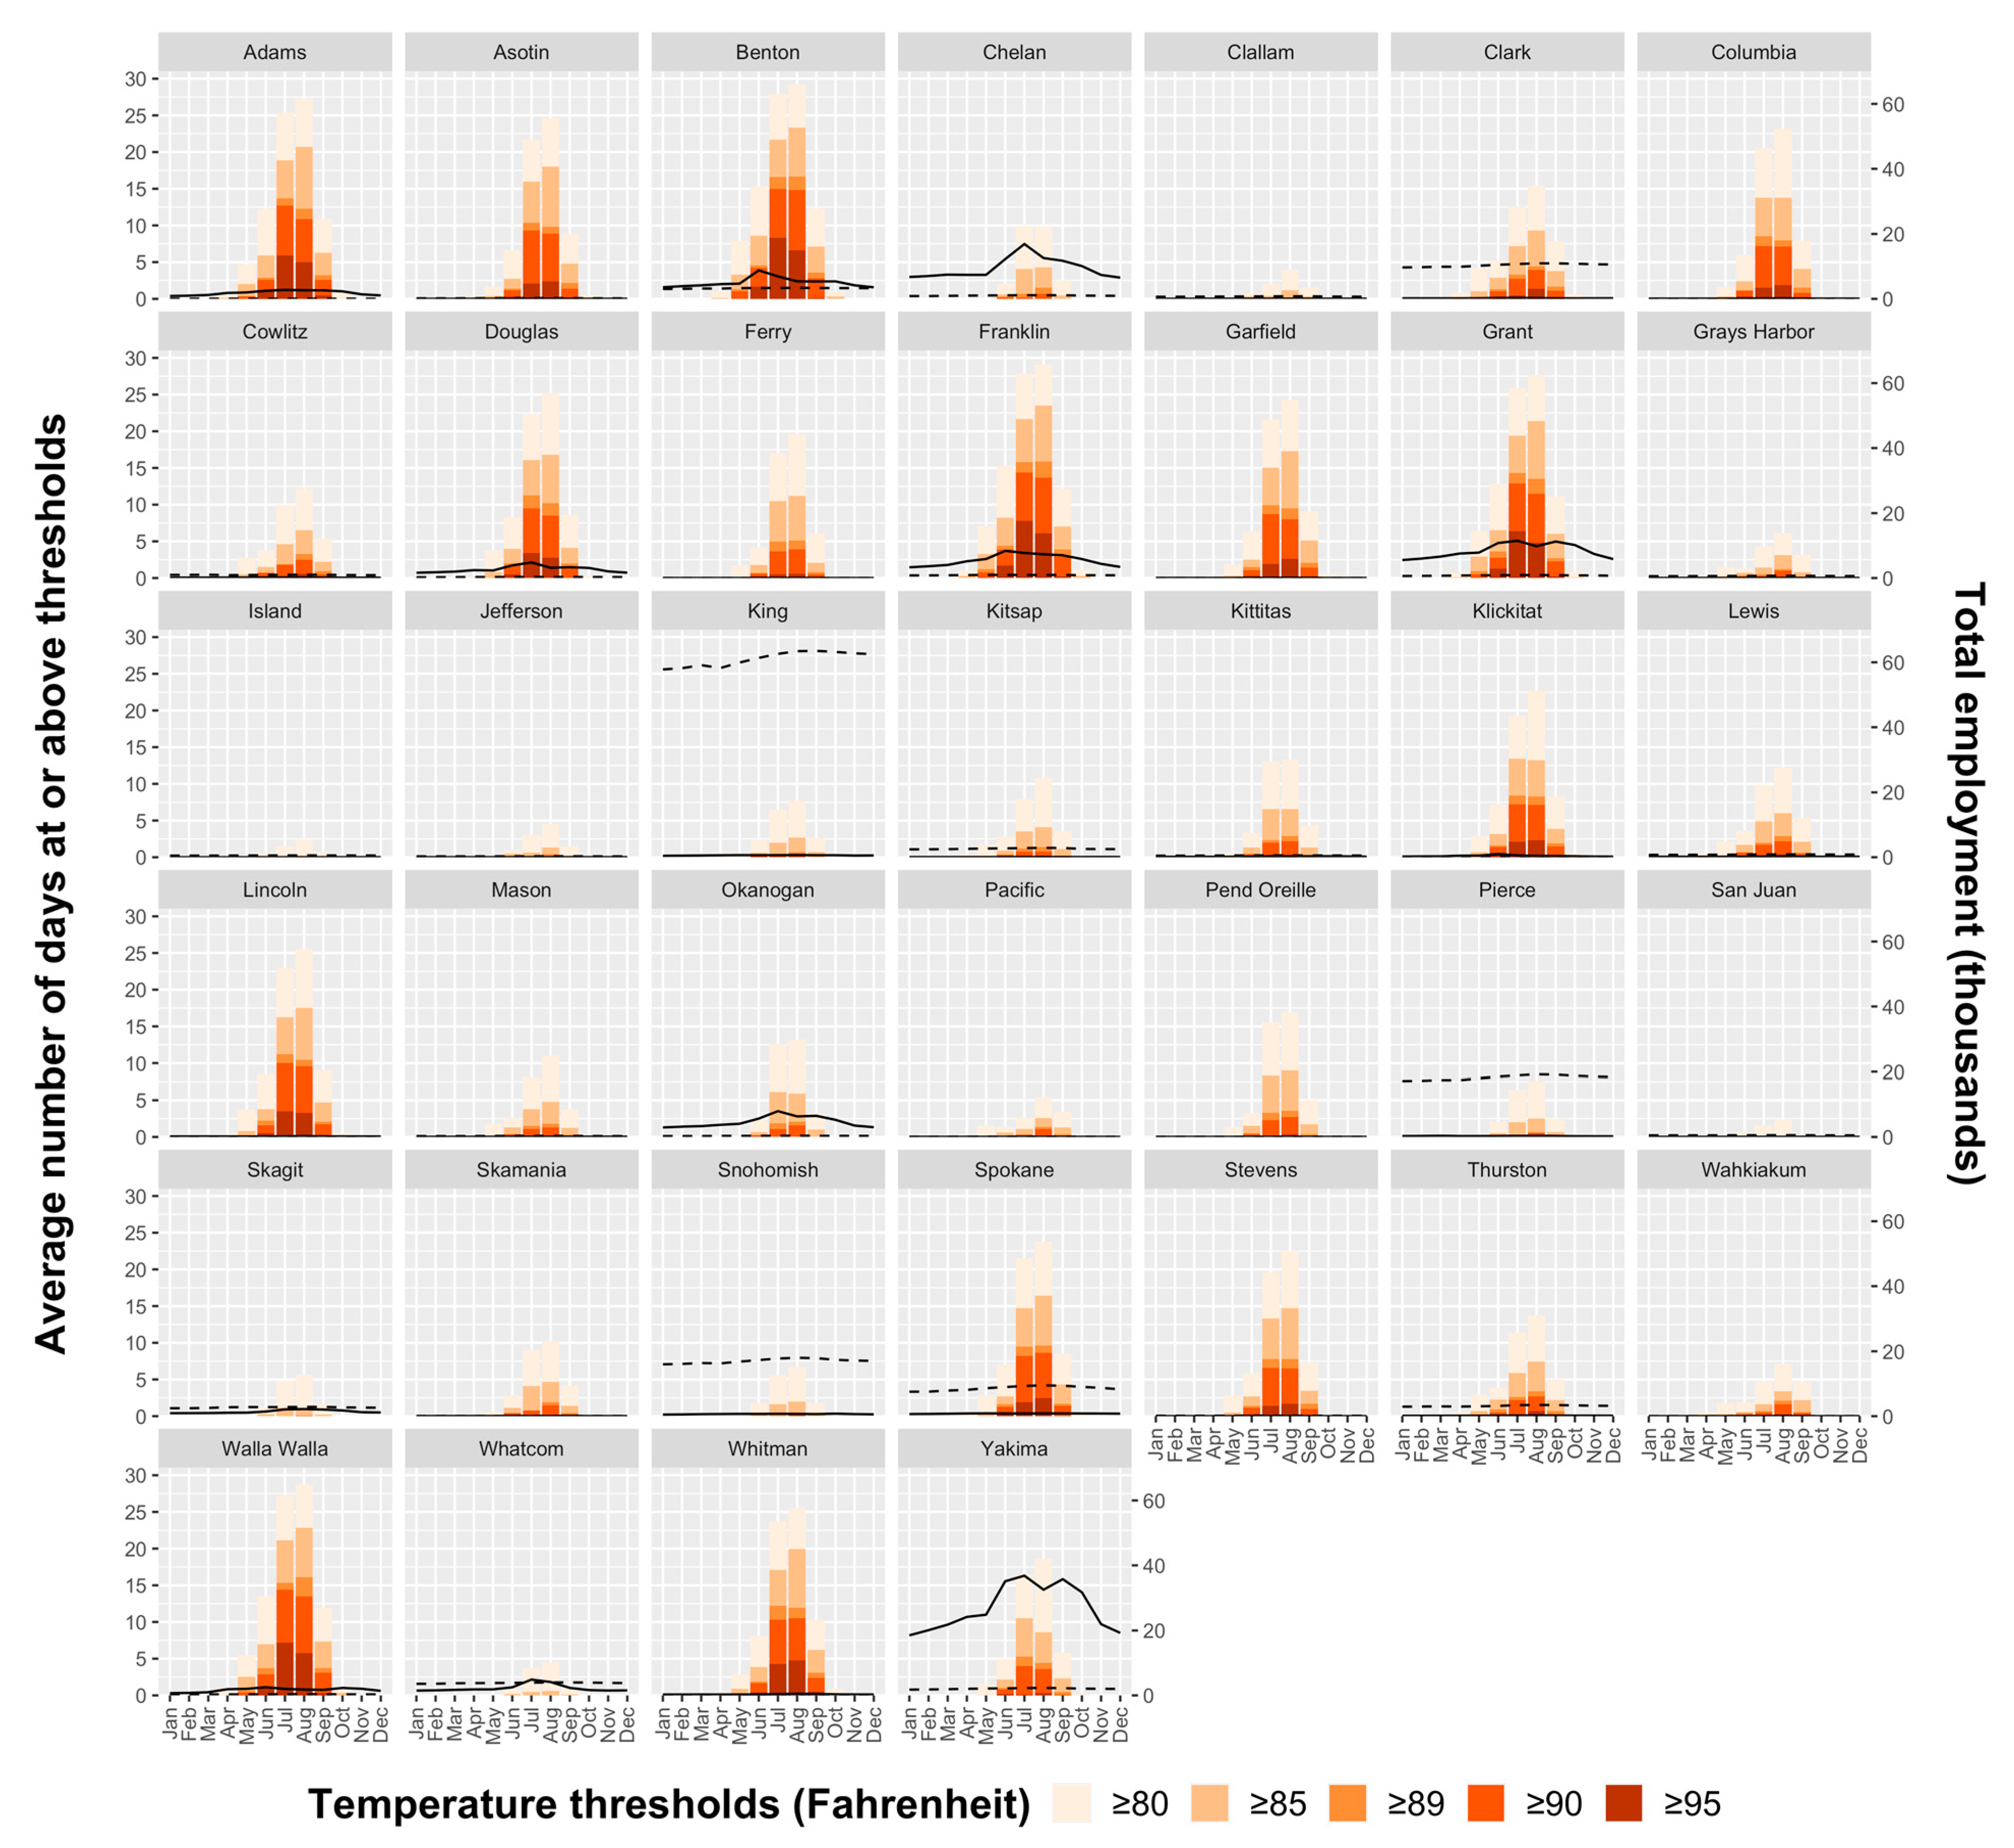
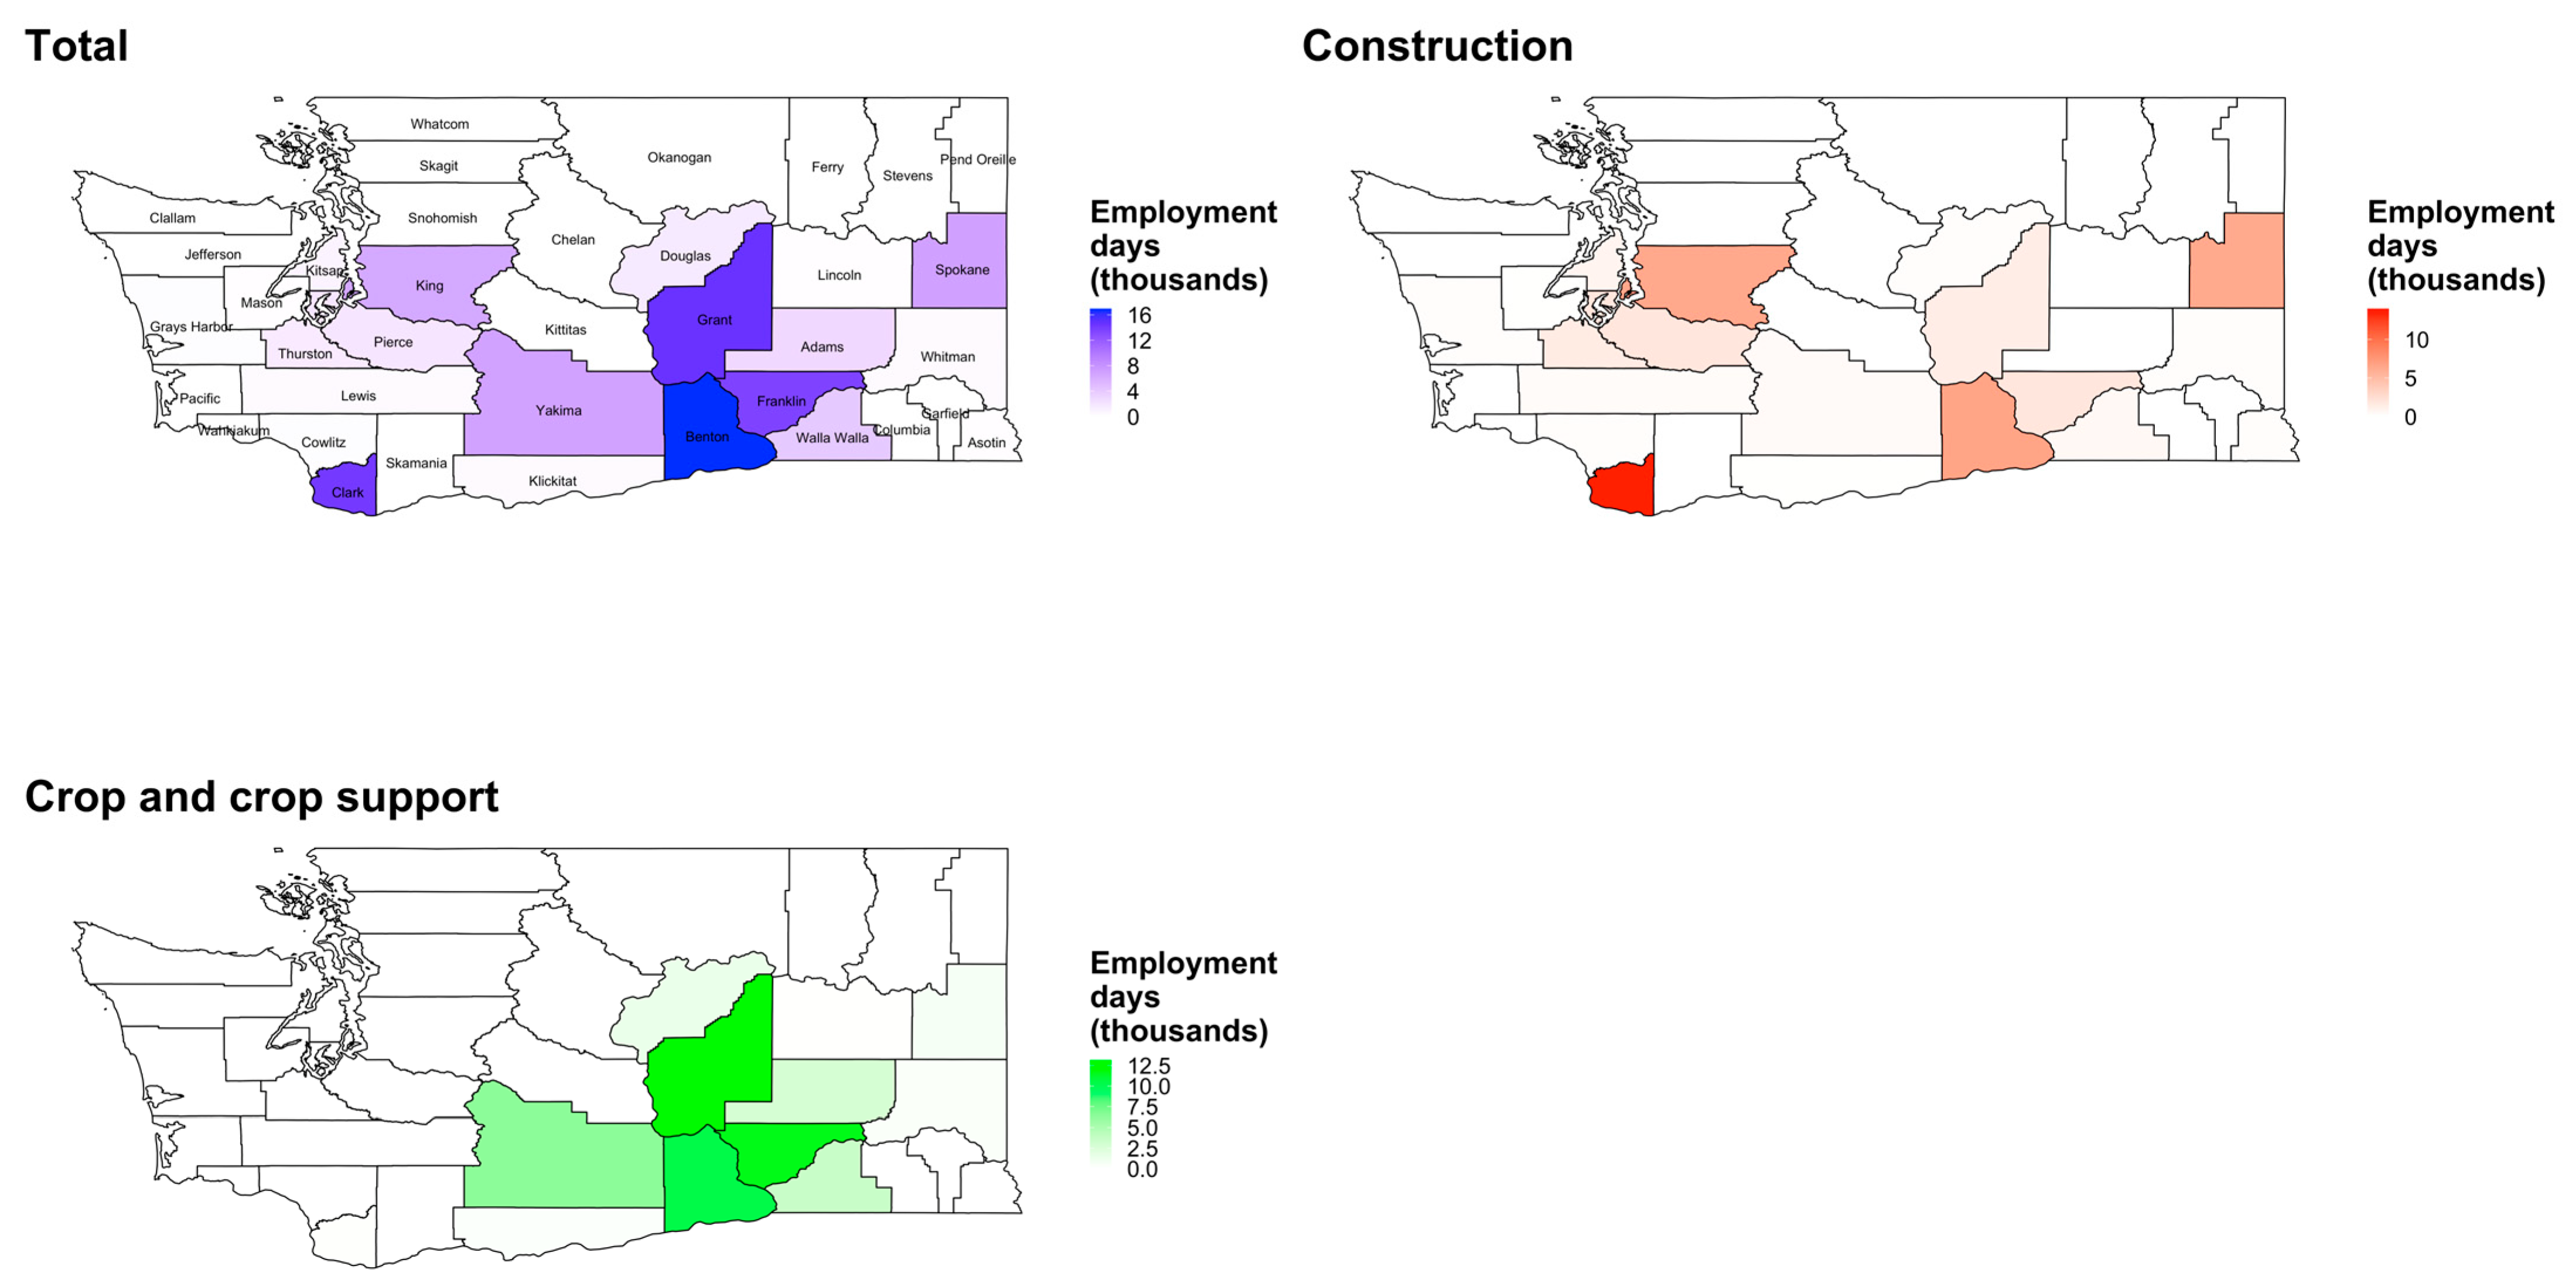
3.3. Relationship between Temperature Threshold Exceedances and Crop and Construction Employment
3.4. Secondary Analyses
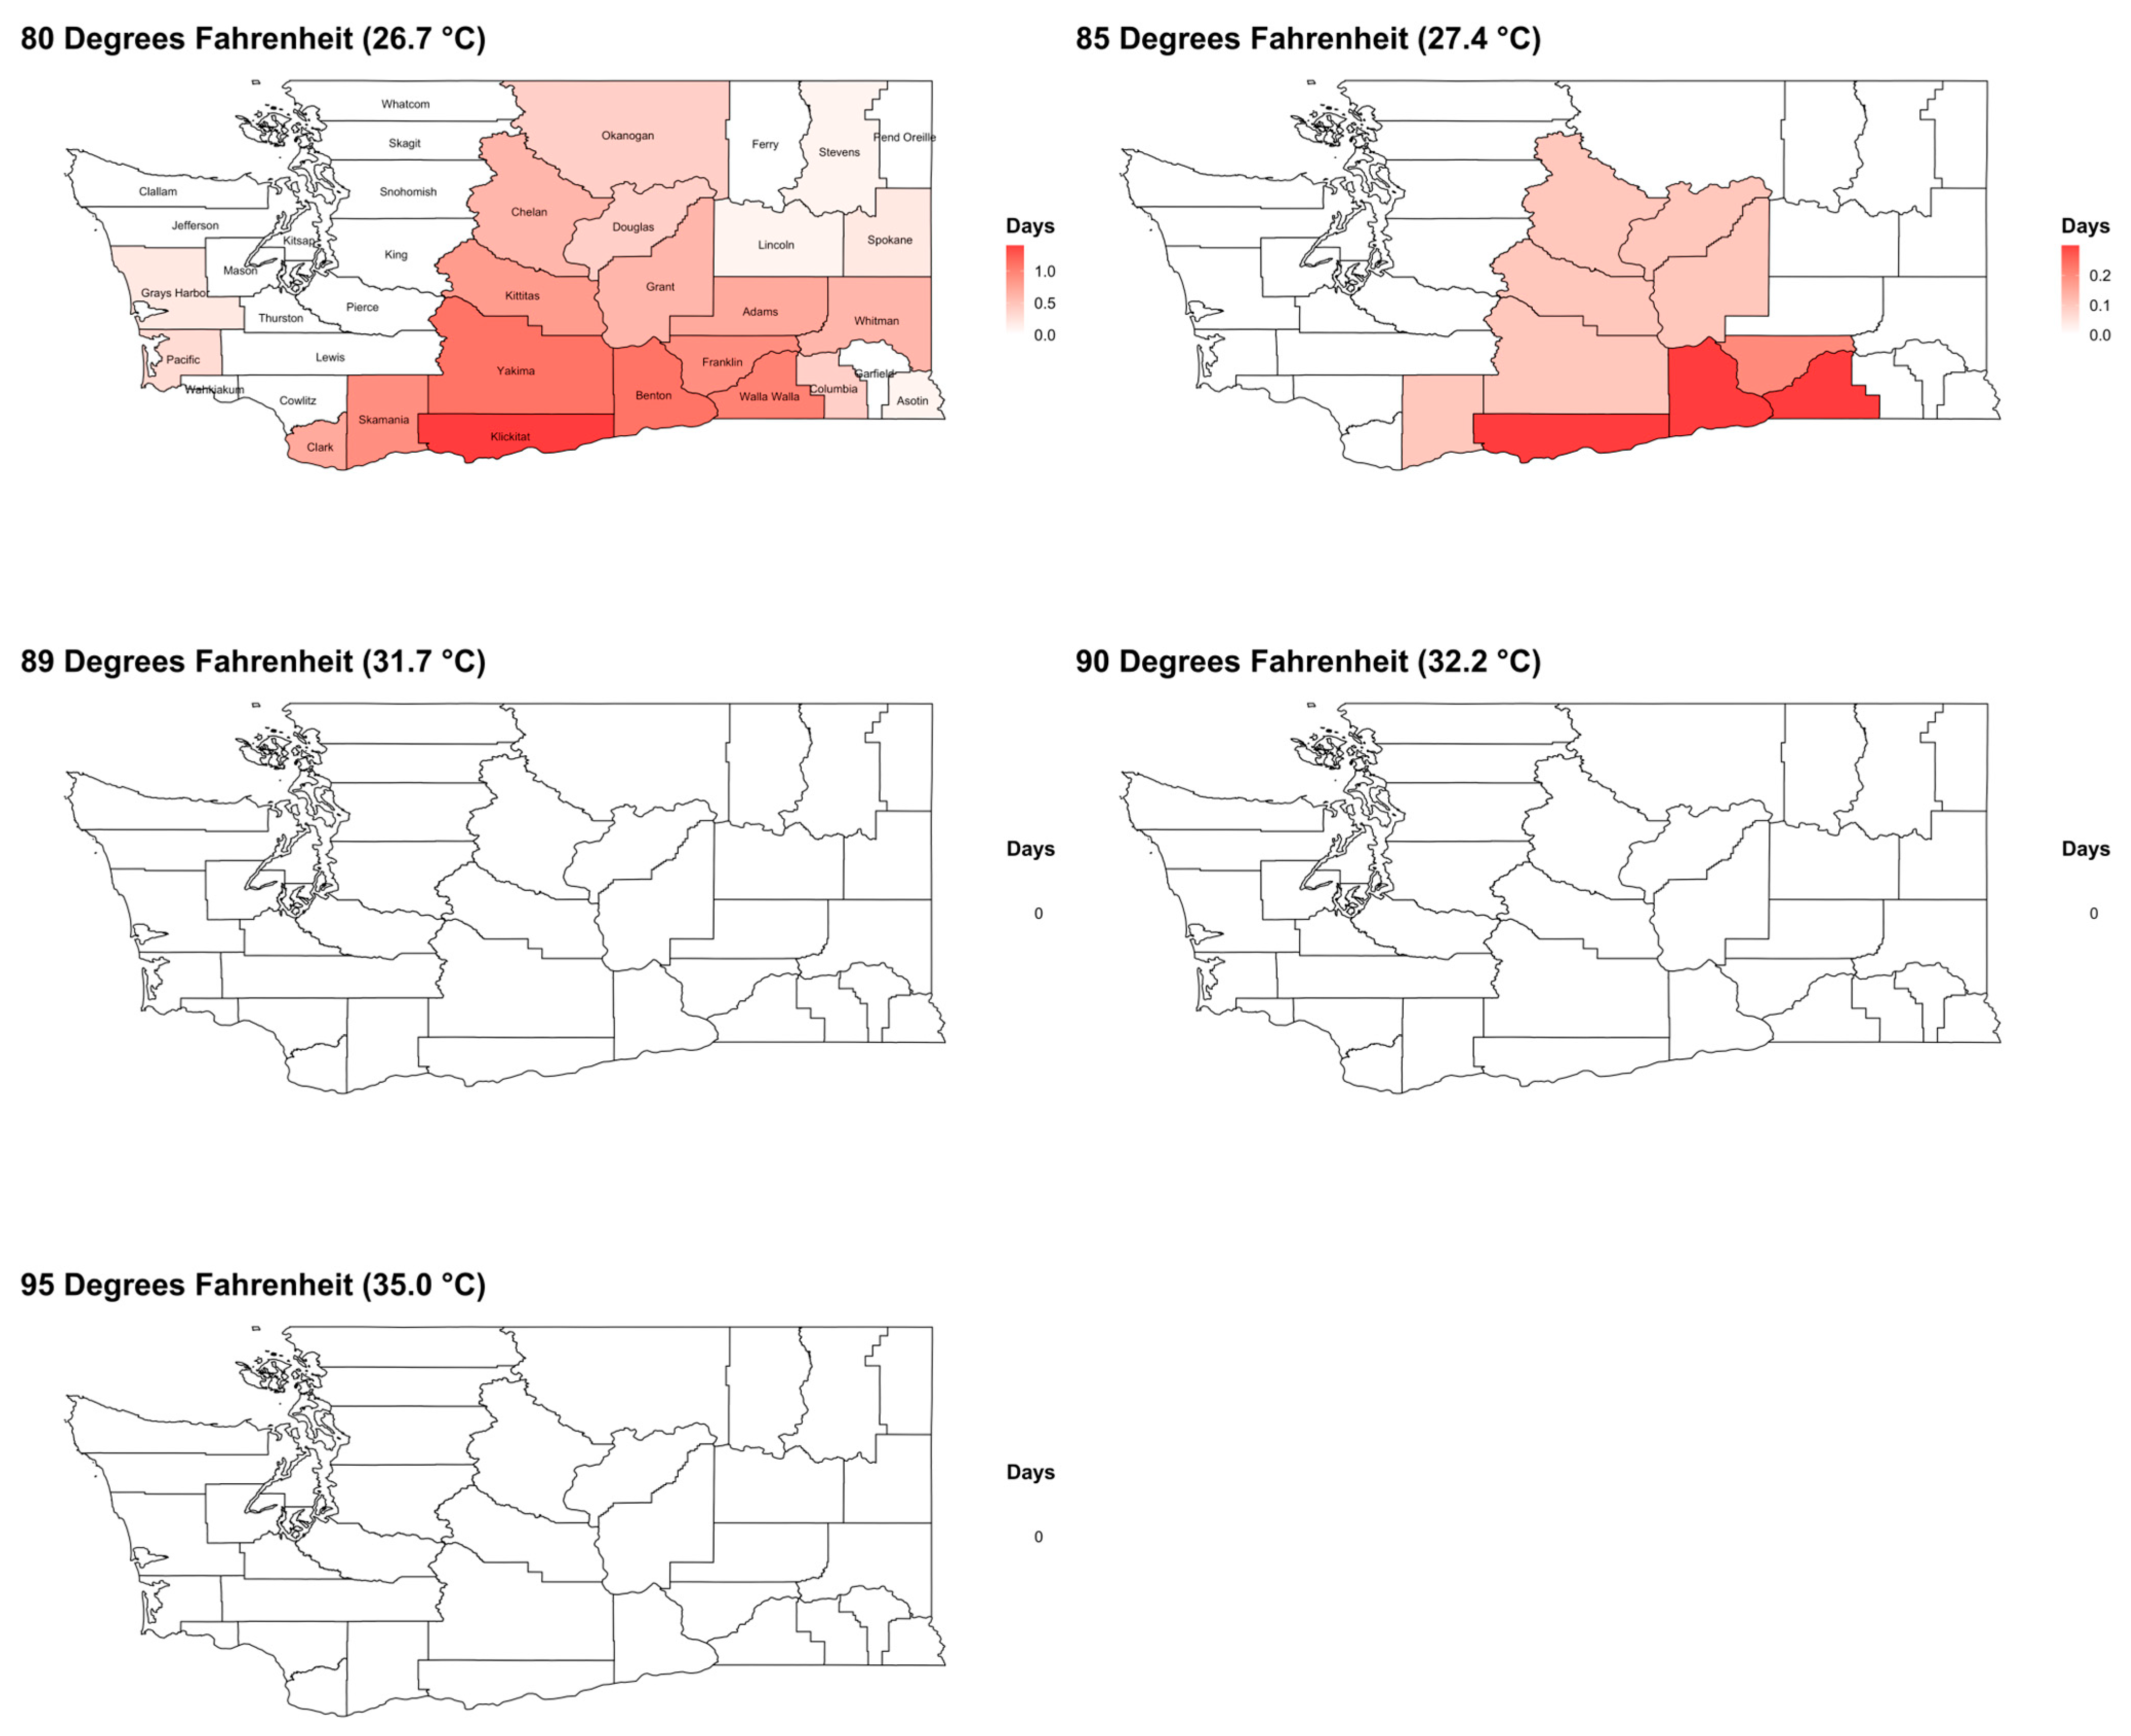
3.4.1. AgWeatherNet (AWN)
AWN Temperature Exposures
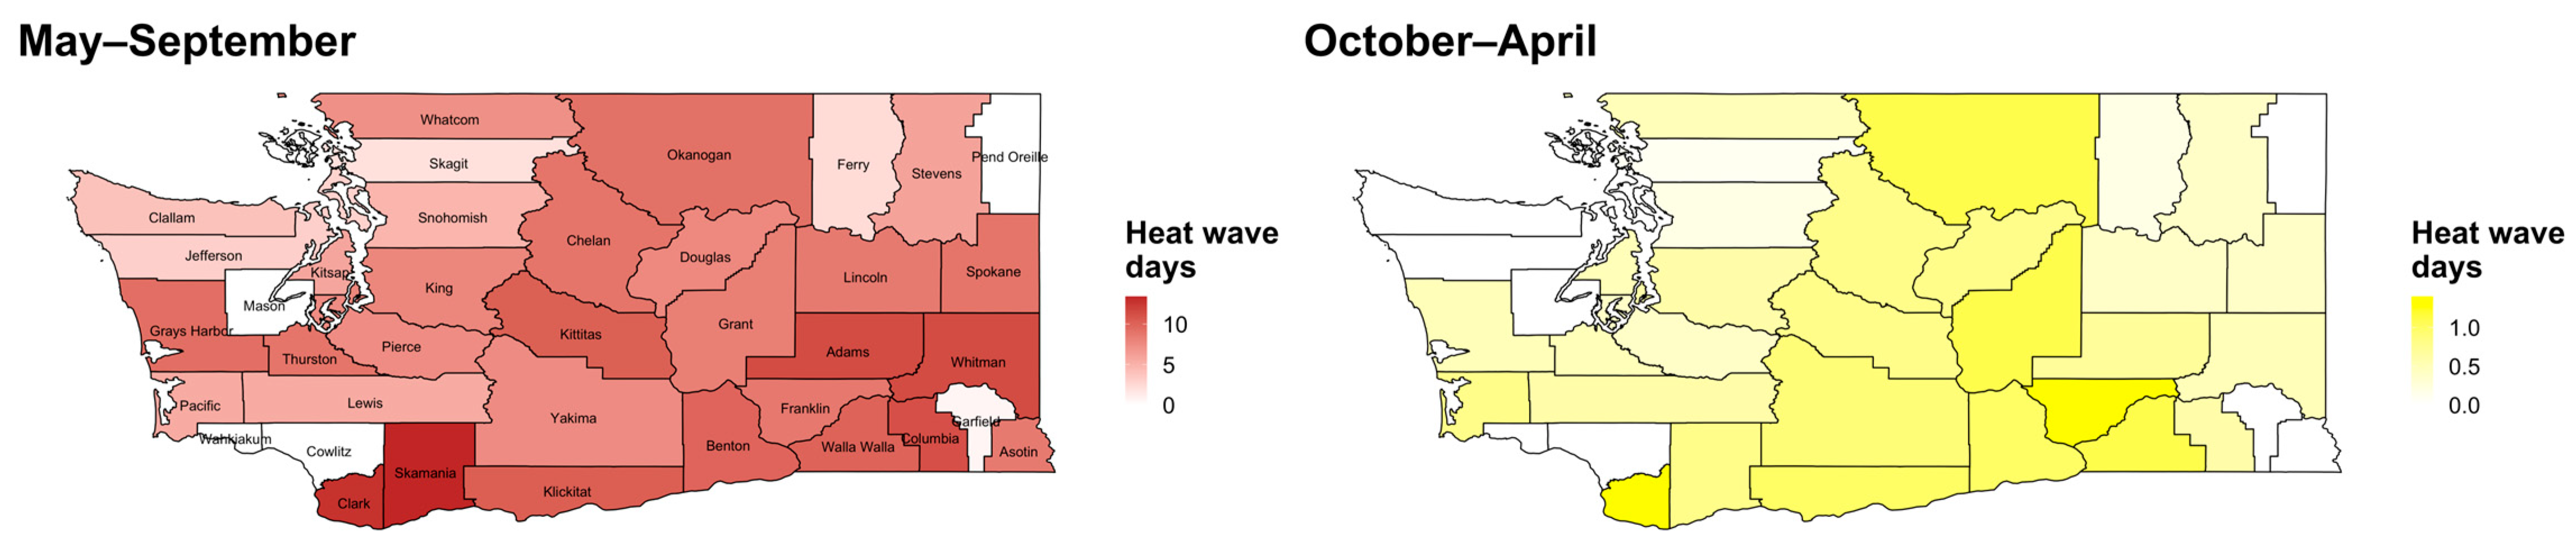
Heatwave Days and Employment Days at Risk (AWN)
4. Discussion
4.1. Implications for Heat Rule Decision-Making
4.2. Considerations for Other Settings and Jurisdictions
4.3. Strengths and Limitations
5. Conclusions
Supplementary Materials
Author Contributions
Funding
Institutional Review Board Statement
Informed Consent Statement
Data Availability Statement
Acknowledgments
Conflicts of Interest
Appendix A


References
- Gubernot, D.M.; Anderson, G.B.; Hunting, K.L. Characterizing occupational heat-related mortality in the United States, 2000-2010: An analysis using the census of fatal occupational injuries database. Am. J. Ind. Med. 2015, 58, 203–211. [Google Scholar] [CrossRef] [PubMed]
- Hesketh, M.; Wuellner, S.; Robinson, A.; Adams, D.; Smith, C.; Bonauto, D. Heat related illness among workers in Washington State: A descriptive study using workers’ compensation claims, 2006–2017. Am. J. Ind. Med. 2020, 63, 300–311. [Google Scholar] [CrossRef] [PubMed]
- Heinzerling, A.; Laws, R.L.; Frederick, M.; Jackson, R.; Windham, G.; Materna, B.; Harrison, R. Risk factors for occupational heat–related illness among California workers, 2000–2017. Am. J. Ind. Med. 2020, 63, 1145–1154. [Google Scholar] [CrossRef] [PubMed]
- Moyce, S.; Joseph, J.; Tancredi, D.; Mitchell, D.; Schenker, M. Cumulative Incidence of Acute Kidney Injury in California’s Agricultural Workers. J. Occup. Environ. Med. 2016, 58, 391–397. [Google Scholar] [CrossRef] [PubMed]
- Shi, D.S.; Weaver, V.M.; Hodgson, M.J.; Tustin, A.W. Hospitalised heat-related acute kidney injury in indoor and outdoor workers in the USA. Occup. Environ. Med. 2022, 79, 184–191. [Google Scholar] [CrossRef] [PubMed]
- Calkins, M.M.; Bonauto, D.; Hajat, A.; Lieblich, M.; Seixas, N.; Sheppard, L.; Spector, J.T. A case-crossover study of heat exposure and injury risk among outdoor construction workers in Washington State. Scand. J. Work. Environ. Heal. 2019, 45, 588–599. [Google Scholar] [CrossRef]
- Spector, J.T.; Bonauto, D.K.; Sheppard, L.; Busch-Isaksen, T.; Calkins, M.; Adams, D.; Lieblich, M.; Fenske, R.A. A Case-Crossover Study of Heat Exposure and Injury Risk in Outdoor Agricultural Workers. PLoS ONE 2016, 11, e0164498. [Google Scholar] [CrossRef]
- Spector, J.T.; Masuda, Y.J.; Wolff, N.H.; Calkins, M.; Seixas, N. Heat Exposure and Occupational Injuries: Review of the Literature and Implications. Curr. Environ. Health Rep. 2019, 6, 286–296. [Google Scholar] [CrossRef]
- Binazzi, A.; Levi, M.; Bonafede, M.; Bugani, M.; Messeri, A.; Morabito, M.; Marinaccio, A.; Baldasseroni, A. Evaluation of the impact of heat stress on the occurrence of occupational injuries: Meta-analysis of observational studies. Am. J. Ind. Med. 2019, 62, 233–243. [Google Scholar] [CrossRef]
- Washington State Department of Labor and Industries. Ambient Heat Exposure Rulemaking. 2021. Available online: https://lni.wa.gov/safety-health/safety-rules/rulemaking-stakeholder-information/ambient-heat-exposure-rulemaking#additional-resources (accessed on 26 December 2021).
- Oregon OSHA. Rules to Address Employee and Labor Housing Occupant Exposure to High Ambient Temperatures. 2022. Available online: https://osha.oregon.gov/OSHARules/adopted/2022/ao3-2022-text-alh-heat.pdf (accessed on 7 July 2022).
- Hogan, L.J. House Bill 722, Labor and Employment—Occupational Safety and Health—Heat Stress Standards. Title 5, Subtitle 12 of the Labor and Employment Article, Annotated Code of Maryland, Chapter 308. 2020. Available online: https://mgaleg.maryland.gov/2020RS/Chapters_noln/CH_308_hb0722t.pdf (accessed on 5 May 2022).
- Department of Business and Industry D of IROS & HA. Agency Draft of Proposed Regulation R053-20. 2022. Available online: https://dir.nv.gov/uploadedFiles/dir.nv.gov/content/OSHA/Features/R053-20%20Proposed%20Heat%20Illness%20Regulation%20-%202.28.22(3).pdf (accessed on 30 May 2022).
- US Occupational Safety and Health Administration (OSHA). Heat Injury and Illness Prevention in Outdoor and Indoor Work Settings Rulemaking. 2021. Available online: https://www.osha.gov/heat-exposure/rulemaking (accessed on 31 March 2022).
- Washington State Legislature. Chapter 34.05 RCW: Administrative Procedure Act n.d. Available online: https://app.leg.wa.gov/rcw/default.aspx?cite=34.05 (accessed on 6 April 2022).
- ACGIH. Heat Stress and Strain: TLV® Physical Agents; American Conference of Governmental Industrial Hygienists: Cincinnati, OH, USA, 2015. [Google Scholar]
- Lemke, B.; Kjellstrom, T. Calculating Workplace WBGT from Meteorological Data: A Tool for Climate Change Assessment. Ind. Health 2012, 50, 267–278. [Google Scholar] [CrossRef] [Green Version]
- Rothfusz, L. The Heat Index “Equation” (or, More than You Ever Wanted to Know about Heat Index); Technical Attachment No. SR 90-23; NWS S. Reg. Headquarters: Forth Worth, TX, USA, 1990. [Google Scholar]
- Bernard, T.E.; Iheanacho, I. Heat Index and Adjusted Temperature as Surrogates for Wet Bulb Globe Temperature to Screen for Occupational Heat Stress. J. Occup. Environ. Hyg. 2015, 12, 323–333. [Google Scholar] [CrossRef] [PubMed]
- Tustin, A.W.; Lamson, G.E.; Jacklitsch, B.; Thomas, R.J.; Arbury, S.B.; Cannon, D.L.; Gonzales, R.G.; Hodgson, M.J. Evaluation of Occupational Exposure Limits for Heat Stress in Outdoor Workers—United States, 2011–2016. MMWR. Morb. Mortal. Wkly. Rep. 2018, 67, 733–737. [Google Scholar] [CrossRef] [PubMed]
- Garzón-Villalba, X.; Ashley, C.D.; Bernard, T.E. Benchmarking Heat Index as an occupational exposure limit for heat stress. J. Occup. Environ. Hyg. 2019, 16, 557–563. [Google Scholar] [CrossRef] [PubMed]
- National Institute for Occupational Safety and Health. Acclimatization 2018. Available online: https://www.cdc.gov/niosh/topics/heatstress/acclima.html (accessed on 6 April 2022).
- Périard, J.D.; Racinais, S.; Sawka, M.N. Adaptations and mechanisms of human heat acclimation: Applications for competitive athletes and sports. Scand. J. Med. Sci. Sports 2015, 25, 20–38. [Google Scholar] [CrossRef]
- Washington State Legislature. Chapter 296–307 WAC Safety Standards for Agriculture. 2021. Available online: http://apps.leg.wa.gov/WAC/default.aspx?cite=296-307&full=true#296-307-097 (accessed on 9 March 2022).
- Washington State Legislature. Chapter 296-62 WAC General Occupational Health Standards. 2018. Available online: https://app.leg.wa.gov/WAC/default.aspx?cite=296-62-095 (accessed on 12 September 2022).
- California Division of Occupational Safety and Health. California Code of Regulations, Title 8, Section 3395 Heat illness Prevention. 2006. Available online: http://www.dir.ca.gov/Title8/3395.html (accessed on 19 September 2021).
- Washington State Department of Labor and Industries. Outdoor Heat Exposure Concise Explanatory Statement; Washington State Department of Labor and Industries: Tumwater, WA, USA, 2008.
- IPCC. Climate Change 2014: Impacts, Adaptation, and Vulnerability; Part A: Global and Sectoral Aspects. Contribution of Working Group II to the Fifth Assessment Report of the Intergovernmental Panel on Climate Change; Cambridge University Press: Cambridge, UK; New York, NY, USA, 2014. [Google Scholar]
- WA Safety and Health Assessment and Research for Prevention (SHARP) Program. Washington Workers’ Compensation Heat-Related Illness (HRI) Claims. Number of Accepted State Fund Claims by Year, 2006–2021. 76-30-2022. 2022. Available online: https://www.lni.wa.gov/safety-health/safety-research/files/2022/76_30_2022_HeatRelatedIllness.pdf (accessed on 12 September 2022).
- Philip, S.Y.; Kew, S.F.; van Oldenborgh, G.J.; Anslow, F.S.; Seneviratne, S.I.; Vautard, R.; Coumou, D.; Ebi, K.L.; Arrighi, J.; Singh, R.; et al. Rapid Attribution Analysis of the Extraordinary Heatwave on the Pacific Coast of the US and Canada. 2021. Available online: https://www.worldweatherattribution.org/western-north-american-extreme-heat-virtually-impossible-without-human-caused-climate-change/ (accessed on 31 March 2022).
- Washington State Employment Security Department. Agricultural and Seasonal Workforce Services Report; 2020. Available online: https://esdorchardstorage.blob.core.windows.net/esdwa/Default/ESDWAGOV/newsroom/Legislative-resources/2020-asws-report-approved-final-v3.pdf (accessed on 12 September 2022).
- Washington State Department of Agriculture. Washington Agriculture Snapshot. 2021. Available online: https://cms.agr.wa.gov/WSDAKentico/Documents/Pubs/641-WSDAAgInfographic-WEB.pdf?/641-WSDAAgInfographic-WEB (accessed on 31 March 2022).
- Washington State Department of Agriculture. Harvest Schedules. 2022. Available online: https://agr.wa.gov/forms-and-publications/publications/harvest-schedules (accessed on 31 March 2022).
- US Citizenship and Immigration Service. H-2A Temporary Agricultural Workers. 2021. Available online: https://www.uscis.gov/working-in-the-united-states/temporary-workers/h-2a-temporary-agricultural-workers (accessed on 9 March 2022).
- Zuidema, C.; Austin, E.; Cohen, M.A.; Kasner, E.; Liu, L.; Isaksen, T.B.; Lin, K.-Y.; Spector, J.; Seto, E. Potential impacts of Washington State’s wildfire worker protection rule on construction workers. Ann. Work Expo. Health 2022, 66, 419–432. [Google Scholar] [CrossRef]
- Washington State Department of Commerce. Washington’s Diverse Climate and Geography. 2022. Available online: http://choosewashingtonstate.com/research-resources/about-washington/climate-geography/ (accessed on 9 March 2022).
- Daly, C.; Halbleib, M.; Smith, J.I.; Gibson, W.P.; Doggett, M.K.; Taylor, G.H.; Curtis, J.; Pasteris, P.P. Physiographically sensitive mapping of climatological temperature and precipitation across the conterminous United States. Int. J. Clim. 2008, 28, 2031–2064. [Google Scholar] [CrossRef]
- Behnke, R.; Vavrus, S.; Allstadt, A.; Albright, T.; Thogmartin, W.E.; Radeloff, V.C. Evaluation of downscaled, gridded climate data for the conterminous United States. Ecol. Appl. 2016, 26, 1338–1351. [Google Scholar] [CrossRef]
- OSHA-NIOSH. OSHA-NIOSH Heat Safety Tool App. 2021. Available online: https://www.cdc.gov/niosh/topics/heatstress/heatapp.html (accessed on 26 December 2021).
- Washington State University. The Washington Agricultural Weather Network Version 2.0, WSU Prosser—AgWeatherNet. 2013. Available online: http://weather.wsu.edu/awn.php (accessed on 9 March 2022).
- PRISM Climate Group; Oregon State University. PRISM Climate Data. 2022. Available online: https://www.prism.oregonstate.edu/ (accessed on 14 April 2022).
- US Bureau of Labor Statistics. Quarterly Census of Employment and Wages: Data Files. 2020. Available online: https://www.bls.gov/cew/downloadable-data-files.htm (accessed on 14 April 2022).
- WA Department of Commerce. Independent Contractor Study. Final Report per ESSB 6032. 2019. Available online: http://www.commerce.wa.gov/wp-content/uploads/2019/07/Leg-Report-Independent-Contractor-Study-2019.pdf (accessed on 7 July 2022).
- R Development Core Team. R: A Language and Environment for Statistical Computing. R Foundation for Statistical Computing. 2011. Available online: http://www.r-project.org (accessed on 9 March 2022).
- Spector, J.T.; Krenz, J.; Rauser, E.; Bonauto, D.K. Heat-related illness in Washington State agriculture and forestry sectors. Am. J. Ind. Med. 2014, 57, 881–895. [Google Scholar] [CrossRef]
- Bonauto, D. (Safety & Health Assessment and Research for Prevention Program). Personal Communication, 2022. [Google Scholar]
- Ioannou, L.G.; Tsoutsoubi, L.; Mantzios, K.; Vliora, M.; Nintou, E.; Piil, J.F.; Notley, S.R.; Dinas, P.C.; Gourzoulidis, G.A.; Havenith, G.; et al. Indicators to assess physiological heat strain—Part 3: Multi-country field evaluation and consensus recommendations. Temperature 2022, 1–36, ahead of print. [Google Scholar] [CrossRef]
- Maung, Z.; Tustin, A.W. The Heat Death Line: Proposed Heat Index Alert Threshold for Preventing Heat-Related Fatalities in the Civilian Workforce. New Solut. J. Environ. Occup. Health Policy 2020, 30, 138–145. [Google Scholar] [CrossRef]
- Moyce, S.; Mitchell, D.; Armitage, T.; Tancredi, D.; Joseph, J.; Schenker, M. Heat strain, volume depletion and kidney function in California agricultural workers. Occup. Environ. Med. 2017, 74, 402–409. [Google Scholar] [CrossRef] [PubMed]
- Foster, J.; Smallcombe, J.W.; Hodder, S.; Jay, O.; Flouris, A.D.; Nybo, L.; Havenith, G. An advanced empirical model for quantifying the impact of heat and climate change on human physical work capacity. Int. J. Biometeorol. 2021, 65, 1215–1229. [Google Scholar] [CrossRef] [PubMed]
- Garzon-Villalba, X.P.; Mbah, A.; Wu, Y.; Hiles, M.; Moore, H.; Schwartz, S.W.; Bernard, T.E. Exertional heat illness and acute injury related to ambient wet bulb globe temperature. Am J Ind Med. 2016, 59, 1169–1176. [Google Scholar] [CrossRef] [PubMed]
- Adam-Poupart, A.; Smargiassi, A.; Busque, M.A.; Duguay, P.; Fournier, M.; Zayed, J.; Labrèche, F. Effect of summer outdoor temperatures on work-related injuries in Quebec (Canada). Occup Environ Med. 2015, 72, 338–345. [Google Scholar] [CrossRef]
- Arcury, T.A.; Summers, P.; Talton, J.W.; Nguyen, H.T.; Chen, H.; Quandt, S.A. Job Characteristics and Work Safety Climate among North Carolina Farmworkers with H-2A Visas. J. Agromed. 2015, 20, 64–76. [Google Scholar] [CrossRef] [Green Version]
- Economic Research Service; US Department of Labor. Farm Labor. 2022. Available online: https://www.ers.usda.gov/topics/farm-economy/farm-labor/ (accessed on 31 May 2022).


Publisher’s Note: MDPI stays neutral with regard to jurisdictional claims in published maps and institutional affiliations. |
© 2022 by the authors. Licensee MDPI, Basel, Switzerland. This article is an open access article distributed under the terms and conditions of the Creative Commons Attribution (CC BY) license (https://creativecommons.org/licenses/by/4.0/).
Share and Cite
Flunker, J.C.; Zuidema, C.; Jung, J.; Kasner, E.; Cohen, M.; Seto, E.; Austin, E.; Spector, J.T. Potential Impacts of Different Occupational Outdoor Heat Exposure Thresholds among Washington State Crop and Construction Workers and Implications for Other Jurisdictions. Int. J. Environ. Res. Public Health 2022, 19, 11583. https://doi.org/10.3390/ijerph191811583
Flunker JC, Zuidema C, Jung J, Kasner E, Cohen M, Seto E, Austin E, Spector JT. Potential Impacts of Different Occupational Outdoor Heat Exposure Thresholds among Washington State Crop and Construction Workers and Implications for Other Jurisdictions. International Journal of Environmental Research and Public Health. 2022; 19(18):11583. https://doi.org/10.3390/ijerph191811583
Chicago/Turabian StyleFlunker, John C., Christopher Zuidema, Jihoon Jung, Edward Kasner, Martin Cohen, Edmund Seto, Elena Austin, and June T. Spector. 2022. "Potential Impacts of Different Occupational Outdoor Heat Exposure Thresholds among Washington State Crop and Construction Workers and Implications for Other Jurisdictions" International Journal of Environmental Research and Public Health 19, no. 18: 11583. https://doi.org/10.3390/ijerph191811583
APA StyleFlunker, J. C., Zuidema, C., Jung, J., Kasner, E., Cohen, M., Seto, E., Austin, E., & Spector, J. T. (2022). Potential Impacts of Different Occupational Outdoor Heat Exposure Thresholds among Washington State Crop and Construction Workers and Implications for Other Jurisdictions. International Journal of Environmental Research and Public Health, 19(18), 11583. https://doi.org/10.3390/ijerph191811583