
Spatial-Temporal Characteristics and Driving Factors of the Eco-Efficiency of Tourist Hotels in China


Abstract
:1. Introduction
2. Literature Review and Research Framework
2.1. Literature on the Carbon Emissions of Hotels
2.2. Literature on the Eco-Efficiency Evaluation of Hotels
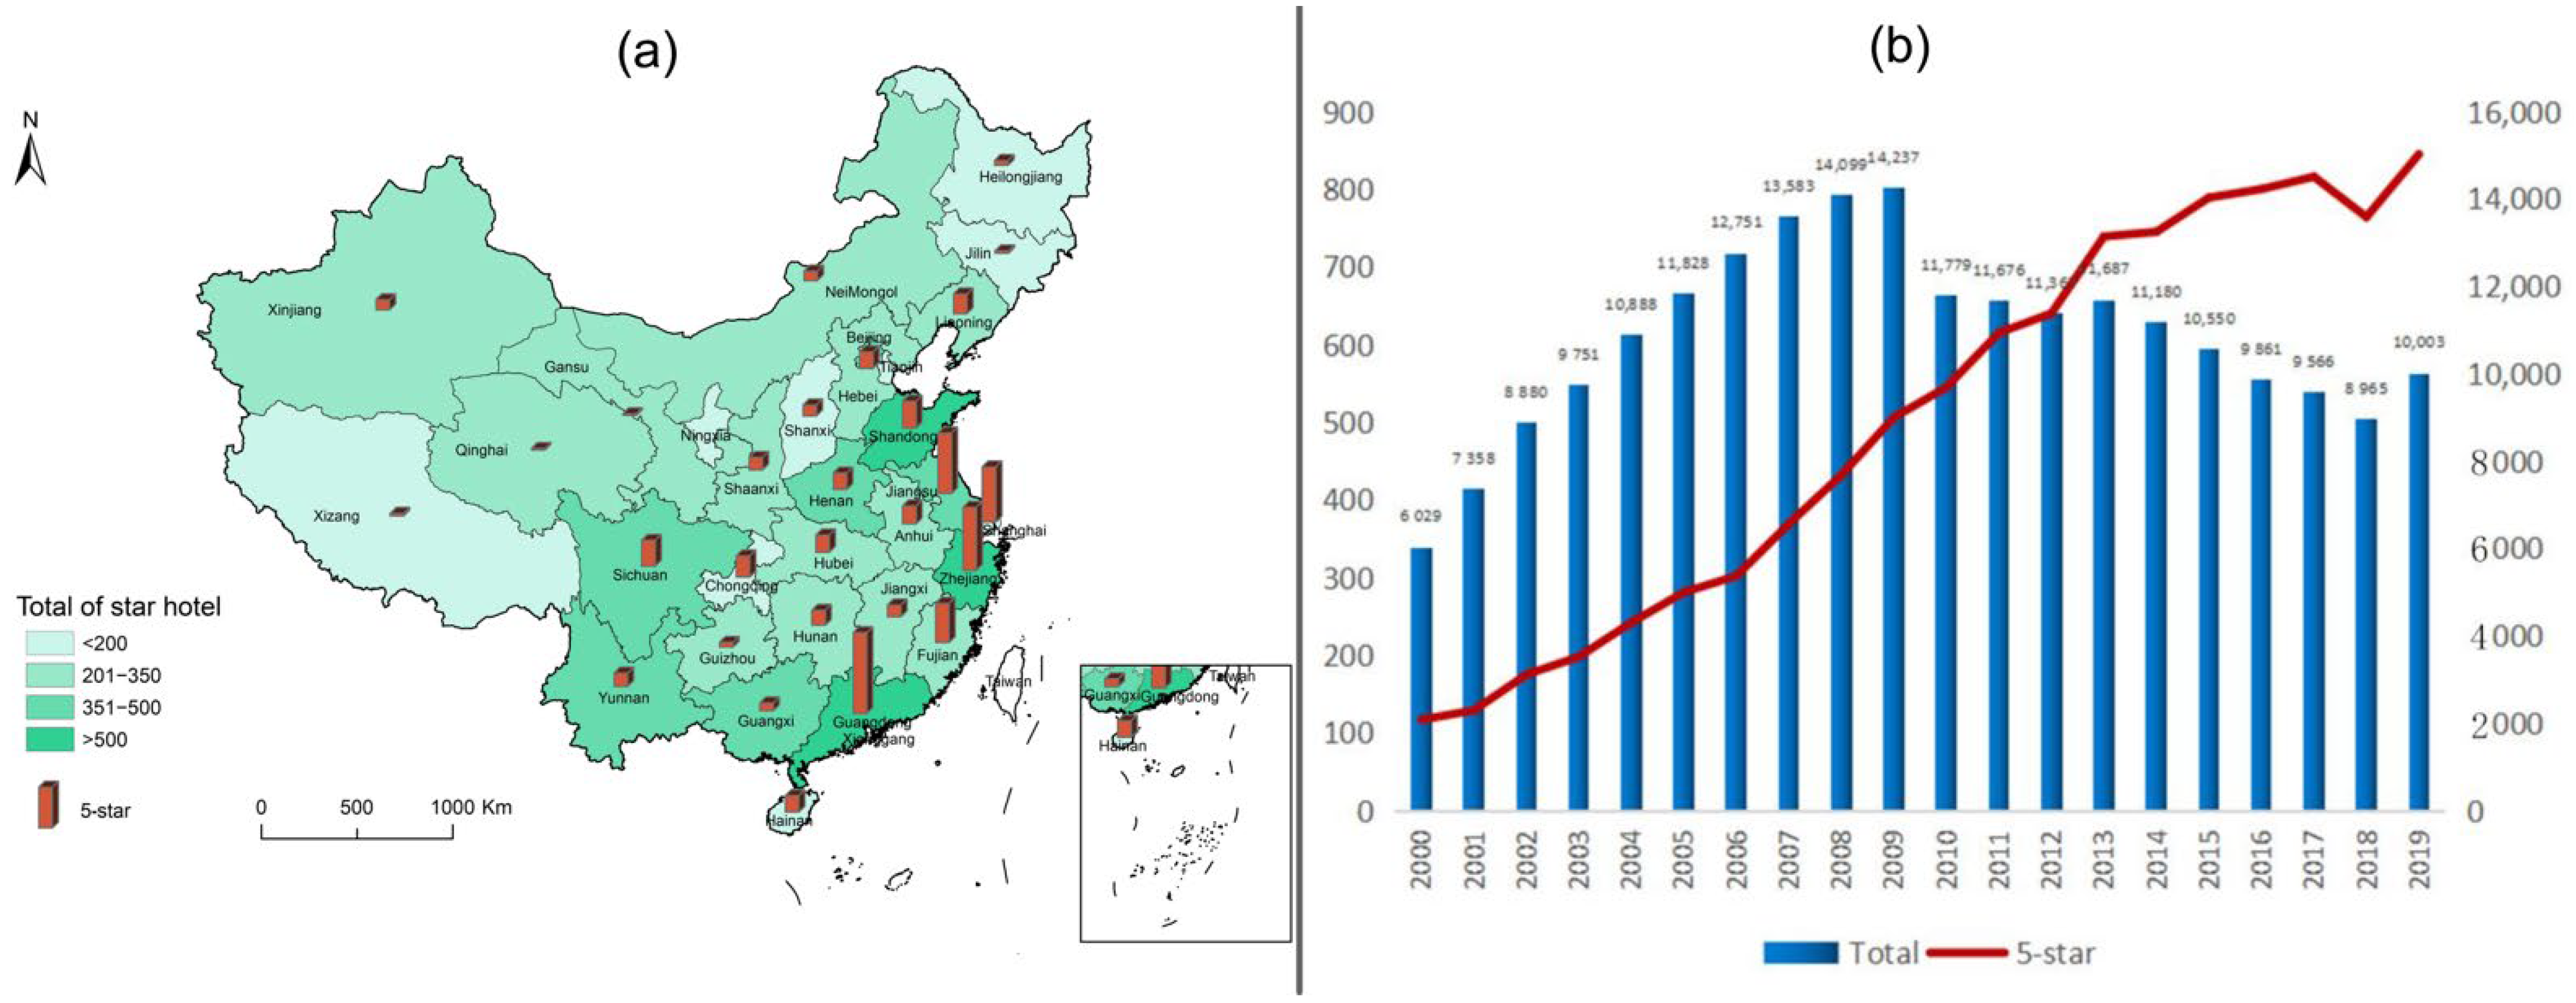
2.3. The Research Object
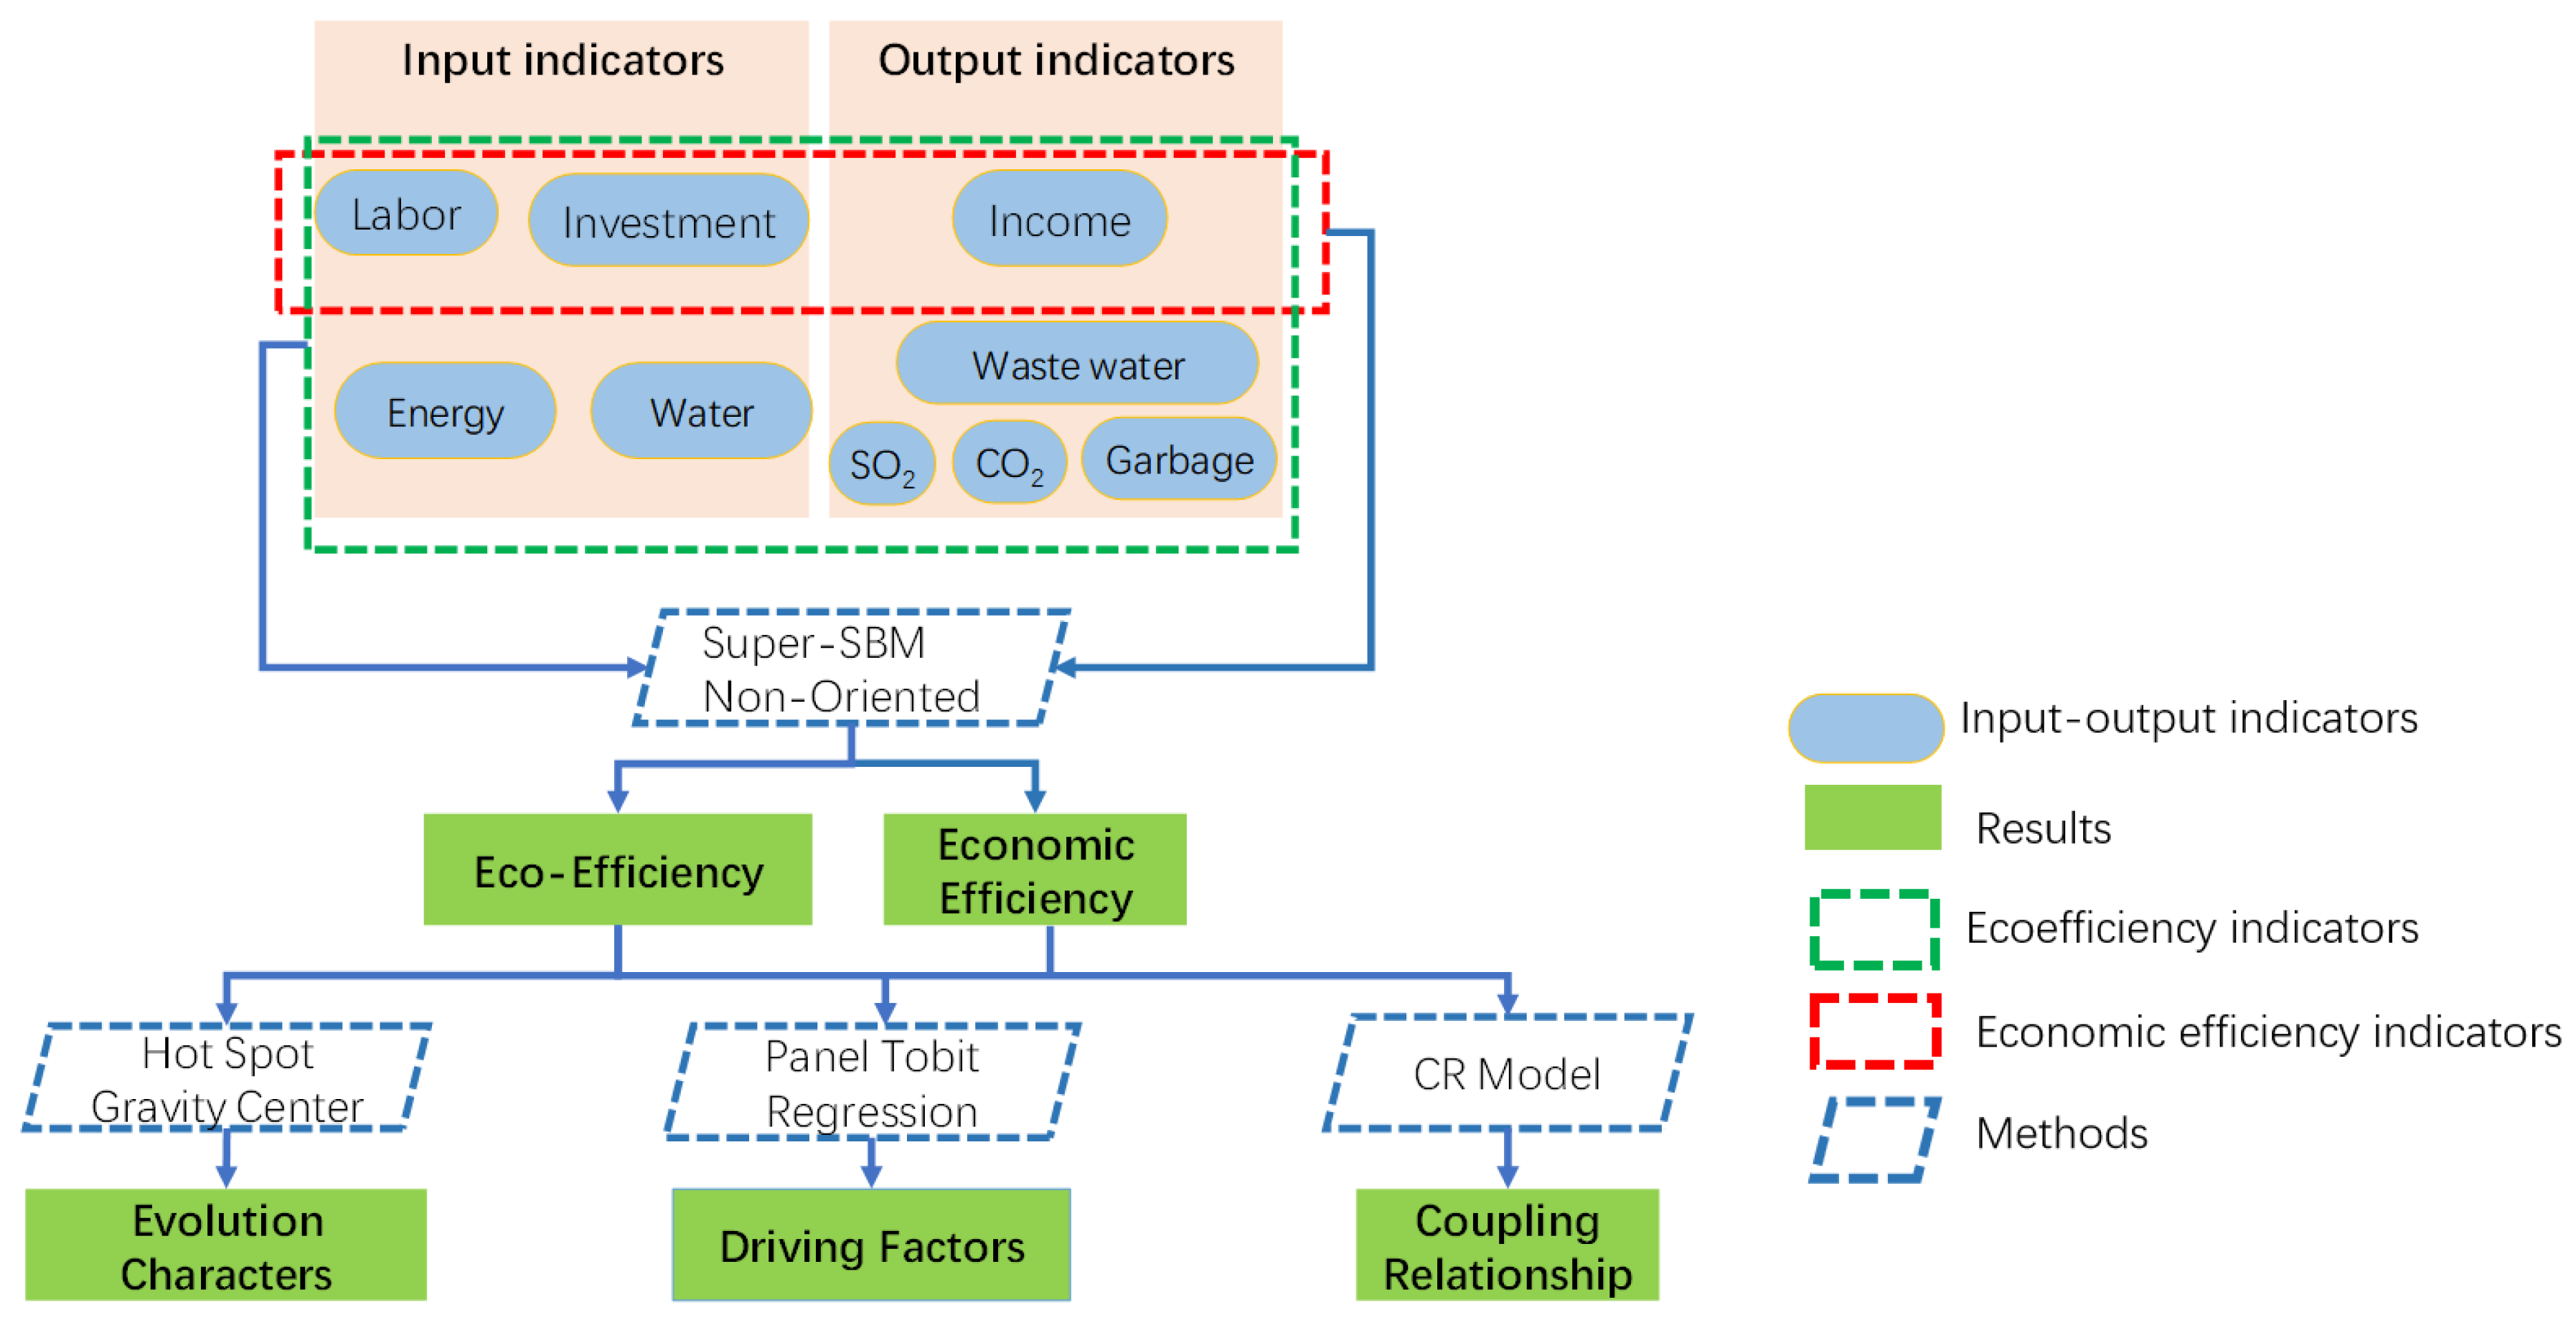
2.4. The Research Framework
3. Methods and Data
3.1. Economic and Eco-Efficiency Analysis Methods: Super-SBM Non-Oriented
3.2. Spatial Pattern Analysis
3.2.1. Hot Spot Analysis
3.2.2. Analysis of the Center of Gravity Coordinates
3.3. CR Model: Coupling Relationship
3.4. Driver Analysis: Panel Tobit Analysis
3.5. Indicators and Data
3.5.1. Indicators of Economic and Eco-Efficiency Analysis
3.5.2. Regression Model Indicator Selection and Model Building
3.6. Data Sources
4. Results
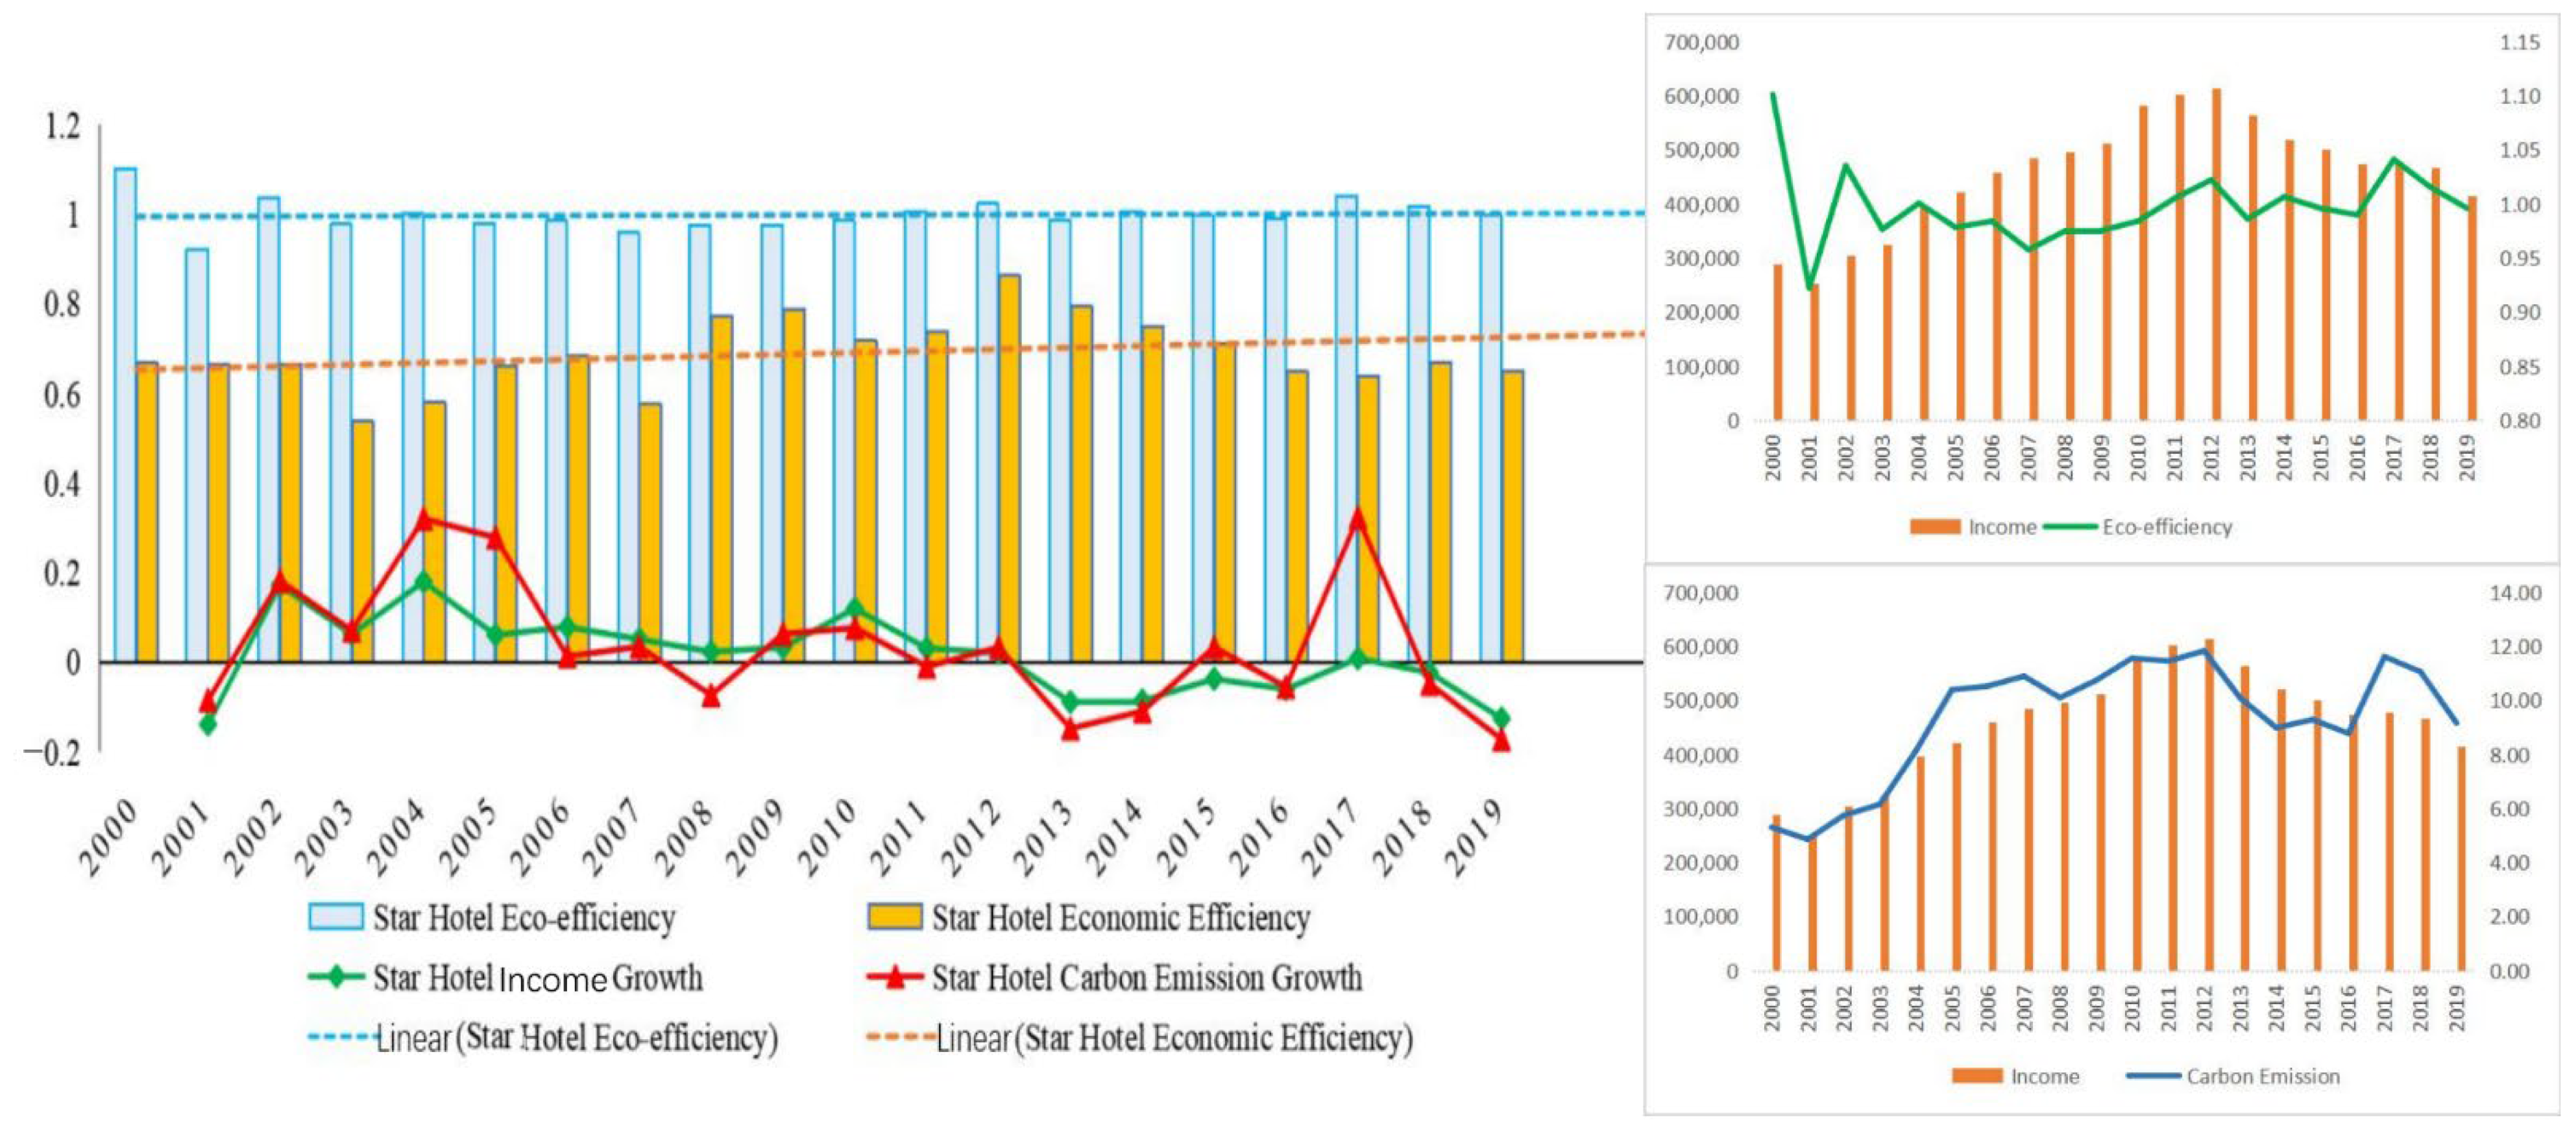
4.1. General Trends
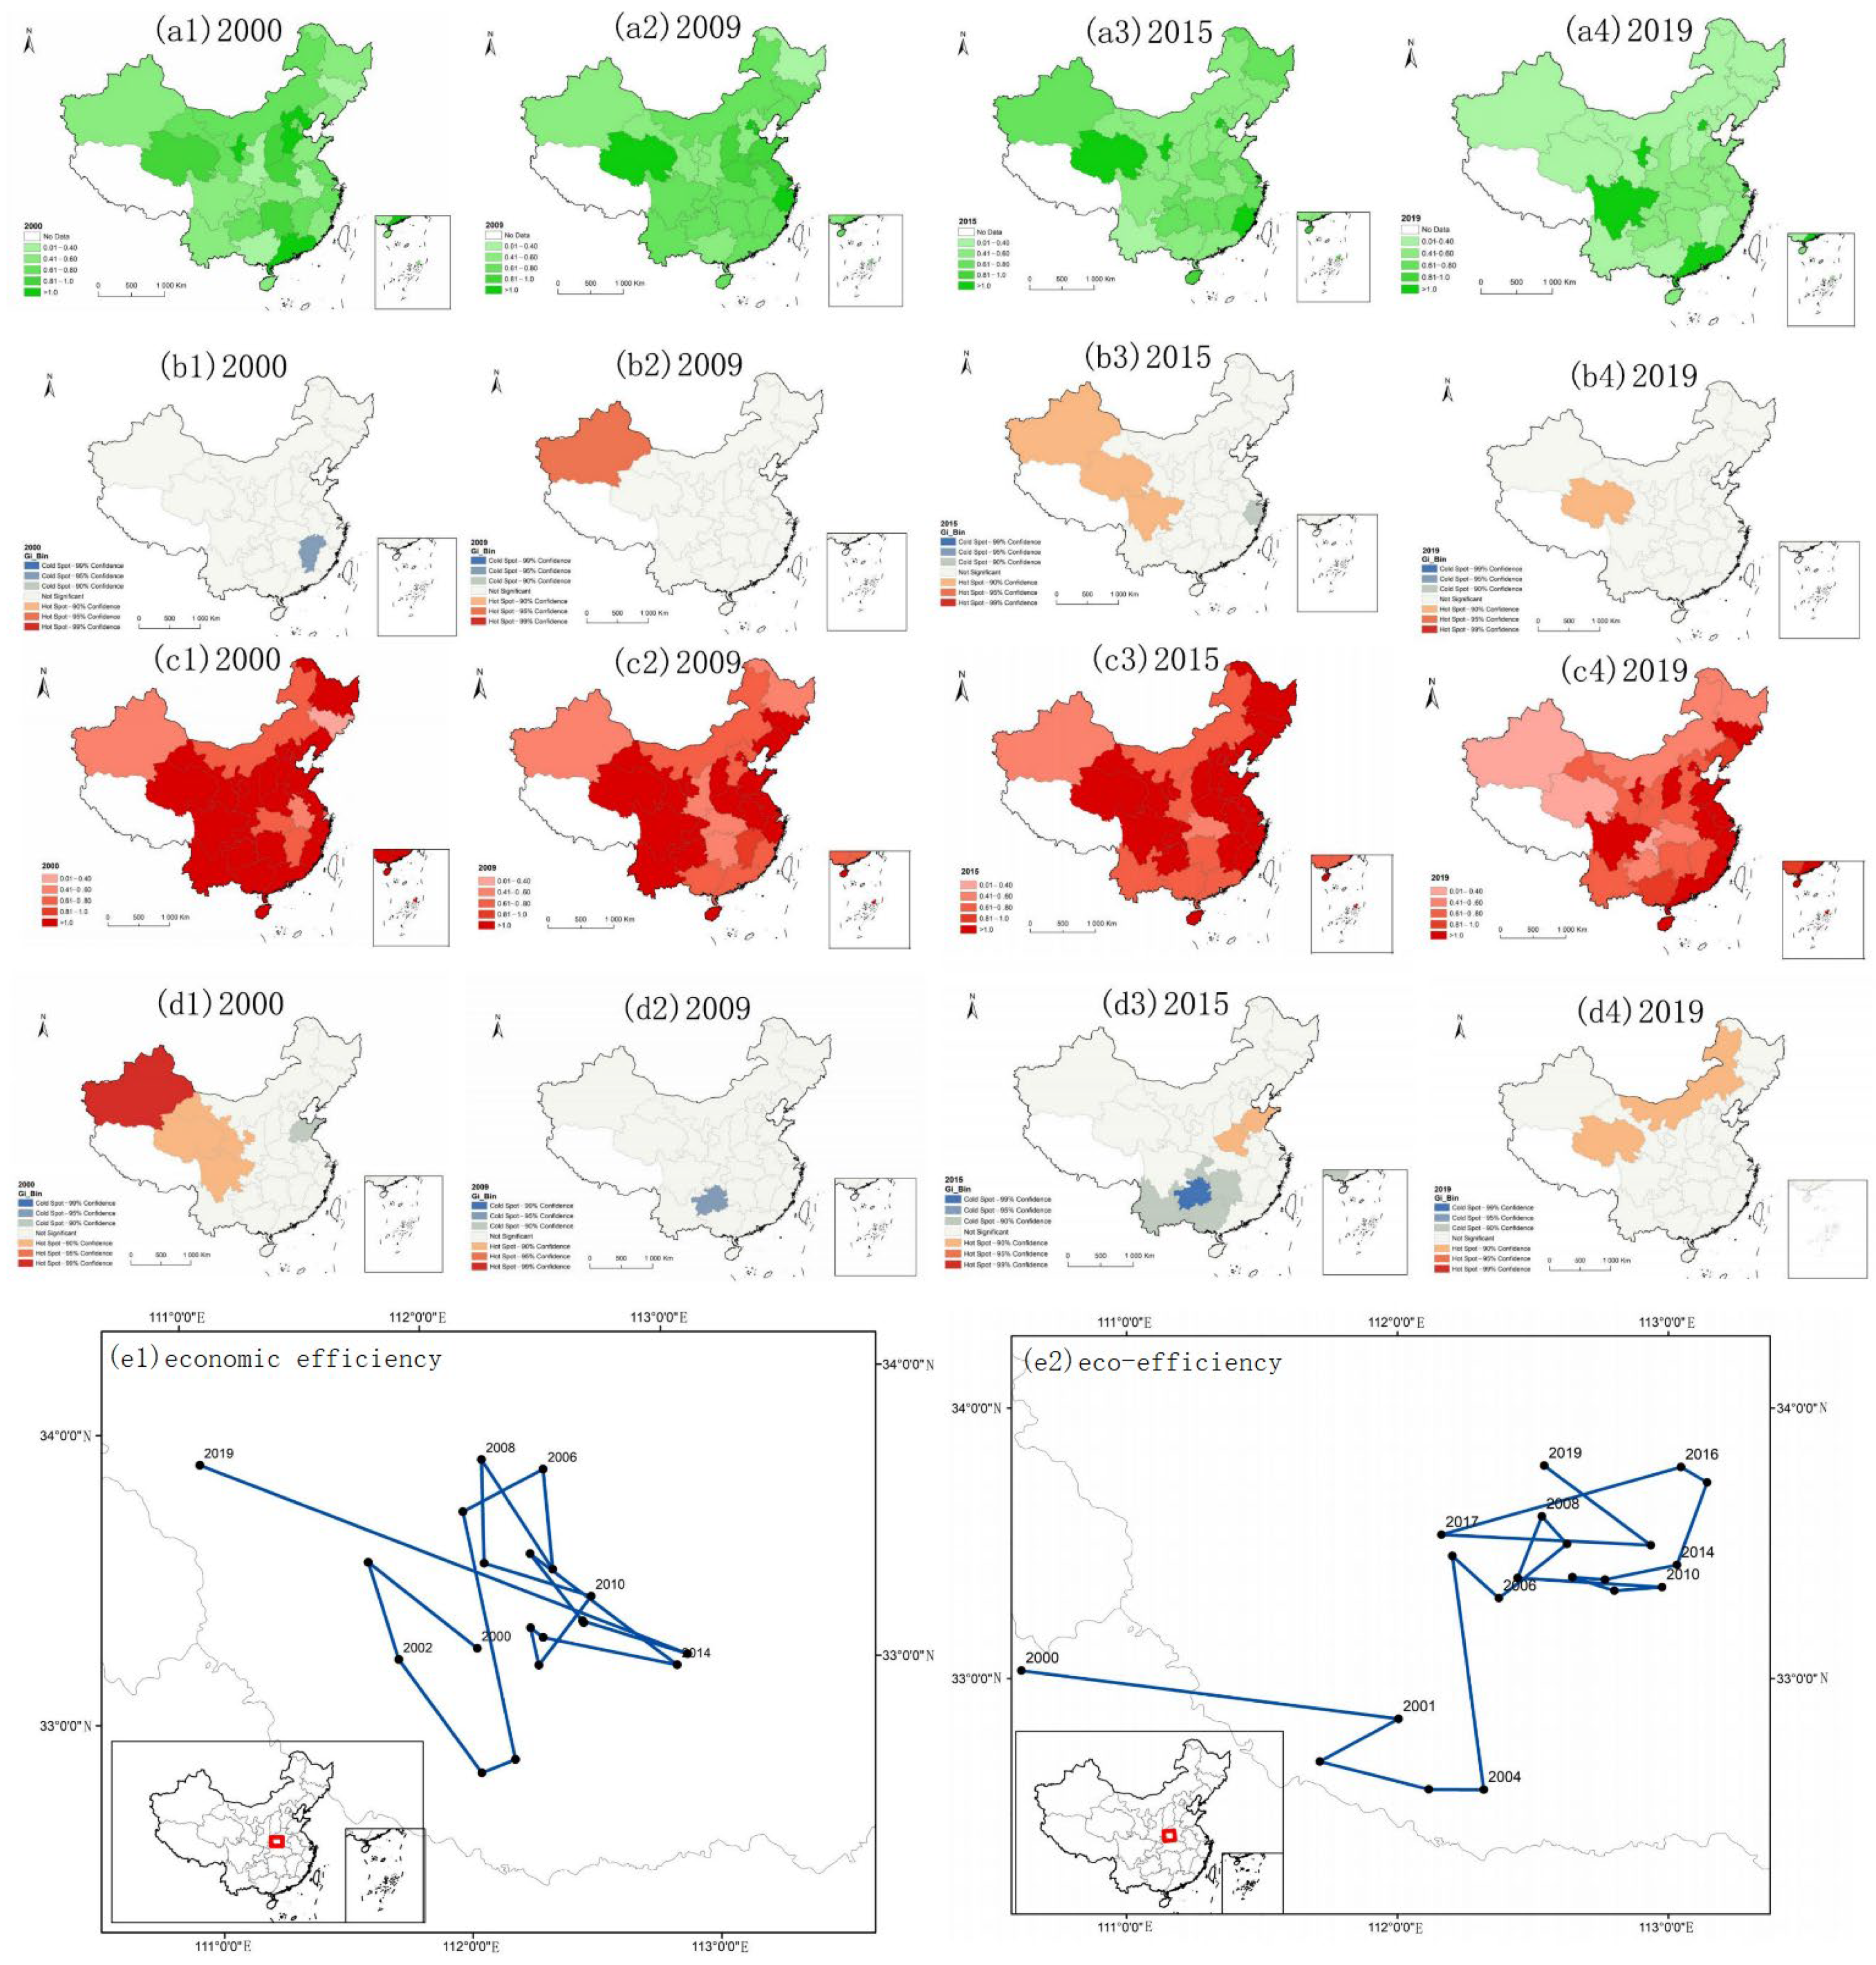
4.2. Characteristics of the Spatial Distribution of Income and Carbon Emissions
4.3. Characteristics of the Spatial Distribution of Economic Efficiency and Eco-Efficiency
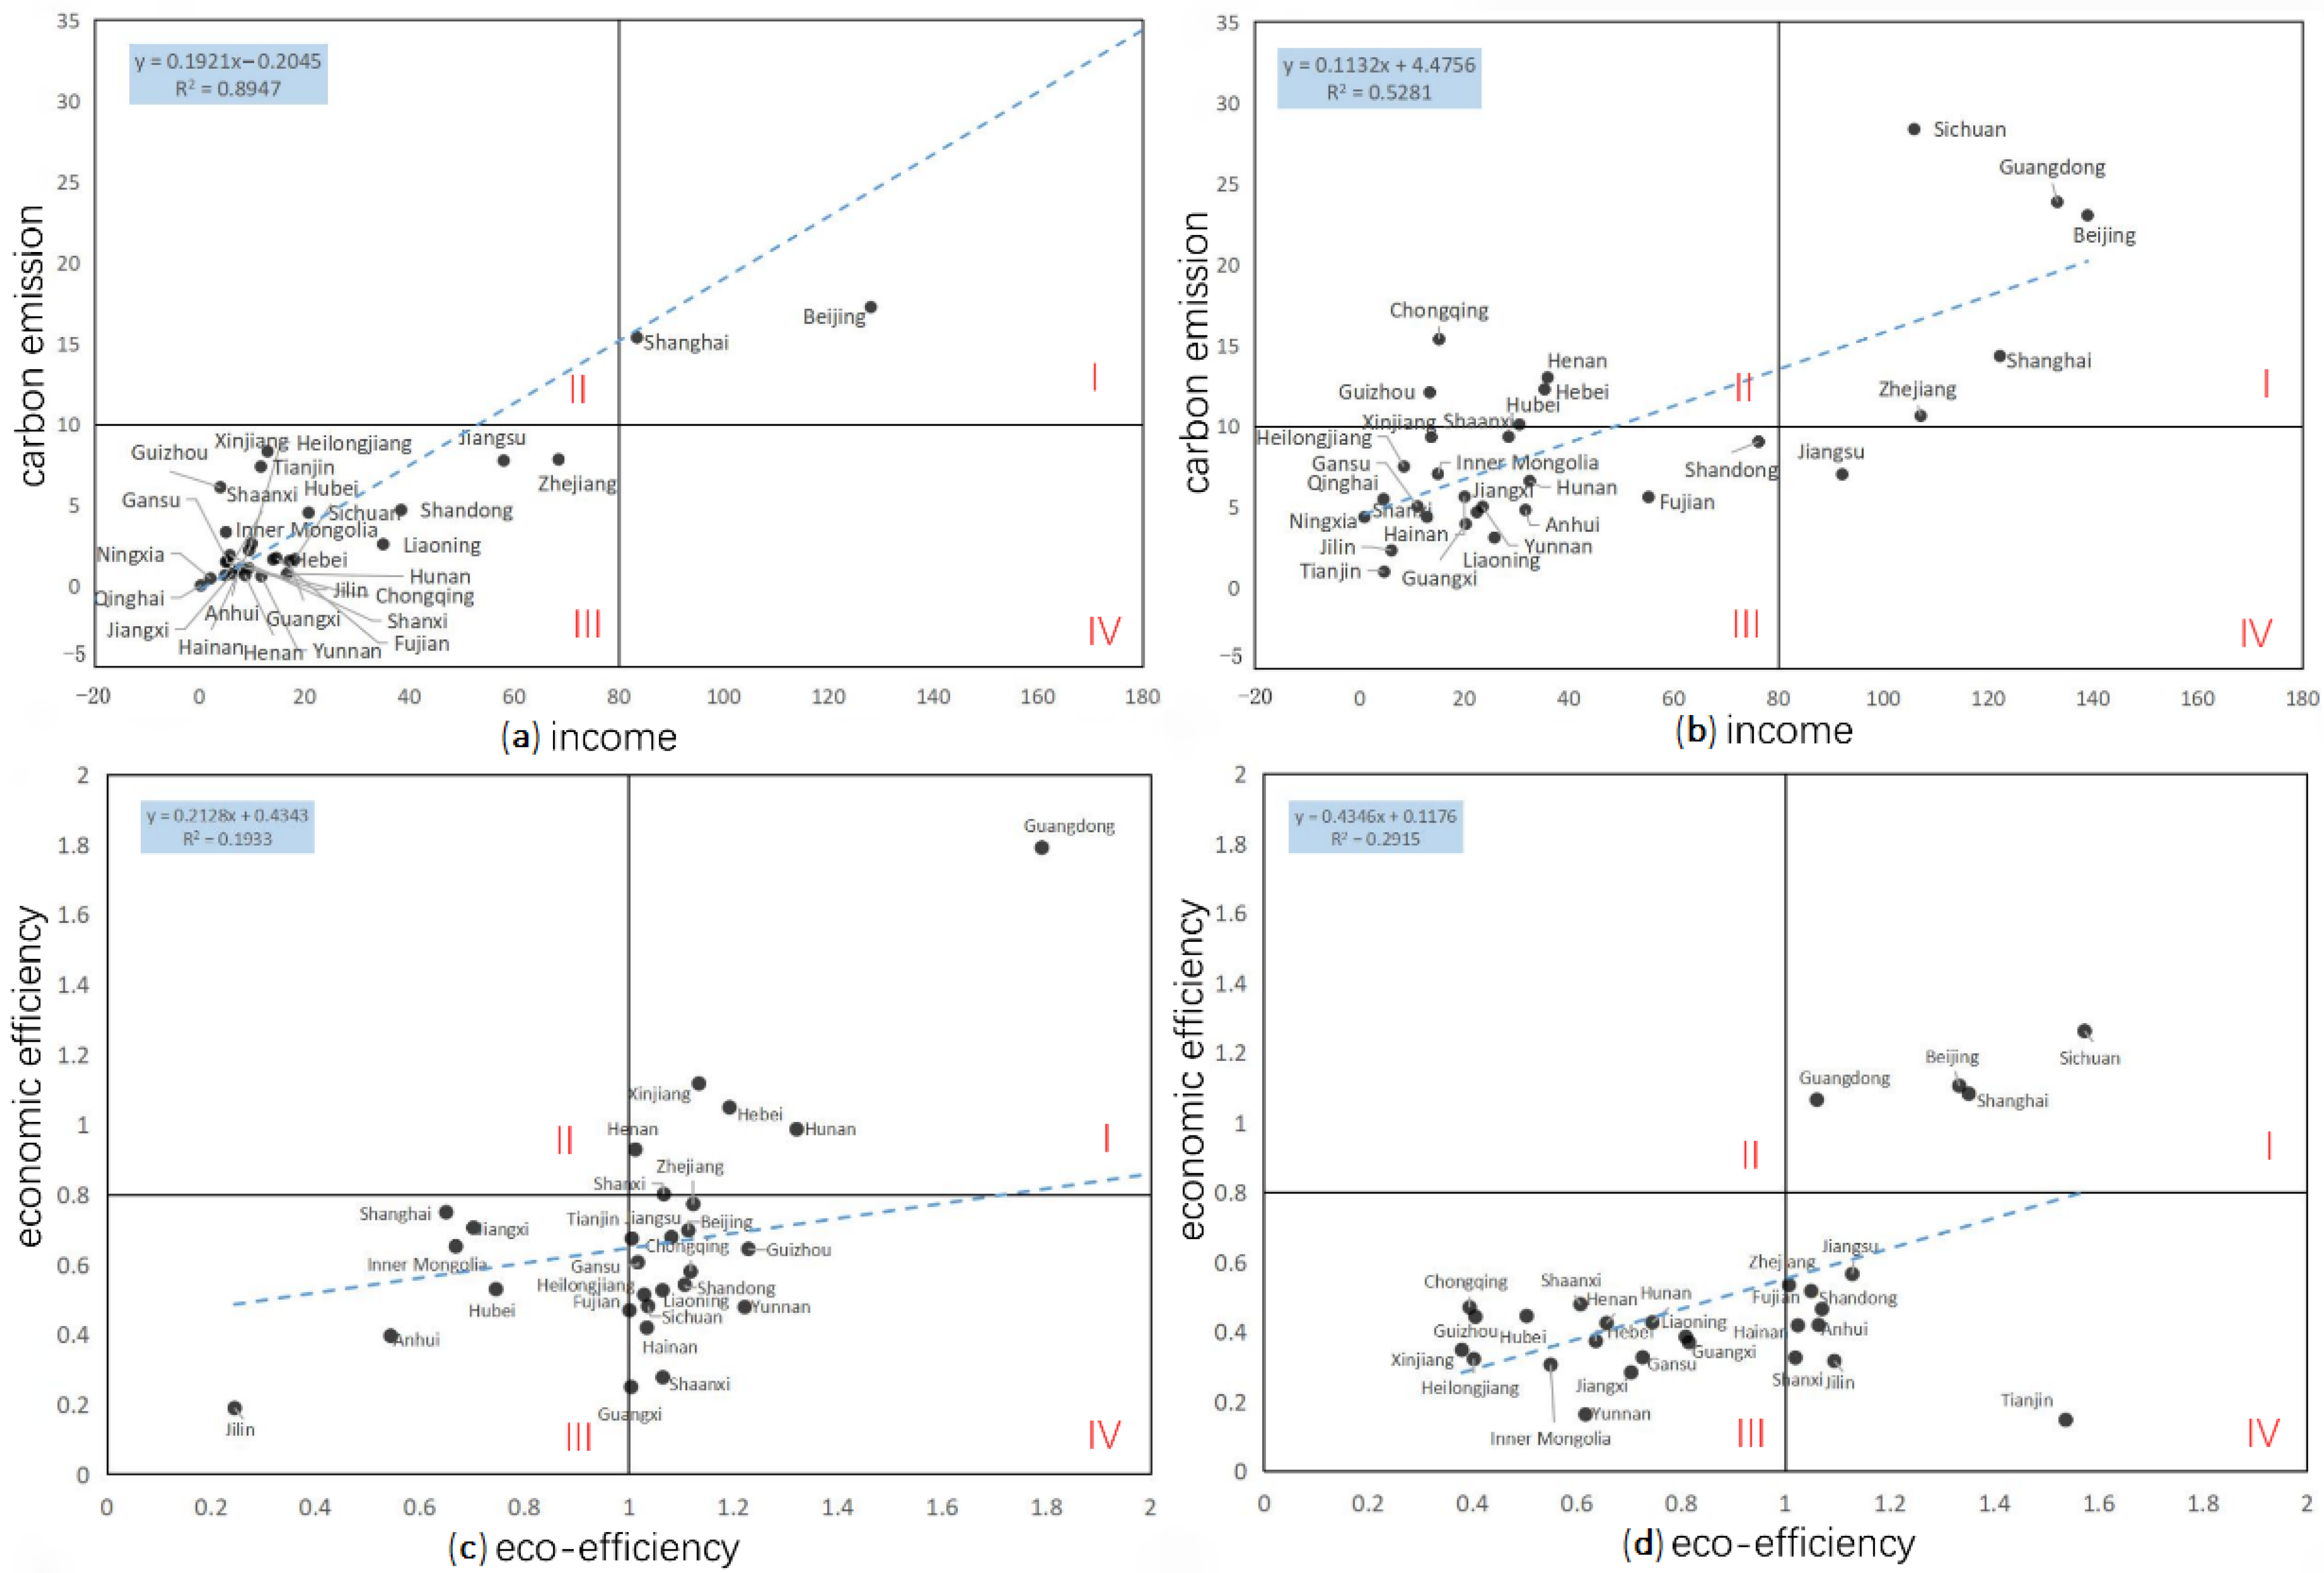
4.4. Coupling Analysis of Income and Carbon Emissions, Economic Efficiency, and Eco-Efficiency
4.5. Study of Driving Factors
4.5.1. First Stage Regression
4.5.2. Second Stage Regression
5. Discussions
6. Conclusions and Implications
6.1. Conclusions
6.2. Implications
6.3. Limitations and Further Research
Author Contributions
Funding
Institutional Review Board Statement
Informed Consent Statement
Data Availability Statement
Acknowledgments
Conflicts of Interest
Nomenclature
| Acronyms | |
| WU | Water consumption of tourist hotels |
| WW | Wastewater discharge from tourist hotels |
| GPC | GDP per capita |
| TI | The proportion of the tertiary industry |
| UP | The proportion of the urban population |
| GPE | Energy consumption per unit of GDP |
| ST | Number of students in colleges and universities |
| KM | Number of road miles |
| FI | Total year-end investment by foreign enterprises |
| IIT | Number of international visitors received |
| PT | Posts telecommunication |
References
- World Tourism Organization. UNWTO Annual Report 2019; World Tourism Organization: Madrid, Spain, 2019. [Google Scholar]
- Ministry of Culture and Tourism of China. China Cultural Relics and Tourism Statistical Yearbook 2020; National Library Press: Beijing, China, 2020. [Google Scholar]
- Lenzen, M.; Sun, Y.Y.; Faturay, F.; Ting, Y.P.; Geschke, A.; Malik, A. The carbon footprint of global tourism. Nat. Clim. Change 2018, 8, 522–528. [Google Scholar] [CrossRef]
- Razzaq, A.; Sharif, A.; Ahmad, P.; Jermsittiparsert, K. Asymmetric role of tourism development and technology innovation on carbon dioxide emission reduction in the Chinese economy: Fresh insights from QARDL approach. Sustain. Dev. 2021, 29, 176–193. [Google Scholar] [CrossRef]
- Xia, B.; Dong, S.; Li, Z.; Zhao, M.; Sun, D.; Zhang, W.; Li, Y. Eco-Efficiency and Its Drivers in Tourism Sectors with Respect to Carbon Emissions from the Supply Chain: An Integrated EEIO and DEA Approach. Int. J. Environ. Res. Public Health 2022, 19, 6951. [Google Scholar] [CrossRef] [PubMed]
- Liu, Q.; Browne, A.L.; Iossifova, D. A socio-material approach to resource consumption and environmental sustainability of tourist accommodations in a Chinese hot spring town. Sustain. Prod. Consump. 2022, 30, 424–437. [Google Scholar] [CrossRef]
- Koiwanit, J.; Filimonau, V. Carbon footprint assessment of home-stays in Thailand. Resour. Conserv. Recycl. 2021, 164, 11. [Google Scholar] [CrossRef]
- Pablo-Romero, M.P.; Sanchez-Braza, A.; Sanchez-Rivas, J. Relationships between Hotel and Restaurant Electricity Consumption and Tourism in 11 European Union Countries. Sustainability 2017, 9, 14. [Google Scholar] [CrossRef]
- Pan, Y.; Weng, G.; Li, C.; Li, J. Coupling Coordination and Influencing Factors among Tourism Carbon Emission, Tourism Economic and Tourism Innovation. Int. J. Environ. Res. Public Health 2021, 18, 1601. [Google Scholar] [CrossRef]
- Chen, Q.; Mao, Y.; Morrison, A.M. Impacts of Environmental Regulations on Tourism Carbon Emissions. Int. J. Environ. Res. Public Health 2021, 18, 12850. [Google Scholar] [CrossRef]
- Long, X.; Wang, X.; Mensah, C.N.; Wang, M.; Zhang, J. Spatial and temporal heterogeneity of environmental efficiency for China’s hotel sector: New evidence through metafrontier global Malmquist-Luenberger. Environ. Sci. Pollut. Res. 2019, 26, 27534–27541. [Google Scholar] [CrossRef]
- Assaf, A.G.; Tsionas, M. Measuring hotel performance: Toward more rigorous evidence in both scope and methods. Tour. Manag. 2018, 69, 69–87. [Google Scholar] [CrossRef]
- Xia, B.; Dong, S.; Zhao, M.; Li, Z.; Li, F.; Li, Y.; Cheng, H. Analysis of economic efficiency and eco-efficiency of Chinese star hotels based on SBM model. IOP Conf. Ser. Earth Environ. Sci. 2018, 190, 012066. [Google Scholar] [CrossRef]
- Pieri, S.P.; Tzouvadakis, I.; Santamouris, M. Identifying energy consumption patterns in the Attica hotel sector using cluster analysis techniques with the aim of reducing hotels’ CO2 footprint. Energy Build. 2015, 94, 252–262. [Google Scholar] [CrossRef]
- Camilleri-Fenech, M.; Sola, J.O.I.; Farreny, R.; Durany, X.G. A snapshot of solid waste generation in the hospitality industry. The case of a five-star hotel on the island of Malta. Sustain. Prod. Consump. 2020, 21, 104–119. [Google Scholar] [CrossRef]
- Domingos, H.A.; De Melo Faria, A.M.; Fuinhas, J.A.; Marques, A.C. Renewable energy and greenhouse gas emissions from the waste sectors of European Union member states: A panel data analysis. Environ. Sci. Pollut. Res. 2017, 24, 18770–18781. [Google Scholar] [CrossRef]
- Zha, J.P.; Tan, T.; Yuan, W.W.; Yang, X.J.; Zhu, Y. Decomposition analysis of tourism CO2 emissions for sustainable development: A case study of China. Sustain. Dev. 2020, 28, 169–186. [Google Scholar] [CrossRef]
- He, D.; Chen, K.; Zhang, T.T.; Yin, M.F.; Shi, X.L.; Xu, Z. Regional CO2 Budget and Abatement Countermeasures for Forest Scenic Spots: A Case Study of the Shenyang National Forest Park. Sustainability 2021, 13, 861. [Google Scholar] [CrossRef]
- Hu, A.H.; Huang, C.Y.; Chen, C.F.; Kuo, C.H.; Hsu, C.W. Assessing carbon footprint in the life cycle of accommodation services: The case of an international tourist hotel. Int. J. Sustain. Dev. World Ecol. 2015, 22, 313–323. [Google Scholar] [CrossRef]
- Yang, C.W.; Ho, Y.L. Assessing carbon reduction effects toward the mode shift of green transportation system. J. Adv. Transp. 2016, 50, 669–682. [Google Scholar] [CrossRef]
- Liu, J.; Lin, C.; Huang, L.; Zhu, J.H.; Wu, L.J.; Li, Y.Y. Use of Household Survey Data as a Tool to Assess the Carbon Footprint of Rural Tourist Accommodation and Related Services in China: A Case Study of Mount Qingcheng. Sustainability 2017, 9, 1680. [Google Scholar] [CrossRef]
- Spiller, M.; Muller, C.; Mulholland, Z.; Louizidou, P.; Kupper, F.C.; Knosala, K.; Stenzel, P. Reducing Carbon Emissions from the Tourist Accommodation Sector on Non-Interconnected Islands: A Case Study of a Medium-Sized Hotel in Rhodes, Greece. Energies 2022, 15, 3801. [Google Scholar] [CrossRef]
- Michopoulos, A.; Ziogou, I.; Kerimis, M.; Zachariadis, T. A study on hot-water production of hotels in Cyprus: Energy and environmental considerations. Energy Build. 2017, 150, 1–12. [Google Scholar] [CrossRef]
- Long, Y.; Yoshida, Y.; Dong, L. Exploring the indirect household carbon emissions by source: Analysis on 49 Japanese cities. J. Clean. Prod. 2017, 167, 571–581. [Google Scholar] [CrossRef]
- Neugebauer, S.; Bolz, M.; Mankaa, R.; Traverso, M. How sustainable are sustainability conferences?—Comprehensive Life Cycle Assessment of an international conference series in Europe. J. Clean. Prod. 2020, 242, 118516. [Google Scholar] [CrossRef]
- Svec, R.; Martinat, S.; Picha, K.; Klusacek, P.; Knotek, J.; Schaefer, J.C.; Brezinova, M.; Navratil, J. What drives visitors to tourist sites to choose “green” accommodation facilities? Environ. Dev. Sustain. 2021, 23, 15074–15099. [Google Scholar] [CrossRef]
- Daniels, L.; Coker, P.; Potter, B. Embodied carbon dioxide of network assets in a decarbonised electricity grid. Appl. Energy 2016, 180, 142–154. [Google Scholar] [CrossRef]
- Tiong, Y.Y.; Sondoh, S.L.; Tanakinjal, G.H.; Iggau, O.A. Cleaner operations in hotels: Recommendation for post-pandemic green recovery. J. Clean. Prod. 2021, 283, 124621. [Google Scholar] [CrossRef]
- Ge, J.P.; Lei, Y.L. Carbon emissions from the service sector: An input-output application to Beijing, China. Clim. Res. 2014, 60, 13–24. [Google Scholar] [CrossRef]
- Li, Y.B.; Wang, T.Y.; Lin, R.X.; Yu, S.N.; Liu, X.; Wang, Q.C.; Xu, Q. Behaviour-Driven Energy-Saving in Hotels: The Roles of Extraversion and Past Behaviours on Guests’ Energy-Conservation Intention. Buildings 2022, 12, 941. [Google Scholar] [CrossRef]
- Yu, J. Exploring Recreationist-Environment Fit Hospitality Experiences of Green Hotels in China. Sustainability 2022, 14, 1850. [Google Scholar] [CrossRef]
- Amicarelli, V.; Rana, R.; Lombardi, M.; Bux, C. Material flow analysis and sustainability of the Italian meat industry. J. Clean. Prod. 2021, 299, 126902. [Google Scholar] [CrossRef]
- Heras-Saizarbitoria, I.; Garcia, M.; Boiral, O.; de Junguitu, A.D. The use of eco-efficiency indicators by environmental frontrunner companies. Ecol. Indic. 2020, 115, 106451. [Google Scholar] [CrossRef]
- De Souza, A.M.; de Lima, G.E.S.; Nalon, G.H.; Lopes, M.M.S.; de Oliveira, A.L.; Lopes, G.J.R.; Olivier, M.J.D.; Pedroti, L.G.; Ribeiro, J.C.L.; de Carvalho, J.M.F. Application of the desirability function for the development of new composite eco-efficiency indicators for concrete. J. Build. Eng. 2021, 40, 102374. [Google Scholar] [CrossRef]
- Gössling, S.; Peeters, P.; Ceron, J.-P.; Dubois, G.; Patterson, T.; Richardson, R.B. The eco-efficiency of tourism. Ecol. Econ. 2004, 54, 417–434. [Google Scholar] [CrossRef]
- Zha, J.; Yuan, W.; Dai, J.; Tan, T.; He, L. Eco-efficiency, eco-productivity and tourism growth in China: A non-convex metafrontier DEA-based decomposition model. J. Sustain. Tour. 2020, 28, 663–685. [Google Scholar] [CrossRef]
- Barros, C.P.; Mascarenhas, M.J. Technical and allocative efficiency in a chain of small hotels. Int. J. Hosp. Manag. 2004, 24, 415–436. [Google Scholar] [CrossRef]
- Hathroubi, S.; Peypoch, N.; Robinot, E. Technical efficiency and environmental management: The Tunisian case. J. Hosp. Tour. Manag. 2014, 21, 27–33. [Google Scholar] [CrossRef]
- Assaf, A.G.; Cvelbar, L.K.; Pahor, M. Performance drivers in the casino industry: Evidence from Slovenia. Int. J. Hosp. Manag. 2013, 32, 149–154. [Google Scholar] [CrossRef]
- Mendieta-Peñalver, L.F.; Perles-Ribes, J.F.; Ramón-Rodríguez, A.B.; Such-Devesa, M.J. Is hotel efficiency necessary for tourism destination competitiveness? An integrated approach. Tour. Econ. 2018, 24, 3–26. [Google Scholar] [CrossRef]
- Lado-Sestayo, R.; Fernandez-Castro, A.S. The impact of tourist destination on hotel efficiency: A data envelopment analysis approach. Eur. J. Oper. Res. 2019, 272, 674–686. [Google Scholar] [CrossRef]
- Nick, J.; Barry, H.; Leigh, D. The use of data envelopment analysis to monitor hotel productivity. Prog. Tour. Hosp. Res. 1997, 3, 119–127. [Google Scholar]
- Sun, Y.Y.; Hou, G.L.; Huang, Z.F.; Zhong, Y. Spatial-Temporal Differences and Influencing Factors of Tourism Eco-Efficiency in China’s Three Major Urban Agglomerations Based on the Super-EBM Model. Sustainability 2020, 12, 4156. [Google Scholar] [CrossRef]
- Hong, B.Y.; Kim, K.-J. Efficiency Measurement of the Korean Hotel Industry Using DEA. J. Tour. Sci. 2004, 29, 105–126. [Google Scholar]
- Higuerey, A.; Viñan-Merecí, C.; Malo-Montoya, Z.; Martínez-Fernández, V.-A. Data Envelopment Analysis (DEA) for Measuring the Efficiency of the Hotel Industry in Ecuador. Sustainability 2020, 12, 1590. [Google Scholar] [CrossRef]
- Yin, P.Z.; Chu, J.F.; Wu, J.; Ding, J.J.; Yang, M.; Wang, Y.H. A DEA-based two-stage network approach for hotel performance analysis: An internal cooperation perspective. Omega—Int. J. Manag. Sci. 2020, 93, 102035. [Google Scholar] [CrossRef]
- Liu, J.; Zhang, J.F.; Fu, Z.B. Tourism eco-efficiency of Chinese coastal cities-Analysis based on the DEA-Tobit model. Ocean. Coast. Manag. 2017, 148, 164–170. [Google Scholar] [CrossRef]
- Peng, H.; Zhang, J.; Lu, L.; Tang, G.; Yan, B.; Xiao, X.; Han, Y. Eco-efficiency and its determinants at a tourism destination: A case study of Huangshan National Park, China. Tour. Manag. 2016, 60, 201–211. [Google Scholar] [CrossRef]
- Zhang, B.; Bi, J.; Fan, Z.; Yuan, Z.; Ge, J. Eco-efficiency analysis of industrial system in China: A data envelopment analysis approach. Ecol. Econ. 2008, 68, 306–316. [Google Scholar] [CrossRef]
- Tang, Z.; Jie, S.; Shi, C. Estimation of carbon dioxide emissions and spatial variation from tourism accommodation in china. Environ. Eng. Manag. J. 2013, 12, 1921–1925. [Google Scholar]
- C.N.T. Administration. Star Hotel Guest Room Supplies Quality and Equipment Requirements; National Standard Information Service Platform: Beijing, China, 1996. [Google Scholar]
- Li, Y.; Liu, A.C.; Yu, Y.Y.; Zhang, Y.; Zhan, Y.; Lin, W.C. Bootstrapped DEA and Clustering Analysis of Eco-Efficiency in China’s Hotel Industry. Sustainability 2022, 14, 2925. [Google Scholar] [CrossRef]
- Liang, Y.; Shi, C. Efficiency evaluation and optimization of rural ecotourism space based on DEA model. Int. J. Low-Carbon Technol. 2020, 15, 356–360. [Google Scholar] [CrossRef]
- Lee, H.S. Slacks-based measures of efficiency and super-efficiency in presence of nonpositive data. Omega 2021, 103, 102395. [Google Scholar] [CrossRef]
- Peeters, A.; Zude, M.; Käthner, J.; Ünlü, M.; Kanber, R.; Hetzroni, A.; Gebbers, R.; Ben-Gal, A. Getis–Ord’s hot- and cold-spot statistics as a basis for multivariate spatial clustering of orchard tree data. Comput. Electron. Agric. 2015, 111, 140–150. [Google Scholar] [CrossRef]
- Wang, Y. Evolvement Characteristics of Population and Economic Gravity Centers in Tarim River Basin, Uygur Autonomous Region of Xinjiang, China. Chin. Geogr. Sci. 2013, 23, 765–772. [Google Scholar] [CrossRef] [Green Version]
- Luo, Y.; Yu, H.; Liu, S.; Liang, Y.; Liu, S. Spatial Heterogeneity and Coupling of Economy and Population Gravity Centres in the Hengduan Mountains. Sustainability 2019, 11, 1508. [Google Scholar] [CrossRef]
- Scheutzow, M. Couplings, generalized couplings and uniqueness of invariant measures. Electron. Commun. Probab. 2020, 25, 1–7. [Google Scholar] [CrossRef]
- Xie, C.C. Research on the Coupling And Coordinative Development of Tourism-Economy-Ecological Environment. J. Environ. Prot. Ecol. 2022, 23, 163–170. [Google Scholar]
- Feng, M.; Yan, Y.; Li, X. Measuring the Efficiency of Industrial Green Transformation in China. J. Sci. Ind. Res. 2019, 78, 495–498. [Google Scholar]
- Xue, L.; Zhao, S.C. Evaluating and Analyzing the Operation Efficiency of Urban Rail Transit Systems in China Using an Integrated Approach of DEA Model, Malmquist Productivity Index, and Tobit Regression Model. J. Transp. Eng. Part A Syst. 2021, 147, 04021061. [Google Scholar] [CrossRef]
- Zhang, F.; Peng, H.; Sun, X.; Song, T. Influence of Tourism Economy on Air Quality—An Empirical Analysis Based on Panel Data of 102 Cities in China. Int. J. Environ. Res. Public Health 2022, 19, 4393. [Google Scholar] [CrossRef]
- Caiado, R.G.G.; Dias, R.D.; Mattos, L.V.; Quelhas, O.L.G.; Filho, W.L. Towards sustainable development through the perspective of eco-efficiency—A systematic literature review. J. Clean Prod. 2017, 165, 890–904. [Google Scholar] [CrossRef]
- Lu, S.L.; Wei, S.S.; Zhang, K.; Kong, X.F.; Wu, W. Investigation and analysis on the energy consumption of starred hotel buildings in Hainan Province, the tropical region of China. Energy Convers. Manag. 2013, 75, 570–580. [Google Scholar] [CrossRef]
- Chen, L.F. Green certification, e-commerce, and low-carbon economy for international tourist hotels. Environ. Sci. Pollut. Res. 2019, 26, 17965–17973. [Google Scholar] [CrossRef] [PubMed]
- Chenghu, Z.; Arif, M.; Shehzad, K.; Ahmad, M.; Oláh, J. Modeling the Dynamic Linkage between Tourism Development, Technological Innovation, Urbanization and Environmental Quality: Provincial Data Analysis of China. Int. J. Environ. Res. Public Health 2021, 18, 8456. [Google Scholar] [CrossRef] [PubMed]
- Yan, H.; Chai, H. Consumers’ Intentions towards Green Hotels in China: An Empirical Study Based on Extended Norm Activation Model. Sustainability 2021, 13, 2165. [Google Scholar] [CrossRef]
- Repkine, A.; Min, D. Foreign-Funded Enterprises and Pollution Halo Hypothesis: A Spatial Econometric Analysis of Thirty Chinese Regions. Sustainability 2020, 12, 5048. [Google Scholar] [CrossRef]
- State Council of China. Comprehensive Work Plan for Energy Conservation and Emission Reduction; State Council of China: Beijing, China, 2007. [Google Scholar]
- Long, X.L.; Chen, B.; Park, B. Effect of 2008’s Beijing Olympic Games on environmental efficiency of 268 China’s cities. J. Clean. Prod. 2018, 172, 1423–1432. [Google Scholar] [CrossRef]
- Liu, J.; Li, H.; Liu, T. Decoupling Regional Economic Growth from Industrial CO2 Emissions: Empirical Evidence from the 13 Prefecture-Level Cities in Jiangsu Province. Sustainability 2022, 14, 2733. [Google Scholar] [CrossRef]
- Wang, J.; Yang, X.; Qalati, S.A.; Deng, Y. Spatial Spillover Effect and Spatial Distribution Characteristics of Transportation Infrastructure on Economic Growth: A Case of the Yangtze River Delta. Front. Environ. Sci. 2022, 10, 900209. [Google Scholar] [CrossRef]
- Feng, C.; Sun, L.-X.; Xia, Y.-S. Clarifying the “gains” and “losses” of transport climate mitigation in China from technology and efficiency perspectives. J. Clean. Prod. 2020, 263, 121545. [Google Scholar] [CrossRef]
- Cao, F.K. How Efficient are Basic Public Health Services Between Urban and Rural in Shandong Province, China? A Data Envelopment Analysis and Panel Tobit Regression Approach. Risk Manag. Healthc. Policy 2022, 15, 727–738. [Google Scholar] [CrossRef]
- Haibo, C.; Ke, D.; Fangfang, W.; Ayamba, E.C. The spatial effect of tourism economic development on regional ecological efficiency. Environ. Sci. Pollut. Res. 2020, 27, 38241–38258. [Google Scholar] [CrossRef]
- Lei, D.-Y.; Chen, C.-M.; Wang, L.-H.; Chou, C.J.; Yeh, T.-J.; Cheng, S.-T.; Huang, K.-P. Effect of Ecotourism Cognition on Environmental Attitudes And Environmental Innovation. J. Environ. Prot. Ecol. 2021, 22, 1183–1190. [Google Scholar]
- Sadorsky, P. Eco-Efficiency for the G18: Trends and Future Outlook. Sustainability 2021, 13, 11196. [Google Scholar] [CrossRef]
- Li, J.; Mao, P.; Liu, H.; Wei, J.; Li, H.; Yuan, J. Key Factors Influencing Low-Carbon Behaviors of Staff in Star-Rated Hotels—An Empirical Study of Eastern China. Int. J. Environ. Res. Public Health 2020, 17, 8222. [Google Scholar] [CrossRef]
- Moutinho, V.; Costa, C.; Bento, J.P.C. The impact of energy efficiency and economic productivity on CO2 emission intensity in Portuguese tourism industries. Tour. Manag. Perspect. 2015, 16, 217–227. [Google Scholar] [CrossRef]
- Robaina-Alves, M.; Moutinho, V.; Costa, R. Change in energy-related CO2 (carbon dioxide) emissions in Portuguese tourism: A decomposition analysis from 2000 to 2008. J. Clean. Prod. 2016, 111, 520–528. [Google Scholar] [CrossRef]
- Jiachen, L.; Xue, L.; Chiyin, C. The CO2 Emission Efficiency of China’s Hotel Industry under the Double Carbon Objectives and Homestay Growth. Energies 2021, 14, 8228. [Google Scholar]
- Scholz, P.; Voracek, J. Organizational culture and green management: Innovative way ahead in hotel industry. Meas. Bus. Excell. 2016, 20, 41–52. [Google Scholar] [CrossRef]
- Park, J.; Kim, H.J. The Impact of Top Management’s Environmental Attitudes on Hotel Companies’ Environmental Management. J. Hosp. Tour. Res. 2014, 38, 95–115. [Google Scholar] [CrossRef]
- Petr, S.; Ivica, L.; Kristýna, K. Green Management Tools as a Way to Sustainable Behaviour in the Hotel Industry: Case Study from Czechia. Sustainability 2020, 12, 10027. [Google Scholar]
- Dai, S.; Xu, H.; Pratt, S. Too Much of a Good Thing? The Economic Impact of Hotel Investment in Hainan. J. China Tour. Res. 2017, 13, 26–45. [Google Scholar] [CrossRef]
- Wang, T.C.; Tsai, C.L.; Tang, T.W. Exploring Advertising Effectiveness of Tourist Hotels’ Marketing Images Containing Nature and Performing Arts: An Eye-Tracking Analysis. Sustainability 2018, 10, 3038. [Google Scholar] [CrossRef]
- Lu, Y. Empirical Analysis on the Relationship Between Tertiary Industry Structure and Economic Growth Based on Multiple Regression—A Case Study of Henan Province. E3S Web Conf. 2021, 235, 2019. [Google Scholar] [CrossRef]
- Luo, J.M.; Lam, C.F. A qualitative study of urbanization effects on hotel development. J. Hosp. Tour. Manag. 2016, 29, 135–142. [Google Scholar] [CrossRef]
- Chedwal, R.; Mathur, J.; Das Agarwal, G.; Dhaka, S. Energy saving potential through Energy Conservation Building Code and advance energy efficiency measures in hotel buildings of Jaipur City, India. Energy Build. 2015, 92, 282–295. [Google Scholar] [CrossRef]
- Usman, A.; QuanLin, L.; Abdullah, A.M.; Mohammed, S.; Wasim, I. Correction to: Nexus between agro-ecological efficiency and carbon emission transfer: Evidence from China. Environ. Sci. Pollut. Res. Int. 2021, 28, 44581. [Google Scholar]


| Indicators | Unit | ||
|---|---|---|---|
| Economic efficiency | Input | Investment | Million |
| Energy consumption | Million tonnes of standard quasi-coal | ||
| Output | Income | Million | |
| Eco-efficiency | Input | Labor | 10 k people |
| Investment | Million | ||
| Energy consumption | Million tonnes of standard coal | ||
| Water | Million tonnes | ||
| Output | Income | Million | |
| Undesirable output | Wastewater discharge | Million tonnes | |
| Garbage emissions | Million tonnes | ||
| SO2 Emissions | Ton | ||
| Carbon emissions | Ton |
| VarName | Mean | SD | Min | Median | Max |
|---|---|---|---|---|---|
| EE | 0.9976 | 0.3530 | 0.1552 | 1.0335 | 5.2535 |
| lnIncome | 12.5221 | 1.0435 | 7.6629 | 12.5215 | 14.8061 |
| lnCO2 | 1.8171 | 0.9626 | −2.7498 | 1.8077 | 4.1505 |
| lninvestment | 13.4911 | 0.9234 | 10.1831 | 13.4518 | 15.5445 |
| lnlabor | 10.4480 | 0.7903 | 7.2442 | 10.4832 | 12.2414 |
| energy | 12.3533 | 12.0678 | 0.0846 | 8.0623 | 83.9339 |
| lnWU | 14.5135 | 1.0303 | 11.4487 | 14.6088 | 16.7044 |
| lnWW | 13.8556 | 1.1297 | 10.5232 | 13.7814 | 16.4624 |
| lngarbage | 8.4608 | 1.0221 | 5.4709 | 8.3801 | 11.2042 |
| lnSO2 | 6.1423 | 1.0271 | 2.1675 | 6.2885 | 7.8605 |
| Coupling Relationships | Type | Features | Measures | Number in 2000 | Number of 2019 |
|---|---|---|---|---|---|
| Income and CO2 | I | High income, high carbon emissions | Develop a low carbon emission reduction and green development strategy. | 2 | 5 |
| II | Low income, high carbon emissions | Restructuring and scaling of industries. | 0 | 5 | |
| III | Low income, low carbon emissions | Optimize the allocation of resources and give full play to the advantages of resources. | 28 | 19 | |
| IV | Low carbon emissions, high income | Enhancing spillover effects. | 0 | 1 | |
| Economic efficiency and eco-efficiency | I | High economic efficiency, high eco-efficiency | To drive the development of neighboring provinces, and achieve green and low-carbon sustainable development of tourist hotels. | 6 | 4 |
| II | High economic efficiency, low eco-efficiency | Adjusting energy allocation and developing energy-saving and emission reduction plans to improve clean production and green services. | 0 | 0 | |
| III | Low economic efficiency, low eco-efficiency | Improve the efficiency of capital and the quality of human capital. | 7 | 12 | |
| IV | Low economic efficiency, high eco-efficiency | Develop the tourist hotel industry, respond to China’s energy-saving and emission reduction policy, and learn from the production and operation mode of the I-type area. | 17 | 8 |
| EE | Conf. | Z |
|---|---|---|
| lnIncome | 0.447 | 9.027 *** |
| lnCO2 | −0.300 | −10.419 *** |
| lninvestment | −0.114 | −2.365 ** |
| lnlabor | −0.223 | −4.264 *** |
| lnWU | −0.126 | −3.834 *** |
| lnWW | 0.075 | 1.857 * |
| energy | 0.022 | 11.845 *** |
| lngarbage | −0.144 | −3.744 *** |
| lnSO2 | −0.045 | −2.647 *** |
| _cons | 1.812 | 7.050 *** |
| N | 600 |
| Economic System | Environmental Systems | Resource System | ||||||||
|---|---|---|---|---|---|---|---|---|---|---|
| Model I | Model II | Model I | Model II | Model II | ||||||
| lnIncome | Labor | CO2 | lngarbage | lnWU | ||||||
| Coef. | Z | Coef. | Z | Coef. | Z | Coef. | Z | Coef. | Z | |
| lnGPC | 0.207 | 2.439 ** | −0.007 | −0.102 | 0.363 | 3.077 *** | 0.603 | 6.211 *** | −0.149 | −1.6 |
| lnTI | 1.535 | 9.597 *** | 1.151 | 8.635 *** | 1.69 | 7.279 *** | 1.741 | 9.599 *** | 1.506 | 8.545 *** |
| lnUP | −0.601 | −6.465 *** | −0.433 | −5.580 *** | −0.778 | −5.748 *** | −0.378 | −3.583 *** | −0.57 | −5.569 *** |
| lnGPE | −0.169 | −2.656 *** | −0.067 | −1.263 | 0.483 | 5.131 *** | 0.032 | −0.448 | −0.59 | −8.365 *** |
| lnST | 0.205 | 5.033 *** | 0.218 | 6.437 *** | 0.208 | 3.543 *** | 0.259 | 5.604 *** | −0.116 | −2.586 *** |
| lnKM | 0.209 | 4.876 *** | 0.285 | 8.006 *** | 0.156 | 2.414 ** | 0.279 | 5.738 *** | 0.332 | 6.968 *** |
| lnFI | 0.236 | 7.460 *** | 0.17 | 6.452 *** | −0.121 | −2.645 *** | 0.063 | 1.759 * | 0.154 | 4.448 *** |
| lnPT | 0.415 | 5.787 *** | 0.359 | 6.004 *** | 0.696 | 6.516 *** | 0.646 | 7.942 *** | 0.45 | 5.753 *** |
| lnIIT | 0.156 | 5.845 *** | 0.131 | 5.906 *** | 0.312 | 7.740 *** | 0.104 | 3.433 *** | 0.297 | 10.067 *** |
Publisher’s Note: MDPI stays neutral with regard to jurisdictional claims in published maps and institutional affiliations. |
© 2022 by the authors. Licensee MDPI, Basel, Switzerland. This article is an open access article distributed under the terms and conditions of the Creative Commons Attribution (CC BY) license (https://creativecommons.org/licenses/by/4.0/).
Share and Cite
Ba, D.; Zhang, J.; Dong, S.; Xia, B.; Mu, L. Spatial-Temporal Characteristics and Driving Factors of the Eco-Efficiency of Tourist Hotels in China. Int. J. Environ. Res. Public Health 2022, 19, 11515. https://doi.org/10.3390/ijerph191811515
Ba D, Zhang J, Dong S, Xia B, Mu L. Spatial-Temporal Characteristics and Driving Factors of the Eco-Efficiency of Tourist Hotels in China. International Journal of Environmental Research and Public Health. 2022; 19(18):11515. https://doi.org/10.3390/ijerph191811515
Chicago/Turabian StyleBa, Duoxun, Jing Zhang, Suocheng Dong, Bing Xia, and Lin Mu. 2022. "Spatial-Temporal Characteristics and Driving Factors of the Eco-Efficiency of Tourist Hotels in China" International Journal of Environmental Research and Public Health 19, no. 18: 11515. https://doi.org/10.3390/ijerph191811515
APA StyleBa, D., Zhang, J., Dong, S., Xia, B., & Mu, L. (2022). Spatial-Temporal Characteristics and Driving Factors of the Eco-Efficiency of Tourist Hotels in China. International Journal of Environmental Research and Public Health, 19(18), 11515. https://doi.org/10.3390/ijerph191811515