
Source Identification and Superposition Effect of Heavy Metals (HMs) in Agricultural Soils at a High Geological Background Area of Karst: A Case Study in a Typical Watershed

 , ,
, , 
Abstract
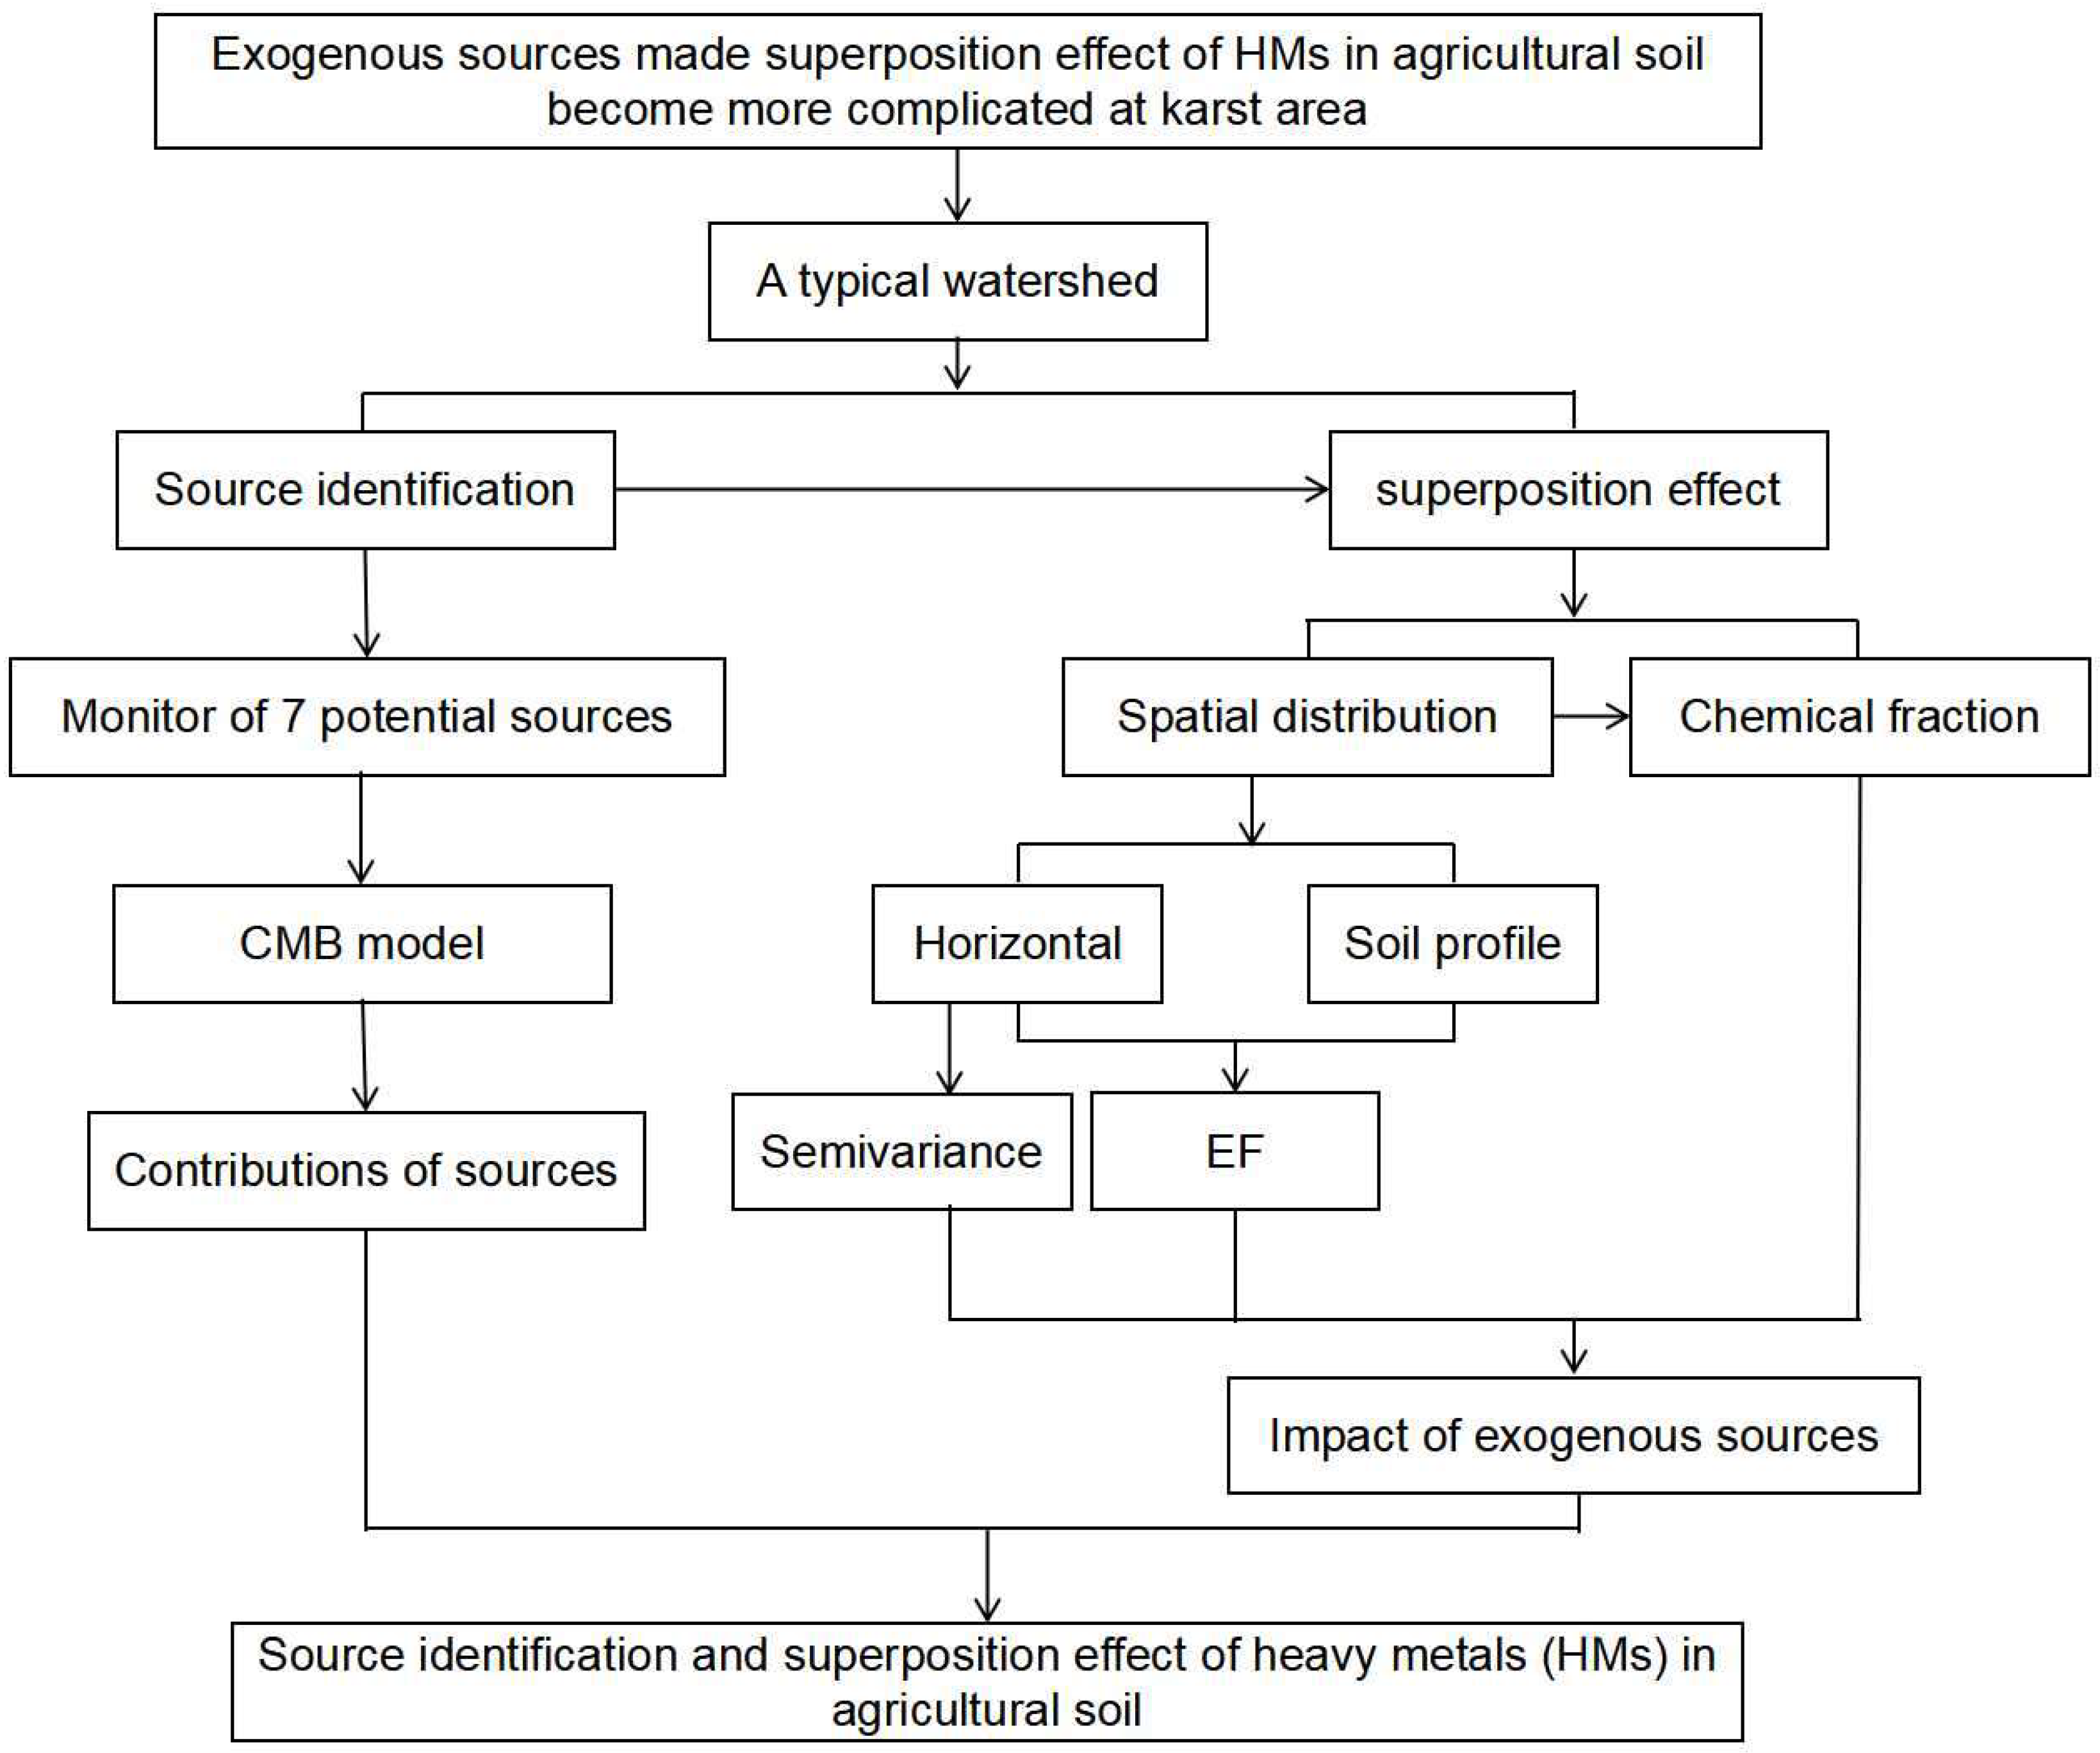
:1. Introduction
2. Materials and Methods
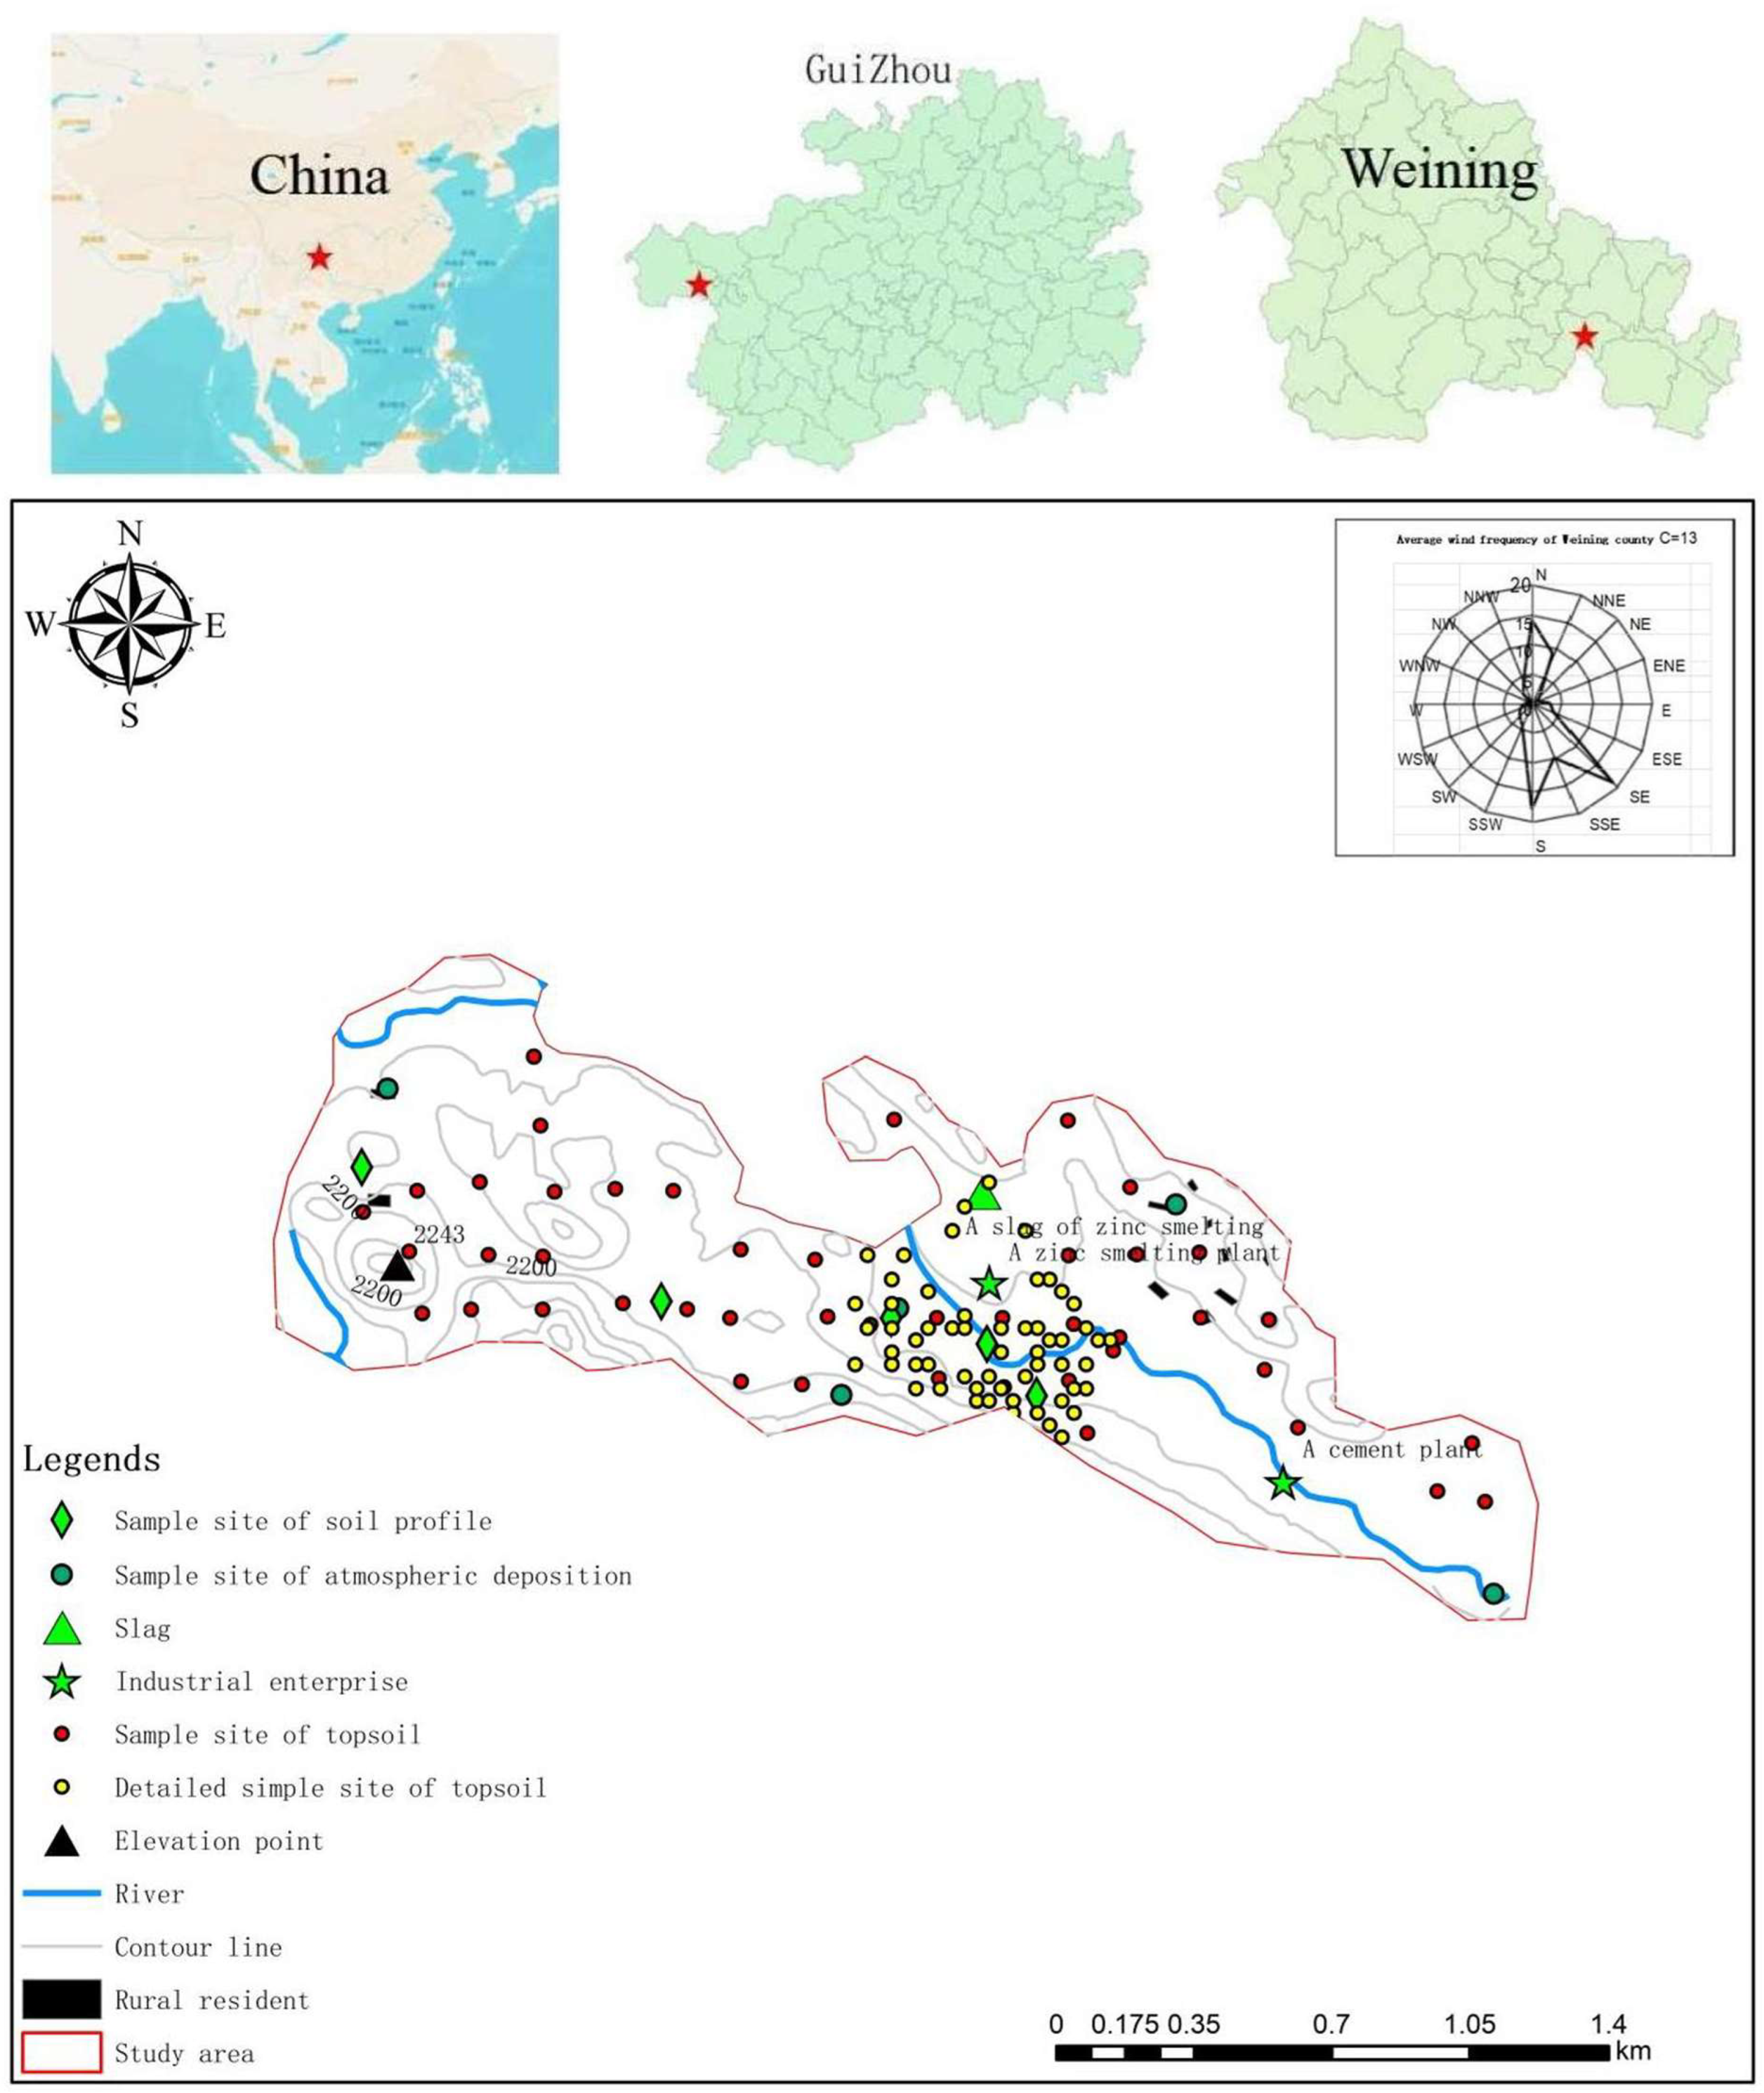
2.1. Study Site
2.2. Sample Collection and Chemical Analysis
2.2.1. Sample Collection
2.2.2. Sample Processing
- (1)
- Soil samples
- (2)
- Livestock manure samples
- (3)
- Irrigation water samples
- (4)
- Rock samples
- (5)
- Atmospheric deposition samples
2.2.3. Chemical Analysis
2.3. Chemical Mass Balance (CMB)
2.4. Superposition Effect of Exogenous HMs
2.5. Data Analysis
3. Results and Discussion
3.1. Concentration of HMs
3.2. Source Identification of HMs
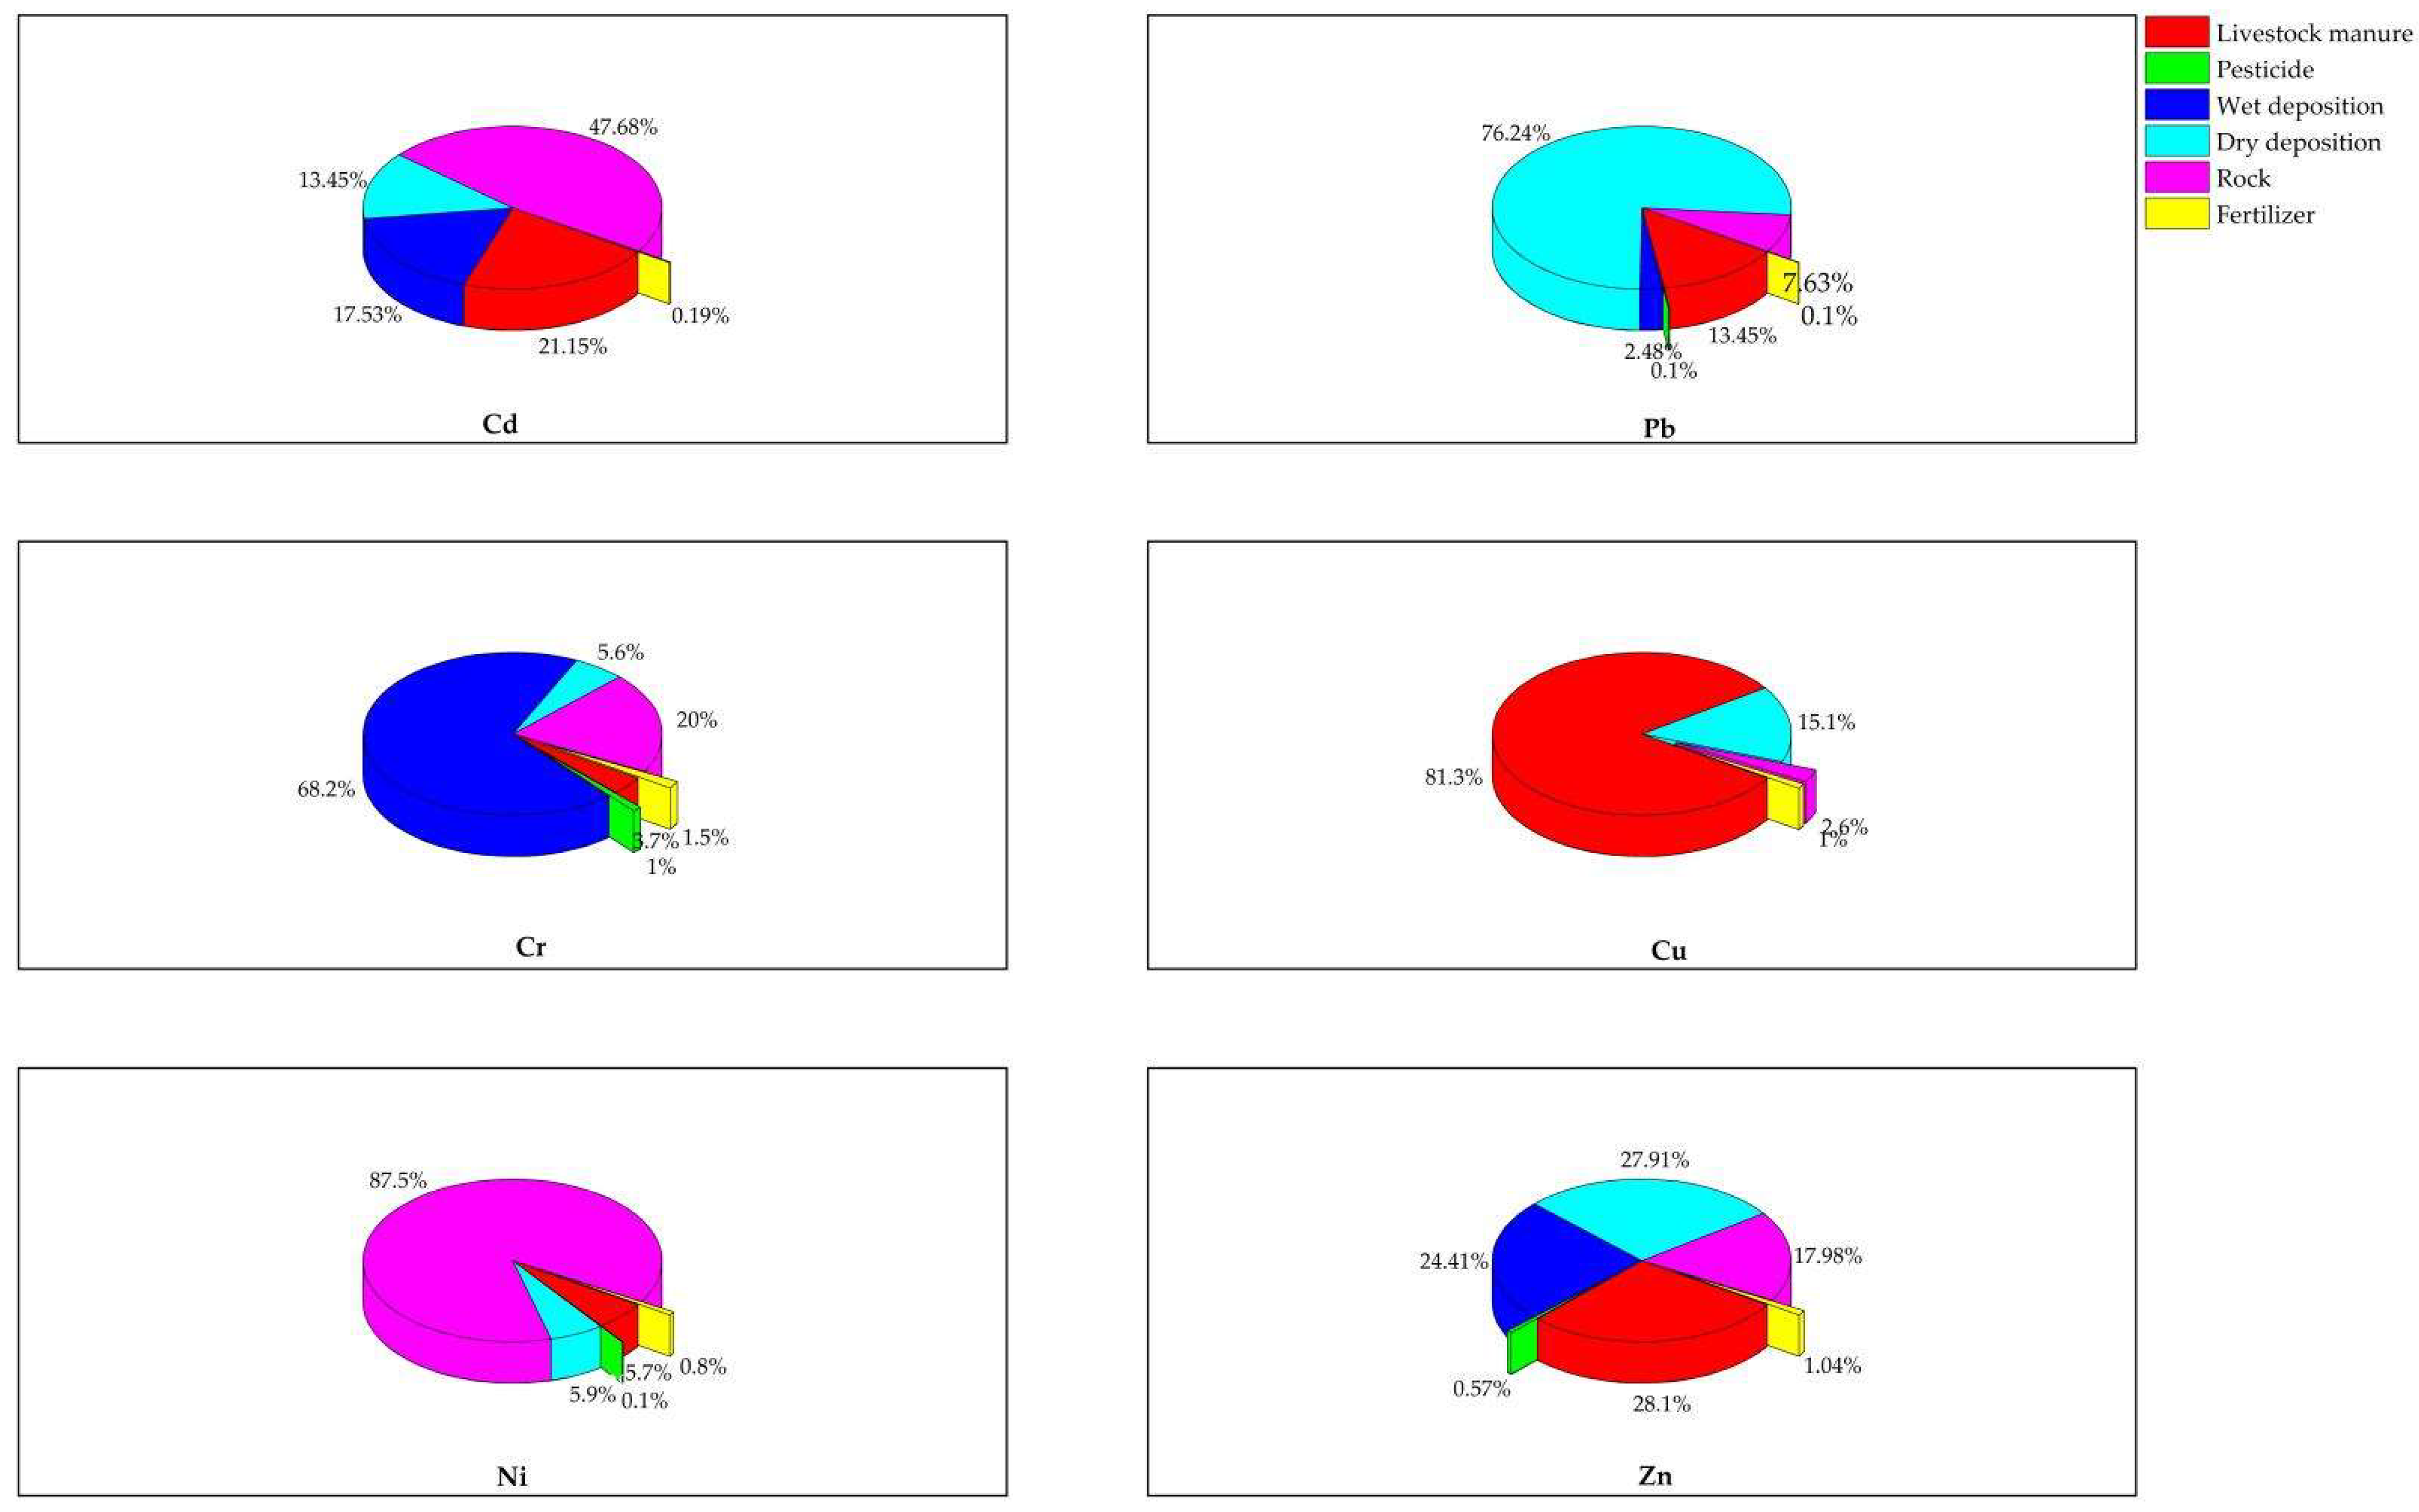
3.2.1. Contributions of Sources
3.2.2. Process of Contamination Superposition
3.3. Superposition Effect of HMs
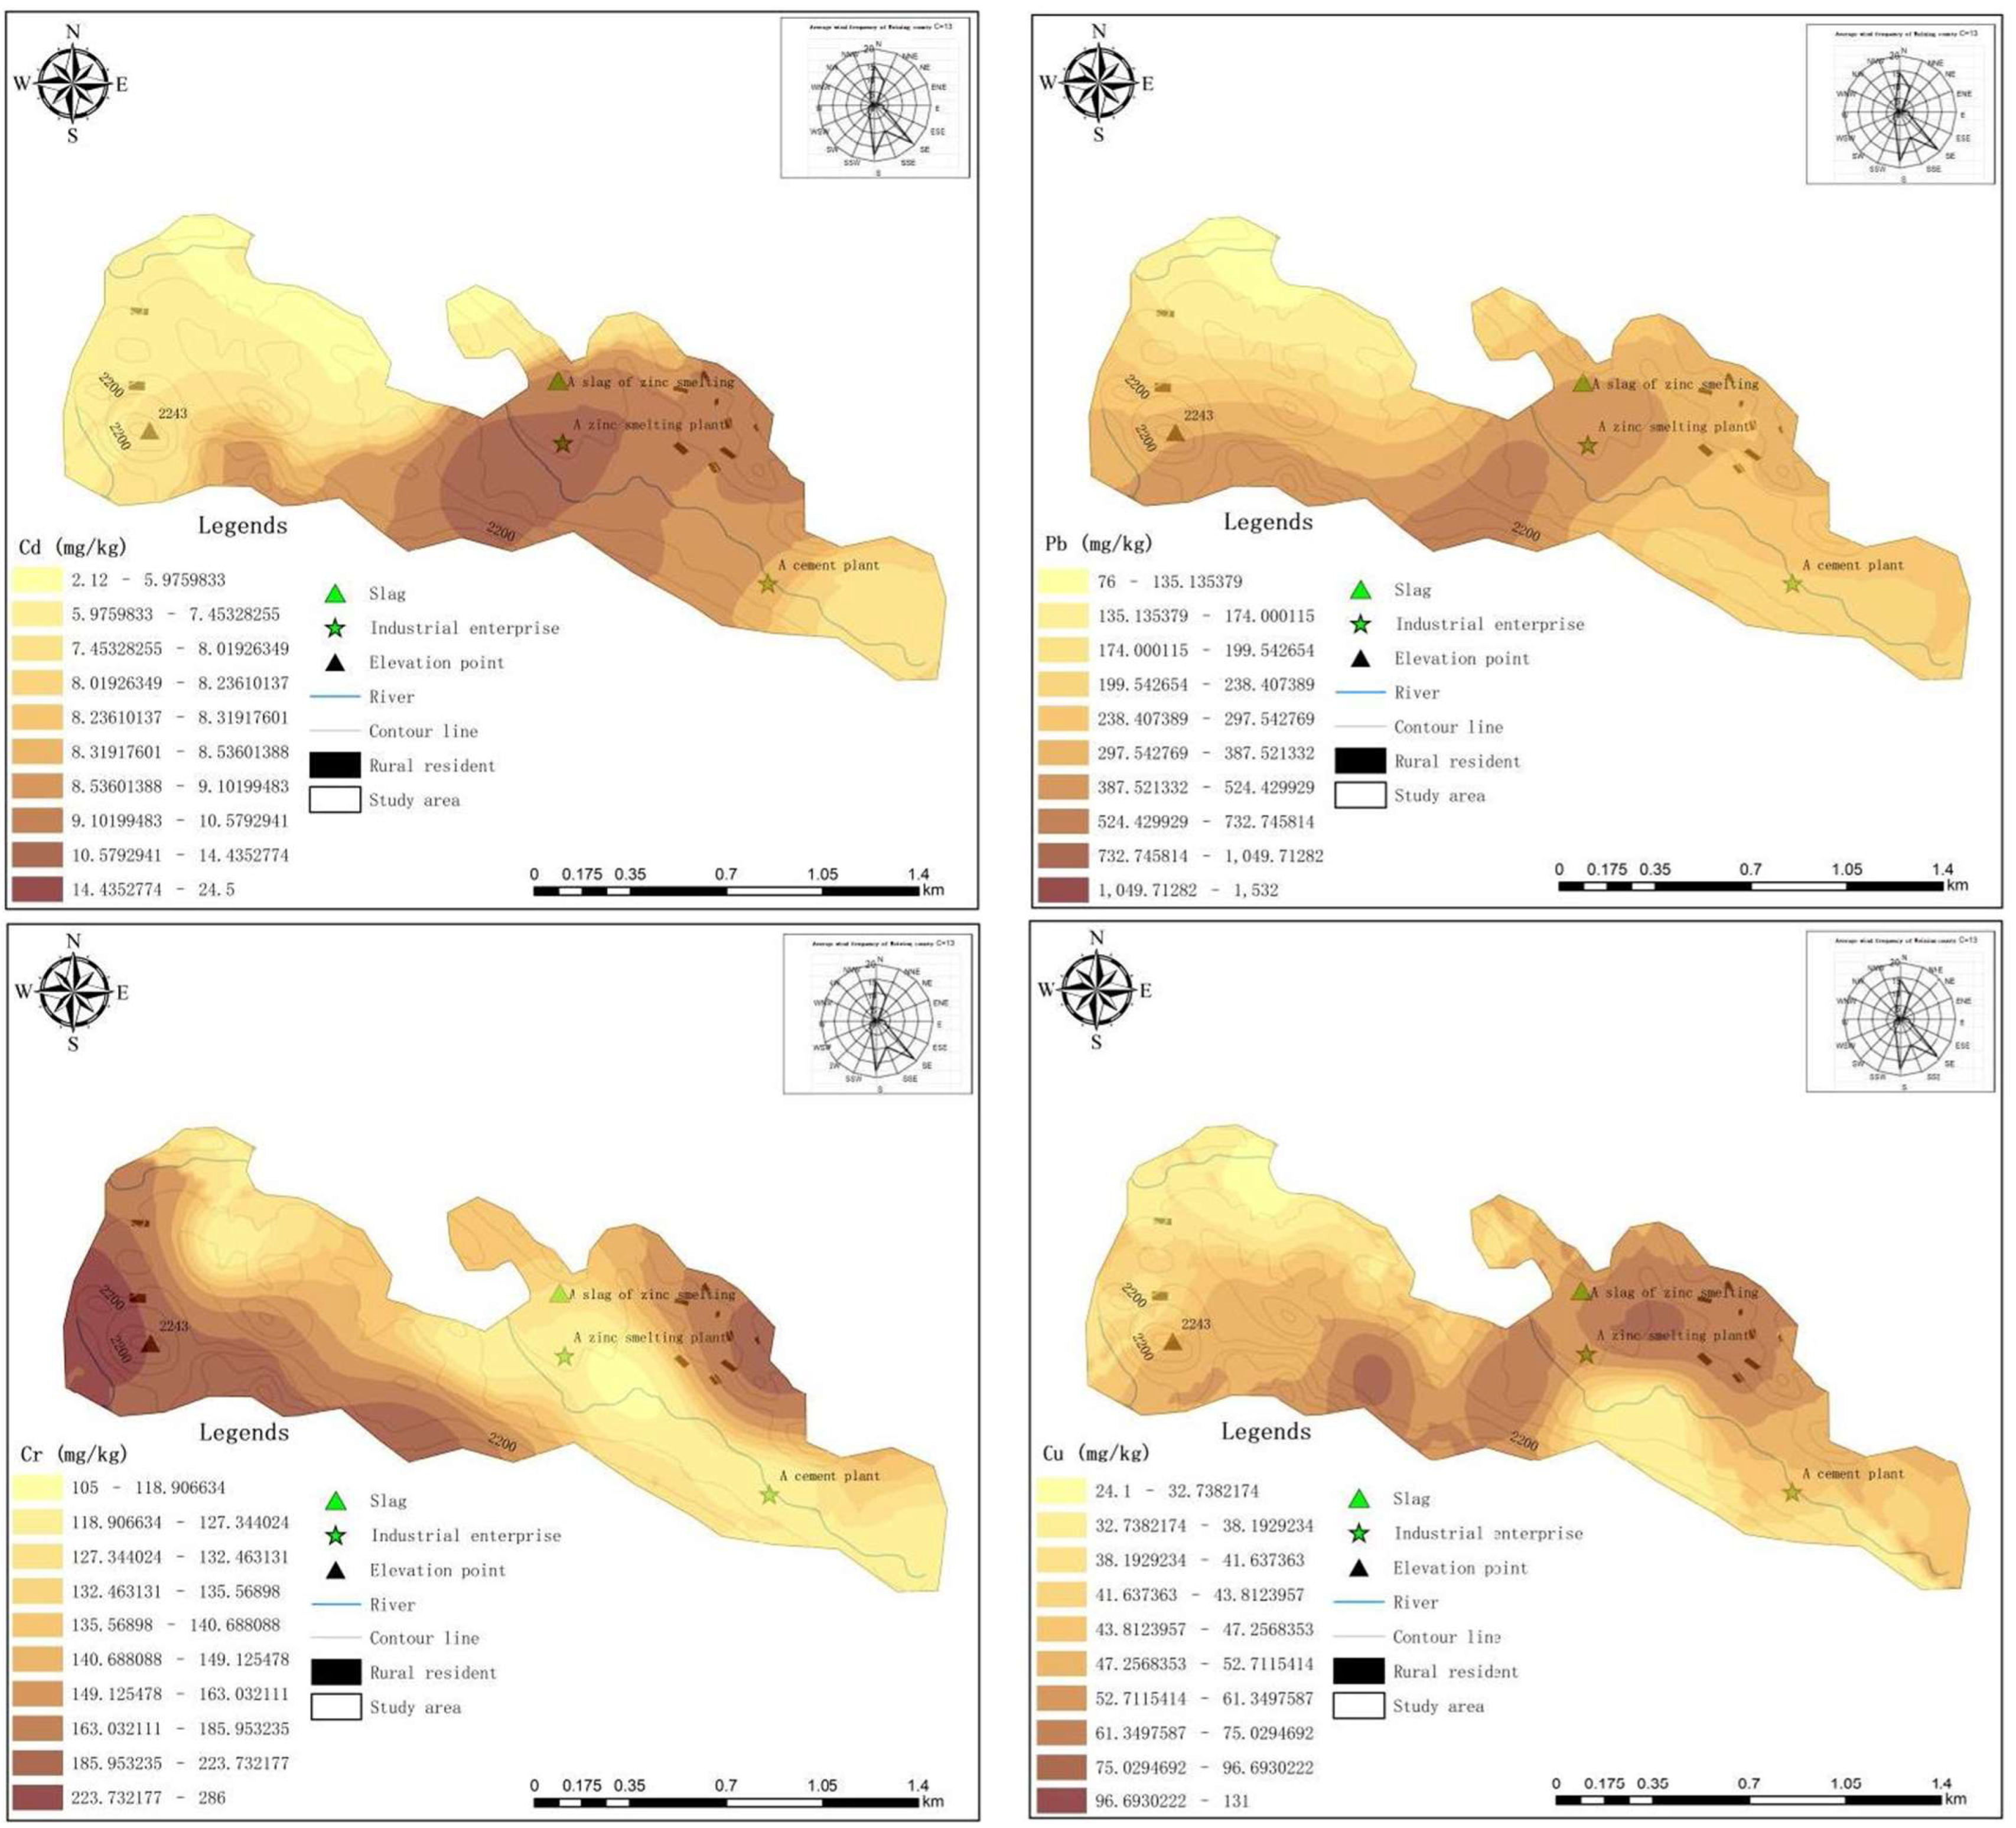
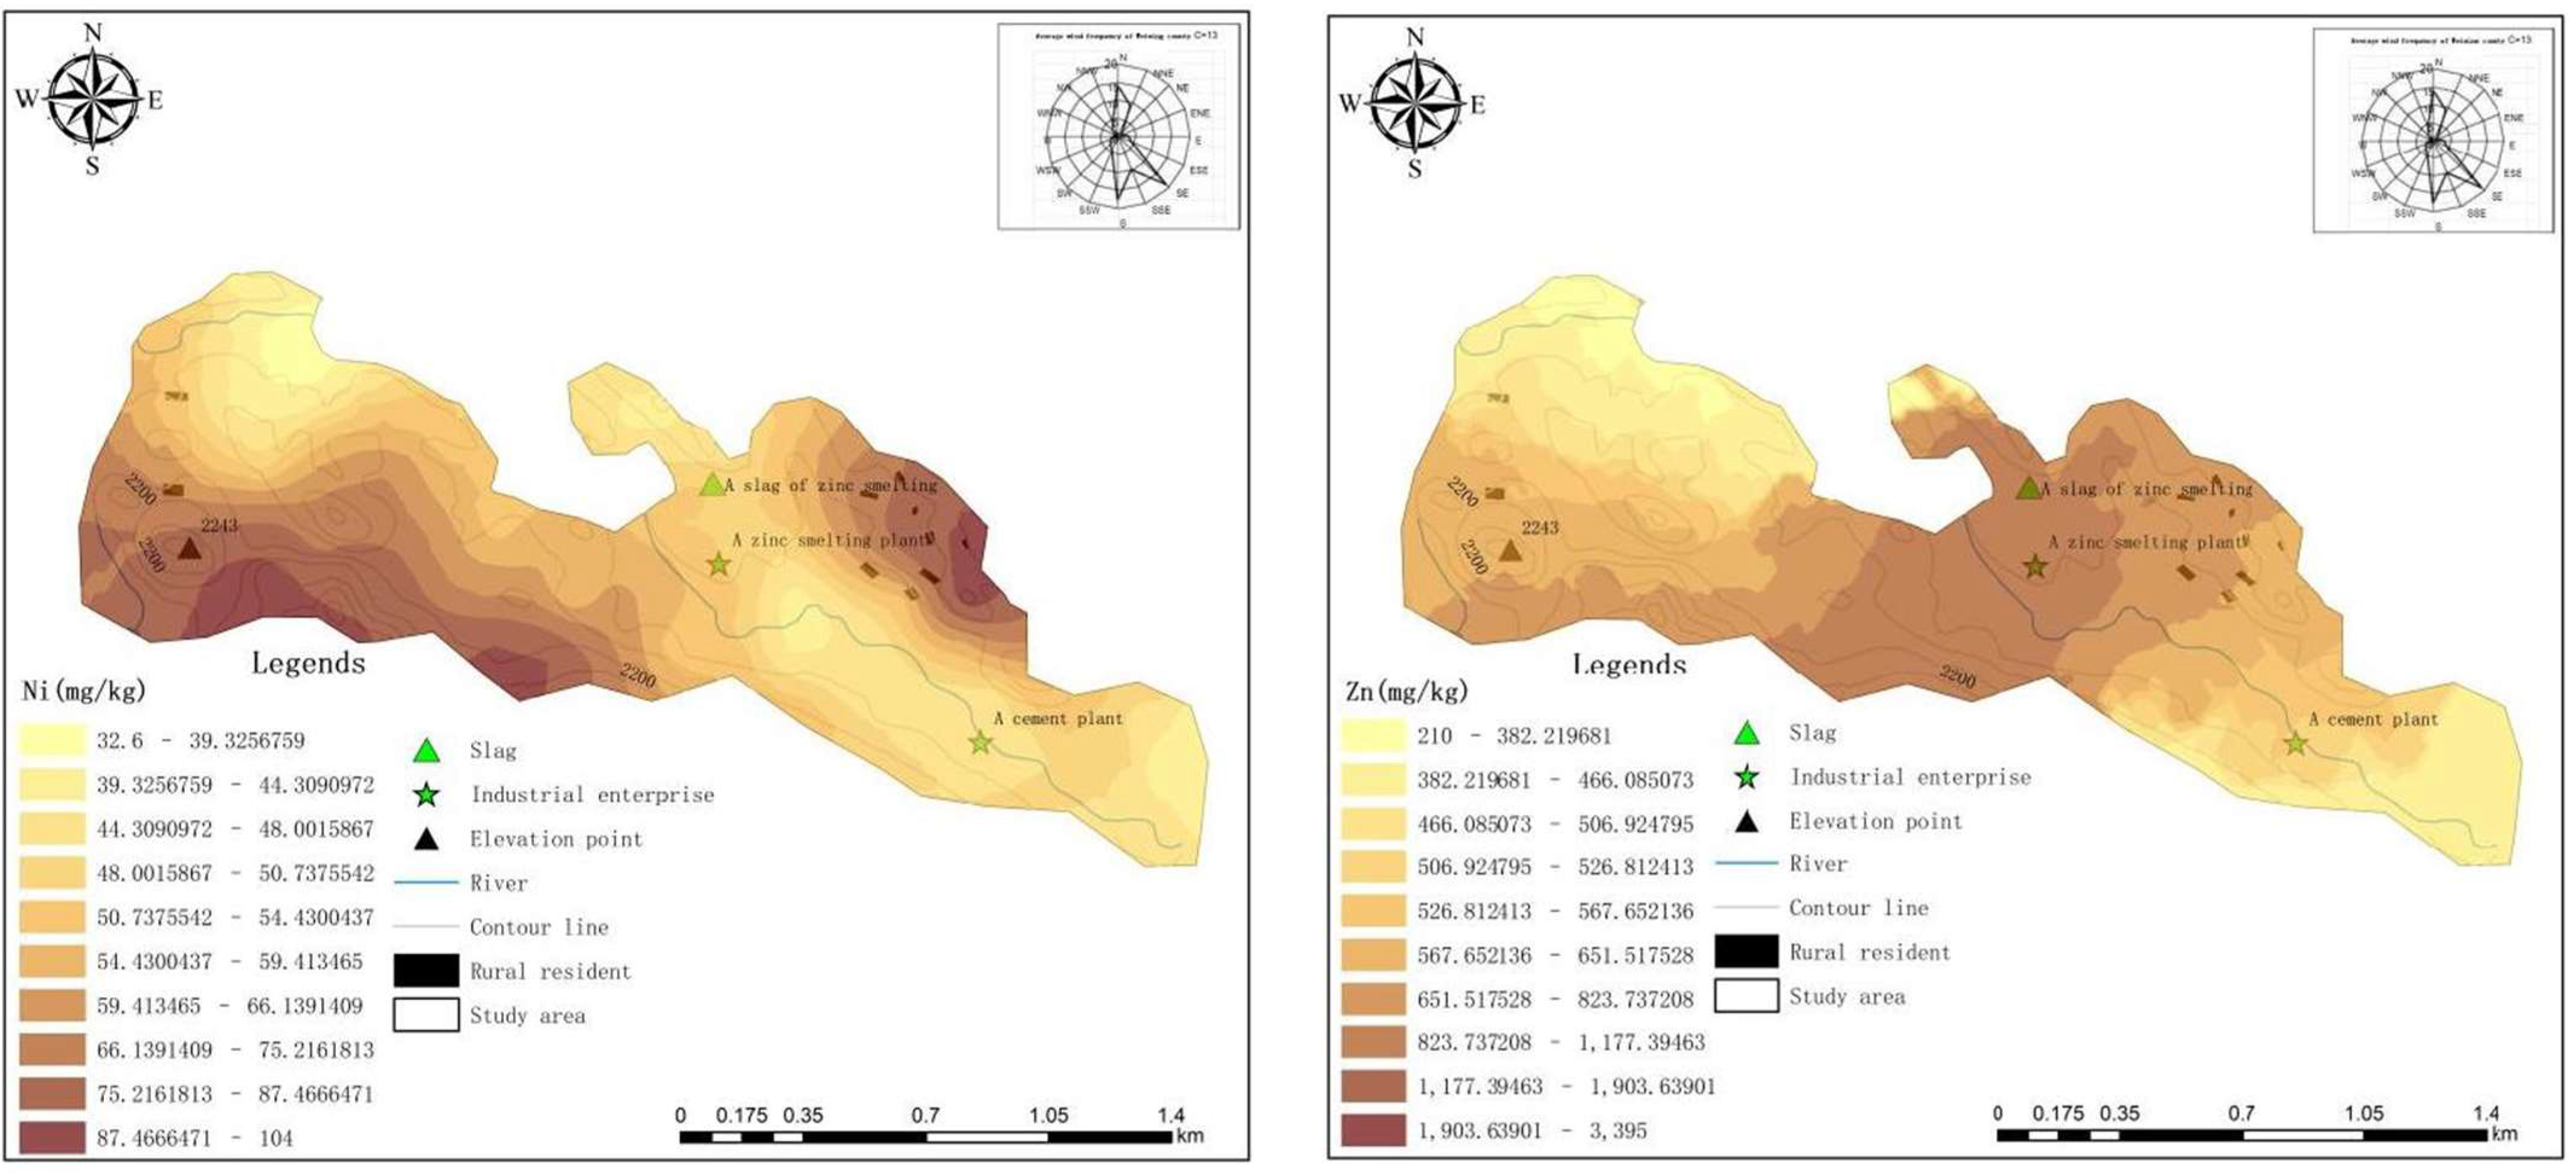
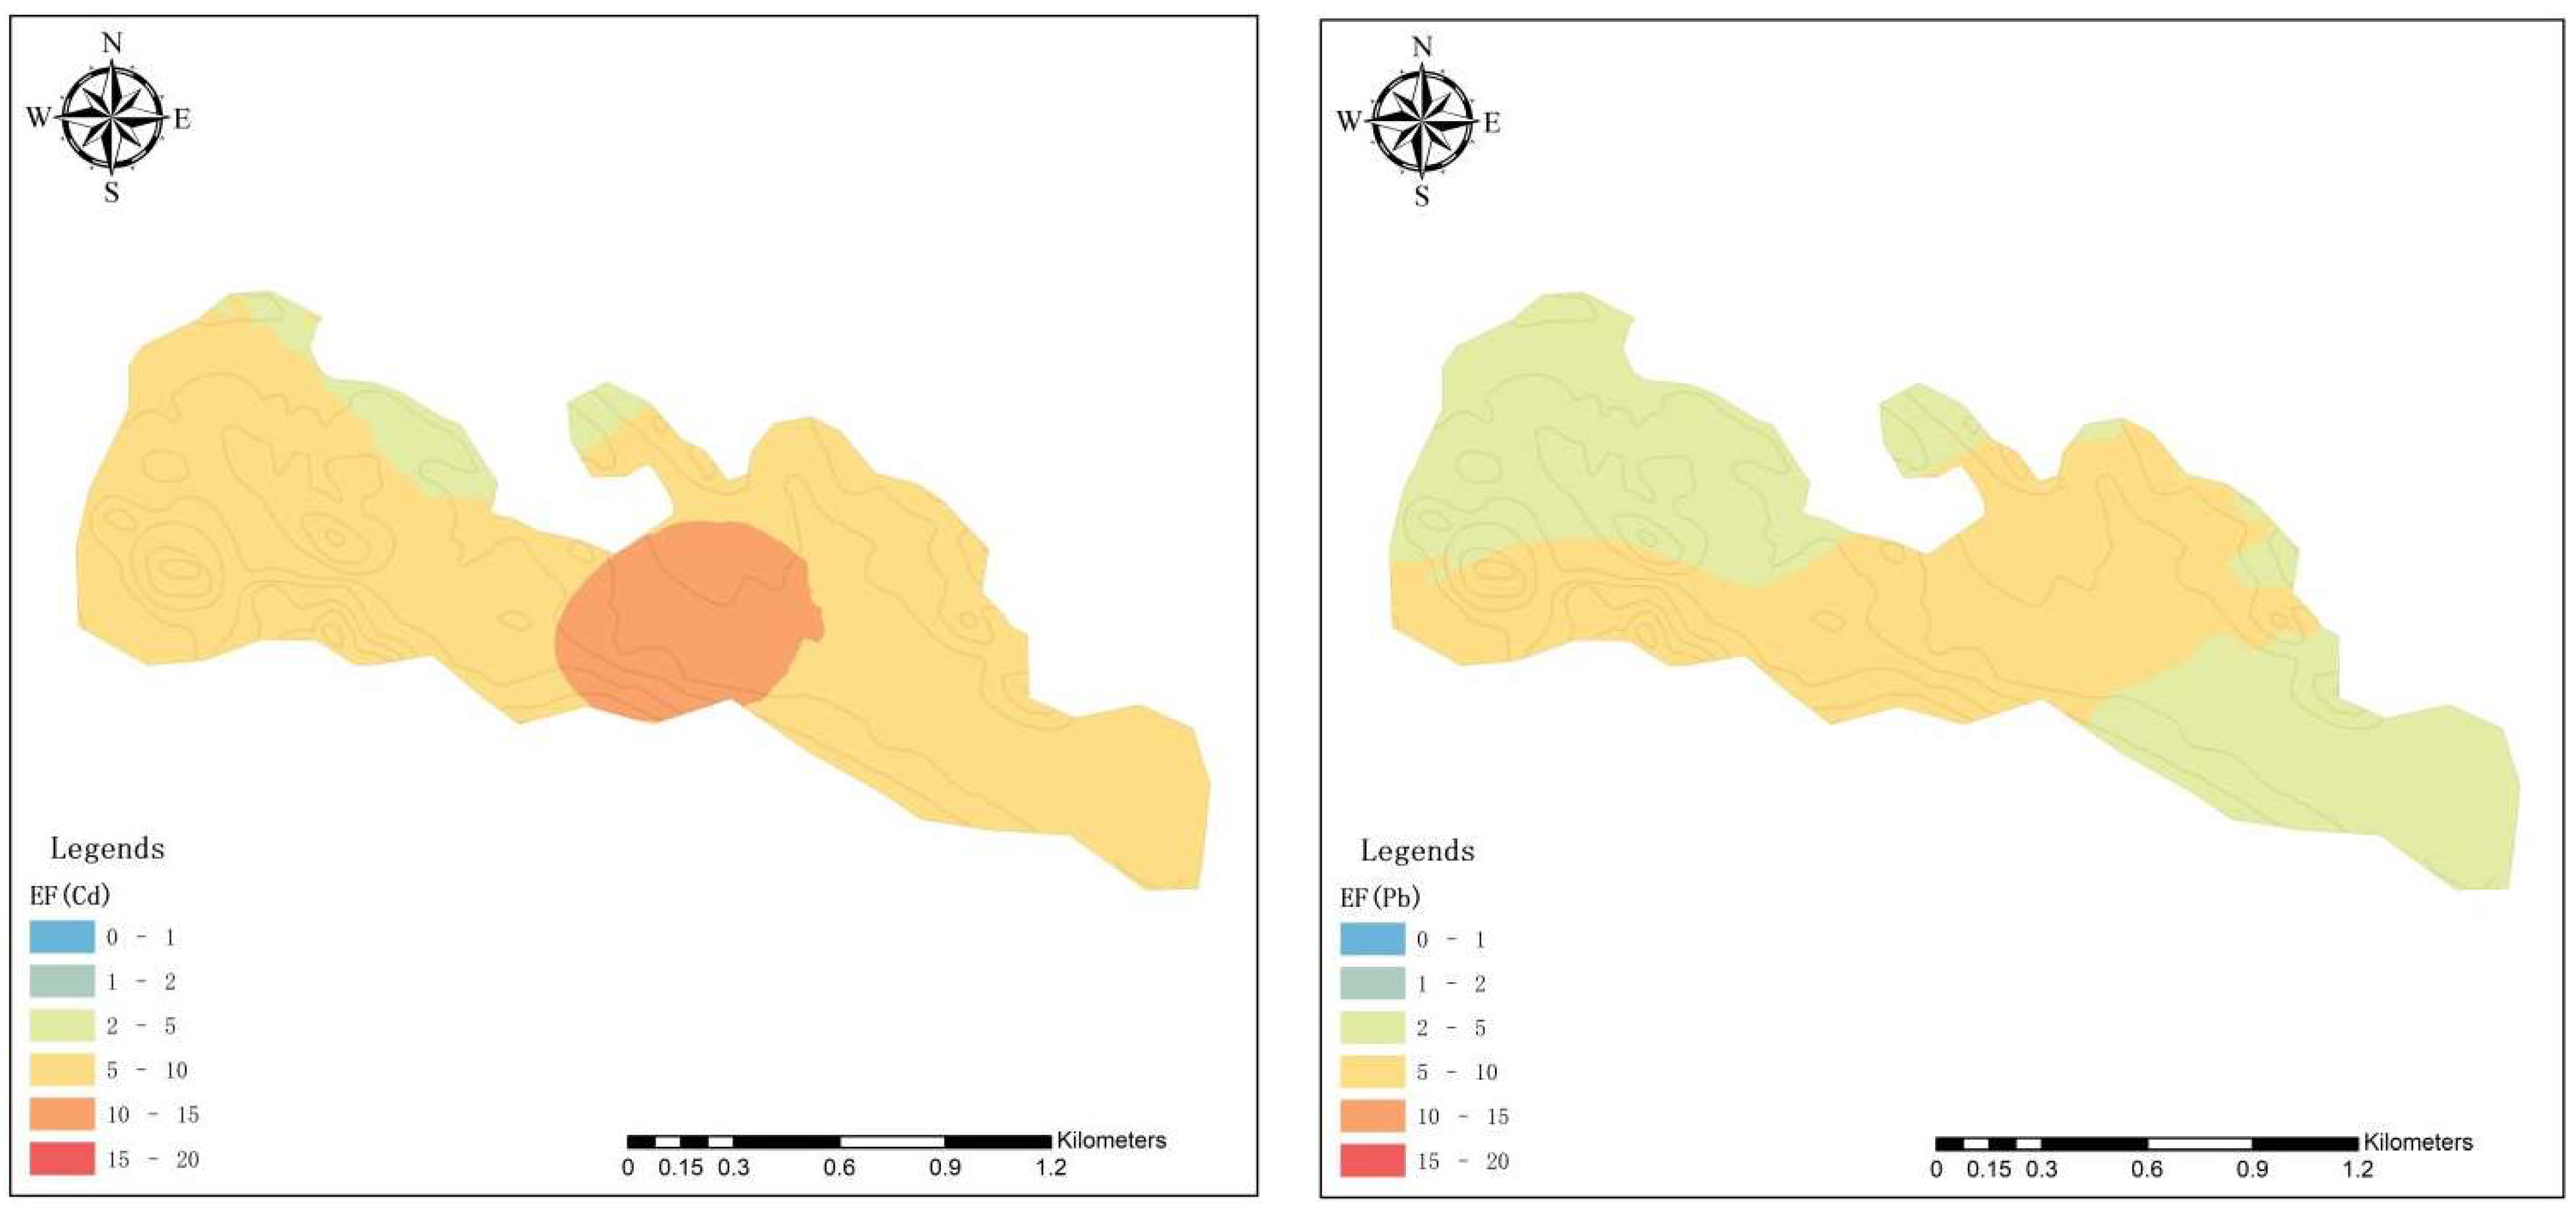
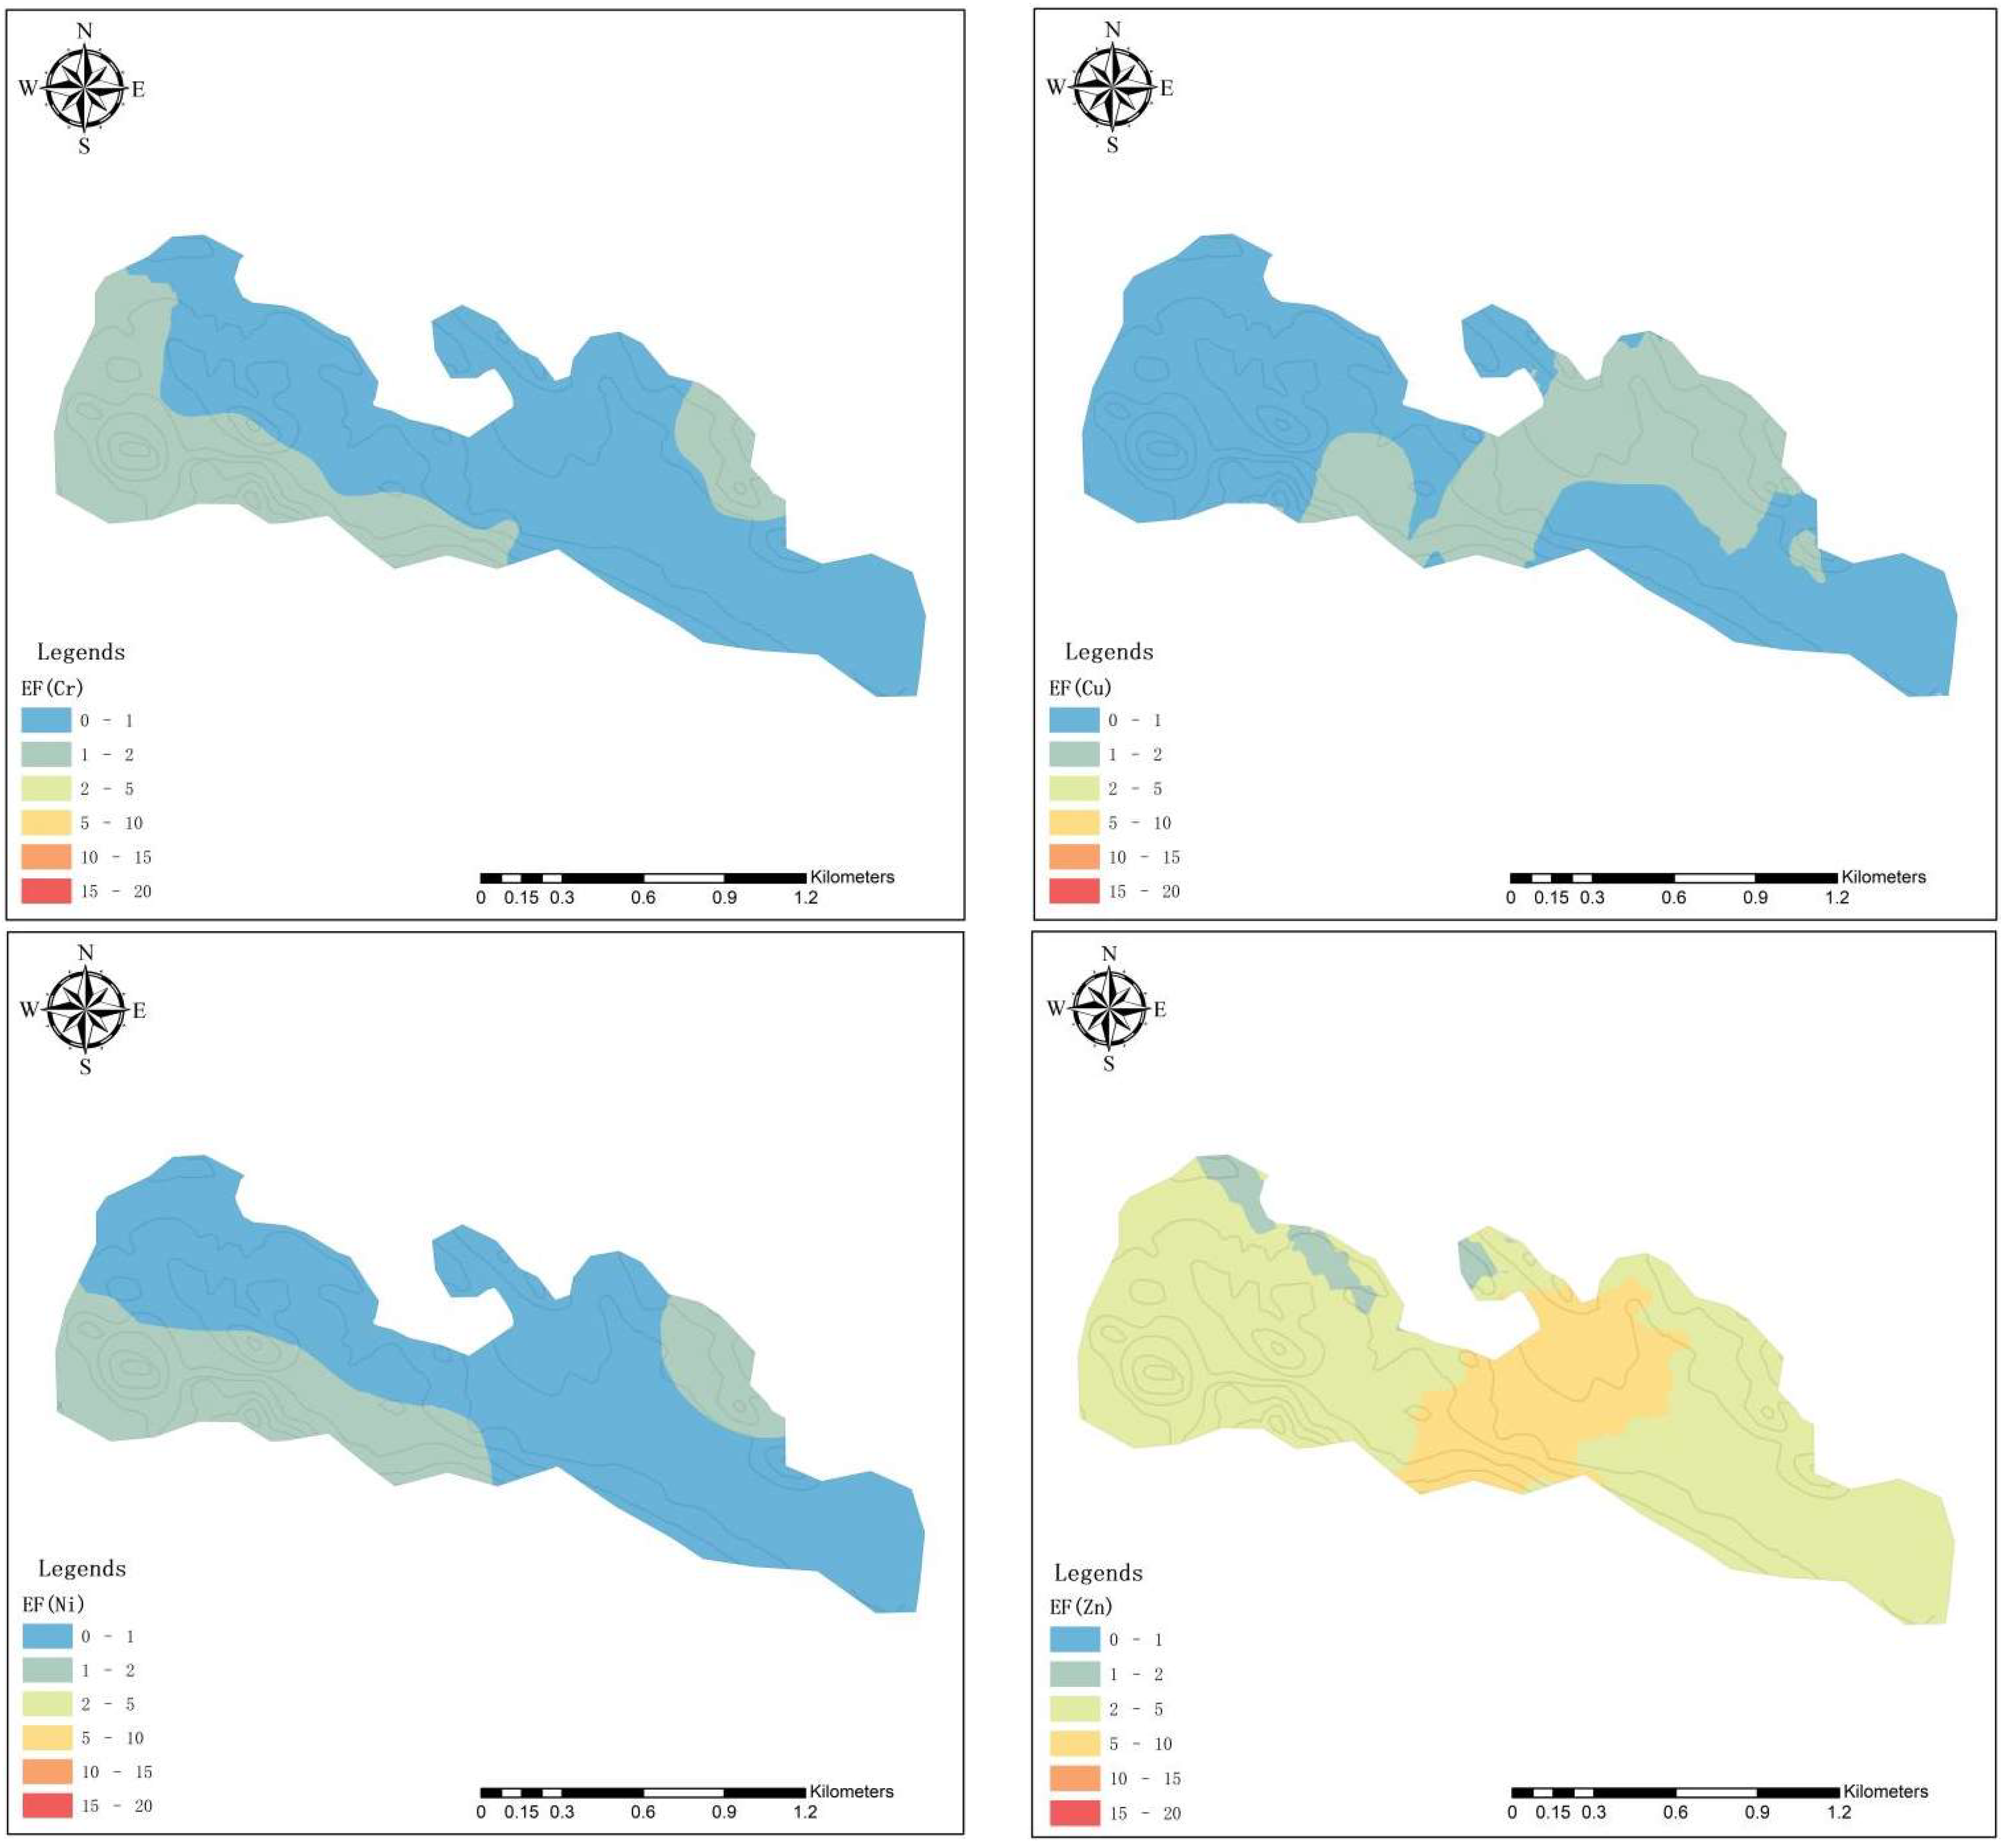
3.3.1. Spatial Distribution of HMs
- 1.
- Horizontal distribution
- 2.
- Soil profiles
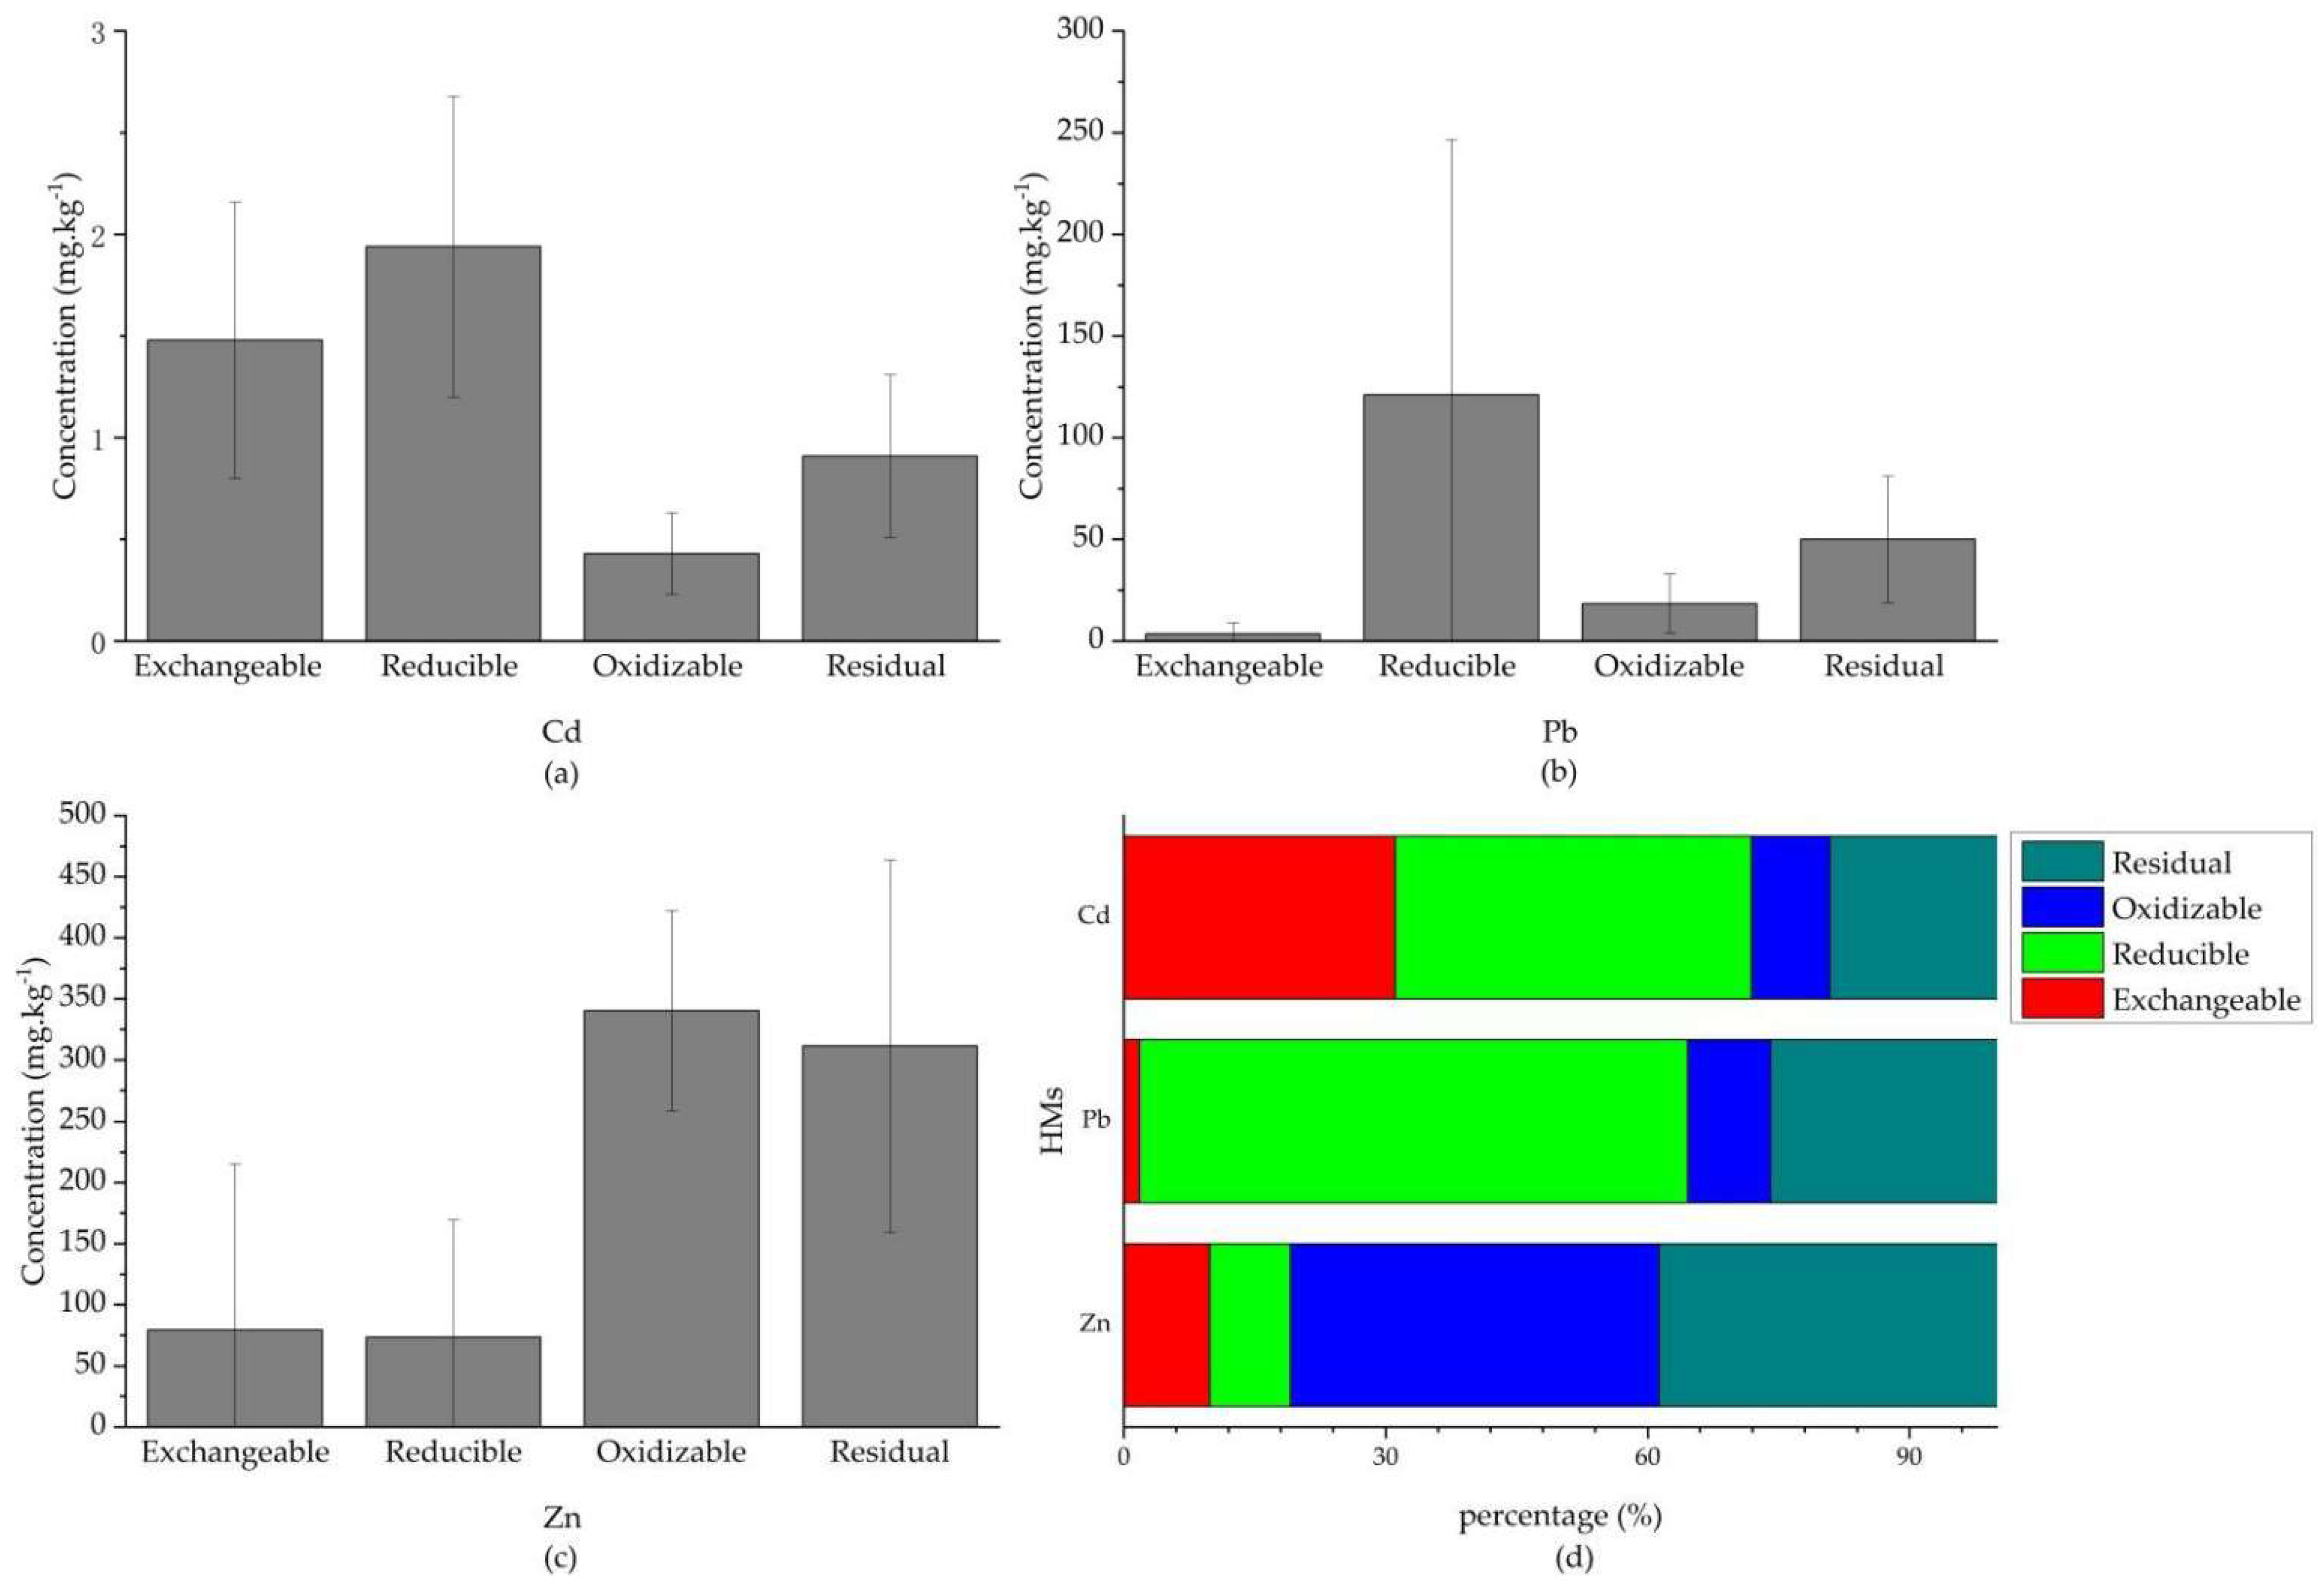
3.3.2. Chemical Fraction of HMs
4. Conclusions
Author Contributions
Funding
Institutional Review Board Statement
Informed Consent Statement
Data Availability Statement
Acknowledgments
Conflicts of Interest
References
- Carolin, C.F.; Kumar, P.S.; Saravanan, A.; Joshiba, G.J.; Naushad, M. Efficient techniques for the removal of toxic heavy metals from aquatic environment: A review. J. Environ. Chem. Eng. 2017, 5, 2782–2799. [Google Scholar] [CrossRef]
- Islam, S.; Ahmed, K.; Al Mamun, H.; Masunaga, S. Trace metals in soil and vegetables and associated health risk assessment. Environ. Monit. Assess. 2014, 186, 8727–8739. [Google Scholar] [CrossRef]
- Ahmed, M.K.; Baki, M.A.; Islam, M.S.; Kundu, G.K.; Habibullah-Al-Mamun, M.; Sarkar, S.K.; Hossain, M.M. Human health risk assessment of heavy metals in tropical fish and shellfish collected from the river Buriganga, Bangladesh. Environ. Sci. Pollut. Res. 2015, 22, 15880–15890. [Google Scholar] [CrossRef] [PubMed]
- Li, Z.Y.; Ma, Z.W.; van der Kuijp, T.J.; Yuan, Z.W.; Huang, L. A review of soil heavy metal pollution from mines in China: Pollution and health risk assessment. Sci. Total Environ. 2014, 468–469, 843–853. [Google Scholar] [CrossRef]
- Wen, H.; Zhu, C.; Zhang, Y.; Cloquet, C.; Fan, H.; Fu, S. Zn/Cd ratios and cadmium isotope evidence for the classification of lead-zinc deposits. Sci. Rep. 2016, 6, 25273. [Google Scholar] [CrossRef]
- CNEMC. Chinese Soil Element Background Value; Environmental Science Press: Beijing, China, 1990. [Google Scholar]
- Chen, H.; Teng, Y.; Lu, S.; Wang, Y.; Wang, J. Contamination features and health risk of soil heavy metals in China. Sci. Total Environ. 2015, 512–513, 143–153. [Google Scholar] [CrossRef] [PubMed]
- Duan, Z.; Luo, Y.; Wu, Y.; Wang, J.; Cai, X.; Wen, J.; Xu, J. Heavy metals accumulation and risk assessment in a soil-maize (Zea mays L.) system around a zinc-smelting area in southwest China. Environ. Geochem. Health 2021, 43, 4875–4889. [Google Scholar] [CrossRef] [PubMed]
- Peng, Y.; Yang, R.; Jin, T.; Chen, J.; Zhang, J. Potentially toxic metal(loid) distribution and migration in the bottom weathering profile of indigenous zinc smelting slag pile in clastic rock region. PeerJ 2021, 9, e10825. [Google Scholar] [CrossRef]
- Liu, N.; Liu, H.; Wu, P.; Meng, W.; Li, X.; Chen, X. Distribution characteristics and potential pollution assessment of heavy metals (Cd, Pb, Zn) in reservoir sediments from a historical artisanal zinc smelting area in Southwest China. Environ. Sci. Pollut. Res. 2021, 29, 14288–14298. [Google Scholar] [CrossRef]
- Bi, C.; Chen, Y.; Zhao, Z.; Li, Q.; Zhou, Q.; Ye, Z.; Ge, X. Characteristics, sources and health risks of toxic species (PCDD/Fs, PAHs and heavy metals) in PM2.5 during fall and winter in an industrial area. Chemosphere 2020, 238, 124620. [Google Scholar] [CrossRef]
- Mao, L.; Liu, L.; Yan, N.; Li, F.; Tao, H.; Ye, H.; Wen, H. Factors controlling the accumulation and ecological risk of trace metal(loid)s in river sediments in agricultural field. Chemosphere 2020, 243, 125359. [Google Scholar] [CrossRef] [PubMed]
- Xuan, B.; Lu, X.; Wang, J.; Cai, X.; Duan, Z.; Hu, F.; Wang, K.; Li, D. Spatial Distribution Characteristic and Assessment of Total and Available Heavy Metals in Karst Peri-Urban Vegetable Soil. IOP Conf. Series Mater. Sci. Eng. 2018, 392, 042022. [Google Scholar] [CrossRef]
- Cheng, N.; Zhang, C.; Jing, D.; Li, W.; Guo, T.; Wang, Q.; Li, S. An integrated chemical mass balance and source emission inventory model for the source apportionment of PM2.5 in typical coastal areas. J. Environ. Sci. 2020, 92, 118–128. [Google Scholar] [CrossRef] [PubMed]
- Cloquet, C.; Carignan, J.; Libourel, G.; Sterckeman, T.; Perdrix, E. Tracing Source Pollution in Soils Using Cadmium and Lead Isotopes. Environ. Sci. Technol. 2006, 40, 2525–2530. [Google Scholar] [CrossRef] [PubMed]
- Jiao, W.; Chen, W.; Chang, A.C.; Page, A.L. Environmental risks of trace elements associated with long-term phosphate fertilizers applications: A review. Environ. Pollut. 2012, 168, 44–53. [Google Scholar] [CrossRef]
- Yu, E.; Liu, H.; Tu, Y.; Gu, X.; Ran, X.; Yu, Z.; Wu, P. Superposition Effects of Zinc Smelting Atmospheric Deposition on Soil Heavy Metal Pollution Under Geochemical Anomaly. Front. Environ. Sci. 2022, 10, 777894. [Google Scholar] [CrossRef]
- Wiggenhauser, M.; Bigalke, M.; Imseng, M.; Keller, A.; Rehkämper, M.; Wilcke, W.; Frossard, E.; Wiggenhauser, M.; Bigalke, M.; Imseng, M.; et al. Using isotopes to trace freshly applied cadmium through mineral phosphorus fertilization in soil-fertilizer-plant systems. Sci. Total Environ. 2019, 648, 779–786. [Google Scholar] [CrossRef]
- Wan, Y.; Huang, Q.; Wang, Q.; Yu, Y.; Su, D.; Qiao, Y.; Li, H. Accumulation and bioavailability of heavy metals in an acid soil and their uptake by paddy rice under continuous application of chicken and swine manure. J. Hazard. Mater. 2020, 384, 121293. [Google Scholar] [CrossRef]
- Taghvaee, S.; Sowlat, M.H.; Mousavi, A.; Hassanvand, M.S.; Yunesian, M.; Naddafi, K.; Sioutas, C. Source apportionment of ambient PM2.5 in two locations in central Tehran using the Positive Matrix Factorization (PMF) model. Sci. Total Environ. 2018, 628–629, 672–686. [Google Scholar] [CrossRef]
- Zhang, Q.; Han, G.; Liu, M.; Liang, T. Spatial distribution and controlling factors of heavy metals in soils from Puding Karst Critical Zone Observatory, southwest China. Environ. Earth Sci. 2019, 78, 279. [Google Scholar] [CrossRef]
- Ruan, X.-L.; Zhang, G.-L.; NI, L.-J.; He, Y. Distribution and Migration of Heavy Metals in Undisturbed Forest Soils: A High Resolution Sampling Method. Pedosphere 2008, 18, 386–393. [Google Scholar] [CrossRef]
- Luo, K.; Liu, H.; Zhao, Z.; Long, J.; Li, J.; Jiang, C.; Rao, C. Spatial Distribution and Migration of Cadmium in Contaminated Soils Associated with a Geochemical Anomaly: A Case Study in Southwestern China. Pol. J. Environ. Stud. 2019, 28, 3799–3807. [Google Scholar] [CrossRef]
- Saha, J.K.; Selladurai, R.; Coumar, M.V.; Dotaniya, M.L.; Kundu, S.; Patra, A.K. Assessment of Heavy Metals Contamination in Soil. In Soil Pollution—An Emerging Threat to Agriculture. Environmental Chemistry for a Sustainable World; Springer: Singapore, 2017; pp. 155–191. [Google Scholar] [CrossRef]
- Yang, W.; Zhou, H.; Gu, J.; Liao, B.; Zhang, J.; Wu, P. Application of rapeseed residue increases soil organic matter, microbial biomass, and enzyme activity and mitigates cadmium pollution risk in paddy fields. Environ. Pollut. 2020, 264, 114681. [Google Scholar] [CrossRef]
- Yang, L.; Yang, W.; Gu, S.; Zhang, J.; Wu, P. Effects of Organic Fertilizers on Cd Activity in Soil and Cd Accumulation in Rice in Three Paddy Soils from Guizhou Province. Bull. Environ. Contam. Toxicol. 2021, 107, 1161–1166. [Google Scholar] [CrossRef] [PubMed]
- Rodríguez, L.; Ruiz, E.; Alonso-Azcárate, J.; Rincón, J. Heavy metal distribution and chemical speciation in tailings and soils around a Pb–Zn mine in Spain. J. Environ. Manag. 2009, 90, 1106–1116. [Google Scholar] [CrossRef]
- Chen, H. Environmental Edaphology, 3rd ed.; Science Press: Beijing, China, 2018. [Google Scholar]
- Pusz, A.; Wiśniewska, M.; Rogalski, D. Assessment of the Accumulation Ability of Festuca rubra L. and Alyssum saxatile L. Tested on Soils Contaminated with Zn, Cd, Ni, Pb, Cr, and Cu. Resources 2021, 10, 46. [Google Scholar] [CrossRef]
- Marrugo-Negrete, J.; Pinedo-Hernández, J.; Díez, S. Assessment of heavy metal pollution, spatial distribution and origin in agricultural soils along the Sinú River Basin, Colombia. Environ. Res. 2017, 154, 380–388. [Google Scholar] [CrossRef]
- Yang, H.; Wang, F.; Yu, J.; Huang, K.; Zhang, H.; Fu, Z. An improved weighted index for the assessment of heavy metal pollution in soils in Zhejiang, China. Environ. Res. 2021, 192, 110246. [Google Scholar] [CrossRef]
- Davis, E.; Walker, T.R.; Adams, M.; Willis, R.; Norris, G.A.; Henry, R.C. Source apportionment of polycyclic aromatic hydrocarbons (PAHs) in small craft harbor (SCH) surficial sediments in Nova Scotia, Canada. Sci. Total Environ. 2019, 691, 528–537. [Google Scholar] [CrossRef]
- Huang, Y.; Deng, M.; Wu, S.; Japenga, J.; Li, T.; Yang, X.; He, Z. A modified receptor model for source apportionment of heavy metal pollution in soil. J. Hazard. Mater. 2018, 354, 161–169. [Google Scholar] [CrossRef]
- Li, Y.; Liu, B.; Xue, Z.; Zhang, Y.; Sun, X.; Song, C.; Dai, Q.; Fu, R.; Tai, Y.; Gao, J.; et al. Chemical characteristics and source apportionment of PM2.5 using PMF modelling coupled with 1-hr resolution online air pollutant dataset for Linfen, China. Environ. Pollut. 2020, 263, 114532. [Google Scholar] [CrossRef]
- Bi, X.; Feng, X.; Yang, Y.; Qiu, G.; Li, G.; Li, F.; Liu, T.; Fu, Z.; Jin, Z. Environmental contamination of heavy metals from zinc smelting areas in Hezhang County, western Guizhou, China. Environ. Int. 2006, 32, 883–890. [Google Scholar] [CrossRef] [PubMed]
- Konstantinova, E.; Minkina, T.; Nevidomskaya, D.; Mandzhieva, S.; Bauer, T.; Zamulina, I.; Voloshina, M.; Lobzenko, I.; Maksimov, A.; Sushkova, S. Potentially toxic elements in surface soils of the Lower Don floodplain and the Taganrog Bay coast: Sources, spatial distribution and pollution assessment. Environ. Geochem. Health 2021, 1–19. [Google Scholar] [CrossRef]
- Yebpella, G.G.; Baba, N.H.; Magomya, A.M.; Odoh, R. Analysis of Heavy Metals in Soil and Sediments Along the Bank and Bed of River Benue in Taraba State Nigeria. Curr. Environ. Eng. 2019, 6, 141–149. [Google Scholar] [CrossRef]
- Chabukdhara, M.; Nema, A.K. Assessment of heavy metal contamination in Hindon River sediments: A chemometric and geochemical approach. Chemosphere 2012, 87, 945–953. [Google Scholar] [CrossRef] [PubMed]
- Elsagh, A.; Jalilian, H.; Aslshabestari, M.G. Evaluation of heavy metal pollution in coastal sediments of Bandar Abbas, the Persian Gulf, Iran: Mercury pollution and environmental geochemical indices. Mar. Pollut. Bull. 2021, 167, 112314. [Google Scholar] [CrossRef]
- Wang, Z.; Lin, K.; Liu, X. Distribution and pollution risk assessment of heavy metals in the surface sediment of the intertidal zones of the Yellow River Estuary, China. Mar. Pollut. Bull. 2022, 174, 113286. [Google Scholar] [CrossRef]
- Sutherland, R.A. Bed sediment-associated trace metals in an urban stream, Oahu, Hawaii. Environ. Geol. 2000, 39, 611–627. [Google Scholar] [CrossRef]
- Fei, X.; Xiao, R.; Christakos, G.; Langousis, A.; Ren, Z.; Tian, Y.; Lv, X. Comprehensive assessment and source apportionment of heavy metals in Shanghai agricultural soils with different fertility levels. Ecol. Indic. 2019, 106, 105508. [Google Scholar] [CrossRef]
- Wang, J.; Gao, B.; Yin, S.; Liu, L.; Xu, D.; Li, Y. Comprehensive Evaluation and Source Apportionment of Potential Toxic Elements in Soils and Sediments of Guishui River, Beijing. Water 2019, 11, 1847. [Google Scholar] [CrossRef]
- Liu, H.; Wang, Z.H.; Li, F.; Li, K.; Yang, N.; Yang, Y.; Huang, D.; Liang, D.; Zhao, H.; Mao, H.; et al. Grain iron and zinc concentrations of wheat and their relationships to yield in major wheat production areas in China. Field Crop. Res. 2014, 156, 151–160. [Google Scholar] [CrossRef]
- Zhu, Y.; Jin, Y.; Liu, X.; Miao, T.; Guan, Q.; Yang, R.; Qu, J. Insight into interactions of heavy metals with livestock manure compost-derived dissolved organic matter using EEM-PARAFAC and 2D-FTIR-COS analyses. J. Hazard. Mater. 2021, 420, 126532. [Google Scholar] [CrossRef]
- Duan, B.; Feng, Q. Comparison of the Potential Ecological and Human Health Risks of Heavy Metals from Sewage Sludge and Livestock Manure for Agricultural Use. Toxics 2021, 9, 145. [Google Scholar] [CrossRef]
- Guan, T.; He, H.; Zhang, X.; Bai, Z. Cu fractions, mobility and bioavailability in soil-wheat system after Cu-enriched livestock manure applications. Chemosphere 2011, 82, 215–222. [Google Scholar] [CrossRef]
- Kumar, R.R.; Park, B.J.; Cho, J.Y. Application and environmental risks of livestock manure. J. Korean Soc. Appl. Biol. Chem. 2013, 56, 497–503. [Google Scholar] [CrossRef]
- Bi, X.; Feng, X.; Yang, Y.; Qiu, G.; Li, G. Quantitative assessment of cadmium emission from zinc smelting and its influences on the surface soils and mosses in Hezhang County, Southwestern China. Atmos. Environ. 2006, 40, 4228–4233. [Google Scholar] [CrossRef]
- Wu, P.; Liu, C.; Yang, Y.; Zhang, G. Environmental impacts and geochemical partitioning of heavy metals (Pb and Zn) in historical Zn smelting wastes. Geochemistry 2003, 2, 139–145. (In Chinese) [Google Scholar] [CrossRef]
- Li, H.; Tatarko, J.; Kucharski, M.; Dong, Z. PM2.5 and PM10 emissions from agricultural soils by wind erosion. Aeolian Res. 2015, 19, 171–182. [Google Scholar] [CrossRef]
- Chrastný, V.; Vanek, A.; Teper, L.; Cabala, J.; Procházka, J.; Pechar, L.; Drahota, P.; Penížek, V.; Komárek, M.; Novák, M. Geochemical position of Pb, Zn and Cd in soils near the Olkusz mine/smelter, South Poland: Effects of land use, type of contamination and distance from pollution source. Environ. Monit. Assess. 2011, 184, 2517–2536. [Google Scholar] [CrossRef]
- Clevenger, T.E.; Saiwan, C.; Koirtyohann, S.R. Lead speciation of particles on air filters collected in the vicinity of a lead smelter. Environ. Sci. Technol. 1991, 25, 1128–1133. [Google Scholar] [CrossRef]
- Hu, H.; Deng, Q.; Li, C.; Xie, Y.; Dong, Z.; Zhang, W. The recovery of Zn and Pb and the manufacture of lightweight bricks from zinc smelting slag and clay. J. Hazard. Mater. 2014, 271, 220–227. [Google Scholar] [CrossRef]
- Okoro, S.; Eneh, N.; Asadu, C. Removal of chromium from Enugu coal using HCl as leaching agent. J. Appl. Sci. Environ. Manag. 2018, 22, 937. [Google Scholar] [CrossRef]
- Shi, M.; Cheng, J.; Luo, G.; Yao, H. Investigation of Chromium speciation in western low-rank coal and vaporization characteristics during combustion. J. Eng. Thermophys. 2017, 6, 1344–1350. (In Chinese) [Google Scholar]
- Facchinelli, A.; Sacchi, E.; Mallen, L. Multivariate statistical and GIS-based approach to identify heavy metal sources in soils. Environ. Pollut. 2001, 114, 313–324. [Google Scholar] [CrossRef]


| Classification | EF | Degree of Enrichment |
|---|---|---|
| I | ≤1 | No enrichment |
| II | 1~2 | Slight enrichment |
| III | 2~5 | Moderate enrichment |
| IV | 5~20 | Significant enrichment |
| V | 20~40 | Intense enrichment |
| VI | >40 | Extremely intense enrichment |
| Heavy Metals | Min | Max | Mean | SD | CV (%) | Background Value [6] |
|---|---|---|---|---|---|---|
| Cd | 2.12 | 24.5 | 8.71 | 3.51 | 40.3 | 0.660 |
| Pb | 76.0 | 1530 | 333 | 257 | 77.2 | 35.2 ± 19.6 |
| Cr | 105 | 286 | 154 | 40.0 | 25.9 | 95.9 ± 63.2 |
| Cu | 24.1 | 131 | 51.7 | 22.1 | 42.7 | 32.0 ± 20.8 |
| Ni | 32.6 | 104 | 61.5 | 17.5 | 28.5 | 39.1 ± 22.4 |
| Zn | 210 | 3340 | 676 | 526 | 77.9 | 99.5 ± 56.0 |
| Pollution Sources | Cd | Pb | Cr | Cu | Ni | Zn | Sample Size (n) |
|---|---|---|---|---|---|---|---|
| Irrigation water | 1.03 ± 1.02 | 11.0 ± 12.4 | - | - | - | 33.9 ± 35.9 | 7 |
| Livestock manure | 8.31 ± 3.61 | 229 ± 106 | 39.6 ± 19.0 | 62.7 ± 54.0 | 18.84 ± 8.24 | 668 ± 266.0 | 6 |
| Pesticide | - | 0.31 ± 0.06 | 2.30 ± 0.97 | - | 0.14 ± 0.01 | 6.40 ± 4.58 | 6 |
| Wet deposition | 0.68 ± 0.75 | 14.8 ± 17.78 | 50.6 ± 20.2 | - | - | 63.1 ± 72.7 | 15 |
| Dry deposition | 23.0 ± 12.5 | 2503 ± 1270 | 110 ± 33.5 | 105 ± 22.9 | 43.4 ± 43.4 | 3170 ± 2559 | 15 |
| Rock | 1.08 ± 0.87 | 4.84 ± 4.84 | 14.1 ± 5.57 | 3.41 ± 2.52 | 21.6 ± 10.2 | 35.4 ± 14.4 | 7 |
| Fertilizer | 0.12 ± 0.05 | 1.75 ± 1.02 | 14.8 ± 1.79 | 3.41 ± 0.45 | 3.08 ± 0.59 | 48.3 ± 4.86 | 2 |
| Species | Calculated | Measured | Irrigation Water | Livestock Manure | Pesticide | Wet Deposition | Dry Deposition | Rock | Fertilizer |
|---|---|---|---|---|---|---|---|---|---|
| Cd | 8.710 | 8.7102 | −0.078 | 0.228 | 0.000 | 0.189 | 0.145 | 0.514 | 0.002 |
| Pb | 333.133 | 333.1333 | −0.048 | 0.141 | 0.001 | 0.026 | 0.799 | 0.080 | 0.001 |
| Cr | 154.287 | 154.2888 | 0.000 | 0.037 | 0.010 | 0.682 | 0.056 | 0.200 | 0.015 |
| Cu | 51.733 | 51.7333 | 0.000 | 0.813 | 0.000 | 0.000 | 0.151 | 0.026 | 0.010 |
| Ni | 61.476 | 61.4755 | 0.000 | 0.057 | 0.001 | 0.000 | 0.059 | 0.875 | 0.008 |
| Zn | 676.384 | 676.3788 | −0.058 | 0.297 | 0.006 | 0.258 | 0.295 | 0.190 | 0.011 |
| HMs | Fitting Model | Nugget (C0) | Sill (C0 + C) | C0/C0 + C (%) | Range (m) | R2 | RSS |
|---|---|---|---|---|---|---|---|
| Cd | Spherical | 0.0101 | 0.2552 | 3.96 | 2185.0 | 0.669 | 0.0343 |
| Pb | Spherical | 0.0150 | 0.3510 | 4.27 | 1912.0 | 0.791 | 0.0311 |
| Cr | Gaussian | 0.0007 | 0.0514 | 1.36 | 1437.6 | 0.828 | 6.3990 × 10⁻⁴ |
| Cu | Gaussian | 0.0001 | 0.1442 | 0.07 | 890.3 | 0.660 | 0.0105 |
| Ni | Spherical | 0.0001 | 0.0774 | 0.13 | 2310.0 | 0.885 | 9.9650 × 10⁻⁴ |
| Zn | Gaussian | 0.0035 | 0.2500 | 1.4 | 1312.9 | 0.723 | 0.0266 |
Publisher’s Note: MDPI stays neutral with regard to jurisdictional claims in published maps and institutional affiliations. |
© 2022 by the authors. Licensee MDPI, Basel, Switzerland. This article is an open access article distributed under the terms and conditions of the Creative Commons Attribution (CC BY) license (https://creativecommons.org/licenses/by/4.0/).
Share and Cite
Zhang, Q.; Liu, H.; Liu, F.; Ju, X.; Dinis, F.; Yu, E.; Yu, Z. Source Identification and Superposition Effect of Heavy Metals (HMs) in Agricultural Soils at a High Geological Background Area of Karst: A Case Study in a Typical Watershed. Int. J. Environ. Res. Public Health 2022, 19, 11374. https://doi.org/10.3390/ijerph191811374
Zhang Q, Liu H, Liu F, Ju X, Dinis F, Yu E, Yu Z. Source Identification and Superposition Effect of Heavy Metals (HMs) in Agricultural Soils at a High Geological Background Area of Karst: A Case Study in a Typical Watershed. International Journal of Environmental Research and Public Health. 2022; 19(18):11374. https://doi.org/10.3390/ijerph191811374
Chicago/Turabian StyleZhang, Qiuye, Hongyan Liu, Fang Liu, Xianhang Ju, Faustino Dinis, Enjiang Yu, and Zhi Yu. 2022. "Source Identification and Superposition Effect of Heavy Metals (HMs) in Agricultural Soils at a High Geological Background Area of Karst: A Case Study in a Typical Watershed" International Journal of Environmental Research and Public Health 19, no. 18: 11374. https://doi.org/10.3390/ijerph191811374
APA StyleZhang, Q., Liu, H., Liu, F., Ju, X., Dinis, F., Yu, E., & Yu, Z. (2022). Source Identification and Superposition Effect of Heavy Metals (HMs) in Agricultural Soils at a High Geological Background Area of Karst: A Case Study in a Typical Watershed. International Journal of Environmental Research and Public Health, 19(18), 11374. https://doi.org/10.3390/ijerph191811374