1. Introduction
An estimated 15% of all older adults in the United States are frail [
1]. Even among otherwise healthy older adults, frailty is a powerful antecedent for adverse health outcomes. Frailty is independent from, but confers increased vulnerability to, disability among older adults, and is associated with elevated risk for institutionalization and death [
2,
3]. Among the tested interventions to help mitigate the impact of frailty on older adults, tailored and well-supervised exercise interventions in well-controlled clinical trial environments have shown promise in improving function. However, the translation of these exercise paradigms to real-world rehabilitation settings, with less structure and supervision, has been poor [
4,
5].
Among the potential mechanisms for poor translation of exercise research into clinical rehabilitation settings, is the poor alignment of insurance payment paradigms in the United States with care needs for frail older adults. Rehabilitation in a hospital, skilled nursing facility, or inpatient rehabilitation facility is often delivered over a short length of time (generally, <20 days), which might not be enough to address the long-standing deficits related to frailty [
6]. Similarly, home-based rehabilitation is generally delivered in short care episodes (30–60 days) and can only be provided under Medicare benefits for older adults if a patient is homebound. In outpatient rehabilitation models, frail older adults often must travel to a clinic before participating in restorative treatments, a daunting challenge experienced by patients for whom walking even short distances is exhausting. Lastly, explicit Medicare or other payer policies such as payment caps or cost-sharing related to rehabilitation service use [
7] may disproportionately affect frail older adults who typically require a high volume of therapy delivered over a longer period of time to realize meaningful functional gains [
5]. Yet, there is a paucity of literature looking at patient-centered rehabilitation outcomes for frail older adults and even less exploring the adequacy of insurance coverage for rehabilitation. Understanding the impact of frailty on rehabilitation patient-centered outcomes, and the adequacy of rehabilitation coverage for frail older adults may inform important changes in payment and practice.
Thus, the purpose of this study is to evaluate the impact of frailty on patient-reported rehabilitation outcomes among older adults, and secondarily assess whether frail older adults are more likely to exhaust their insurance rehabilitation benefits during an episode of care. To answer these important questions, we leveraged the National Health and Aging Trends Study (NHATS), a nationally representative sample of Medicare beneficiaries aged 65 and older in the United States. Our hypothesis was that frail older adults would be more likely to report poor rehabilitation outcomes and have a greater likelihood of exhausting insurance benefits.
2. Methods
This cohort study used data from the 5th wave (Round 5) of the NHATS survey. The details of this complex, nationally representative survey of older adults in the United States have been published elsewhere [
8]. Briefly, the NHATS cohort was drawn from the records of US older adults in Medicare enrollment files in 2011 and replenished in 2015 (Round 5) to maintain nationally representative estimates of late-life disability among older adults, with oversampling of those who identified as non-Hispanic Black or who were older than 85. Annual in-person interviews were conducted with participants, collecting data on important domains such as physical function, social functioning, socioeconomic status, and health conditions. During Round 5, questions on rehabilitation utilization, goals, and outcomes were added to the survey battery for the first time. The Johns Hopkins University Institutional Review Board (IRB) approved the NHATS protocol, and all participants provided informed consent. The use of publicly available NHATS data for this analysis is considered exempt, non-human subjects research by the University of Maryland Institutional Review Board.
2.1. Identification of Rehabilitation Participants and Outcomes
During the Round 5 annual interview, participants were asked: “In the last year, have you received any rehabilitation services?” Participants who responded affirmatively were coded as rehabilitation participants for our analysis. We additionally identified the setting in which rehabilitation was received (inpatient, home-based, or outpatient), whether rehabilitation was being received after surgery, what was the main medical condition for which rehabilitation was received, and what patient-identified concerns were they hoping to address.
2.2. Identification of Frailty
Frailty among rehabilitation participants was identified using a modified Fried frailty score (0 to 5 scale with key domains of exhaustion, low physical activity, weakness, slowness, and shrinking) developed in NHATS data by Bandeen-Roche and colleagues [
1]. Participants were considered frail if they met three or more of the criteria for frailty, and non-frail if they had two or fewer.
2.3. Rehabilitation Outcomes
Using self-reported data from the rehabilitation module of the NHATS survey, we captured whether the patients met all or most of their goals when rehabilitation services ended (yes/no), whether their functioning or ability improved while receiving rehabilitation as compared to worsened function or unchanged (categorized as improved/not improved), and whether they had met the limits of their insurance coverage when rehabilitation services ended (yes/no). Participants who refused to answer or responded that they did not know the answer to the questions were categorized as missing (goals:
n = 3; functioning:
n = 4, and insurance
n = 158). The text of the questions is provided in the
Appendix A Table A1.
2.4. Demographic Characteristics
To characterize the sample of rehabilitation users, we extracted age, sex, self-reported race (for descriptive purposes), chronic health conditions, dementia status (possible or probable as defined by prior NHATS work), history of falls, hospitalizations in the last year, and whether the participant was in a marriage or partnership. We also included an assessment of food insecurity using a previously validated measure to assess the difference in nutritional status among frail and non-frail rehabilitation users [
9].
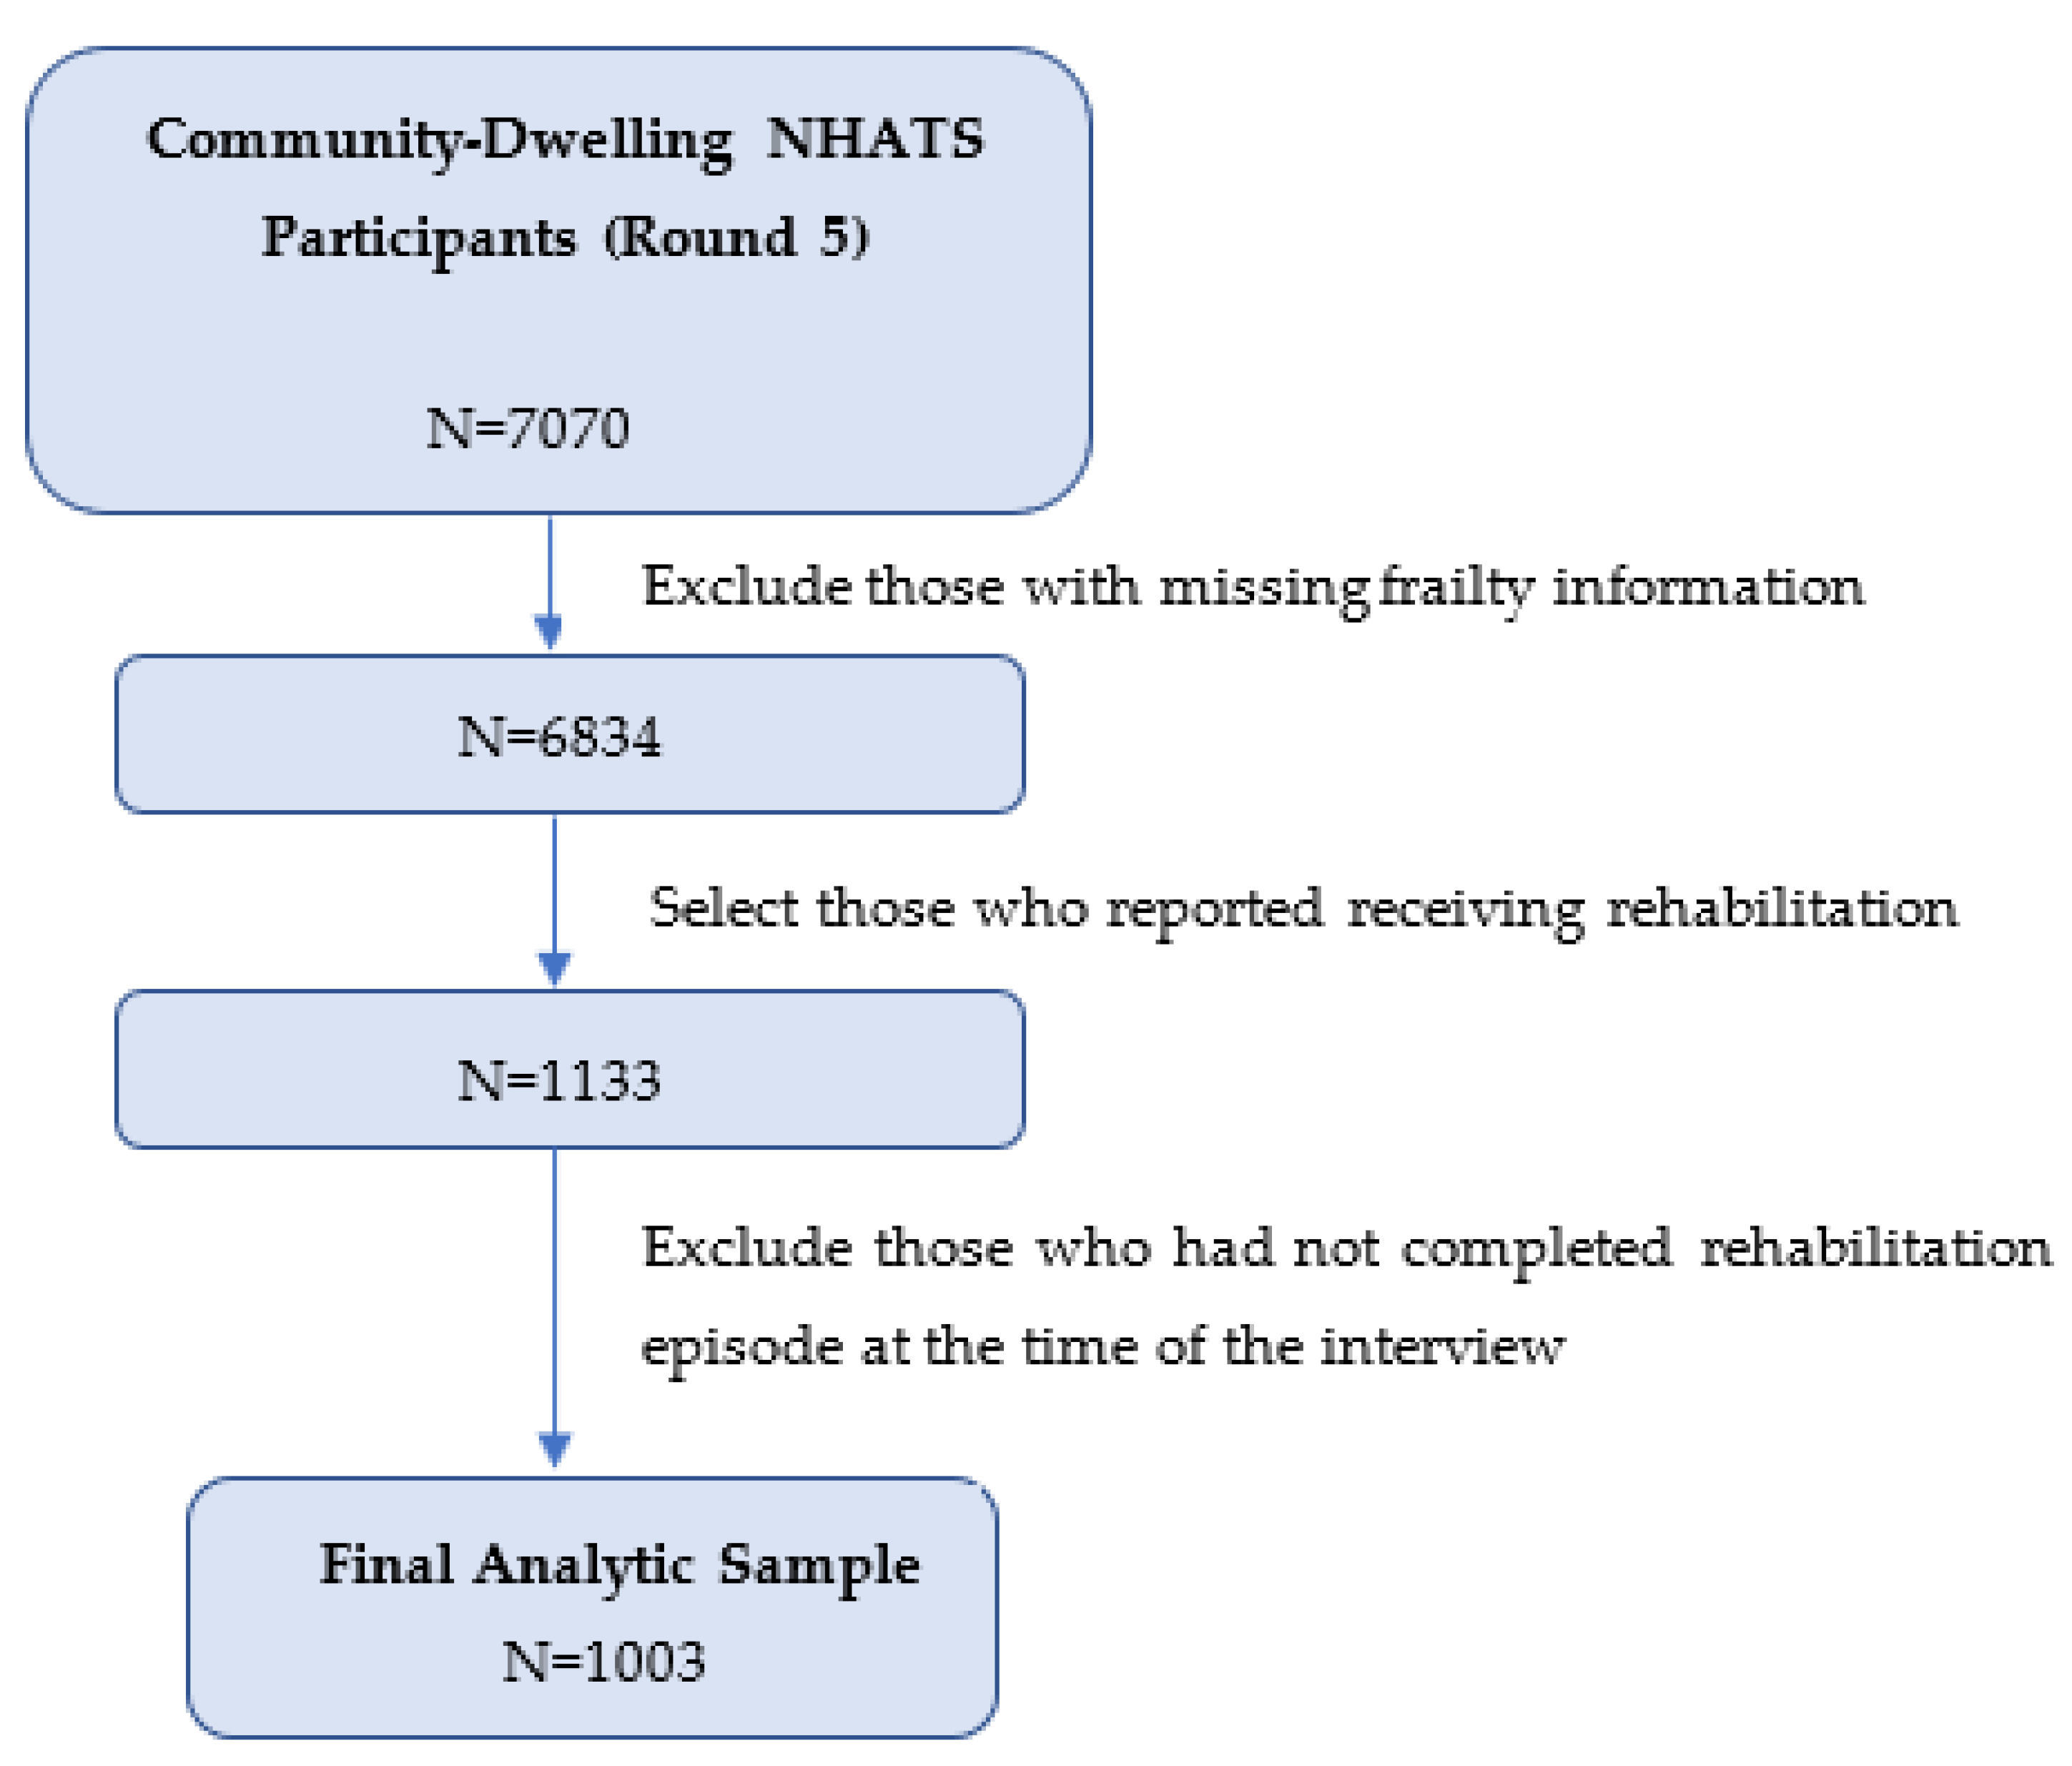
2.5. Selection of the Analytic Sample
In round 5, we included only those participants in NHATS who were community-dwelling (
n = 7070), excluding those living in nursing homes or other institutional settings. We then excluded a small number (
n = 236) of participants with missing frailty data that precluded accurate classification (e.g., those with missing data for >3/5 frailty criteria). Our final analytic sample consisted of the 1003 older adults who had completed an episode of rehabilitation care in the year prior to the NHATS interview (
Figure A1).
2.6. Statistical Approach
Unweighted demographic and clinical characteristics of the population were recorded, as well as characteristics of rehabilitation episodes stratified by participant frailty status. Accounting for the strata and clustering of the NHATS survey and applying analytic weights that help adjust for differential non-response, we then generated a nationally representative estimate of frailty among rehabilitation users in the United States.
Next, we modeled the association between frailty and our three rehabilitation outcomes (goals not met, function not improved, and insurance benefits exhausted) using multivariable logistic regression. Multivariable models were adjusted for age, sex, surgical history, dementia classification, a count of activities of daily living for which a person need help from another person, and the presence of any of the following chronic health conditions: prior myocardial infarction, heart disease, hypertension, arthritis, osteoporosis, diabetes mellitus, and lung disease. The resultant adjusted odds ratios (aOR) and 95% confidence intervals (CI) represent the relative odds of frail rehabilitation participants experiencing the outcome as compared to a non-frail participant.
To account for the complex survey design, all multivariable models included analytic weights, strata, and clustering parameters specific to the 2015 NHATS cohort. In all cases, statistical significance was defined as a two-sided p-value < 0.05; because this study was exploratory, we did not adjust for multiple tests. Data analysis was conducted from November 2021 through April 2022. All analyses were performed in SAS 9.4 (SAS Institute, Cary, NC, USA).
3. Results
The primary analysis included 1003 rehabilitation episodes, representing an estimated 5,577,972 survey-weighted older adults in the United States (95% CI 5,152,434 to 6,003,510). Of those, 292 were classified as frail (estimated 1, 271,290 older adults, 95% CI 921,758 to 1,620,822; weighted percentage of rehabilitation users: 22.8%).
Relative to non-frail participants in our sample, frail rehabilitation participants were older, more likely to be female sex, had greater comorbidity burden, and higher prevalence of dementia (
Table 1). Food insecurity was also notably higher among the frail rehabilitation users (
n = 47/289, 16.3%) as compared to non-frail (
n = 37/698, 5.3%). Lastly, frail patients more commonly received rehabilitation in inpatient settings or home settings versus outpatient settings as compared to non-frail rehabilitation participants (
Table 1). Additional descriptive analyses suggest the tasks older rehabilitation users wanted to improve differed between frail and non-frail participants. Frail older adults were more likely to seek improvements in ADLs and other basic mobility tasks such as walking inside as compared to higher-level activities such as working (
Appendix A Table A2,
Table A3 and
Table A4).
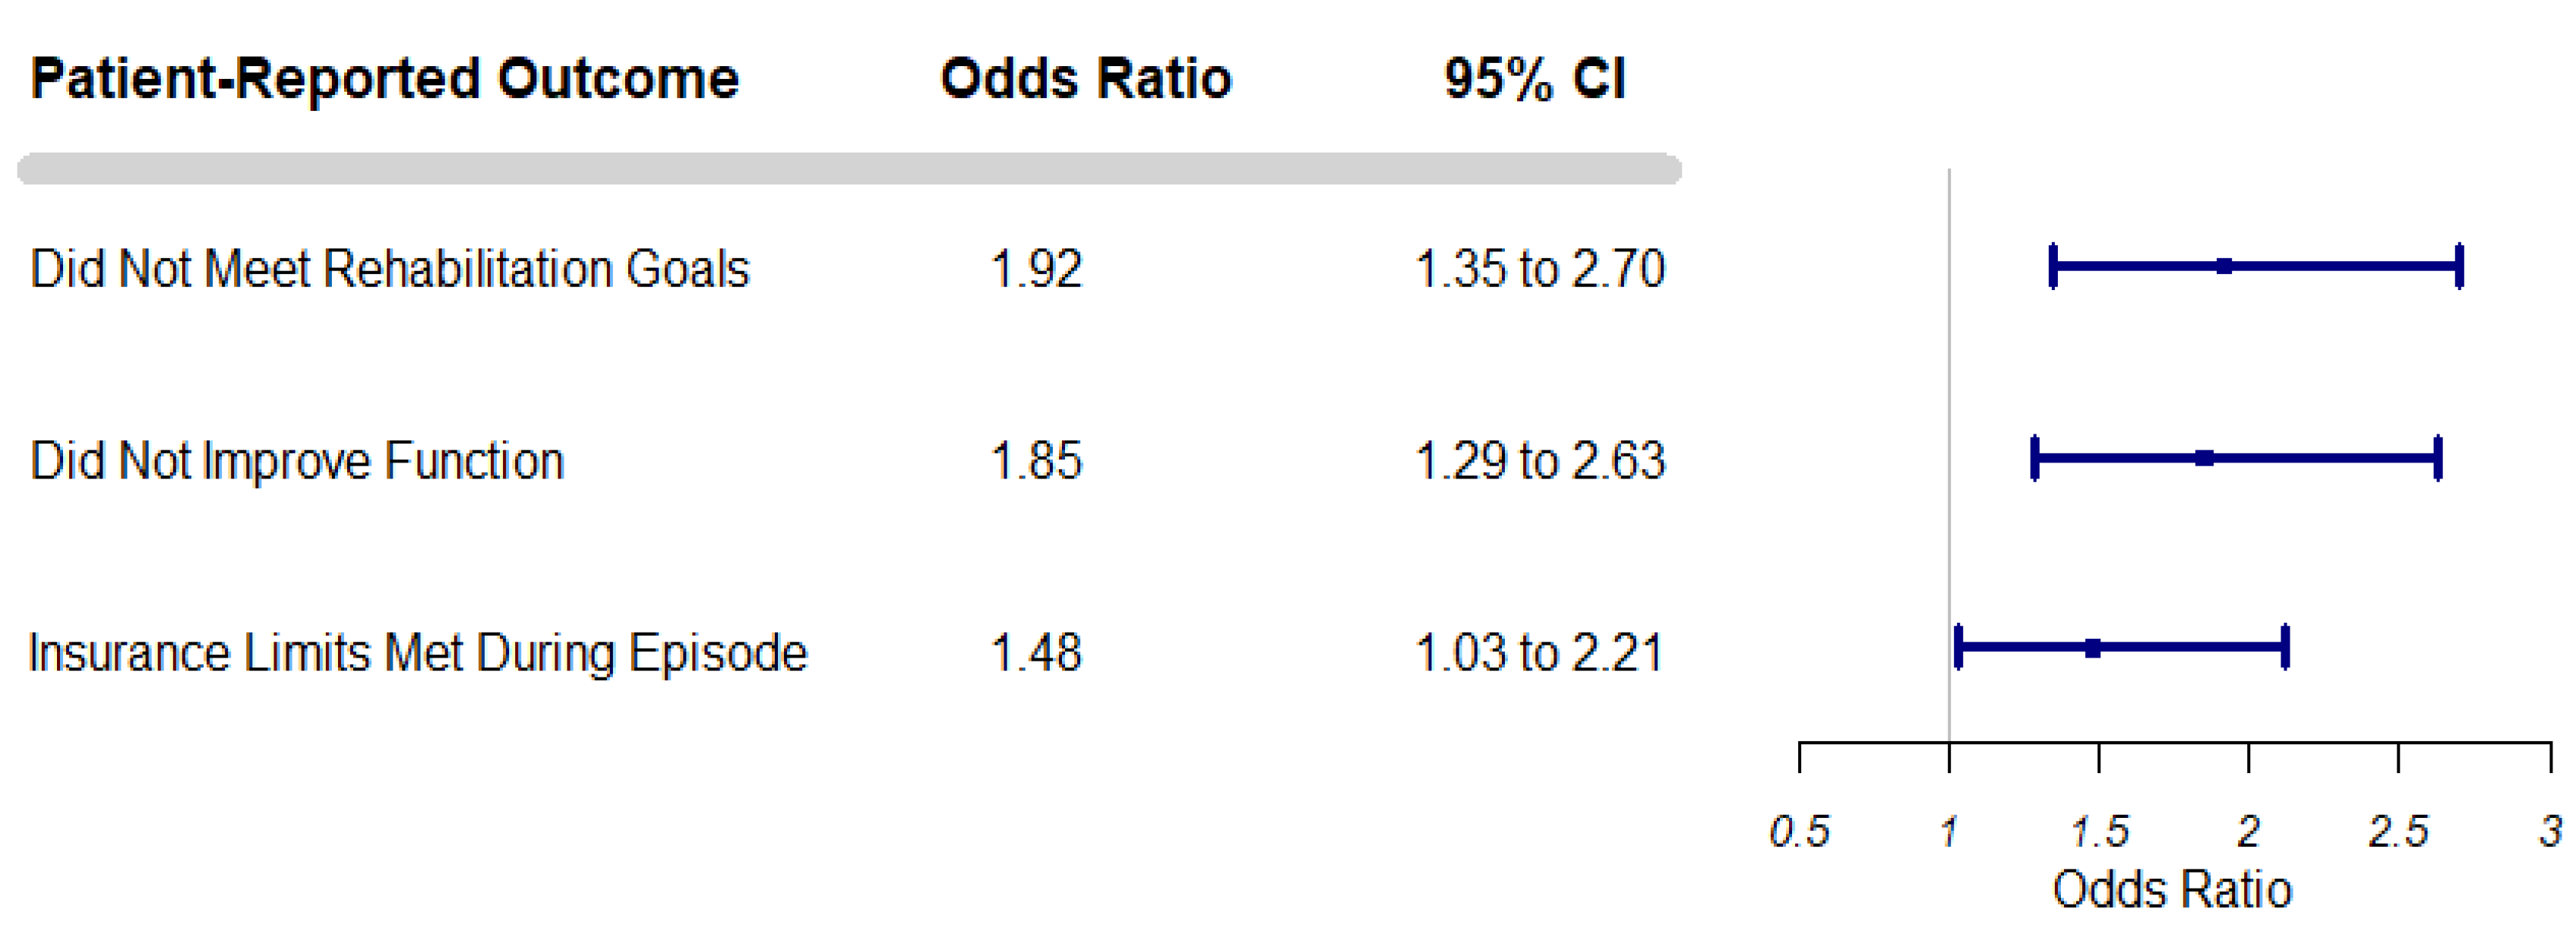
Rehabilitation outcomes differed across frail and non-frail older adults. Frail older adults were more likely to report they did not meet rehabilitation goals compared to non-frail older adults, more likely to report that they did not make improvements in function and were more likely to report that they exhausted their insurance benefits by the time therapy ended (
Table 2)—these outcome disparities persisted in adjusted models (
Figure 1).
4. Discussion
In this nationally representative study of older rehabilitation users, we observed that frailty was associated with poorer outcomes, a lower probability of meeting even modest rehabilitation goals and a greater likelihood of exhausting rehabilitation insurance benefits. These disparities persisted after adjustment for other geriatric vulnerabilities and medical complexity. This is concerning given our data also suggests nearly 1 in 4 older adults seeking rehabilitation in the US healthcare system are frail, with substantial increases in the prevalence of frailty for those over 80 years of age. These findings are novel and have significant implications for several ongoing payment reforms and the design of insurance benefits related to rehabilitation.
Prior work evaluating functional outcomes after disabling hospitalizations shows that frailty is associated with a poorer recovery in activities of daily living (ADLs) and instrumental ADLs (IADLs) [
10,
11]. A common limitation of these studies is a lack of information on restorative care—our study suggests one potential reason why frail older adults have poorer functional recovery is the exhaustion of rehabilitation insurance benefits before functional goals were reached. Additionally, there are several plausible biological mechanisms for why frail older adults may not respond as robustly to rehabilitation care that could be explored in future studies. First, food insecurity was notably more common among frail older rehabilitation users in our study—important because this may represent a proxy of poor dietary quality, which is associated with a loss of muscle mass and strength [
12]. Routine assessment of food insecurity, dietary intake, and frailty are likely not occurring across all rehabilitation settings—a potentially modifiable factor to improve rehabilitation outcomes [
13]. Specifically, frail older adults who have poor protein intake or low dietary quality may not be able to respond as robustly to rehabilitation [
13,
14].
Exercise is considered a first-line treatment for the management of frailty, and at least one study has shown multicomponent exercise programs undertaken over a period of 24 weeks have generally shown to be most effective at addressing functional impairments [
15]. Yet, typical rehabilitation in the United States is delivered over much shorter periods and at lower intensities than shown in clinical trials, which may leave older adults with unaddressed vulnerability to disability and costly nursing home admissions. Ensuring older adults have access to rehabilitation delivered at the appropriate dose—intensity, frequency, and duration—is thus paramount in optimal frailty management and may require a re-evaluation of the intensity and duration of contemporary rehabilitation programs. The need to restructure care is especially acute for the oldest-old in the United States, a growing subgroup in the United States that is increasingly vulnerable to becoming homebound or requiring care in a nursing home.
Rehabilitation services could play a vital role in promoting high-quality aging in place among frail older adults. Unfortunately, our findings suggest current payer policies related to rehabilitation may be inadequate for the frail population. First, several Medicare policies cap receipt of outpatient rehabilitation services through the use of somewhat arbitrary cost thresholds—thresholds that Medicare explicitly indicates should be exceeded sparingly in billing guidance [
7]. Another example is extended stays in skilled nursing facilities, which require cost sharing by patients after 20 days—thereby disadvantaging frail patients who may have prolonged courses of recovery and could result in premature discharge prior to goals being met. Third, Medicare Advantage payers often cover rehabilitation services but 1 in 3 plans require pre-authorizations or restrict visit counts which could delay or deter frail older adults from receiving high-quality care [
16]. Additionally, frail older adults in our study were more than threefold as likely to report Medicaid coverage, which typically is only available to those living below the poverty line. This suggests unique intersectional vulnerabilities between age, poverty, and frailty that may need to be addressed in future payment reforms. These reforms go beyond simply extending therapy coverage, but also expanding access to other benefits, such as nutritional supports, that may support better responses to tailored rehabilitation interventions.
Our study has several key strengths and some limitations that need to be acknowledged. Major strengths include the use of a large nationally representative dataset capturing both a well-validated frailty phenotype and several important domains of rehabilitation use and outcomes for community-dwelling older adults. Our study was limited by an inability to determine which rehabilitation service was predominantly provided (physical, occupational, or speech therapy)—it is unclear whether frail older adults are receiving services from those disciplines in different ways. We also did not know the specific diagnoses for which PT was sought. Our study was also cross-sectional, which did not allow us to evaluate causal or temporal relationships between frailty and the observed vulnerabilities—later studies may help better untangle the mechanisms contributing to frailty among this population to better guide rehabilitation interventions.
5. Conclusions
Rehabilitation therapy is a critical service for older adults in the United States and may be particularly important for those with frailty—who are more likely to be over 80 years of age, socioeconomically disadvantaged, and experiencing food insecurity as compared to their peers. Frail older adults have poorer outcomes when receiving rehabilitation care and are more likely to report stopping therapy after exhausting insurance benefits. Exercise is a well-supported intervention for the management of frailty, but our results suggest that frail older adults may not be getting the volume or intensity of rehabilitation treatment needed to maximally improve outcomes—in part due to limited payer coverage of rehabilitation services in the United States. Both changes in clinical processes and payer policies are likely needed to mitigate frailty-related outcome disparities for older rehabilitation users.
Author Contributions
Conceptualization, all authors; methodology, J.R.F.; formal analysis, J.R.F. investigation, J.R.F. and O.A.; resources, O.A., E.A.P. and J.R.F.; data curation, J.R.F.; writing—original draft preparation, J.R.F. and J.Z.Y.; writing—review and editing, O.A., B.A.B. and E.A.P.; visualization, J.R.F.; supervision, B.A.B. and O.A.; project administration, J.R.F.; funding acquisition, J.R.F., O.A. and E.A.P. All authors have read and agreed to the published version of the manuscript.
Funding
Falvey was supported during the work by a career development award from the National Institute on Aging and a Scholar Career Development Award from the Maryland Claude D. Pepper Center (grant numbers K76AG074926 and P30AG028747). Parker was supported during the work by a Career Development Award from the American Heart Association (E.A.P., 19CDA34660015/Elizabeth Parker/2019) and salary support from the Baltimore Veterans Affairs Medical Center Geriatric Research, Education, and Clinical Center (GRECC). Partial funding for open access was also provided by the University of Maryland Health Sciences and Human Services Library’s Open Access Fund.
Institutional Review Board Statement
Not applicable.
Informed Consent Statement
Not applicable.
Data Availability Statement
Data from National Health and Aging Trends Study (NHATS) is sponsored by the National Institute on Aging (grant number NIA U01AG32947) and was conducted by the Johns Hopkins University. This data is publicly available at
https://nhats.org/researcher. Accessed 25 September 2021.
Conflicts of Interest
The authors declare no conflict of interest. Each author certifies that he or she has no commercial associations (e.g., consultancies, stock ownership, equity interest, patent/licensing arrangements, etc.) that might pose a conflict of interest in connection with the submitted article.
Appendix A
Table A1.
Rehabilitation Outcomes Assessed in the National Health and Aging Trends Study (NHATS), United States, 2015.
Table A1.
Rehabilitation Outcomes Assessed in the National Health and Aging Trends Study (NHATS), United States, 2015.
| Problems | |
|---|
| Goal Attainment | When your rehab services ended, had you met all or most of your goals? |
| Functional Improvement | While you were receiving rehab services in the last year, did your functioning and ability to do activities improve, get worse, or stay about the same? |
| Insurance Exhaustion | When your rehab services ended, had you met the limit of your insurance coverage? |
Table A2.
Reasons for Seeking Rehabilitation Services by Frailty Status Using the National Health and Aging Trends Study (NHATS), United States, 2015: Problems.
Table A2.
Reasons for Seeking Rehabilitation Services by Frailty Status Using the National Health and Aging Trends Study (NHATS), United States, 2015: Problems.
| Problems | NHATS Total
(n = 1003) | Frail
(n = 292) | Non-Frail
(n = 711) |
|---|
| Improve strength, n (%) | 551 (54.9) | 187 (64.0) | 364 (51.2) |
| Improve movement/range of motion, n (%) | 597 (59.5) | 175 (59.9) | 422 (59.4) |
| Improve pain level, n (%) | 346 (34.5) | 89 (30.5) | 257 (36.2) |
| Improve balance/coordination, n (%) | 351 (35.0) | 135 (46.2) | 216 (30.4) |
| Improve problems with falls, n (%) | 132 (13.2) | 64 (21.9) | 68 (51.5) |
Table A3.
Reasons for Seeking Rehabilitation Services by Frailty Status Using the National Health and Aging Trends Study (NHATS), United States, 2015: Mobility.
Table A3.
Reasons for Seeking Rehabilitation Services by Frailty Status Using the National Health and Aging Trends Study (NHATS), United States, 2015: Mobility.
| Mobility | NHATS Total
(n = 1003) | Frail
(n = 292) | Non-Frail
(n = 711) |
|---|
| Improve walking inside home, n (%) | 430 (42.9) | 170 (58.2) | 260 (36.6) |
| Improve walking distance outside, n (%) | 442 (44.1) | 114 (39.0) | 328 (46.1) |
| Improve climbing stairs, n (%) | 309 (30.8) | 94 (32.2) | 215 (30.2) |
| Improve leaving home outside, n (%) | 271 (27.0) | 97 (33.2) | 174 (24.5) |
| Improve getting out of bed, n (%) | 192 (19.1) | 77 (26.4) | 115 (16.2) |
Table A4.
Reasons for Seeking Rehabilitation Services by Frailty Status Using the National Health and Aging Trends Study (NHATS), United States, 2015: Activities.
Table A4.
Reasons for Seeking Rehabilitation Services by Frailty Status Using the National Health and Aging Trends Study (NHATS), United States, 2015: Activities.
| Activities | NHATS Total
(n = 1003) | Frail
(n = 292) | Non-Frail
(n = 711) |
|---|
| Improve caring for self, n (%) | 409 (40.8) | 164 (56.2) | 245 (34.5) |
| Improve household activities, n (%) | 349 (34.8) | 110 (37.7) | 239 (33.6) |
| Improve working/volunteering, n (%) | 95 (9.5) | 20 (6.9) | 75 (10.6) |
| Improve participating in activities, n (%) | 169 (16.9) | 51 (17.5) | 118 (16.6) |
| Improve providing care, n (%) | 46 (4.6) | 11 (3.8) | 35 (4.9) |
Figure A1.
Selection of the Analytic Sample. Legend: Flow diagram depicting selection of the analytic sample from the National Health and Aging Trends Study, Round 5 data.
Figure A1.
Selection of the Analytic Sample. Legend: Flow diagram depicting selection of the analytic sample from the National Health and Aging Trends Study, Round 5 data.
References
- Bandeen-Roche, K.; Seplaki, C.; Huang, J.; Buta, B.; Kalyani, R.R.; Varadhan, R.; Xue, Q.-L.; Walston, J.D.; Kasper, J.D. Frailty in Older Adults: A Nationally Representative Profile in the United States. J. Gerontol. Ser. A Biol. Sci. Med. Sci. 2015, 70, 1427–1434. [Google Scholar] [CrossRef] [PubMed]
- Kojima, G. Frailty as a Predictor of Nursing Home Placement Among Community-Dwelling Older Adults: A Systematic Review and Meta-analysis. J. Geriatr. Phys. Ther. 2018, 41, 42–48. [Google Scholar] [CrossRef] [PubMed]
- Fried, L.P.; Ferrucci, L.; Darer, J.; Williamson, J.D.; Anderson, G. Untangling the Concepts of Disability, Frailty, and Comorbidity: Implications for Improved Targeting and Care. J. Gerontol. Ser. A Biol. Sci. Med. Sci. 2004, 59, M255–M263. [Google Scholar] [CrossRef] [PubMed]
- Merchant, R.A.; Morley, J.E.; Izquierdo, M. Exercise, Aging and Frailty: Guidelines for Increasing Function. J. Nutr. Health Aging 2021, 25, 405–409. [Google Scholar] [CrossRef] [PubMed]
- Theou, O.; Stathokostas, L.; Roland, K.P.; Jakobi, J.M.; Patterson, C.; Vandervoort, A.A.; Jones, G.R. The Effectiveness of Exercise Interventions for the Management of Frailty: A Systematic Review. J. Aging Res. 2011, 2011, 569194. [Google Scholar] [CrossRef] [PubMed]
- Hartley, P.; Adamson, J.; Cunningham, C.; Embleton, G.; Romero-Ortuno, R. Clinical frailty and functional trajectories in hospitalized older adults: A retrospective observational study. Geriatr. Gerontol. Int. 2017, 17, 1063–1068. [Google Scholar] [CrossRef] [PubMed]
- CMS, Office of Strategic Operations and Regulatory Affairs. Medicare Claims Processing Manual Chapter 5—Part B Outpatient Rehabilitation and CORF/OPT Services 10-Part B Outpatient Rehabilitation and Comprehensive Outpatient Rehabilitation Facility (CORF) Services-General 30-Special Claims Processing Rules for Outpatient Rehabilitation Claims-Form CMS-1500 30.1-Determining Payment Amounts; Centers for Medicare & Medicaid Services (CMS): Baltimore, MD, USA, 2019. [Google Scholar]
- Freedman, V.A.; Kasper, J.D. Cohort Profile: The National Health and Aging Trends Study (NHATS). Int. J. Epidemiol. 2019, 48, 1044–1045g. [Google Scholar] [CrossRef] [PubMed]
- Tucher, E.L.; Keeney, T.; Cohen, A.J.; Thomas, K.S. Conceptualizing Food Insecurity Among Older Adults: Development of a Summary Indicator in the National Health and Aging Trends Study. J. Gerontol. Ser. B Psychol. Sci. Soc. Sci. 2021, 76, 2063–2072. [Google Scholar] [CrossRef] [PubMed]
- Xu, W.; Li, Y.; Hu, Y.; Wu, C. Association of Frailty with recovery from disability among community-dwelling Chinese older adults: China health and retirement longitudinal study. BMC Geriatr. 2020, 20, 119. [Google Scholar] [CrossRef] [PubMed]
- Ferrante, L.E.; Pisani, M.A.; Murphy, T.E.; Gahbauer, E.A.; Leo-Summers, L.S.; Gill, T.M. The Association of Frailty with Post-ICU Disability, Nursing Home Admission, and Mortality: A Longitudinal Study. Chest 2018, 153, 1378–1386. [Google Scholar] [CrossRef] [PubMed]
- Robinson, S.M.; Westbury, L.D.; Cooper, R.; Kuh, D.; Ward, K.; Syddall, H.E.; Sayer, A.A.; Cooper, C. Adult Lifetime Diet Quality and Physical Performance in Older Age: Findings from a British Birth Cohort. J. Gerontol. Ser. A Biol. Sci. Med. Sci. 2018, 73, 1532–1537. [Google Scholar] [CrossRef] [PubMed]
- Hsieh, T.-J.; Su, S.-C.; Chen, C.-W.; Kang, Y.-W.; Hu, M.-H.; Hsu, L.-L.; Wu, S.-Y.; Chen, L.; Chang, H.-Y.; Chuang, S.-Y.; et al. Individualized home-based exercise and nutrition interventions improve frailty in older adults: A randomized controlled trial. Int. J. Behav. Nutr. Phys. Act. 2019, 16, 119. [Google Scholar] [CrossRef] [PubMed]
- Kirwan, R.P.; Mazidi, M.; García, C.R.; Lane, K.E.; Jafari, A.; Butler, T.; de Heredia, F.P.; Davies, I.G. Protein interventions augment the effect of resistance exercise on appendicular lean mass and handgrip strength in older adults: A systematic review and meta-analysis of randomized controlled trials. Am. J. Clin. Nutr. 2022, 115, 897–913. [Google Scholar] [CrossRef] [PubMed]
- Sadjapong, U.; Yodkeeree, S.; Sungkarat, S.; Siviroj, P. Multicomponent Exercise Program Reduces Frailty and Inflammatory Biomarkers and Improves Physical Performance in Community-Dwelling Older Adults: A Randomized Controlled Trial. Int. J. Environ. Res. Public Health 2020, 17, 3760. [Google Scholar] [CrossRef] [PubMed]
- Heyward, J.; Jones, C.M.; Compton, W.M.; Lin, D.H.; Losby, J.L.; Murimi, I.B.; Baldwin, G.T.; Ballreich, J.M.; Thomas, D.A.; Bicket, M.C.; et al. Coverage of Nonpharmacologic Treatments for Low Back Pain among US Public and Private Insurers. JAMA Netw. Open 2018, 1, e183044. [Google Scholar] [CrossRef] [PubMed] [Green Version]
| Publisher’s Note: MDPI stays neutral with regard to jurisdictional claims in published maps and institutional affiliations. |
© 2022 by the authors. Licensee MDPI, Basel, Switzerland. This article is an open access article distributed under the terms and conditions of the Creative Commons Attribution (CC BY) license (https://creativecommons.org/licenses/by/4.0/).

 ,
, 