
The Effect of Rainfall on Aquatic Nitrogen and Phosphorus in a Semi-Humid Area Catchment, Northern China


Abstract
:1. Introduction
2. Method
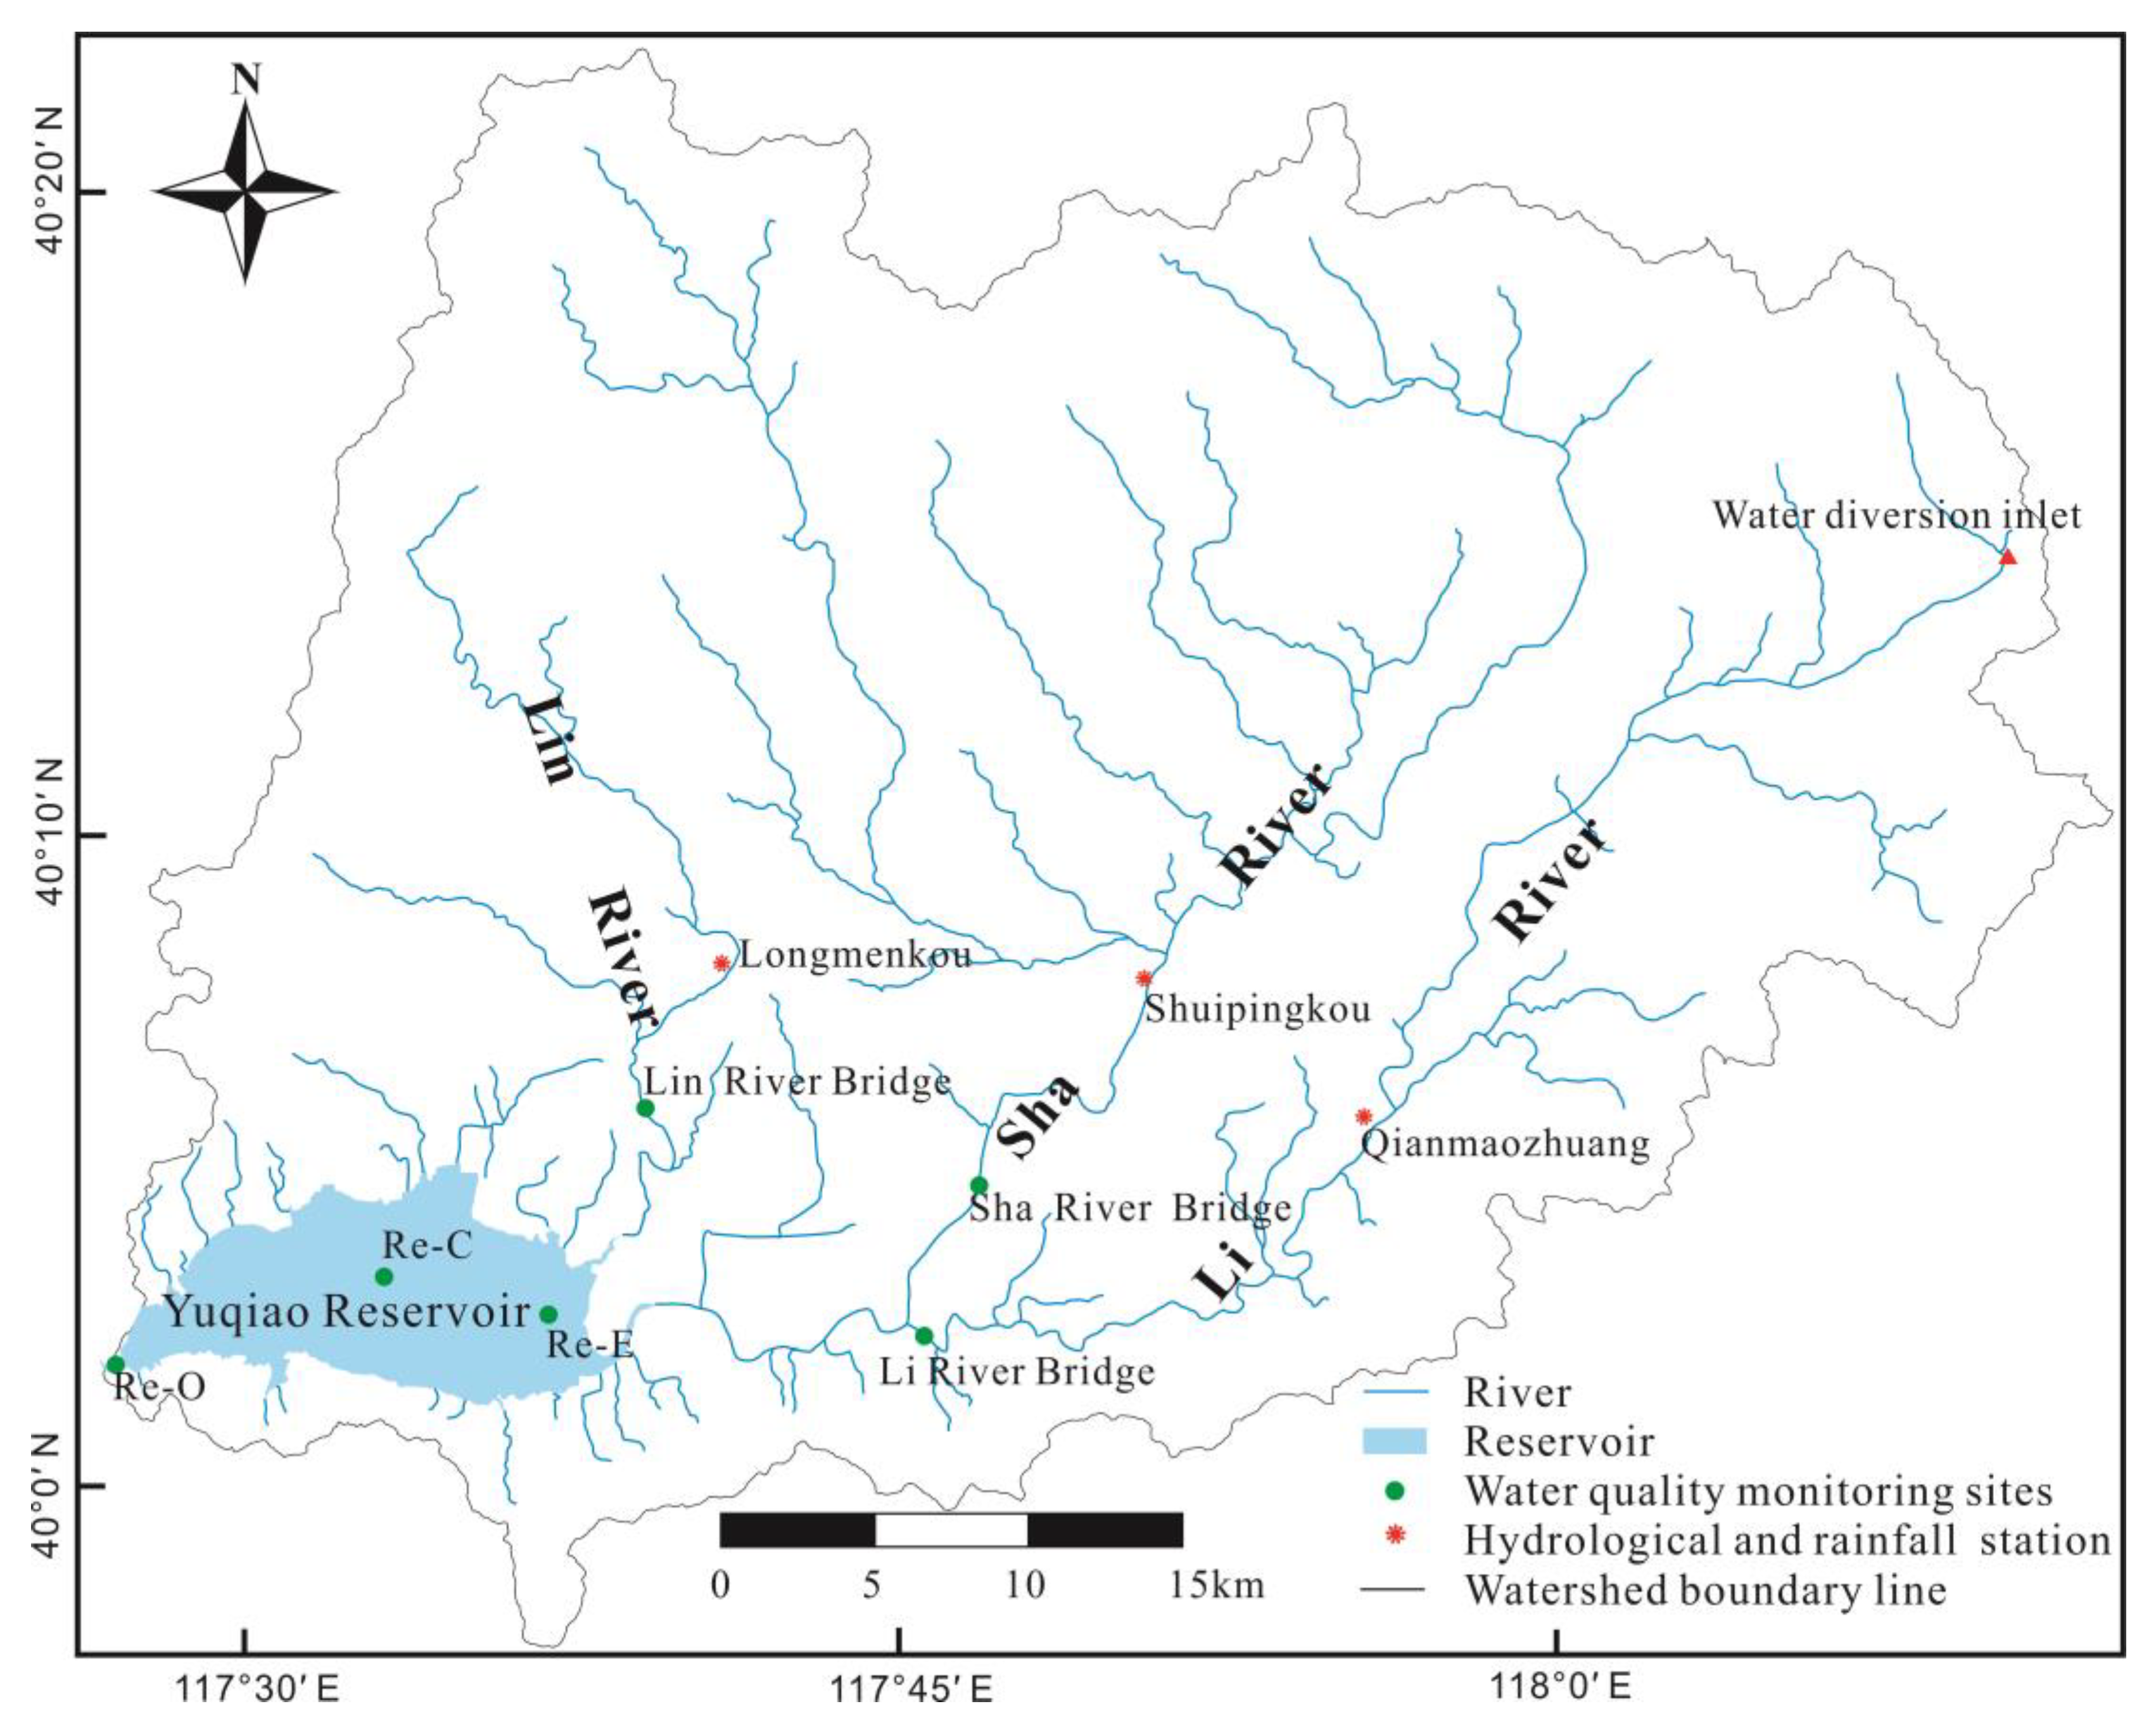
2.1. Study Area
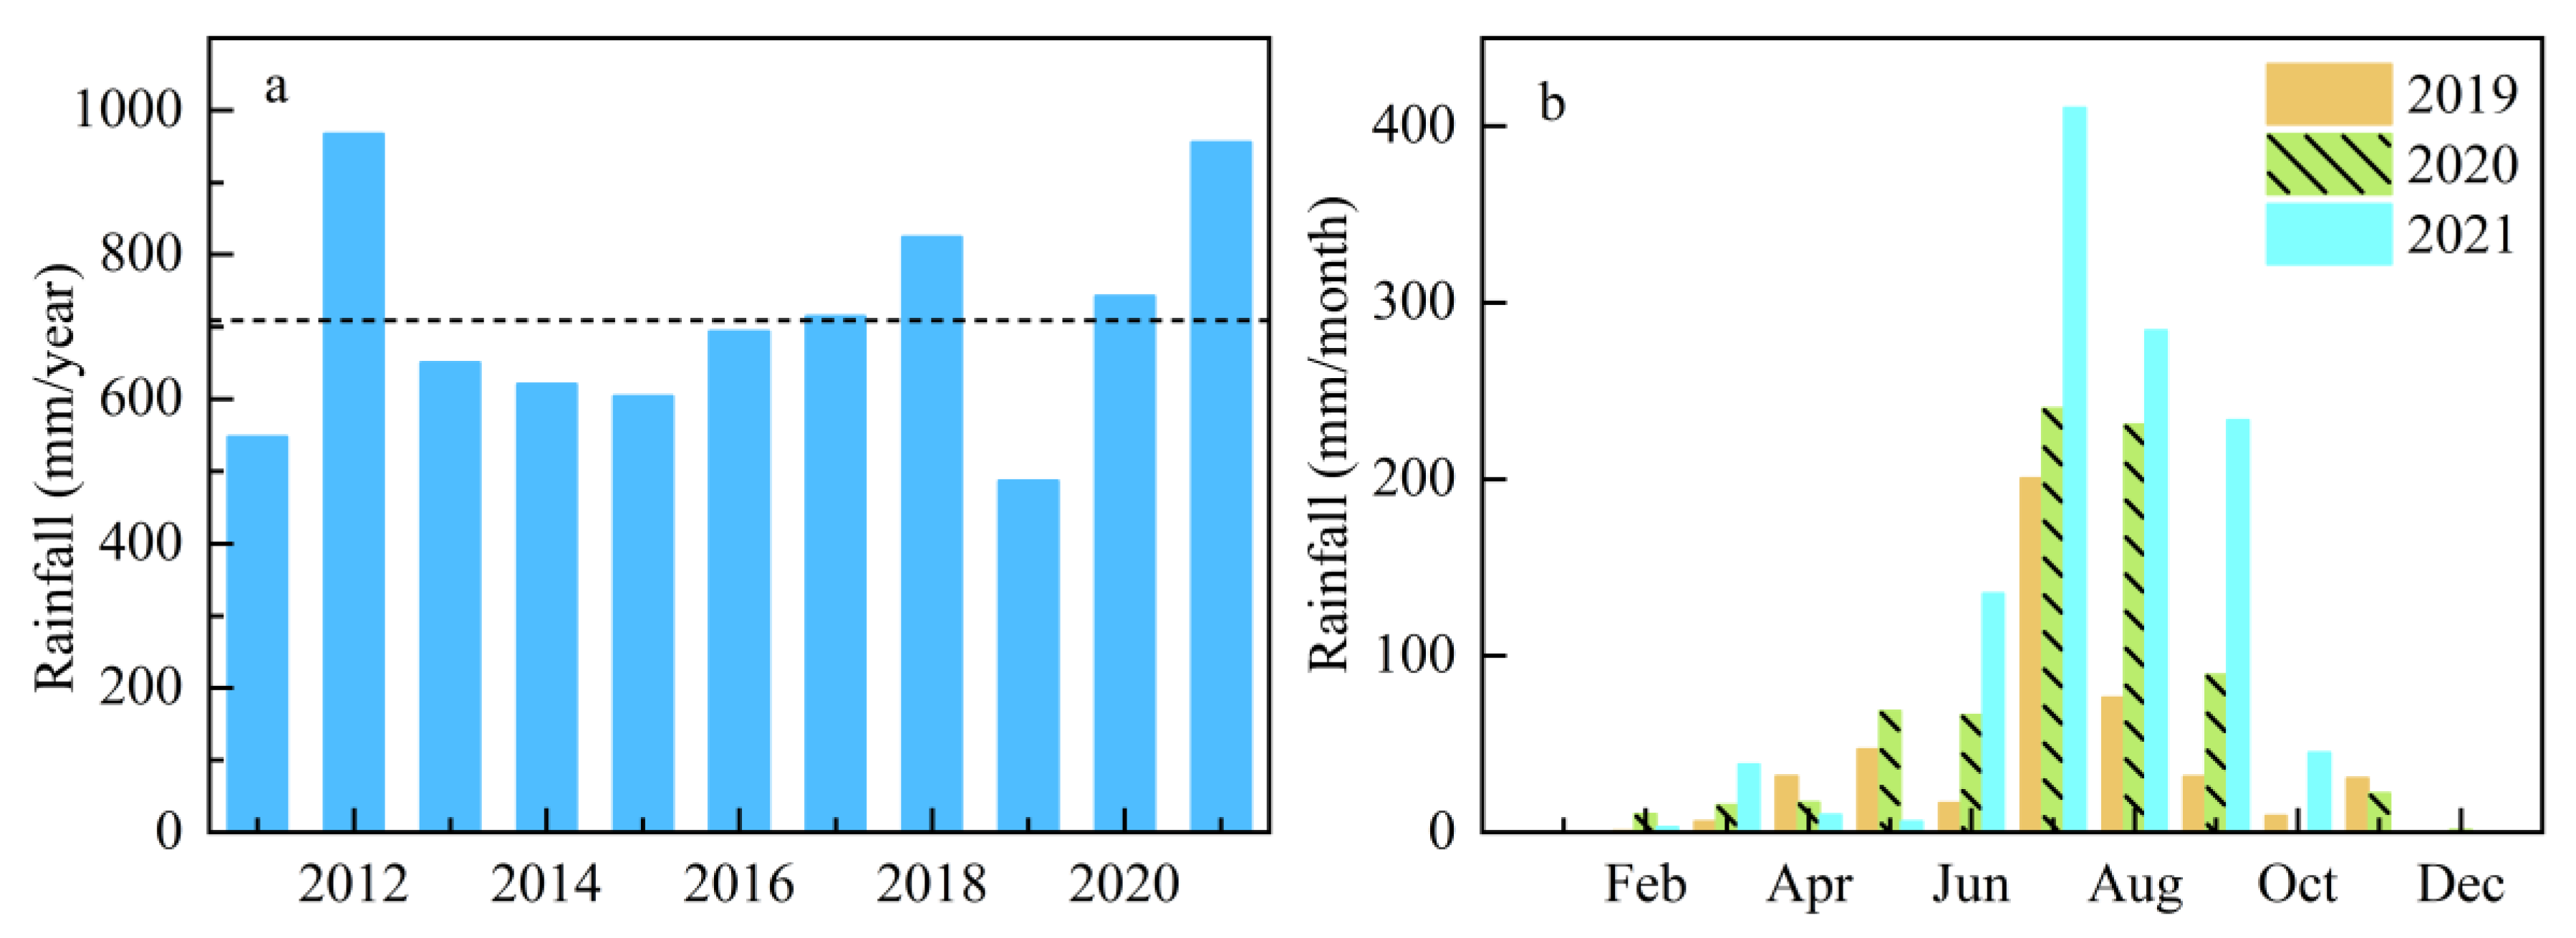
2.2. Rainfall Characteristics of the Study Area
2.3. Data of TN and TP
3. Results
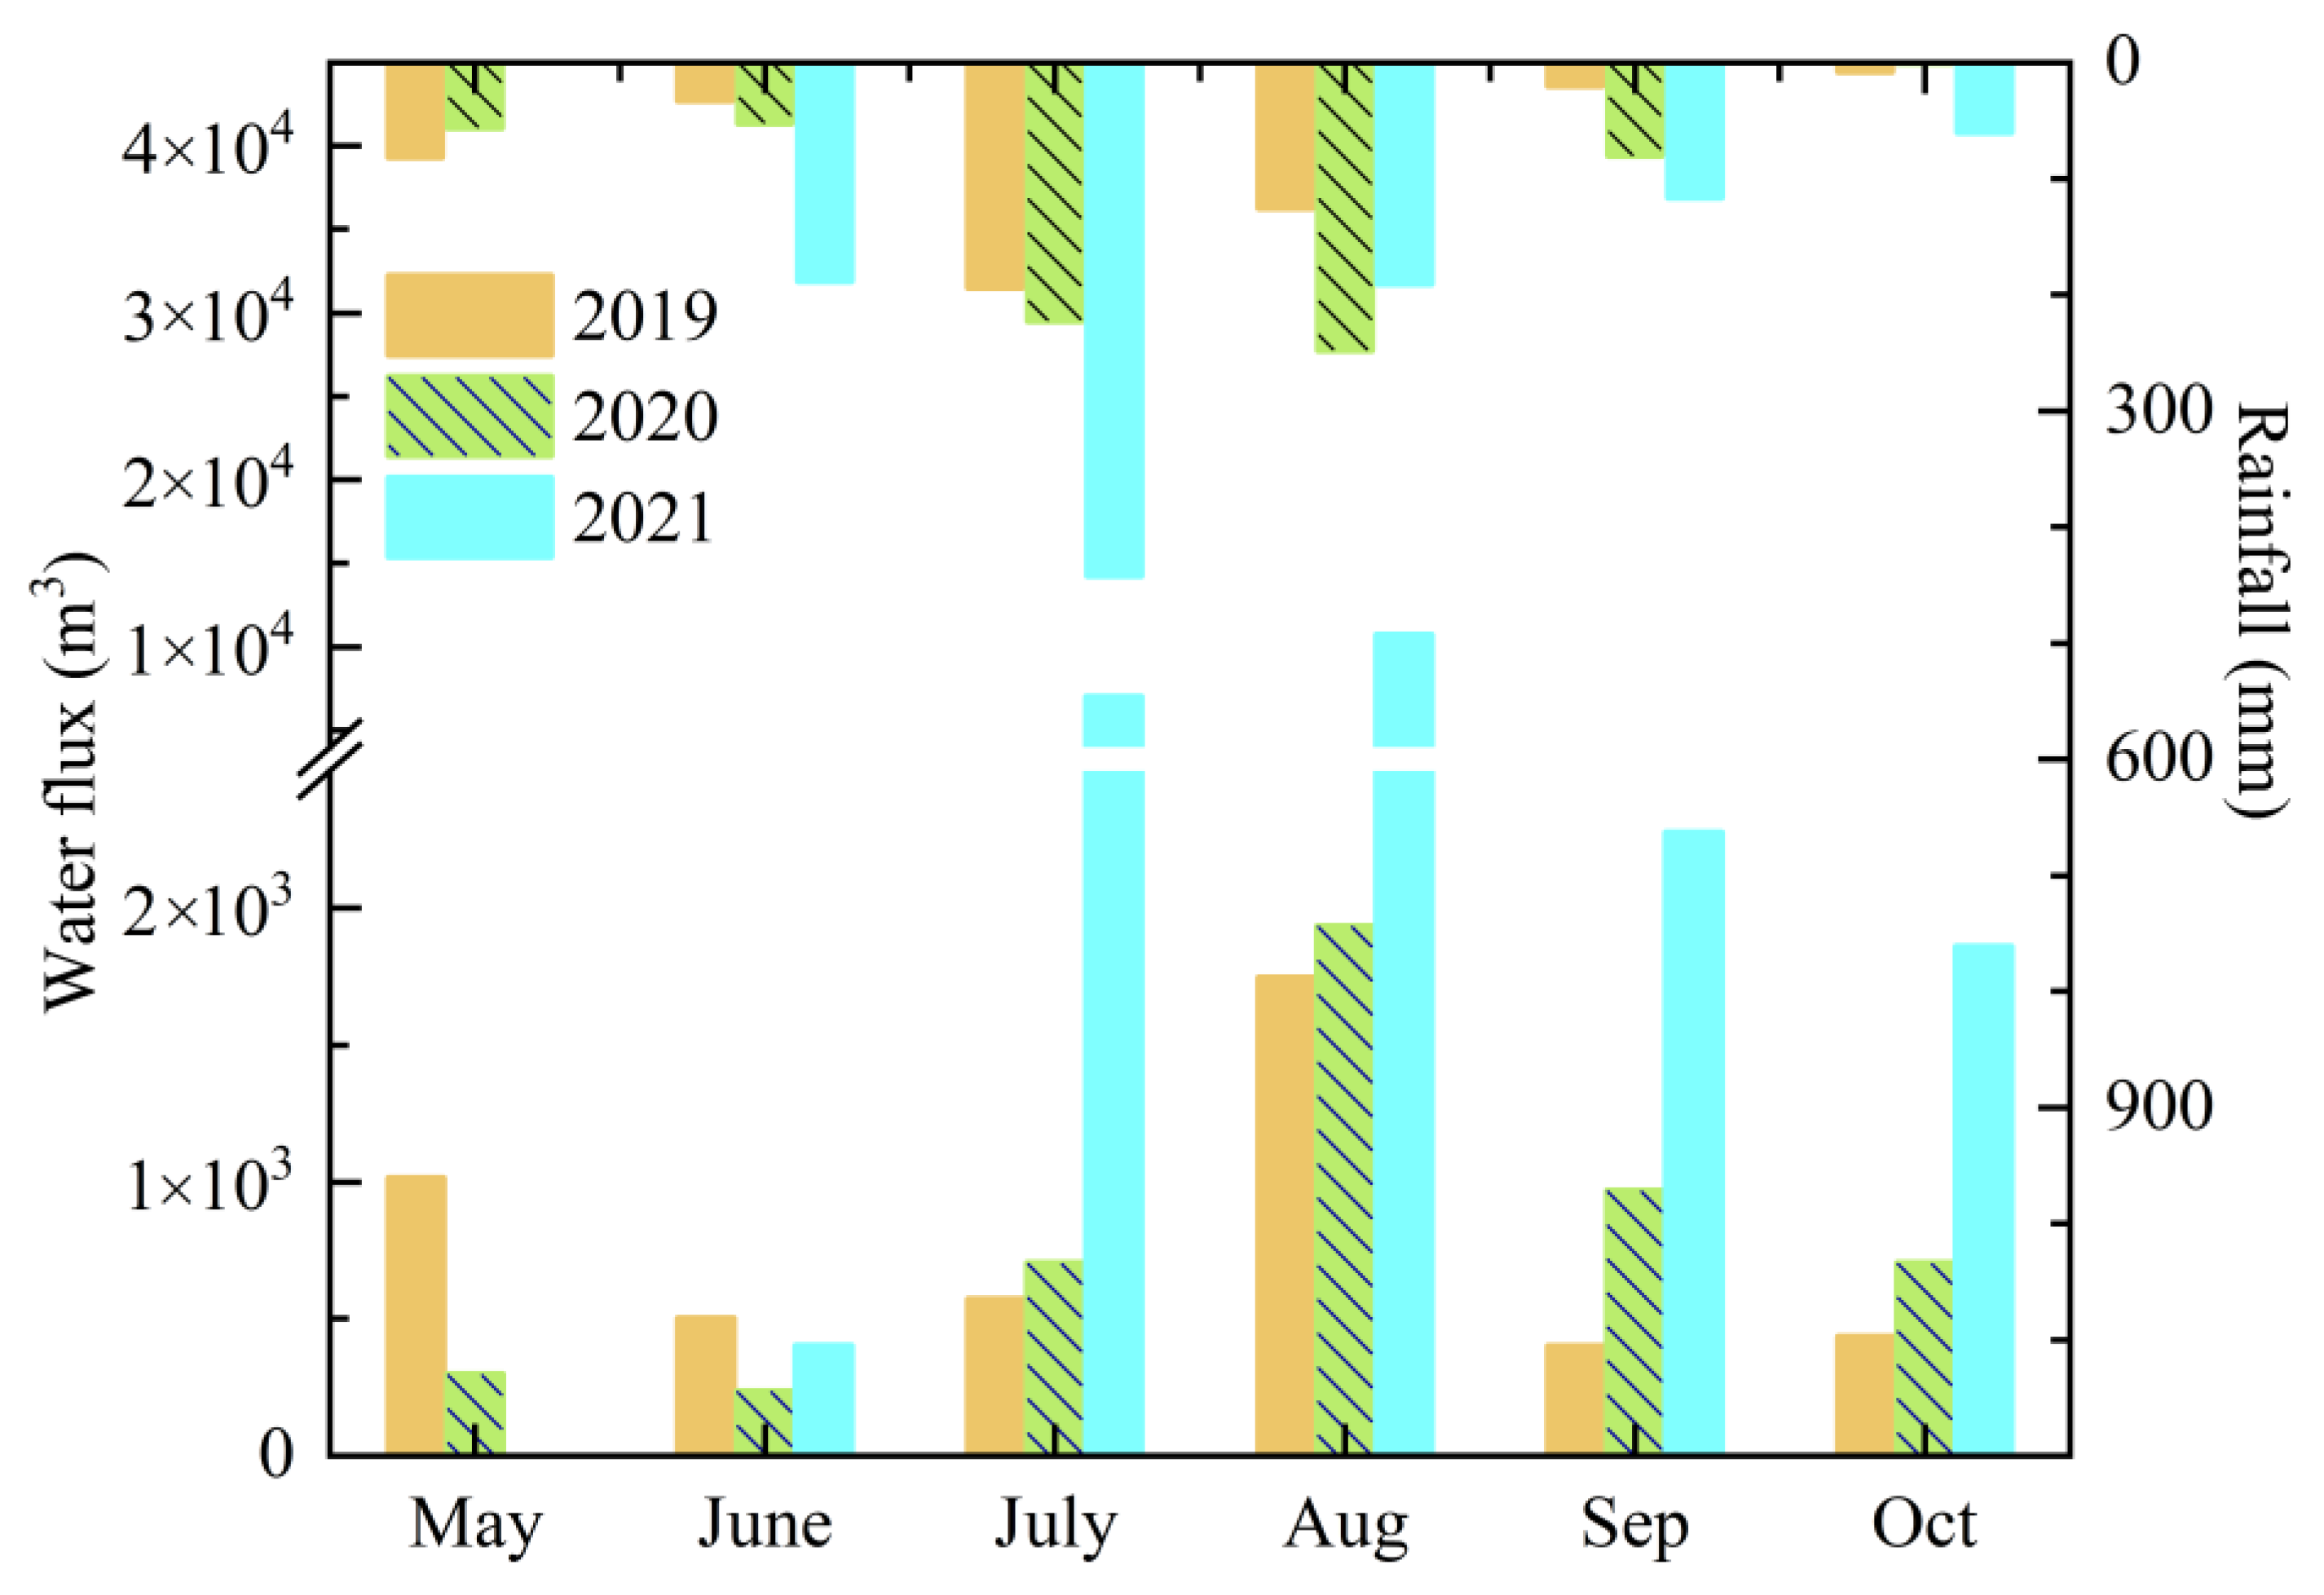
3.1. Rainfall and Hydrology Characteristics
3.2. Variation Characteristics of TN and TP Concentrations in Rivers
3.2.1. Variation Characteristics of TN and TP Concentrations in Natural River
3.2.2. Variation Characteristics of TN and TP Concentrations in Water Diversion River
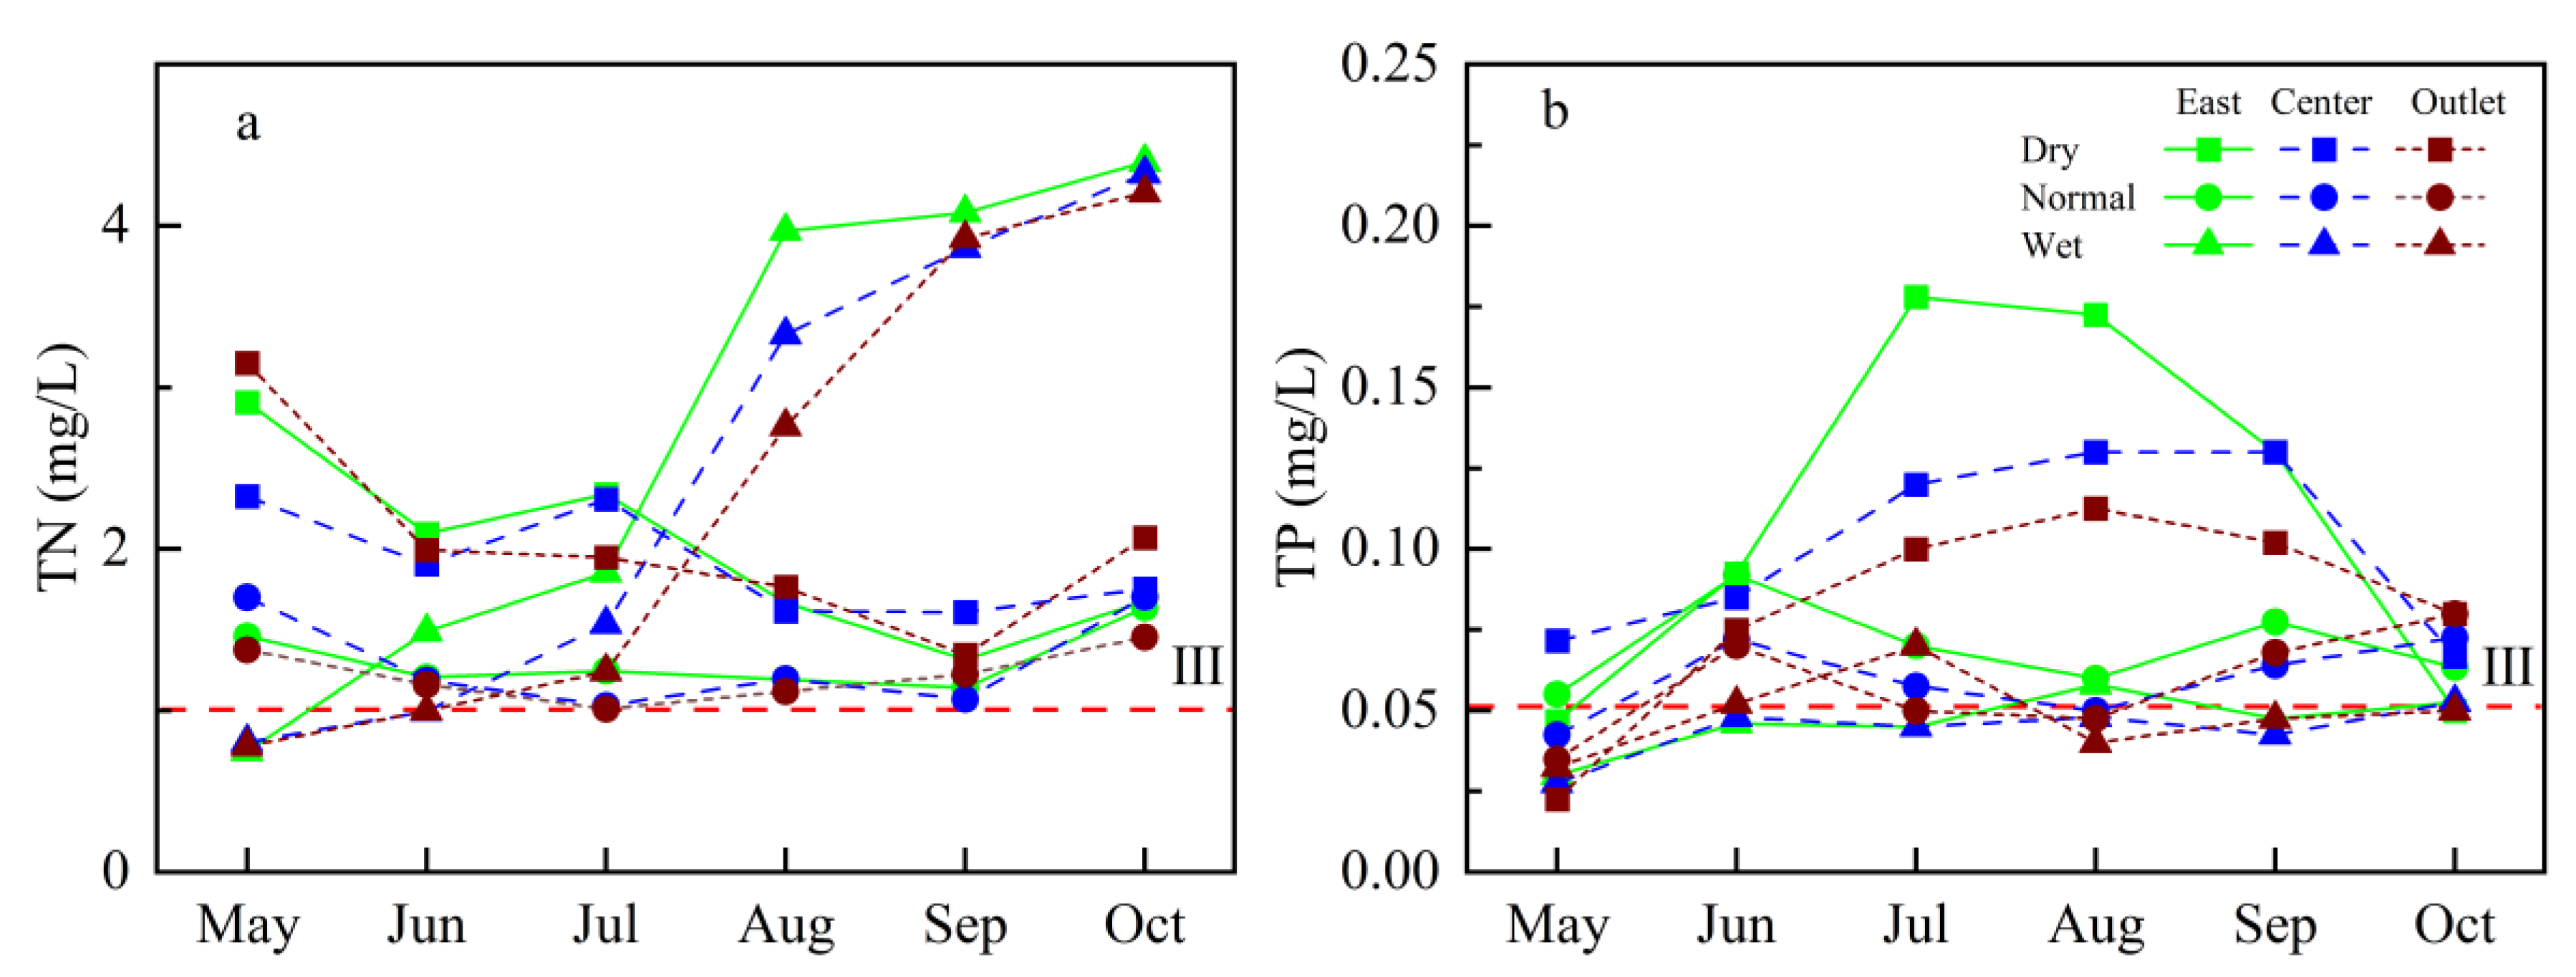
3.3. TN and TP Characteristics of Yuqiao Reservoir
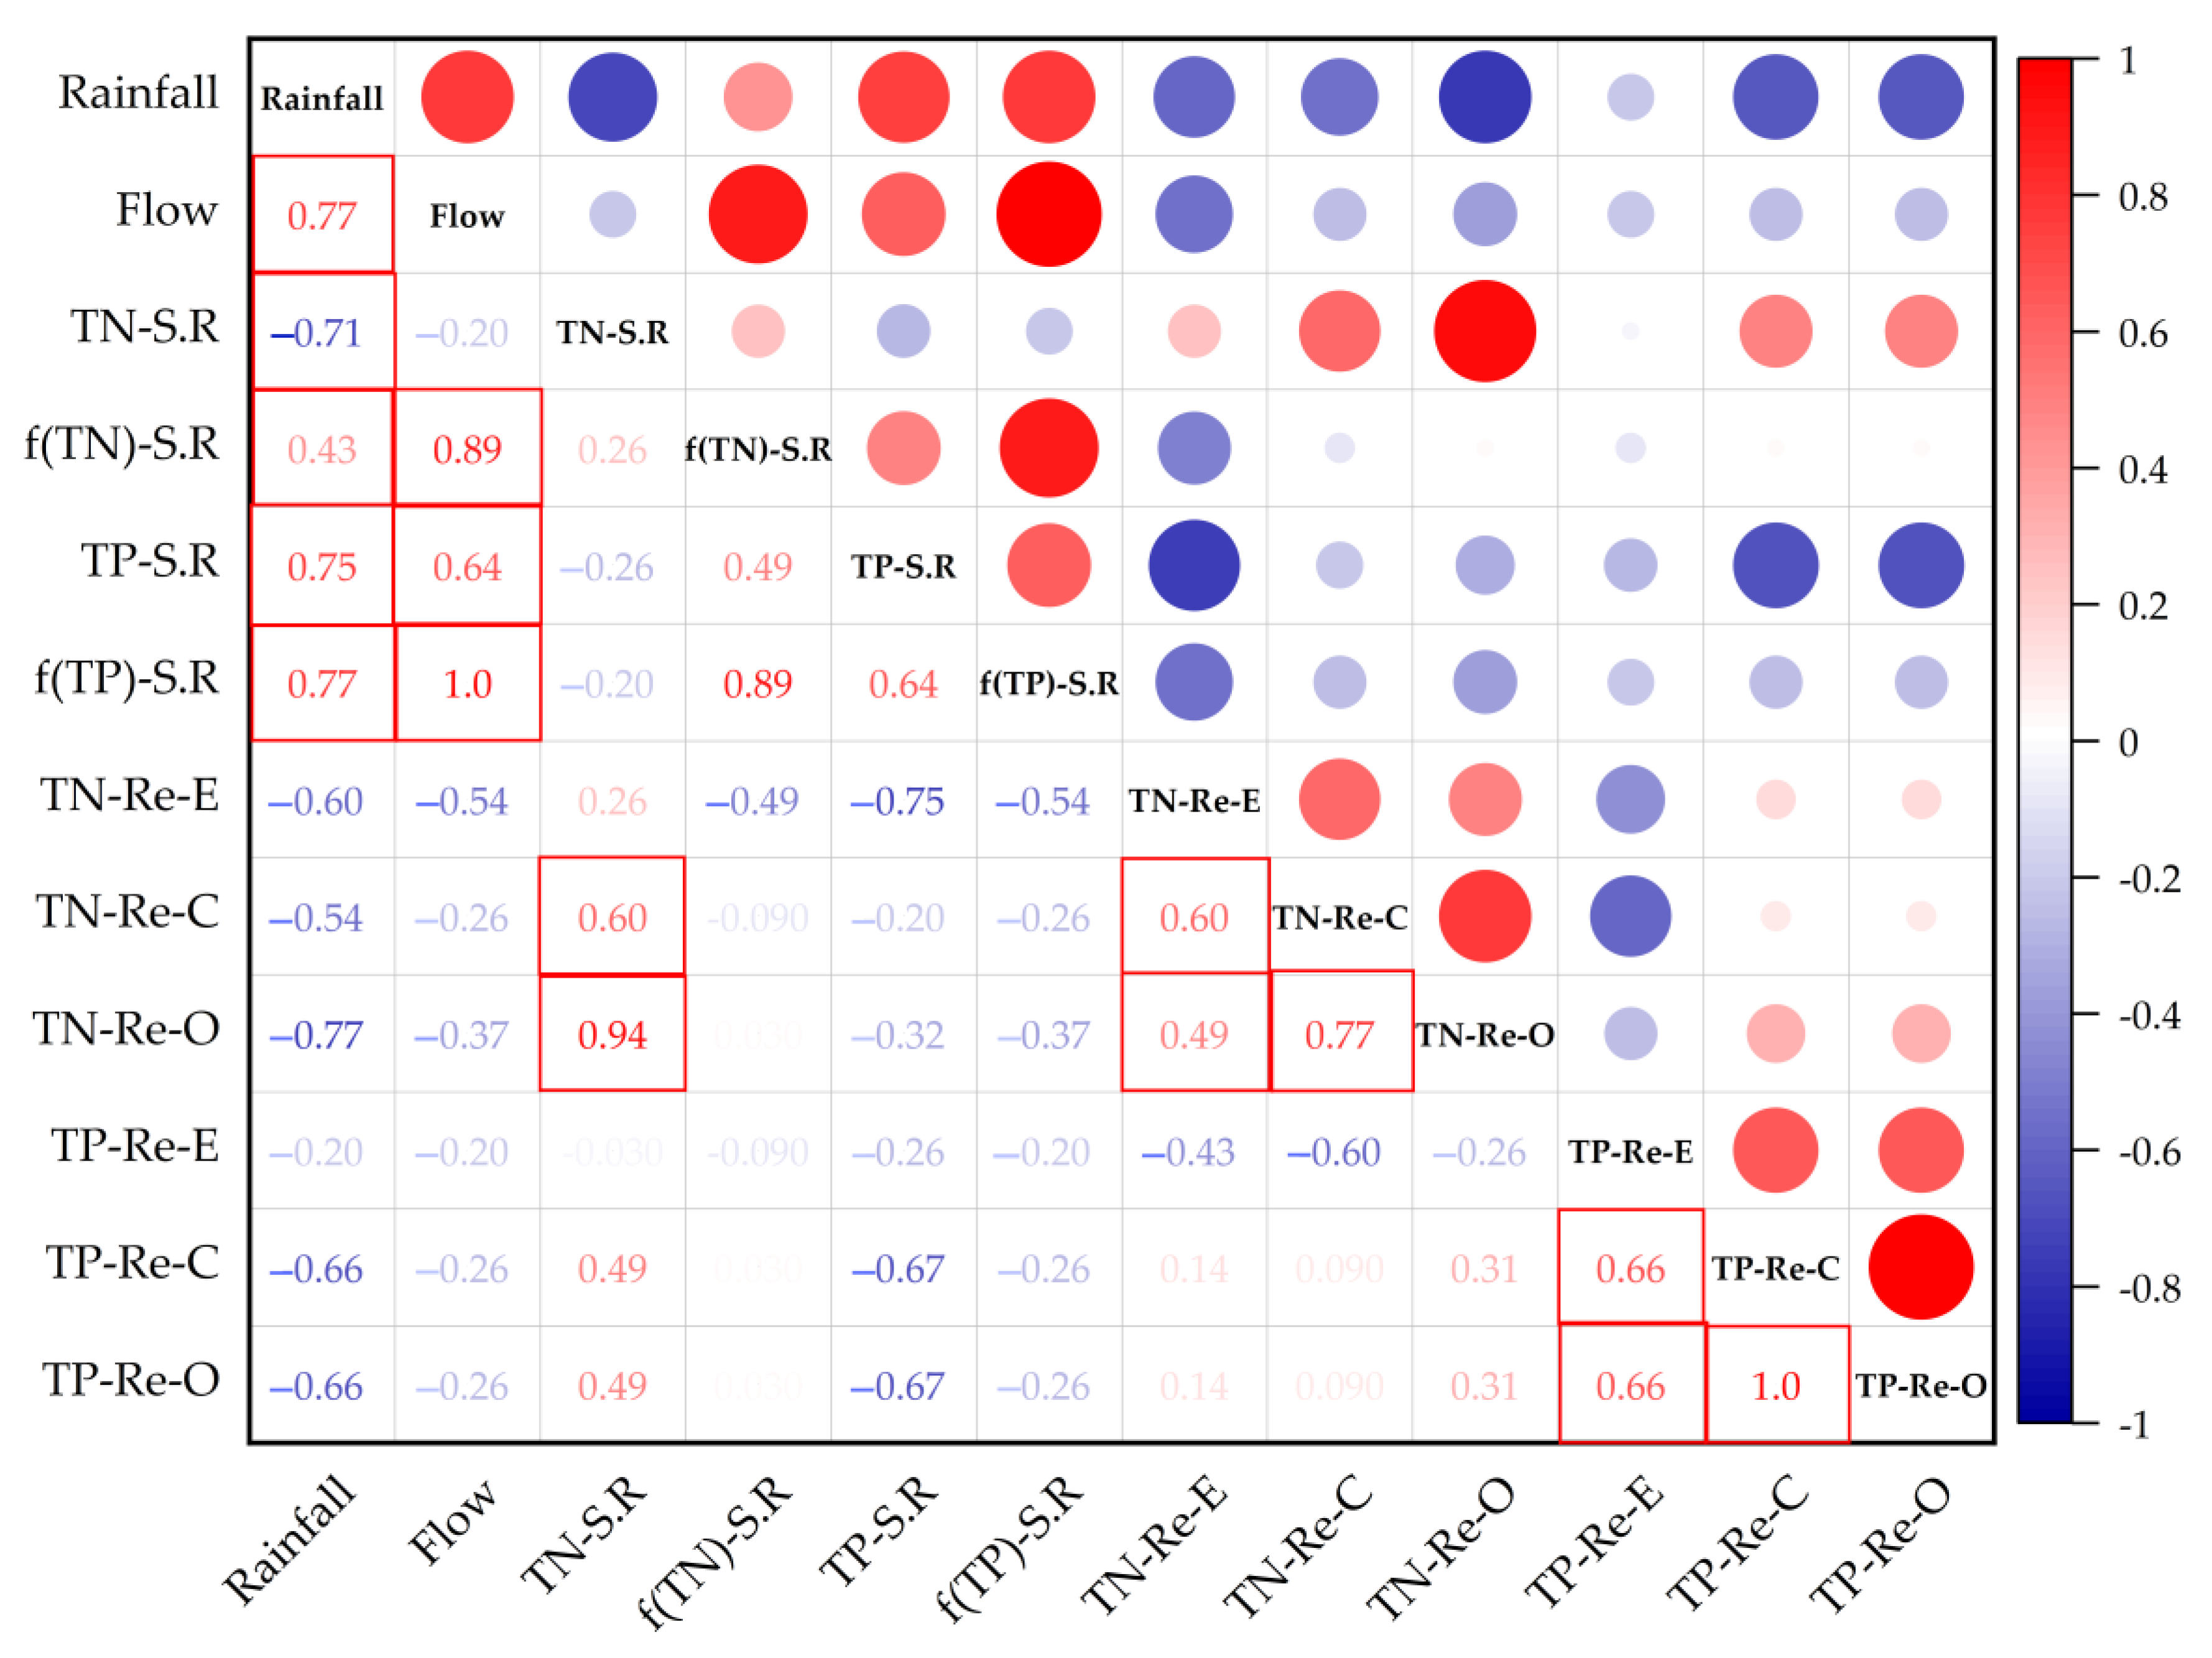
3.4. Correlation Analysis
4. Discussion
4.1. Influence Factors of River Water Quality
4.2. Influencing Factors of Reservoir Water Quality
4.3. Potential Effect of Climate Change on Water Quality
5. Conclusions
Author Contributions
Funding
Institutional Review Board Statement
Informed Consent Statement
Data Availability Statement
Acknowledgments
Conflicts of Interest
References
- Wu, H.; Zhang, H.C.; Li, Y.L.; Chang, F.Q.; Duan, L.Z.; Zhang, X.N.; Peng, W.; Liu, Q.; Liu, F.; Zhang, Y. Plateau lake ecological response to environmental change during the last 60 years: A case study from freshwater Lake Yangzong, SW China. J. Soils Sediments 2021, 21, 1550–1562. [Google Scholar] [CrossRef]
- Matias, B.; Raquel, B.; Alba, G.; Anabella, F.; Giuliana, B.; Ana, C.; Lucio, P. Assessing land use and land cover change in Los Molinos reservoir watershed and the effect on the reservoir water quality. J. S. Am. Earth Sci. 2021, 108, 103243. [Google Scholar]
- Liu, J.Y.; Feng, Y.; Zhang, Y.; Liang, N.; Wu, H.L.; Liu, F.D. Allometric releases of nitrogen and phosphorus from sediments mediated by bacteria determines water eutrophication in coastal river basins of Bohai Bay. Ecotoxicol. Environ. Saf. 2022, 235, 113426. [Google Scholar] [CrossRef]
- Li, X.; Xu, Y.; Zhao, G.; Shi, C.L.; Wang, Z.L.; Wang, Y.Q. Assessing threshold values for eutrophication management using Bayesian method in Yuqiao Reservoir, North China. Environ. Monit. Assess. 2015, 187, 195. [Google Scholar] [CrossRef]
- Chen, R.; Ju, M.T.; Chu, C.L.; Jing, W.Q.; Wang, Y.Q. Identification and Quantification of Physicochemical Parameters Influencing Chlorophyll-a Concentrations through Combined Principal Component Analysis and Factor Analysis: A Case Study of the Yuqiao Reservoir in China. Sustainability 2018, 10, 936. [Google Scholar] [CrossRef]
- Bai, X.; Jiang, Z.D.; Fang, Y.; Zhu, L.; Feng, J.F. Effects of Environmental Concentrations of Total Phosphorus on the Plankton Community Structure and Function in a Microcosm Study. Int. J. Environ. Res. Public Health 2022, 19, 8412. [Google Scholar] [CrossRef]
- Ashraf, M.; Mahmoud, E.; Aya, S.; Abdel, H.A.; Ali, A.E.; Mamdouh, F. Evaluation of the water quality and the eutrophication risk in Mediterranean sea area: A case study of the Port Said Harbour, Egypt. Environ. Chall. 2022, 7, 100484. [Google Scholar]
- Ding, X.H.; Feng, S.J. Analytical model for degradable contaminant transport through a cutoff wall-aquifer system under time-dependent point source pollution. Comput. Geotech. 2022, 143, 104627. [Google Scholar] [CrossRef]
- Zou, L.L.; Liu, Y.S.; Wang, Y.S.; Hu, X.D. Assessment and analysis of agricultural non-point source pollution loads in China: 1978–2017. J. Environ. Manag. 2020, 263, 110400. [Google Scholar] [CrossRef]
- Zhang, Y.N.; Long, H.L.; Li, Y.R.; Tu, S.S.; Jiang, T.H. Non-point source pollution in response to rural transformation development: A comprehensive analysis of China’s traditional farming area. J. Rural Stud. 2021, 83, 165–176. [Google Scholar] [CrossRef]
- Zhao, S.; Wang, J.H.; Feng, S.J.; Xiao, Z.L.; Chen, C.Y. Effects of ecohydrological interfaces on migrations and transformations of pollutants: A critical review. Sci. Total Environ. 2022, 804, 150140. [Google Scholar] [CrossRef] [PubMed]
- Wen, S.L.; Wu, T.; Yang, J.; Jiang, X.; Zhong, J.C. Spatio-Temporal Variation in Nutrient Profiles and Exchange Fluxes at the Sediment-Water Interface in Yuqiao Reservoir, China. Int. J. Environ. Res. Public Health 2019, 16, 3071. [Google Scholar] [CrossRef] [PubMed] [Green Version]
- Fan, G.D.; Li, Z.S.; Wang, S.M.; Huang, K.S.; Luo, J. Migration and transformation of nitrogen in bioretention system during rainfall runoff. Chemosphere 2019, 232, 54–62. [Google Scholar] [CrossRef] [PubMed]
- Su, F.M.; Wu, J.H.; Wang, D.; Zhao, H.H.; Wang, Y.H.; He, X.D. Moisture movement, soil salt migration, and nitrogen transformation under different irrigation conditions: Field experimental research. Chemosphere 2022, 300, 134569. [Google Scholar] [CrossRef] [PubMed]
- Schlesinger, W.H.; Bernhardt, E.S. Chapter 8—Inland Waters. In Biogeochemistry, 4th ed.; Schlesinger, W.H., Bernhardt, E.S., Eds.; Academic Press: Cambridge, MA, USA, 2020; pp. 293–360. [Google Scholar]
- Zhang, Q.; Li, Y.; Wang, M.; Wang, K.; Meng, F.; Liu, L.; Zhao, Y.; Ma, L.; Zhu, Q.; Xu, W.; et al. Atmospheric nitrogen deposition: A review of quantification methods and its spatial pattern derived from the global monitoring networks. Ecotoxicol. Environ. Saf. 2021, 216, 112180. [Google Scholar] [CrossRef]
- Stevens, C.J.; David, T.I.; Storkey, J. Atmospheric nitrogen deposition in terrestrial ecosystems: Its impact on plant communities and consequences across trophic levels. Funct. Ecol. 2018, 32, 1757–1769. [Google Scholar] [CrossRef]
- Wang, Z.T.; Guo, Q.J.; Tian, L.Y. Tracing phosphorus cycle in global watershed using phosphate oxygen isotopes. Sci. Total Environ. 2022, 829, 154611. [Google Scholar] [CrossRef]
- Li, J.B.; Xie, T.; Zhu, H.; Zhou, J.; Li, C.N.; Xiong, W.J.; Xu, L.; Wu, Y.H.; He, Z.L.; Li, X.Z. Alkaline phosphatase activity mediates soil organic phosphorus mineralization in a subalpine forest ecosystem. Geoderma 2021, 404, 115376. [Google Scholar] [CrossRef]
- Wang, J.H.; Zhou, Y.K.; Bai, X.L.; Li, W.C. Effect of algal blooms outbreak and decline on phosphorus migration in Lake Taihu, China. Environ. Pollut. 2022, 296, 118761. [Google Scholar] [CrossRef]
- Zhang, M.K. Effects of Soil Properties on Phosphorus Subsurface Migration in Sandy Soils. Pedosphere 2008, 18, 599–610. [Google Scholar] [CrossRef]
- Yuan, Z.W.; Jiang, S.Y.; Sheng, H.; Liu, X.; Hua, H.; Liu, X.W.; Zhang, Y. Human Perturbation of the Global Phosphorus Cycle: Changes and Consequences. Environ. Sci. Technol. 2018, 52, 2438–2450. [Google Scholar] [CrossRef] [PubMed]
- Berthold, M.; Wulff, R.; Reiff, V.; Karsten, U.; Nausch, G.; Schumann, R. Magnitude and influence of atmospheric phosphorus deposition on the southern Baltic Sea coast over 23 years: Implications for coastal waters. Environ. Sci. Eur. 2019, 31, 27. [Google Scholar] [CrossRef] [Green Version]
- Chen, Q.; Mei, K.; Dahlgren, R.A.; Wang, T.; Gong, J.; Zhang, M.H. Impacts of land use and population density on seasonal surface water quality using a modified geographically weighted regression. Sci. Total Environ. 2016, 572, 450–466. [Google Scholar] [CrossRef]
- Jayasiri, M.M.J.G.C.N.; Yadav, S.; Dayawansa, N.D.K.; Propper, C.R.; Kumar, V.; Singleton, G.R. Spatio-temporal analysis of water quality for pesticides and other agricultural pollutants in Deduru Oya river basin of Sri Lanka. J. Clean. Prod. 2022, 330, 129897. [Google Scholar] [CrossRef]
- Lin, X.D.; Yu, S.; Yang, D.W.; Hutchins, M.G.; Ding, J.; Hong, B.; Chen, P.J.; Liu, X. Discriminating surface soil inorganic nitrogen cycling under various land uses in a watershed with simulations of energy balanced temperature and slope introduced moisture. J. Hydrol. 2020, 587, 124950. [Google Scholar] [CrossRef]
- Hou, L.C.; Kong, W.B.; Qiu, Q.; Yao, Y.F.; Bao, K.Q.; Zhang, L.Q.; Jia, H.T.; Vasenev, I.; Wei, X.R. Dynamics of soil N cycling and its response to vegetation presence in an eroding watershed of the Chinese Loess Plateau. Agric. Ecosyst. Environ. 2022, 336, 108020. [Google Scholar] [CrossRef]
- Xing, J.W.; Song, J.M.; Yuan, H.M.; Li, X.G.; Li, N.; Duan, L.Q.; Kang, X.M.; Wang, Q.D. Fluxes, seasonal patterns and sources of various nutrient species (nitrogen, phosphorus and silicon) in atmospheric wet deposition and their ecological effects on Jiaozhou Bay, North China. Sci. Total Environ. 2017, 576, 617–627. [Google Scholar] [CrossRef] [PubMed]
- Quan, J.L.; Xu, Y.X.; Ma, T.; Wilson, J.P.; Zhao, N.; Ni, Y. Improving surface water quality of the Yellow River Basin due to anthropogenic changes. Sci. Total Environ. 2022, 836, 155607. [Google Scholar] [CrossRef] [PubMed]
- Liu, X.B.; Peng, W.Q.; He, G.J.; Liu, J.L.; Wang, Y.C. A Coupled Model of Hydrodynamics and Water Quality for Yuqiao Reservoir in Haihe River Basin. J. Hydrodyn. 2008, 20, 574–582. [Google Scholar] [CrossRef]
- Yang, W.Y.; Zhang, J.; Mei, S.B.; Krebs, P. Impact of antecedent dry-weather period and rainfall magnitude on the performance of low impact development practices in urban flooding and non-point pollution mitigation. J. Clean. Prod. 2021, 320, 128946. [Google Scholar] [CrossRef]
- Zhang, J.; Li, S.Y.; Jiang, C.S. Effects of land use on water quality in a River Basin (Daning) of the Three Gorges Reservoir Area, China: Watershed versus riparian zone. Ecol. Indic. 2020, 113, 106226. [Google Scholar] [CrossRef]
- Zhu, D.T.; Cheng, X.J.; Li, W.H.; Niu, F.J.; Wen, J.H. Temporal and Spatial Variation Characteristics of Water Quality in the Middle and Lower Reaches of the Lijiang River, China and Their Responses to Environmental Factors. Int. J. Environ. Res. Public Health 2022, 19, 8089. [Google Scholar] [CrossRef] [PubMed]
- Yin, G.D.; Wang, G.Q.; Zhang, X.; Wang, X.; Hu, Q.H.; Shrestha, S.; Hao, F.H. Multi-scale assessment of water security under climate change in North China in the past two decades. Sci. Total Environ. 2022, 805, 150103. [Google Scholar] [CrossRef] [PubMed]
- Cao, X.H.; Wang, C.C.; Lu, Y.L.; Zhang, M.; Khan, K.; Song, S.; Wang, P.; Wang, C. Occurrence, sources and health risk of polyfluoroalkyl substances (PFASs) in soil, water and sediment from a drinking water source area. Ecotoxicol. Environ. Saf. 2019, 174, 208–217. [Google Scholar] [CrossRef] [PubMed]
- Zhang, T.; Yang, Y.H.; Ni, J.P.; Xie, D.T. Construction of an integrated technology system for control agricultural non-point source pollution in the Three Gorges Reservoir Areas. Agric. Ecosyst. Environ. 2020, 295, 106919. [Google Scholar] [CrossRef]
- Zhang, C.; Yan, Q.; Kuczyńska-Kippen, N.; Gao, X.P. An Ensemble Kalman Filter approach to assess the effects of hydrological variability, water diversion, and meteorological forcing on the total phosphorus concentration in a shallow reservoir. Sci. Total Environ. 2020, 724, 138215. [Google Scholar] [CrossRef]
- Chang, C.; Sun, D.M.; Feng, P.; Zhang, M.; Ge, N. Impacts of Nonpoint Source Pollution on Water Quality in the Yuqiao Reservoir. Environ. Eng. Sci. 2017, 34, 418–432. [Google Scholar] [CrossRef]
- Lu, H.M.; Yin, C.Q. Shallow groundwater nitrogen responses to different land use managements in the riparian zone of Yuqiao Reservoir in North China. J. Environ. Sci. 2008, 20, 652–657. [Google Scholar] [CrossRef]
- Wen, S.L.; Gong, W.Q.; Wu, T.; Zheng, X.L.; Jiang, X. Distribution Characteristics and Fluxes of Nitrogen and Phosphorus at the Sediment-water Interface of Yuqiao Reservoir. Environ. Sci. 2017, 39, 2154–2164. (In Chinese) [Google Scholar]
- Zhou, B.; Fu, X.J.; Wu, B.; He, J.; Vogt, R.D.; Yu, D.; Yue, F.J.; Chai, M. Phosphorus Release from Sediments in a Raw Water Reservoir with Reduced Allochthonous Input. Water 2021, 13, 1983. [Google Scholar] [CrossRef]
- Yao, Y.; Wang, P.F.; Wang, C. The Influence on Contaminant Bioavailability and Microbial Abundance of Lake Hongze by the South-to-North Water Diversion Project. Int. J. Environ. Res. Public Health 2019, 16, 3068. [Google Scholar] [CrossRef]
- Ding, H.; Li, Z.; Ren, Q.R.; Chen, H.T.; Song, M.L.; Wang, Y.Q. Single-variable method for predicting trends in chlorophyll a concentration based on the similarity of time series. Ecol. Indic. 2022, 140, 09027. [Google Scholar] [CrossRef]
- Zhang, C.; Liu, H.A.; Gao, X.P.; Zhang, H. Modeling nutrients, oxygen and critical phosphorus loading in a shallow reservoir in China with a coupled water quality—Macrophytes model. Ecol. Indic. 2016, 66, 212–219. [Google Scholar] [CrossRef]
- Krishan, R.; Nikam, B.R.; Pingale, S.M.; Chandrakar, A.; Khare, D. Analysis of trends in rainfall and dry/wet years over a century in the Eastern Ganga Canal command. Meteorol. Appl. 2018, 25, 561–574. [Google Scholar] [CrossRef]
- Regier, P.J.; González, P.R.; Van, H.D.J.; Reale, J.K.; Nichols, J.; Khandewal, A. Water quality impacts of urban and non-urban arid-land runoff on the Rio Grande. Sci. Total Environ. 2020, 729, 138443. [Google Scholar] [CrossRef]
- Drewry, J.J.; Newham, L.T.H.; Greene, R.S.B.; Jakeman, A.J.; Croke, B.F.W. A review of nitrogen and phosphorus export to waterways: Context for catchment modelling. Mar. Freshw. Res. 2006, 57, 757–774. [Google Scholar] [CrossRef]
- Sinha, E.; Michalak, A.M. Precipitation Dominates Interannual Variability of Riverine Nitrogen Loading across the Continental United States. Environ. Sci. Technol. 2016, 50, 12874–12884. [Google Scholar] [CrossRef]
- Zhou, W.J.; Zhu, Z.H.; Xie, Y.L.; Cai, Y.P. Impacts of rainfall spatial and temporal variabilities on runoff quality and quantity at the watershed scale. J. Hydrol. 2021, 603, 127057. [Google Scholar] [CrossRef]
- Chen, S.B.; Chen, L.; Liu, X.J.; Pan, Y.P.; Zhou, F.; Guo, J.S.; Huang, T.; Chen, F.X.; Shen, Z.Y. Unexpected nitrogen flow and water quality change due to varying atmospheric deposition. J. Hydrol. 2022, 609, 127679. [Google Scholar] [CrossRef]
- Yu, D.Y.; Li, X.Y.; Cao, Q.; Hao, R.F.; Qiao, J.M. Impacts of climate variability and landscape pattern change on evapotranspiration in a grassland landscape mosaic. Hydrol. Processes 2020, 34, 1035–1051. [Google Scholar] [CrossRef]
- Rocha, M.D.; Neto, I.E.L. Internal phosphorus loading and its driving factors in the dry period of Brazilian semiarid reservoirs. J. Environ. Manag. 2022, 312, 114983. [Google Scholar] [CrossRef]
- Cheng, X.L.; Huang, Y.N.; Li, R.; Pu, X.C.; Huang, W.D.; Yuan, X.F. Impacts of water temperature on phosphorus release of sediments under flowing overlying water. J. Contam. Hydrol. 2020, 235, 103717. [Google Scholar] [CrossRef]
- Boers, P.C.M. The influence of pH on phosphate release from lake sediments. Water Res. 1991, 25, 309–311. [Google Scholar] [CrossRef]
- Tong, Y.D.; Li, J.Q.; Qi, M.; Zhang, X.Y.; Wang, M.Z.; Liu, X.Y.; Zhang, W.; Wang, X.J.; Lu, Y.R.; Lin, Y. Impacts of water residence time on nitrogen budget of lakes and reservoirs. Sci. Total Environ. 2019, 646, 75–83. [Google Scholar] [CrossRef]
- Zhou, Z.Z.; Huang, T.L.; Ma, W.X.; Li, Y.; Zeng, K. Impacts of water quality variation and rainfall runoff on Jinpen Reservoir, in Northwest China. Water Sci. Eng. 2015, 8, 301–308. [Google Scholar] [CrossRef]
- Xiao, D.P.; Liu, D.L.; Wang, B.; Feng, P.Y.; Bai, H.Z.; Tang, J.Z. Climate change impact on yields and water use of wheat and maize in the North China Plain under future climate change scenarios. Agric. Water Manag. 2020, 238, 106238. [Google Scholar] [CrossRef]
- Sinha, E.; Michalak, A.M.; Balaji, V. Eutrophication will increase during the 21st century as a result of precipitation changes. Science 2017, 357, 405–408. [Google Scholar] [CrossRef]
- Zheng, J.Q.; Cao, X.H.; Ma, C.Z.; Weng, N.Y.; Huo, S.L. What drives the change of nitrogen and phosphorus loads in the Yellow River Basin during 2006–2017? J. Environ. Sci. 2022, 126, 17–28. [Google Scholar] [CrossRef]
- Li, Y.Y.; Wang, H.; Deng, Y.Q.; Liang, D.F.; Li, Y.P.; Shen, Z.L. How climate change and land-use evolution relates to the non-point source pollution in a typical watershed of China. Sci. Total Environ. 2022, 839, 156375. [Google Scholar] [CrossRef]
- Fan, M.; Shibata, H. Simulation of watershed hydrology and stream water quality under land use and climate change scenarios in Teshio River watershed, northern Japan. Ecol. Indic. 2015, 50, 79–89. [Google Scholar] [CrossRef]

Publisher’s Note: MDPI stays neutral with regard to jurisdictional claims in published maps and institutional affiliations. |
© 2022 by the authors. Licensee MDPI, Basel, Switzerland. This article is an open access article distributed under the terms and conditions of the Creative Commons Attribution (CC BY) license (https://creativecommons.org/licenses/by/4.0/).
Share and Cite
Shou, C.-Y.; Tian, Y.; Zhou, B.; Fu, X.-J.; Zhu, Y.-J.; Yue, F.-J. The Effect of Rainfall on Aquatic Nitrogen and Phosphorus in a Semi-Humid Area Catchment, Northern China. Int. J. Environ. Res. Public Health 2022, 19, 10962. https://doi.org/10.3390/ijerph191710962
Shou C-Y, Tian Y, Zhou B, Fu X-J, Zhu Y-J, Yue F-J. The Effect of Rainfall on Aquatic Nitrogen and Phosphorus in a Semi-Humid Area Catchment, Northern China. International Journal of Environmental Research and Public Health. 2022; 19(17):10962. https://doi.org/10.3390/ijerph191710962
Chicago/Turabian StyleShou, Chen-Yang, Ye Tian, Bin Zhou, Xu-Jin Fu, Yun-Ji Zhu, and Fu-Jun Yue. 2022. "The Effect of Rainfall on Aquatic Nitrogen and Phosphorus in a Semi-Humid Area Catchment, Northern China" International Journal of Environmental Research and Public Health 19, no. 17: 10962. https://doi.org/10.3390/ijerph191710962
APA StyleShou, C.-Y., Tian, Y., Zhou, B., Fu, X.-J., Zhu, Y.-J., & Yue, F.-J. (2022). The Effect of Rainfall on Aquatic Nitrogen and Phosphorus in a Semi-Humid Area Catchment, Northern China. International Journal of Environmental Research and Public Health, 19(17), 10962. https://doi.org/10.3390/ijerph191710962