Abstract
Carbon dioxide (CO2) emissions from river water have sparked worldwide concerns due to supersaturate CO2 levels in the majority of global rivers, while the knowledge on the associations among nitrogen pollution, urbanization, and CO2 emissions is still limited. In this study, the CO2 partial pressure (pCO2), carbon and nitrogen species, and water parameters in sewage-draining river networks were investigated. Extremely high pCO2 levels were observed in sewage and drainage river waters, such as Longfeng River, Beijing-drainage River, and Beitang-drainage River, which were approximately 4 times higher than the averaged pCO2 in worldwide rivers. Correlations of carbon/nitrogen species and pCO2 indicated that carbon dioxide in rural rivers and sewage waters primarily originated from soil aeration zones and biological processes of organic carbon/nitrogen input from drainage waters, while that in urban rivers and lakes was mainly dominated by organic matter degradation and biological respiration. Enhanced internal primary productivity played critical roles in absorbing CO2 by photosynthesis in some unsaturated pCO2 sampling sites. Additionally, higher pCO2 levels have been observed with higher NH4+-N and lower DO. CO2 fluxes in sewage waters exhibited extremely high levels compared with those of natural rivers. The results could provide implications for assessing CO2 emissions in diverse waters and fulfilling water management polices when considering water contamination under intense anthropogenic activities.
1. Introduction
River ecosystems play dominant roles in conveying materials between inland water and oceans, which has implications for the circulation of matter and energy in the global carbon pool, as well as the global carbon budget and climate change [1,2]. Generally, the supersaturate carbon dioxide (CO2) levels of most river ecosystems cause CO2 to be released from rivers to the atmosphere, making river ecosystems a vital source of the total global CO2 emissions [3,4]. Global CO2 emissions have been estimated at 1.80 petagrams of carbon per year (Pg C·yr–1) from rivers and 0.32 Pg C·yr–1 from lakes or reservoirs, being equivalent to approximately 2.34 times the total carbon transferred from inland water to oceans (0.90 Pg C·yr–1) [5,6]. Owing to the enormous challenges of carbon assessment and environmental management in the global ecosystem, CO2 emissions from river networks have inspired great interest around the world. Therefore, much efforts have been made to assess the contributions of CO2 emissions from natural river ecosystems, e.g., Amazon and Mekong River systems [7], Guadalete River [8], and the Wujiang River [9]. However, urban river networks are intensively impacted by anthropogenic activities (e.g., sewage draining and urban land coverages) compared with those of natural river networks, which generally exhibit more complex watershed environmental conditions dominating the production and transportation of CO2 [10]. Integrated studies have affirmed that watershed urbanization profoundly amplifies the uncertainty of riverine CO2 emissions, while the fact that few works have concentrated on urban river networks suggests more efforts to fill the gap [11].
Mechanisms of CO2 emissions from river ecosystems are associated with a combination of internal factors (temperature, pH, dissolved oxygen, and organic matters) and external factors (geomorphology, hydrology, precipitation, and anthropogenic activities) [8,12], which are further impacted by autotrophic and heterotrophic microbial activities in waters, photosynthesis of aquatic vegetation, organic matter degradation, and mineralization [13]. The drastic disturbance in urban river networks commonly expressing low dissolved oxygen (DO) and high nutrient or organic carbon concentration is closely related to the higher partial pressure of carbon dioxide (pCO2) levels than rivers in less impacted areas. It is principally attributed to the fact that nutrients stimulate microbe reproduction and modify biochemical environmental conditions, accelerating CO2 release from waters [14,15]. Multiple studies have also emphasized that the significantly different nutrient/carbon inputs from draining waters and soil CO2 influxes between various urban rivers would profoundly enlarge the uncertainty of CO2 emissions from regional river ecosystems [16,17,18]. Although these works supplied some valid results, the correlations between anthropogenic nutrient loading and CO2 emissions, and the factors affecting on the distributions of CO2 emissions from urban rivers, are still limited. The lack of investigation on overall river networks in specific regions, which has primarily concentrated on local rivers, lakes, and estuaries [19,20,21], is also not conducive to the construction of a global carbon budget system.
Enormous regions around the world have been experiencing rapid urbanizations. The uncertainty and complexity of sources of contaminant waters (especially domestic/industrial sewage-draining water and runoff coming from agricultural soil) would destroy the nitrogenous and carbonic balance of aquatic ecosystems [18]. Hence, focusing on CO2 emissions in urban river networks is beneficial to recognize the response of aquatic ecosystems to anthropogenic activities as well as assessing the global carbon budget. Tianjin, one of the most prosperous coastal cities in China, receives sewage waters from local and surrounding areas (including Beijing and Hebei Province), regarded as important sources of CO2 emissions. The aims of this study are to (1) disclose the spatial distribution patterns of pCO2 and CO2 emission fluxes from different waters; (2) explore the mechanisms producing CO2 with various nitrogen concentrations; and (3) reveal the primary factors affecting CO2 emissions in a eutrophic aquatic environment. The results of this study would be helpful for assessing the source and sink effects of CO2 in urban and rural rivers under the influence of multiple factors, providing a database for future studies on rivers with similar characteristics of nitrogen pollution and urbanization worldwide, and fulfilling water management polices when considering the contribution of global urban rivers to carbon cycling and CO2 emissions.
2. Materials and Methods
2.1. Study Site
Tianjin (38°34′–40°15′ N, 116°43′–118°04′ E) is a densely populated (13.87 million people) coastal metropolis in China, located northeast of North China Plain and downstream of the Haihe River Basin, which is enclosed to the east by the Bohai Sea. The climate in the area is warm temperate sub-humid monsoon, with higher temperature in the summer (monthly average temperature of 28 °C) and an average annual temperature of 14.8 °C. The mean annual precipitation is 520–660 mm with approximately 75% occurring from June to August. There are five major rivers, the Haihe River, Yongdingxin River, Chaobaixin River, Duliujian River, and Jiyun River, in Tianjin (Figure 1). Among these, the Haihe River flows through the urban area and eventually enters into the Bohai Sea. Tianjin serves as one of the most important economic centers of China experiencing rapid urbanization processes, which convert the river ecosystem due to anthropogenic activities. Tianjin river networks accept sewage from the neighboring areas as well as load their own water environmental pollution, threatening the water resource safety, to which more attention should be paid [22].
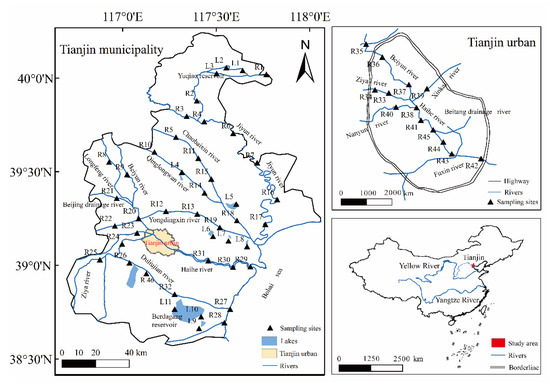
Figure 1.
Map of sampling sites in Tianjin river network.
2.2. Sampling and Analysis
Previous studies have verified that summer is a sensitive period for CO2 production and emissions because of promoted and active carbon biogeochemical processes [10,23]. Based on the climatic conditions and characteristics of the main rivers, water samples were collected throughout the Tianjin municipality in June 2015, including 11 sampling sites in lakes/reservoirs, 5 sampling sites in sewage-draining waters, and 41 sampling sites in rivers (Figure 1). Among them, 18 samples in urban rivers (mainly in Haihe River) and 23 sampling sites in rural rivers were deployed to better investigate the CO2 emissions under various anthropogenic activities.
Surface water samples (depth 0.5 m) were collected by a Niskin sampler in triplicate and all the water samples were stored away from light at 4 °C until analysis in a laboratory. The water physical–chemical variables, including water temperature (T), dissolved oxygen (DO), electric conductivity (EC), pH, and total dissolved solids (TDSs), were determined in situ with a multi-parameter monitor (Yellow Springs Instrument, YSI-6600 V2, United States Gimcheon Instruments Inc.). Alkalinity (Alk) of samples was measured using a titration method with 0.01 mol·L−1 HCl in the field. The concentration of dissolved inorganic carbon (DIC) in water was calculated by the carbonate equilibrium system, detailed formulations are shown in Section 2.3. The concentration of dissolved organic carbon (DOC) in water was measured with an elemental analyzer (Vario TOC cube, Elementar, Langenselbold, Germany). The concentrations of NH4+-N, NO3−-N, NO2−-N, and total nitrogen (TN) were determined using automatic flow analysis (AA3 Auto Analyzer, SEAL, Norderstedt, Germany) in a laboratory. However, because high concentrations of organic matter and heavy metals in sewage water and effluents would affect the accuracies of the measurements of TN, the AA3 Auto Analyzer was equipped with Cd columns and effective UV lamps to ensure the digestion rate. By following the protocols of the People’s Republic of China State Environmental Protection Standards: Determination of Total Nitrogen by Continuous Flow Analysis (CFA) and N- (1-naphthyl) Ethylene Diamine Dihydrochloride Spectrophotometry (Chinese Edition) (HJ 667-2013), the concentrations of total nitrogen were determined. Dissolved organic nitrogen (DON) was calculated by subtracting the dissolved inorganic nitrogen (DIN, including NH4+-N, NO3−-N, and NO2−-N) from TN. The authoritative protocol manual handbook in China (The water and wastewater monitoring and analysis methods (version 4)) was applied to determine the sewage-draining waters. Laboratory standards, blanks, and replicates were applied to guarantee that the accuracies of all the analyses were better than ±5%.
2.3. The Calculation of Partial Pressure of Carbon Dioxide in River Waters
The principal buffer mechanism in a freshwater system is carbonate equilibrium. H2CO3, HCO3−, CO32−, and aqueous CO2 make up the total dissolved inorganic carbon (DIC) in water, which is affected by pH, water temperature, and ionic strength [24,25]. Previous studies have reported that the alkalinity–pH–temperature method might overestimate the values of pCO2 at low pH, while they could be accurately described with pH > 7.2 and total alkalinity > 1 mmol·L−1 [25,26]. Based on the pH (ranging from 7.29 to 10.41) and alkalinity (exceeding 1.43 mmol·L−1) in water samples in this study area, the alkalinity–pH–temperature method is employed to calculate pCO2. The pCO2 values are calculated according to the carbonate equilibrium system which is described by the following equations:
where Ki are DIC dissociation constants related to temperature. Based on these, pCO2 (μatm), H2CO3*, and CO32− are evaluated with HCO3−, water temperature (T), and pH, and the relative calculating equations are as follows.
2.4. CO2 Emission Flux Calculation
CO2 concentration gradient and gas exchange coefficient commonly govern the CO2 exchange rate between water and atmosphere [2]. According to the theoretical diffusion model of CO2, which has been efficiently employed at the water–air interface in previous studies [5,14], the CO2 emission fluxes in this work are evaluated as follows:
where (mmol·m−2·d−1) is the CO2 emission flux, (μatm) is the Henry’s law constant of CO2 calibrated by measured T (°C) in situ, k (cm·h−1) is the gas exchange coefficient at the air–water interface, and are the partial pressure of CO2 in water and air, respectively.
Among these, k is uncertainty that should be cautiously confirmed by specific environmental conditions. Researchers have made great efforts on combining multiple factors (such as the wind speed, temperature, stream slope, discharge, and depth) with estimation models that have been widely employed in previous studies to optimize the calculation model of gas transfer velocity [25,27,28]. Wind speed is a primary cause of turbulence in low-gradient river systems that strongly relate to k600 [7,29]. In addition, it was proposed that averaged k could be used to estimate gas fluxes from water [30]. Considering the low terrain and steady river flow velocity in this work, k is evaluated by a typical model primarily correlating it with the wind speed and temperature. We also adopted the averaged value (k = 4 cm·h−1) to calculate CO2 emission fluxes and inconspicuous differences between the two estimation methods were found. Relevant calculation equations are listed as follows [31]:
in which k600 is the gas exchange coefficient of CO2 calibrated with wind speed U10 (m·s−1) which is the wind speed 10 m above the water surface. The value of x is determined by U10, x = −0.67 or x = −0.5 when U10 < 3.7 m·s−1 and U10 > 3.7 m·s−1, respectively. SC (cm·h−1) is the Schmidt number represented by T (°C). The monthly averaged wind speed of Tianjin in June (from 2014 to 2021) was obtained from the China Meteorological Data Network.
2.5. Statistical Analysis
IBM SPSS Statistics 19 was used for the descriptive statistical analysis, variance analysis, and linear correlation analysis. One-way analysis of variance (ANOVA) was performed to examine the differences in / from different sampling sites. Correlation coefficients between / and environmental parameters were determined by linear regression analysis. Statistical significance was found when the p value < 0.05 for all the variance analyses and linear correlation analyses. All the figures were made by Origin 2018, R Studio, and Grapher 15.
3. Results
3.1. Variations in Water Quality Parameters
Statistics of water quality parameters including water temperature (T), dissolved oxygen (DO), total dissolved solids (TDSs), electric conductivity (EC), pH, and alkalinity (Alk) are listed in Table 1. In June, surface water temperatures ranged between 25.60 °C and 34.80 °C. The pH ranged from 7.29 to 10.41 and the maximum value was detected in rural rivers (R23, Ziya River) while the minimum value was found in sewage-draining waters (R9, Longfeng-drainage River) (Figure 1). Large ranges of TDSs in river waters in Tianjin have been observed, with the highest value in the estuary of the Duliujian River (R27, 22,900 mg·L−1) and with lowest value in the Yuqiao Reservoir (L1, 250 mg·L−1). DO generally demonstrated oversaturated conditions in these waters, with an average value of saturation of 102%, and ranged from 2.15 to 14.24 mg·L−1.

Table 1.
Statistics of the environmental variables in surface water in Tianjin, China.
As shown in Figure 2, from upstream to downstream, water parameters presented obvious longitudinal variations in all the studied rivers, with different spatial patterns. Since significant correlations (R = 0.79, p < 0.01) have been observed between DO and pH, the spatial distributions of DO and pH exhibited a similar tendency in all major rivers. In Haihe River, DO and pH increased remarkably in the urban area, while the EC and Alk decreased significantly in the same reaches. Except DO and pH in Jiyun River and Chaobaixin River, water parameters in most of the rivers increased from upstream to downstream and estuaries or coastal area.
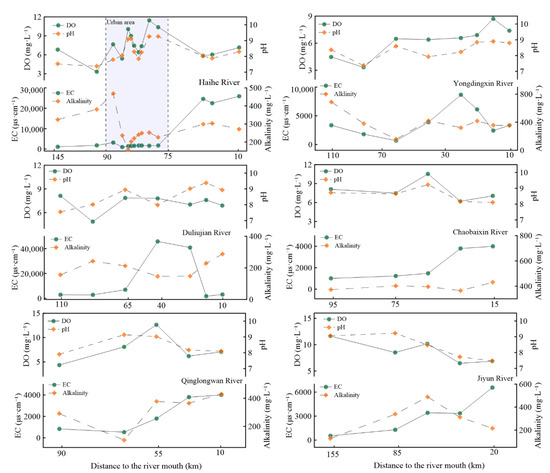
Figure 2.
Longitudinal variations in DO, pH, EC, and Alk along major rivers in Tianjin.
3.2. Variations in Nitrogen and Carbon Species
A box plot of nitrogen species in different waters is presented in Figure 3. The concentrations of TN ranged from 0.83 to 10.20 mg·L−1 in lakes, 2.11 to 16.97 mg·L−1 in rural rivers, 3.51 to 16.51 mg·L−1 in urban rivers, and 3.51 to 15.82 mg·L−1 in sewage waters, and mean values of NO3−-N were higher than other nitrogen species (NH4+-N, NO2−-N, and DON) except those in sewage-draining waters (Table 2). Rural rivers and sewage-draining waters presented higher nitrogen concentrations in diverse waters, and urban rivers exhibited considerably higher nitrogen concentration than lakes (p < 0.05) (Figure 3). Higher NH4+-N concentrations were observed in anoxic surface waters, such as R24 in urban rivers, R9 and R20 in sewage-draining waters, where the DO concentrations were all below 3.67 mg·L−1. Similar findings have been reported from studies in a coastal lagoon [21] and anoxic water layers in the hypolimnion of a lake/reservoir [27] as well. Except the lake waters, the NH4+-N in surface waters had a negative relationship with concentrations of DO (Figure 4).
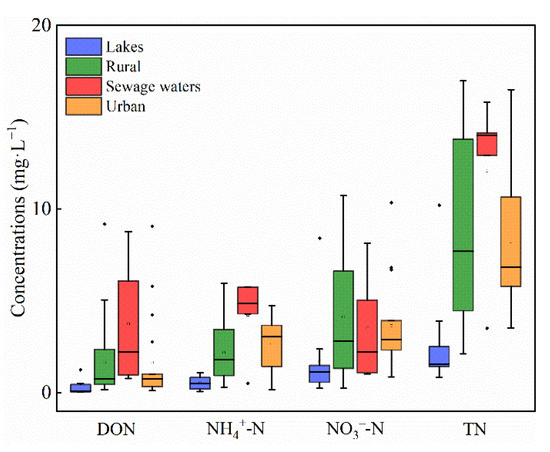
Figure 3.
Concentrations of nitrogen species in river waters in Tianjin.
Table 2.
Statistics of the nitrogen species in surface water in Tianjin, China.
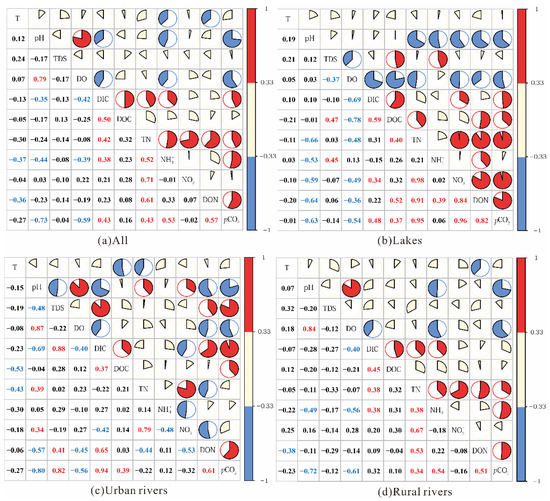
Figure 4.
Correlations of water environmental parameters in surface water in Tianjin, China. The colors represent the range of correlation coefficient. Red indicates positive correlations (ranging from 0.33 to 1), blue indicates negative correlations (ranging from −1 to −0.33), and light yellow indicates weak correlations (ranging from −0.33 to 0.33). The ratios of colored areas in circles represent the degree of correlations.
DIC ranged from 0.80 mol·L−1 to 11.20 mol·L−1, with mean values of 3.69, 4.18, 4.52, and 5.41 mol·L−1 in lakes, urban rivers, rural rivers, and sewage waters, respectively. DIC in river waters in Tianjin exhibited negative correlations with DO while it was positively related to DOC (Figure 4). The correlations between DIC and each nitrogen species displayed obviously differences (p < 0.05), exhibiting positive correlations with NH4+-N (R = 0.38, p < 0.01) and TN (R = 0.42, p < 0.01) (Figure 4a). DOC positively correlated to DON in lakes (R = 0.52, p < 0.01), with the highest value in the Yongdingxin River (R13, 19.54 mg·L−1) and the lowest value in the Yuqiao Reservoir (L1, 1.49 mg·L−1).
3.3. Partial Pressure of CO2 in Different River Waters
In total, the pCO2 averaged 2663.21 μatm in surface waters in the river networks in Tianjin, fluctuating within a wide range (standard deviation: 4124.99 μatm). Compared with the average values of global rivers (averaging 3100 μatm) [5,14], the pCO2 in most of the rivers in Tianjin presented a high level. Specifically, the mean values of pCO2 in sewage waters (11,350.59 ± 7243.23 μatm) were significantly higher than those of urban rivers (3035.41 ± 3510.66 μatm), rural rivers (1516.58 ± 1598.54 μatm), and lakes (628.16 ± 807.27 μatm). The results of Pearson’s correlation coefficient showed that pCO2 consistently exhibited negative correlations and was statistically significant with pH and DO, while it showed positive correlations with DON (Figure 4). Additionally, pCO2 was positively related to DIC in river waters in Tianjin, especially in urban rivers, with the highest correlation coefficient (R = 0.94, p < 0.01). The significant correlations between nitrogen species (TN, NH4+-N, NO3−-N, and DON) and pCO2 have been observed in lakes and rural rivers.
3.4. Fluxes of CO2 in River Networks
Distributions of CO2 fluxes were consistent to those of pCO2, while there were obvious discrepancies when evaluating the various surface waters in Tianjin (Figure 5). Calculated CO2 fluxes ranged from −10.47 mmol·m−2·d−1 (in Ziya River, R23) to 538.93 mmol·m−2·d−1 (in Beijing-drainage River, R20). The highest CO2 fluxes were found in sewage waters (319.54 ± 210.54 mmol·m−2·d−1) compared to those in urban rivers (77.95 ± 102.30 mmol·m−2·d−1), lakes (7.75 ± 23.51 mmol·m−2·d−1), and rural rivers (33.42 ± 46.55 mmol·m−2·d−1) (Figure 6). Statistically significant differences in CO2 fluxes in lakes from those in other river waters (p < 0.05) have been observed, while there were no obvious variations between sewage waters and urban rivers (p > 0.05). In hypoxic surface waters with higher CO2 supersaturated conditions, increased CO2 fluxes were also detected, such as the sampling sites L5 in Qilihai Wetland, R35 in Yongdingxin River, and R20 in Beijing-drainage River.
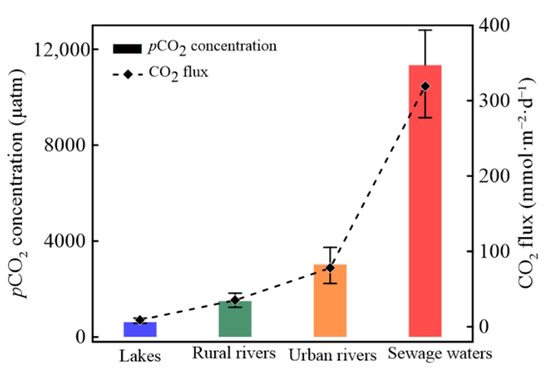
Figure 5.
The relationship of pCO2 concentration and CO2 fluxes in river waters in Tianjin.
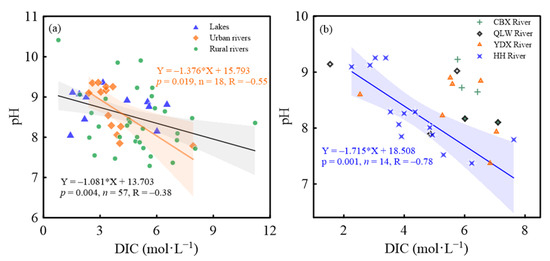
Figure 6.
Correlations between DIC and pH in diverse river waters in Tianjin. (a) All the river waters; (b) Chaobaixin (CBX) River, Qinglongwan (QLW) River, Yongdingxin (YDX) River, and Haihe (HH) River.
4. Discussion
4.1. Sewage-Draining Dominated the Spatial Distributions of pCO2 in River Networks
Sewage-draining was linked to the aquatic environmental conditions, carbon or nitrogen accumulation, and organic matter decomposition rate, which obviously modified the intensity of riverine contamination levels and CO2 emissions [28,32]. Diverse river waters in Tianjin showed different contamination levels, mainly due to the complicated source of sewage-draining waters under intense anthropogenic activities [22,33]. Lakes/reservoirs generally served as the water sources and nature reserves in Tianjin, were less affected by sewage, and expressed the lowest pCO2 values in Tianjin River networks (Figure 5). Rural rivers generally accepting a large amount of domestic/industrial sewage have overwhelmingly altered aquatic ecosystems, while urban rivers could be considered as landscape waters with drastic disturbance by human activities. Higher pCO2 values were generally accompanied with the low pH and high DIC in direct sewage-draining waters [11,25]. In this study, sampling sites in sewage-draining waters in Longfeng River (R8 and R9), Beijing-drainage River (R20), and Beitang-drainage River (R45) all presented higher pCO2 (approximately 4 times that of averaged pCO2 in worldwide rivers, i.e., 3100 μatm) [5] with lower pH (ranged from 7.29 to 7.85) and higher DIC (ranged from 4.05 to 6.85 mol·L−1) when compared with other waters in this study.
Traditionally, increased pCO2 values were consistent with population density [34], and it was applicable in this study (with lower pCO2 levels in rural rivers and lakes than in urban rivers and sewage waters). Here, we selected the Haihe River to disclose the effects of different pollution sources on pCO2 in river waters, with the most obvious variations in environmental conditions (Figure 2). The higher pCO2 values exhibited in R8 and R20 along the Haihe River were mainly attributed to the direct reception of large amounts of sewage in the upper reaches [11]. A similar observation was also made in urban rivers with direct sewage-draining waters in Beitang-drainage River (R45). However, compared with those in rural rivers, lower pCO2 values in urban areas (especially in R35, R36, and R37) might result from the artificial dredging project which reduced biological respiration and organic matter degradation in river waters and sediments [35]. Additionally, the positive correlations between pCO2 and DOC/DON in urban rivers (Figure 4) also indicated that increased organic matter played important roles in the CO2 production in urban rivers. These results highlighted that sewage-draining would explain the differences in environmental conditions and spatial variations in pCO2 in river waters, and sewage inputs increased pCO2 levels.
4.2. Biogeochemical Processes Served as the Primary Mechanisms of CO2 Production
It has been noticed that there are two production mechanisms of CO2 in waters: the chemical weathering and the biological processes. Chemical weathering dissolves silicate or carbonate rocks by consuming CO2 and generating DIC, which obviously occurred in the Karst watershed in China [9,24,36]. Biologically, the photosynthesis and respiration of aquatic plants, microbial respiration and reproduction, and organic matter degradation commonly dominate CO2 production and release [13]. Additionally, eutrophic waters in Tianjin provided favorable conditions for phytoplankton reproduction, and high temperatures in the rainy season also stimulated microbial activities, which traditionally promote the primary productivity of phytoplankton fixing a large amount of CO2 as important carbon sinks in the water [22,37].
Generally, water–rock reaction, CO2 input from the soil aeration zone, and the dissolution of atmospheric CO2 are commonly regarded as the primary sources of CO2 in rivers [17,24,28]. However, because of low cover rates of exposed rocks or outcrops in the studied river watersheds, and the geological type was mainly quaternary sediment, and the water–rock reaction in the studied river waters could be neglected. Generally, the correlations of pH and DIC have been used to characterize the influencing factors of CO2 production and transformations in river waters [21]. In this study, pH presented negative correlations with DIC in all the river waters (including lake waters and river waters) (R = −0.38, p < 0.01) including Haihe River (R = −0.78, p < 0.01) (Figure 6), revealing the potential contributions of photosynthetic processes to DIC uptake and CO2 consumption in water, but they have obviously been affected by other processes and influencing factors [13]. Specifically, most of the urban rivers and lakes have very low water flow and long residence time, providing ideal static conditions for biogeochemical carbon transformations, including photosynthesis, respiration, and organic matter degradation [25]. On the one hand, in rural rivers and sewage rivers, frequent runoff processes in the rainy season during the sampling period transferred CO2 from the soil aeration zone to river water, increasing the pCO2 levels in the rural river water; on the other hand, a large amount of organic carbon/nitrogen input from drainage waters would promote CO2 production by stimulating the organic matter degradation and biological respiration in sewage waters. Additionally, in the lakes and urban rivers, good positive relationships between DOC and pCO2 (Figure 4) indicated that CO2 production was mainly dominated by internal organic matter degradation and biological respiration.
Even though most of the river waters in the study area were sources of atmospheric CO2 in the rainy season, unsaturated pCO2 has been found in some of the sites in the lakes (L2, L4, L9, and L10) and urban areas (R33, R34, R37, R38, R39, R42, and R43), which may be attributed to the photosynthesis enhanced by algal bloom and well-growing aquatic plants in the rainy season with proper temperature and nutrient supply [20,33,38].
4.3. Effects of Carbon/Nitrogen Increases on pCO2
Dramatic anthropogenic activities with increasing pollutant discharge have contributed to complicated environmental conditions in river ecosystems, and potentially provided huge challenges to biochemical processes [15,18]. In lakes, positive correlations of DON, inorganic nitrogen (NO3−-N and NH4+-N), and DOC have been observed, especially the significantly positive correlations between NO3−-N and DON (R = 0.84, p < 0.01) (Figure 4). Generally, higher temperatures and carbon/nitrogen inputs relatively encouraged microbial activities and influenced the contributions of pCO2 in river ecosystems [8,12,25]. Nutrient supplementation was also verified as an important factor influencing pCO2 by enhancing the primary production and mineralization of organic matter [39,40,41]. Therefore, CO2 emissions of lakes were mainly controlled by photosynthesis and mineralization of organic matter, which could be disclosed by the correlations between environmental parameters and nitrogen species.
Higher concentrations of NH4+-N have been observed in the Longfeng River (R8 and R9), Beijing-drainage River (R20), and Jiyun River (R17), which correspond to the amount of sewage waters produced by anthropogenic activities. The concentrations of NH4+-N are normally considered as the crucial indicator of sewage discharges from anthropogenic activities [42], which have been found to be the highest in sewage waters (Table 2). Consistently with previous studies, increased pCO2 with higher nitrogen concentrations was also found [43]. On the other hand, the positive correlations between NH4+-N and pCO2 (R = 0.54, p < 0.01) also verified the effect of nitrogen inputs from sewage-draining waters on pCO2 levels in rural rivers and sewage waters.
The distributions of nitrogen species (NH4+-N, NO3−-N, and DON), environmental parameters, and pCO2 along the Haihe River, with distinct longitudinal variations (Figure 2 and Figure 7), would be effective evidence on the influence of carbon/nitrogen concentrations. Urban rivers impacted more by anthropogenic activities undergoing intense biochemical processes exhibited higher pCO2 levels [22,36]. The concentrations of NH4+-N were roughly decreased while DO and pH levels increased, in contrast to NO3−-N (especially in urban areas), demonstrating that the CO2 emissions from river waters were produced by the microbial degradation under aerobic and hypoxic conditions [44]. The highest NO3−-N (10.35 mg·L−1) and DOC (9.07 mg·L−1) but lower NH4+-N (0.15 mg·L−1) and DON (0.10 mg·L−1) in R37 have been observed along the Haihe River, which could be explained by the principial biogeochemical processes in this river water being aerobic mineralization (DO saturation was 131%). Obviously positive correlations along the Haihe River between pCO2 and DON (R = 0.84, p < 0.01) and DIC (R = 0.78, p < 0.01) illustrated that higher nutrient concentrations stimulated microbial activities, and the reception of wastewaters enhanced pCO2 values [33,45]. Thus, CO2 emissions should be investigated in detail because of the complexity of sources of carbon/nitrogen concentrations.
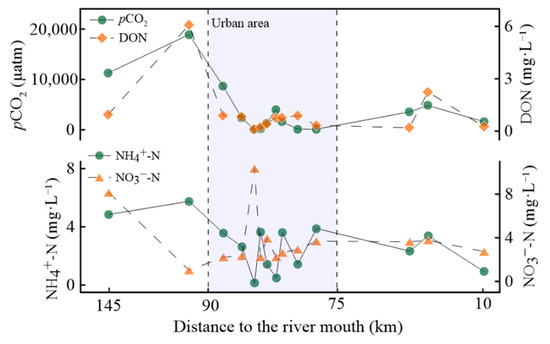
Figure 7.
Longitudinal variations in pCO2 concentrations and nitrogen concentrations along the Haihe River.
4.4. CO2 Fluxes
Similar to most river ecosystems under intense anthropogenic activities receiving a substantial amount of nutrients, CO2 fluxes demonstrated obvious positive correlations with the pCO2 values in Tianjin (n = 57, p < 0.01). In general, CO2 emissions from river ecosystems were mainly dominated by pCO2 levels at the air–water interface and gas transfer velocity [4,5,14]. As shown above, variations in averaged CO2 fluxes in river waters were higher in sewage waters and urban rivers while lower in lakes and rural rivers, illustrating the stronger effects of carbon/nitrogen concentrations on CO2 emissions in this study. CO2 fluxes from other river waters (rural rivers, urban rivers, and lakes) around the world are exhibited in Table 3. CO2 fluxes in urban rivers in Tianjin were estimated to be marginally lower than those in highly polluted eutrophic rivers [25,46], while significantly higher than those in other rural rivers [9,25,47]. CO2 fluxes in sewage waters exhibited extremely high levels compared with those of natural rivers. The annual CO2 fluxes were estimated to be 1.08 × 10¹³ mmol (i.e., 1.08 × 10⁻⁴ Pg C) according to the water area of the Tianjin River network (with 884 km2) [22], which was a major source of atmospheric CO2. Despite the fact that projected values of CO2 emissions in this study were lower than global CO2 emissions from river ecosystems (1.80 Pg C·yr−1 from rivers and 0.32 Pg C·yr−1 from lakes) [5,6], the vast water area around the world should be given more consideration when considering the effects of CO2 emissions from water.
Table 3.
Fluxes of CO2 in other rivers/lakes.
5. Conclusions
The study revealed the impacts of urbanization and nitrogen pollution on CO2 emissions and production in river networks in Tianjin. Increasing sewage effluent and pollutant discharge in river ecosystems dramatically altered the environmental conditions, potentially triggering biochemical processes and CO2 production. The spatial distributions of CO2 emissions presented obvious differences mainly attributed to the complexity of sources of sewage-draining waters altering biological processes in river waters. Urban rivers and sewage waters exhibited higher pCO2 and CO2 fluxes than rural rivers and lakes, which might be dominated by the enhanced biochemical processes of respiration with higher carbon/nitrogen concentrations. Sampling sites with unsaturated pCO2 levels in lakes and urban rivers were mainly controlled by photosynthesis and organic degradation. The correlations between pCO2 and organic carbon/nitrogen demonstrated that nutrient accumulation stimulated microbial activities, and the reception of wastewaters could enhance pCO2 levels. We highlighted the correlations between pCO2 and carbon/nitrogen species in a regional river network and provided a theoretical basis for water management when considering CO2 emissions under dramatic anthropogenic activities.
Author Contributions
Conceptualization, X.L.; Data curation, X.L. and L.B.; Investigation, X.L., G.H., J.L. and Y.W.; Methodology, Y.H., G.H., J.L. and Y.W.; Software, Y.H.; Writing—original draft, Y.H.; Writing—review and editing, X.L. and L.B. All authors have read and agreed to the published version of the manuscript.
Funding
This research was funded by the National Natural Science Foundation of China (Grant Nos. 41661144029, 41672351) and Science and Technology Fundamental Resources Investigation Program of China (Grant No. 2021FY101000).
Institutional Review Board Statement
Not applicable.
Informed Consent Statement
Not applicable.
Data Availability Statement
The datasets used or analyzed during the current study are available from the corresponding author on reasonable request.
Acknowledgments
The authors gratefully acknowledge Sainan Chen from Tianjin University for assistance with field sampling, as well as Xin Lv and Jie Kang from Tianjin Normal University for laboratory analysis.
Conflicts of Interest
The authors declare no conflict of interest.
References
- Bousquet, P.; Peylin, P.; Ciais, P.; Le Quéré, C.; Friedlingstein, P.; Tans, P.P. Regional Changes in Carbon Dioxide Fluxes of Land and Oceans Since 1980. Science 2000, 290, 1342–1346. [Google Scholar] [CrossRef] [PubMed]
- Richey, J.E.; Melack, J.M.; Aufdenkampe, A.K.; Ballester, V.M.; Hess, L.L. Outgassing from Amazonian Rivers and Wetlands as a Large Tropical Source of Atmospheric CO2. Nature 2002, 416, 617–620. [Google Scholar] [CrossRef] [PubMed]
- Duvert, C.; Butman, D.E.; Marx, A.; Ribolzi, O.; Hutley, L.B. CO2 Evasion Along Streams Driven by Groundwater Inputs and Geomorphic Controls. Nat. Geosci. 2018, 11, 813–818. [Google Scholar] [CrossRef]
- Cole, J.J.; Caraco, N.F.; Kling, G.W.; Kratz, T.K. Carbon Dioxide Supersaturation in the Surface Waters of Lakes. Science 1994, 265, 1568–1570. [Google Scholar] [CrossRef] [PubMed]
- Raymond, P.A.; Hartmann, J.; Lauerwald, R.; Sobek, S.; McDonald, C.; Hoover, M.; Butman, D.; Striegl, R.; Mayorga, E.; Humborg, C.; et al. Global Carbon Dioxide Emissions from Inland Waters. Nature 2013, 503, 355–359. [Google Scholar] [CrossRef] [PubMed]
- DelSontro, T.; Beaulieu, J.J.; Downing, J.A. Greenhouse Gas Emissions from Lakes and Impoundments: Upscaling in the Face of Global Change. Limnol. Oceanogr. Lett. 2018, 3, 64–75. [Google Scholar] [CrossRef] [PubMed]
- Alin, S.R.; de Fátima FL Rasera, M.; Salimon, C.I.; Richey, J.E.; Holtgrieve, G.W.; Krusche, A.V.; Snidvongs, A. Physical Controls on Carbon Dioxide Transfer Velocity and Flux in Low-Gradient River Systems and Implications for Regional Carbon Budgets. J. Geophys. Res. 2011, 116, G01009. [Google Scholar] [CrossRef]
- Amaral, V.; Ortega, T.; Romera-Castillo, C.; Forja, J. Linkages between Greenhouse Gases (CO2, CH4, and N2O) and Dissolved Organic Matter Composition in a Shallow Estuary. Sci. Total Environ. 2021, 788, 147863. [Google Scholar] [CrossRef]
- Li, S.L.; Wang, F.S.; Zhou, T.; Cheng, T.Y.; Wang, B.L. Carbon Dioxide Emissions from Cascade Hydropower Reservoirs along the Wujiang River, China. Inland Waters 2018, 8, 157–166. [Google Scholar] [CrossRef]
- Xue, H.; Yu, R.; Zhang, Z.; Qi, Z.; Lu, X.; Liu, T.; Gao, R. Greenhouse Gas Emissions from the Water–Air Interface of a Grassland River: A Case Study of the Xilin River. Sci. Rep. 2021, 11, 2659. [Google Scholar]
- Chanda, A.; Das, S.; Bhattacharyya, S.; Akhand, A.; Das, I.; Samanta, S.; Choudhury, S.B.; Hazra, S. pCO2 Effluxes from an Urban Tidal River Flowing through Two of the Most Populated and Polluted Cities of India. Environ. Sci. Pollut. Res. 2020, 27, 30093–30107. [Google Scholar] [CrossRef] [PubMed]
- Butman, D.; Raymond, P.A. Significant Efflux of Carbon Dioxide from Streams and Rivers in the United States. Nat. Geosci. 2011, 4, 839–842. [Google Scholar] [CrossRef]
- Abril, G.; Borges, A.V. Carbon Dioxide and Methane Emissions from Estuaries. In Greenhouse Gas Emissions—Fluxes and Processes; Springer: Berlin/Heidelberg, Germany, 2005; pp. 187–207. [Google Scholar]
- Sunda, W.G.; Cai, W.J. Eutrophication Induced CO2-Acidification of Subsurface Coastal Waters: Interactive Effects of Temperature, Salinity, and Atmospheric pCO2. Environ. Sci. Technol. 2012, 46, 10651–10659. [Google Scholar] [CrossRef] [PubMed]
- Liu, X.L.; Han, G.L.; Zeng, J.; Liu, J.K.; Li, X.Q.; Boeckx, P. The Effects of Clean Energy Production and Urbanization on Sources and Transformation Processes of Nitrate in a Subtropical River System: Insights from the Dual Isotopes of Nitrate and Bayesian Model. J. Clean. Prod. 2021, 325, 129317. [Google Scholar] [CrossRef]
- Liu, J.K.; Han, G.L. Tracing Riverine Particulate Black Carbon Sources in Xijiang River Basin: Insight from Stable Isotopic Composition and Bayesian Mixing Model. J. Hydrol. 2021, 194, 116932. [Google Scholar] [CrossRef]
- Liu, M.; Han, G.L.; Zhang, Q. Effects of Agricultural Abandonment on Soil Aggregation, Soil Organic Carbon Storage and Stabilization: Results from Observation in a Small Karst Catchment, Southwest China. Agric. Ecosyst. Environ. 2020, 288, 106719. [Google Scholar] [CrossRef]
- Tang, W.; Xu, Y.J.; Li, S.Y. Rapid Urbanization Effects on Partial Pressure and Emission of CO2 in Three Rivers with Different Urban Intensities. Ecol. Indic. 2021, 125, 107515. [Google Scholar] [CrossRef]
- Laruelle, G.G.; Dürr, H.H.; Slomp, C.P.; Borges, A.V. Evaluation of Sinks and Sources of CO2 in the Global Coastal Ocean Using a Spatially-Explicit Typology of Estuaries and Continental Shelves. Geophys. Res. Lett. 2010, 37, L15607. [Google Scholar] [CrossRef]
- Sun, H.Y.; Lu, X.X.; Yu, R.H.; Yang, J.; Liu, X.Y.; Cao, Z.X.; Zhang, Z.Z.; Li, M.X.; Geng, Y. Eutrophication Decreased CO2 but Increased CH4 Emissions from Lake: A Case Study of a Shallow Lake Ulansuhai. Water Res. 2021, 201, 117363. [Google Scholar] [CrossRef]
- Cotovicz, L.C.; Ribeiro, R.P.; Regis, C.R.; Bernardes, M.; Sobrinho, R.; Vidal, L.O.; Tremmel, D.; Knoppers, B.A.; Abril, G. Greenhouse Gas Emissions (CO2 and CH4) and Inorganic Carbon Behavior in an Urban Highly Polluted Tropical Coastal Lagoon (SE, Brazil). Environ. Sci. Pollut. Res. 2021, 28, 38173–38192. [Google Scholar] [CrossRef]
- Liu, X.L.; Bai, L.; Wang, Z.L.; Li, J.; Yue, F.J.; Li, S.L. Nitrous Oxide Emissions from River Network with Variable Nitrogen Loading in Tianjin, China. J. Geochem. Explor. 2015, 157, 153–161. [Google Scholar] [CrossRef]
- Abril, G.; Martinez, J.M.; Artigas, L.F.; Moreira-Turcq, P.; Benedetti, M.F.; Vidal, L.; Meziane, T.; Kim, J.H.; Bernardes, M.C.; Savoye, N.; et al. Amazon River Carbon Dioxide Outgassing Fuelled by Wetlands. Nature 2014, 505, 395–398. [Google Scholar] [CrossRef]
- Liu, J.K.; Han, G.L. Effects of Chemical Weathering and CO2 Outgassing on Delta δ13C-DIC Signals in a Karst Watershed. J. Hydrol. 2020, 589, 125192. [Google Scholar] [CrossRef]
- Wang, J.L.; Wang, X.F.; Liu, T.T.; Yuan, X.Z.; Chen, H.; He, Y.X.; Wu, S.N.; Yuan, Z.; Li, H.; Que, Z.Y.; et al. pCO2 and CO2 Evasion from Two Small Suburban Rivers: Implications of the Watershed Urbanization Process. Sci. Total Environ. 2021, 788, 147787. [Google Scholar] [CrossRef]
- Abril, G.; Bouillon, S.; Darchambeau, F.; Teodoru, C.R.; Marwick, T.R.; Tamooh, F.; Ochieng, O.; Geeraert, N.; Deirmendjian, L.; Polsenaere, P.; et al. Technical Note: Large Overestimation of pCO2 Calculated from pH and Alkalinity in Acidic, Organic-Rich Freshwaters. Biogeosciences 2015, 12, 67–78. [Google Scholar] [CrossRef]
- Wang, F.S.; Wang, B.L.; Liu, C.Q.; Wang, Y.C.; Guan, J.; Liu, X.L.; Yu, Y.X. Carbon Dioxide Emission from Surface Water in Cascade Reservoirs-River System on the Maotiao River, Southwest of China. Atmos. Environ. 2011, 45, 3827–3834. [Google Scholar] [CrossRef]
- Wallin, M.B.; Grabs, T.; Buffam, I.; Laudon, H.; Ågren, A.; Öquist, M.G.; Bishop, K.J. Evasion of CO2 from Streams–the Dominant Component of the Carbon Export through the Aquatic Conduit in a Boreal Landscape. GCB Bioenergy 2013, 19, 785–797. [Google Scholar]
- Crusius, J.; Wanninkhof, R. Gas Transfer Velocities Measured at Low Wind Speed over a Lake. Am. Soc. Limnol. Oceanogr. 2003, 48, 1010–1017. [Google Scholar] [CrossRef]
- Raymond, P.A.; Cole, J.J. Gas Exchange in Rivers and Estuaries: Choosing a Gas Transfer Velocity. Estuaries 2001, 24, 312–317. [Google Scholar] [CrossRef]
- Wanninkhof, R. Relationship between Wind Speed and Gas Exchange over the Ocean. J. Geophys. Res. 1992, 97, 7373–7382. [Google Scholar] [CrossRef]
- Cole, J.J.; Prairie, Y.T.; Caraco, N.F.; McDowell, W.H.; Tranvik, L.J.; Striegl, R.G.; Duarte, C.M.; Kortelainen, P.; Downing, J.A.; Middelburg, J.J.; et al. Plumbing the Global Carbon Cycle: Integrating Inland Waters into the Terrestrial Carbon Budget. Ecosystems 2007, 10, 172–185. [Google Scholar] [CrossRef]
- Hu, B.B.; Wang, D.Q.; Zhou, J.; Meng, W.Q.; Li, C.W.; Sun, Z.B.; Guo, X.; Wang, Z.L. Greenhouse Gases Emission from the Sewage Draining Rivers. Sci. Total Environ. 2018, 612, 1454–1462. [Google Scholar] [CrossRef]
- Luo, J.C.; Li, S.Y.; Ni, M.F.; Zhang, J. Large Spatiotemporal Shifts of CO2 Partial Pressure and CO2 Degassing in a Monsoonal Headwater Stream. J. Hydrol. 2019, 579, 124–135. [Google Scholar] [CrossRef]
- Arndt, S.; Jorgensen, B.B.; LaRowe, D.E.; Middelburg, J.J.; Pancost, R.D.; Regnier, P. Quantifying the Degradation of Organic Matter in Marine Sediments: A Review and Synthesis. Earth-Sci. Rev. 2013, 123, 53–86. [Google Scholar] [CrossRef]
- Han, G.L.; Tang, Y.; Liu, M.; Van Zwieten, L.; Yang, X.M.; Yu, C.X.; Wang, H.L.; Song, Z.L. Carbon-Nitrogen Isotope Coupling of Soil Organic Matter in a Karst Region under Land Use Change, Southwest China. Agric. Ecosyst. Environ. 2020, 301, 107027. [Google Scholar] [CrossRef]
- Cotovicz, L.C., Jr.; Vidal, L.O.; de Rezende, C.E.; Bernardes, M.C.; Knoppers, B.A.; Sobrinho, R.L.; Cardoso, R.P.; Muniz, M.; dos Anjos, R.M.; Biehler, A.; et al. Carbon Dioxide Sources and Sinks in the Delta of the Paraíba DO Sul River (Southeastern Brazil) Modulated by Carbonate Thermodynamics, Gas Exchange and Ecosystem Metabolism During Estuarine Mixing. Int. J. Infect. Dis. 2020, 226, 103869. [Google Scholar] [CrossRef]
- Reiman, J.; Xu, Y.J. Dissolved Carbon Export and CO2 Outgassing from the Lower Mississippi River–Implications of Future River Carbon Fluxes. J. Hydrol. 2019, 578, 124093. [Google Scholar] [CrossRef]
- Larsen, S.; Andersen, T.; Hessen, D.O. The pCO2 in Boreal Lakes: Organic Carbon as a Universal Predictor? Glob. Biogeochem. Cycles 2011, 25, GB2012. [Google Scholar] [CrossRef]
- Liu, X.L.; Han, G.L.; Zeng, J.; Liu, M.; Li, X.Q.; Boeckx, P. Identifying the Sources of Nitrate Contamination Using a Combined Dual Isotope, Chemical and Bayesian Model Approach in a Tropical Agricultural River: Case Study in the Mun River, Thailand. Sci. Total Environ. 2021, 760, 143938. [Google Scholar] [CrossRef]
- Hou, Y.M.; Liu, X.L.; Chen, S.N.; Ren, J.; Bai, L.; Li, J.; Gu, Y.B.; Wei, L. Effects of Seasonal Thermal Stratification on Nitrogen Transformation and Diffusion at the Sediment-Water Interface in a Deep Canyon Artificial Reservoir of Wujiang River Basin. Water 2021, 13, 3194. [Google Scholar] [CrossRef]
- Yoon, T.K.; Jin, H.; Begum, M.S.; Kang, N.; Park, J. CO2 Outgassing from an Urbanized River System Fueled by Wastewater Treatment Plant Effluents. Environ. Sci. Technol. 2017, 51, 10459–10467. [Google Scholar] [CrossRef] [PubMed]
- Cheng, C.; Sun, T.Y.; Li, H.J.; He, Q.; Pavlostathis, S.G.; Zhang, J. New Insights in Correlating Greenhouse Gas Emissions and Microbial Carbon and Nitrogen Transformations in Wetland Sediments Based on Genomic and Functional Analysis. J. Environ. Manag. 2021, 297, 113280. [Google Scholar] [CrossRef] [PubMed]
- Wang, X.; Tian, Y.; Liu, H.; Zhao, X.; Peng, S.J. The Influence of Incorporating Microbial Fuel Cells on Greenhouse Gas Emissions from Constructed Wetlands. Sci. Total Environ. 2019, 656, 270–279. [Google Scholar] [CrossRef] [PubMed]
- Williams, C.J.; Frost, P.C.; Williams, A.M.; Larson, J.H.; Richardson, W.B.; Chiandet, A.S.; Xenopoulos, M.A. Human Activities Cause Distinct Dissolved Organic Matter Composition across Freshwater Ecosystems. GCB Bioenergy 2016, 22, 613–626. [Google Scholar] [CrossRef] [PubMed]
- Le, T.P.Q.; Marchand, C.; Ho, C.T.; Le, N.D.; Duong, T.T.; Lu, X.X.; Doan, P.K.; Nguyen, T.K.; Nguyen, T.M.H.; Vu, D.A. CO2 Partial Pressure and CO2 Emission Along the Lower Red River (Vietnam). Biogeosciences 2018, 15, 4799–4814. [Google Scholar] [CrossRef]
- Krickov, I.V.; Serikova, S.; Pokrovsky, O.S.; Vorobyev, S.N.; Lim, A.G.; Siewert, M.B.; Karlsson, J. Sizable Carbon Emission from the Floodplain of Ob River. Ecol. Indic. 2021, 131, 108164. [Google Scholar] [CrossRef]
- Crawford, J.T.; Striegl, R.G.; Wickland, K.P.; Dornblaser, M.M.; Stanley, E.H. Emissions of Carbon Dioxide and Methane from a Headwater Stream Network of Interior Alaska. J. Geophys. Res. Biogeosci. 2013, 118, 482–494. [Google Scholar] [CrossRef]
- Demarty, M.; Tremblay, A. Long Term Follow-up of pCO2, pCH4 and Emissions from Eastmain 1 Boreal Reservoir, and the Rupert Diversion Bays, Canada. Ecohydrol. Hydrobiol. 2019, 19, 529–540. [Google Scholar] [CrossRef]
Publisher’s Note: MDPI stays neutral with regard to jurisdictional claims in published maps and institutional affiliations. |
© 2022 by the authors. Licensee MDPI, Basel, Switzerland. This article is an open access article distributed under the terms and conditions of the Creative Commons Attribution (CC BY) license (https://creativecommons.org/licenses/by/4.0/).