
Machine Learning and Criminal Justice: A Systematic Review of Advanced Methodology for Recidivism Risk Prediction

 , , and
Abstract
:1. Introduction
2. Materials and Methods
2.1. Eligibility Criteria
2.2. Information Sources and Search Strategy
2.3. Assessment of Risk of Bias
3. Results
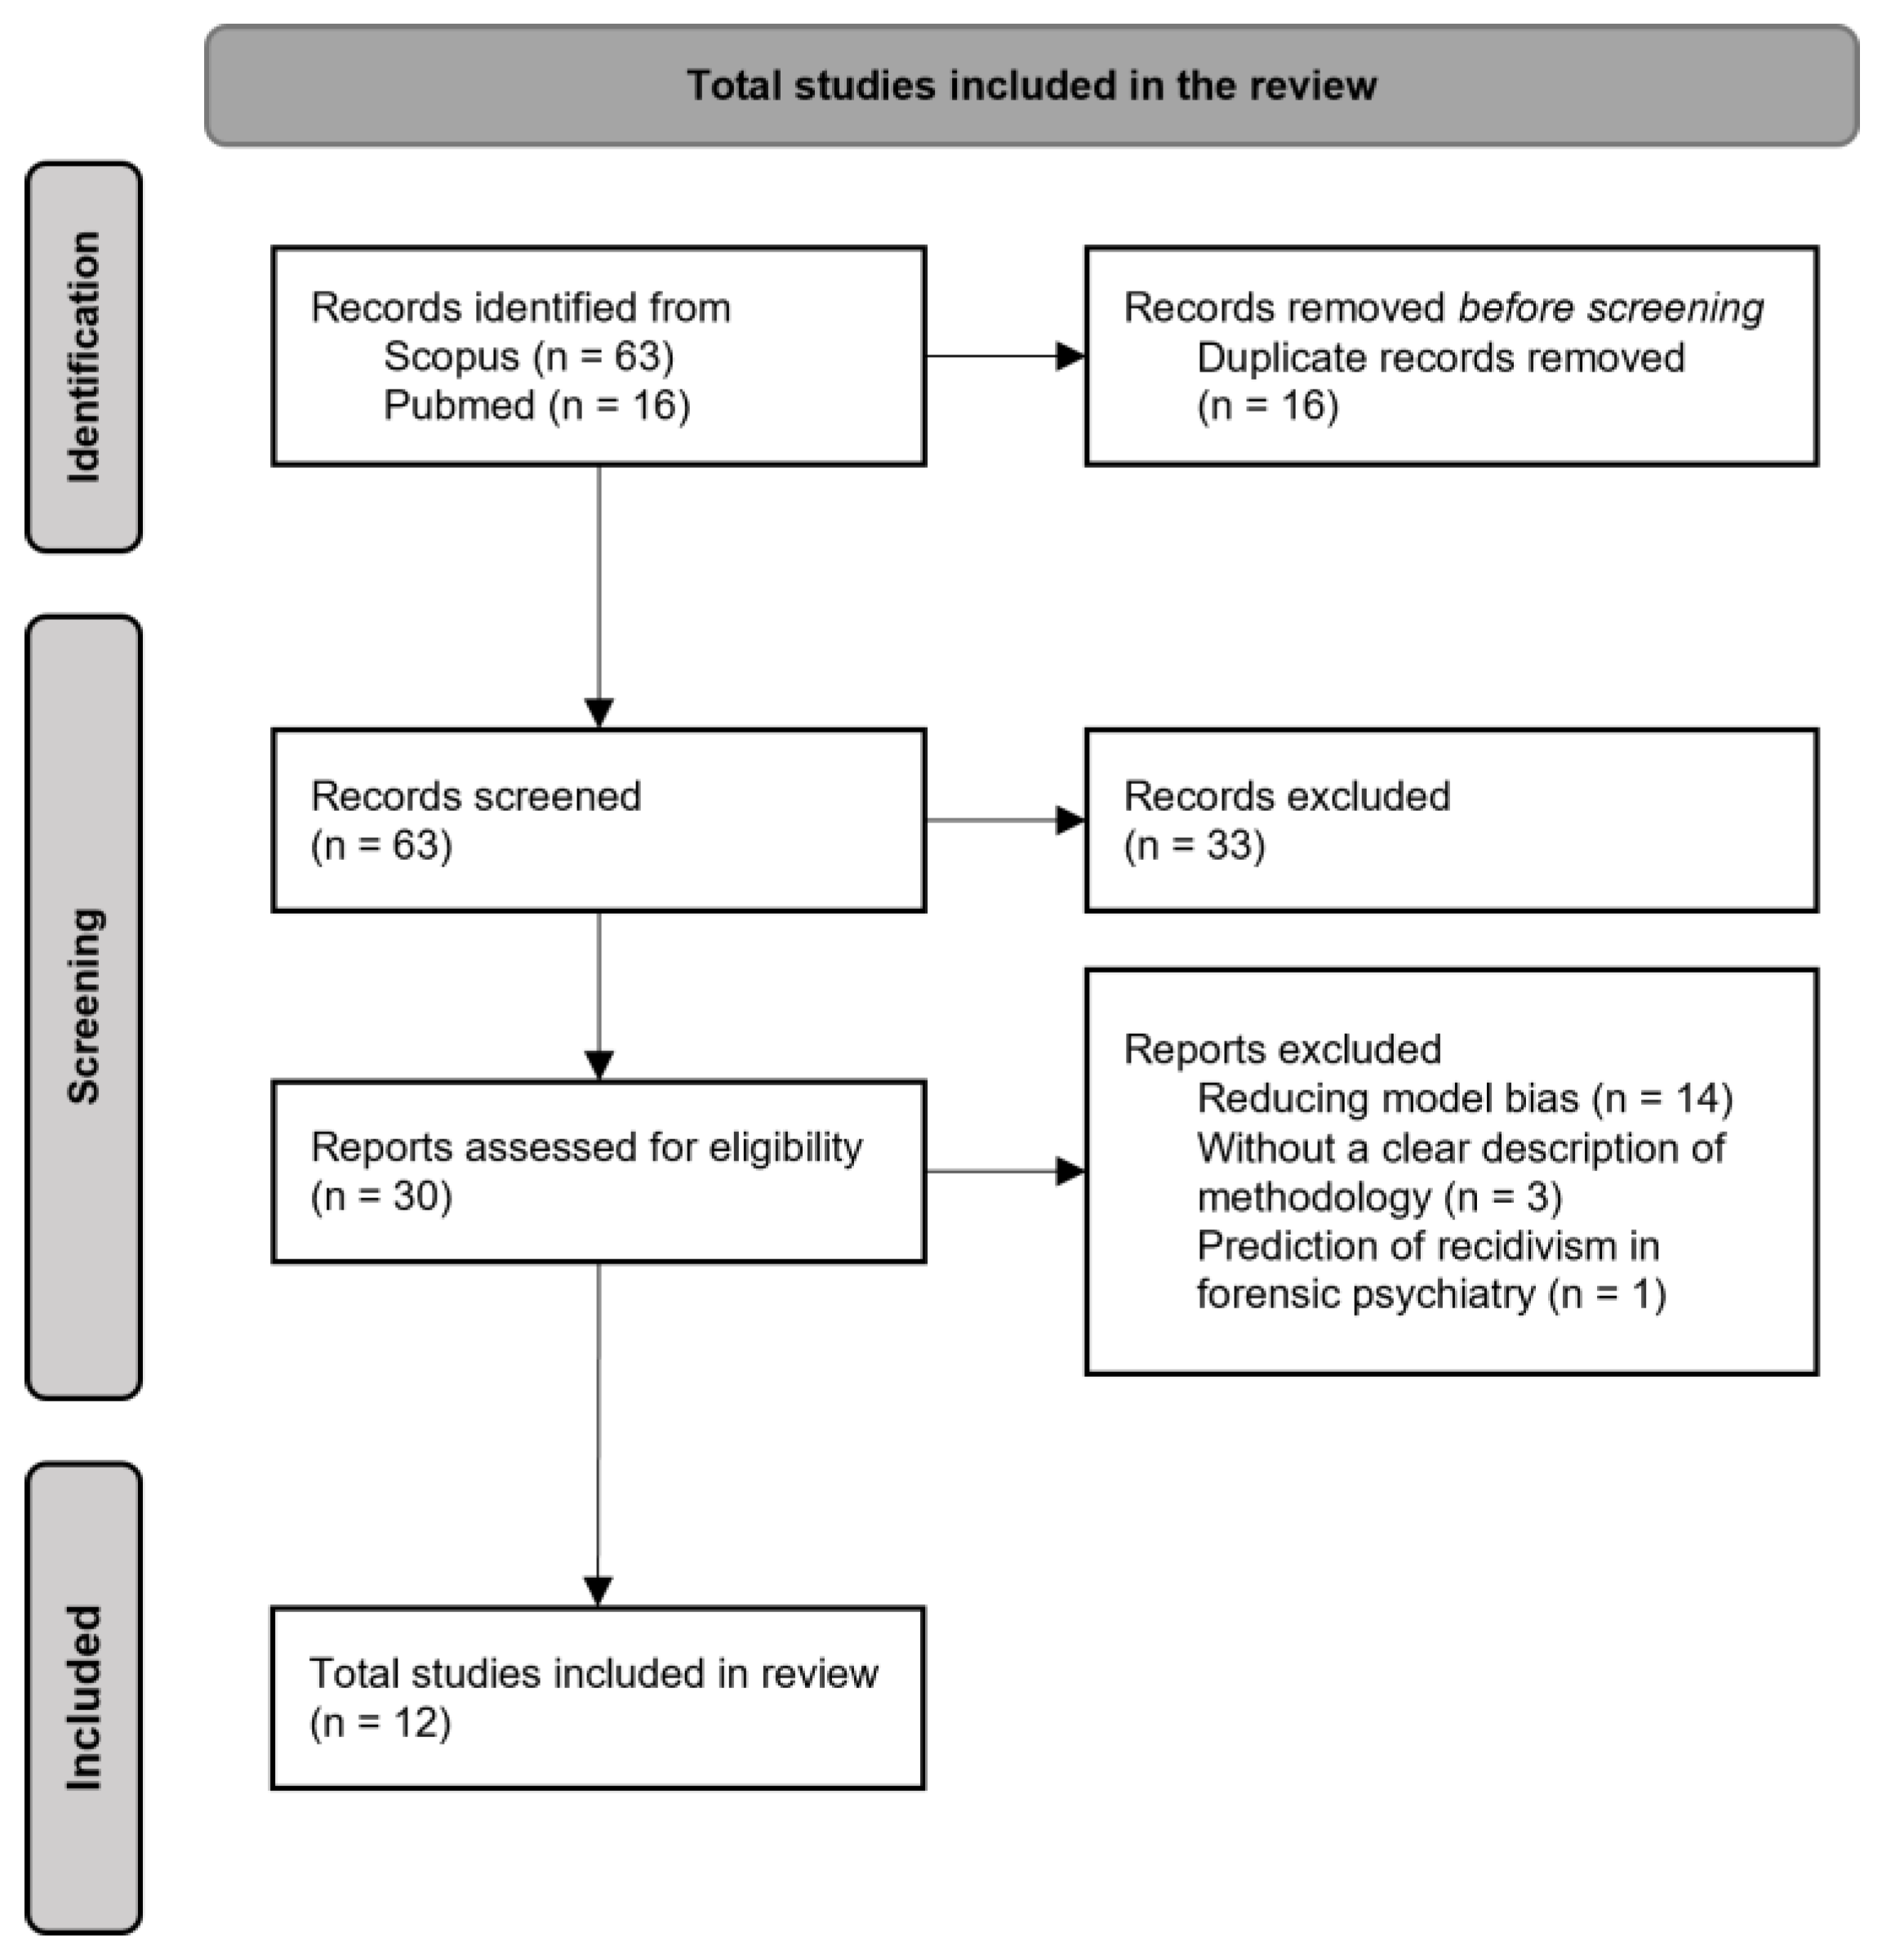
3.1. Study Selection
- The purpose of fourteen papers was to reduce model bias;
- One paper assessed only the psychiatric characteristic of repeat offenders;
- Three papers did not clearly describe the methodology.
3.2. Study Characteristics
3.3. Characteristics of Dataset and ML Techniques
3.4. Aim of the Studies and ML Model Applied
3.5. Results of Syntheses

| StatRec | DOI | |
|---|---|---|
| ACC | 0.96 | 0.96 |
| AUC | 0.73 | 0.77 |
| RisCanvi | StatRec | DOI | |
|---|---|---|---|
| ACC | 0.78 | 0.78 | |
| AUC | 0.78 | 0.74 | 0.74 |
| Thailand | FDJJ | RITA+ | YLS/CMI | SAVRY+ | |
|---|---|---|---|---|---|
| ACC | 0.90 | 0.65 | |||
| AUC | 0.71 | 0.78 | 0.69 | 0.71 |
3.6. Factors Involved in Predicting Recidivism
3.7. Reporting Biases
4. Discussion
5. Conclusions
Author Contributions
Funding
Institutional Review Board Statement
Informed Consent Statement
Data Availability Statement
Conflicts of Interest
References
- Newton, A.; May, X.; Eames, S.; Ahmad, M. Economic and Social Costs of Reoffending Analytical Report. Available online: https://assets.publishing.service.gov.uk/government/uploads/system/uploads/attachment_data/file/814650/economic-social-costs-reoffending.pdf (accessed on 18 June 2022).
- Fazel, S.; Wolf, A. A systematic review of criminal recidivism rates worldwide: Current difficulties and recommendations for best practice. PLoS ONE 2015, 10, e0130390. [Google Scholar] [CrossRef] [PubMed]
- Waller, M.A.; Fawcett, S.E. Data science, predictive analytics, and big data: A revolution that will transform supply chain design and management. J. Bus. Logist. 2013, 34, 77–84. [Google Scholar] [CrossRef]
- Linthicum, K.P.; Schafer, K.M.; Ribeiro, J.D. Machine learning in suicide science: Applications and ethics. Behav. Sci. Law 2019, 37, 214–222. [Google Scholar] [CrossRef] [PubMed]
- Bernert, R.A.; Hilberg, A.M.; Melia, R.; Kim, J.P.; Shah, N.H.; Abnousi, F. Artificial intelligence and suicide prevention: A systematic review of machine learning investigations. Int. J. Environ. Health Res. 2020, 17, 5929. [Google Scholar] [CrossRef] [PubMed]
- Borden, H.G. Factors for Predicting Parole Success. J. Crim. Law Criminol. 1928, 19, 328–336. [Google Scholar] [CrossRef]
- Breiman, L. Statistical modeling: The two cultures. Stat. Sci. 2001, 16, 199–231. [Google Scholar] [CrossRef]
- Berk, R.; Sherman, L.; Barnes, G.; Kurtz, E.; Ahlman, L. Forecasting murder within a population of probationers and parolees: A high stakes application of statistical learning. J. R. Stat. Soc. 2009, 172, 191–211. [Google Scholar] [CrossRef]
- Gottfredson, S.D.; Moriarty, L.J. Statistical risk assessment: Old problems and new applications. J. Res. Crime Delinq. 2006, 52, 178–200. [Google Scholar] [CrossRef]
- Berk, R. Criminal Justice Forecasts of Risk: A Machine Learning Approach; Springer: New York, NY, USA, 2012. [Google Scholar]
- Skeem, J.L.; Monahan, J. Risk Redux: The Resurgence of Risk Assessment in Criminal Sanctioning. Va Law Rev. 2014, 26, 2013–2036. [Google Scholar]
- Tonry, M. Legal and Ethical Issues in the Prediction of Recidivism. Fed. Sentencing Rep. 2014, 26, 167–176. [Google Scholar] [CrossRef]
- Rees, M. On the Future; Princeton University Press: Princeton, NJ, USA, 2018. [Google Scholar]
- Fortes, P.R.B. Paths to Digital Justice: Judicial Robots, Algorithmic Decision-Making, and Due Process. Asian J. Law Soc. 2020, 7, 453–469. [Google Scholar] [CrossRef]
- Singh, J.P.; Desmarais, S.L.; Hurducas, C.; Arbach-Lucioni, K.; Condemarin, C.; Dean, K.; Doyle, M.; Folino, J.O.; Godoy-Cervera, V.; Grann, M.; et al. International Perspectives on the Practical Application of Violence Risk Assessment: A Global Survey of 44 Countries. Int. J. Forensic Ment. Health 2014, 13, 193–206. [Google Scholar] [CrossRef]
- Kleinberg, J.; Mullainathan, S.; Raghavan, M. Inherent trade-offs in the fair determination of risk scores. In Proceedings of the Innovations in Theoretical Computer Science, San Francisco, CA, USA, 9–11 January 2017. [Google Scholar]
- Bansak, K. Can nonexperts really emulate statistical learning methods? A comment on “The accuracy, fairness, and limits of predicting recidivism”. Political Anal. 2019, 27, 370–380. [Google Scholar] [CrossRef]
- Bublitz, C.; Wolkenstein, A.; Jox, R.J.; Friedrich, O. Legal liabilities of BCI-users: Responsibility gaps at the intersection of mind and machine? Int. J. Law Psychiatry 2019, 65, 101399. [Google Scholar] [CrossRef]
- Page, M.J.; McKenzie, J.E.; Bossuyt, P.M.; Boutron, I.; Hoffmann, T.C.; Mulrow, C.D.; Shamseer, L.; Tetzlaff, J.M.; Akl, E.A.; Brennan, S.E.; et al. The PRISMA 2020 statement: An updated guideline for reporting systematic reviews. BMJ 2021, 372, 71. [Google Scholar] [CrossRef]
- Whiting, P.; Savović, J.; Higgins, J.P.T.; Caldwell, D.M.; Reeves, B.C.; Shea, B.; Davies, P.; Kleijnen, J.; Churchill, R. ROBIS: A new tool to assess risk of bias in systematic reviews was developed. J. Clin. Epidemiol 2016, 69, 225–234. [Google Scholar] [CrossRef]
- Butsara, N.; Athonthitichot, P.; Jodpimai, P. Predicting recidivism to drug distribution using machine learning techniques. In Proceedings of the 17th International Conference on ICT and Knowledge Engineering, Bangkok, Thailand, 20–22 November 2019; pp. 1–5. [Google Scholar]
- Duwe, G.; Kim, K.D. Out with the Old and in with the New? An Empirical Comparison of Supervised Learning Algorithms to Predict Recidivism. Crim. Justice Policy Rev. 2017, 28, 570–600. [Google Scholar] [CrossRef]
- Ghasemi, M.; Anvari, D.; Atapour, M.; Stephen Wormith, J.; Stockdale, K.C.; Spiteri, R.J. The Application of Machine Learning to a General Risk–Need Assessment Instrument in the Prediction of Criminal Recidivism. Crim. Justice Behav. 2021, 48, 518–538. [Google Scholar] [CrossRef]
- Haarsma, G.; Davenport, S.; White, D.C.; Ormachea, P.A.; Sheena, E.; Eagleman, D.M. Assessing Risk among Correctional Community Probation Populations: Predicting Reoffense with Mobile Neurocognitive Assessment Software. Front. Psychol. 2020, 10, 2926. [Google Scholar] [CrossRef]
- Karimi-Haghighi, M.; Castillo, C. Enhancing a recidivism prediction tool with machine learning: Effectiveness and algorithmic fairness. In Proceedings of the 18th International Conference on Artificial Intelligence and Law, São Paulo, Brazil, 21–25 June 2021. [Google Scholar]
- Ozkan, T.; Clipper, S.J.; Piquero, A.R.; Baglivio, M.; Wolff, K. Predicting Sexual Recidivism. Sex Abuse 2020, 32, 375–399. [Google Scholar] [CrossRef]
- Salo, B.; Laaksonen, T.; Santtila, P. Predictive Power of Dynamic (vs. Static) Risk Factors in the Finnish Risk and Needs Assessment Form. Crim. Justice Behav. 2019, 46, 939–960. [Google Scholar] [CrossRef]
- Singh, A.; Mohapatra, S. Development of risk assessment framework for first time offenders using ensemble learning. IEEE Access 2021, 9, 135024–135033. [Google Scholar] [CrossRef]
- Ting, M.H.; Chu, C.M.; Zeng, G.; Li, D.; Chng, G.S. Predicting recidivism among youth offenders: Augmenting professional judgement with machine learning algorithms. J. Soc. Work. 2018, 18, 631–649. [Google Scholar] [CrossRef] [PubMed]
- Tolan, S.; Miron, M.; Gómez, E.; Castillo, C. Why machine learning may lead to unfairness: Evidence from risk assessment for juvenile justice in Catalonia. In Proceedings of the 17th International Conference on Artificial Intelligence and Law, Montreal, QC, Canada, 17–21 June 2019. [Google Scholar]
- Tollenaar, N.; van der Heijden, P.G.M. Which method predicts recidivism best?: A comparison of statistical, machine learning and data mining predictive models. J. R. Stat. Soc. Ser. A Stat. Soc. 2013, 176, 565–584. [Google Scholar] [CrossRef]
- Tollenaar, N.; Van Der Heijden, P.G.M. Optimizing predictive performance of criminal recidivism models using registration data with binary and survival outcomes. PLoS ONE 2019, 14, e0213245. [Google Scholar] [CrossRef]
- Liu, Y.Y.; Yang, M.; Ramsay, M.; Li, X.S.; Coid, J.W. A Comparison of Logistic Regression, Classification and Regression Tree, and Neural Networks Models in Predicting Violent Re-Offending. J. Quant. Criminol. 2011, 27, 547–573. [Google Scholar] [CrossRef]
- Gendreau, P.; Little, T.; Goggin, C. A meta-analysis of the predictors of adult offender recidivism: What works! Criminology 1996, 34, 575–608. [Google Scholar] [CrossRef]
- Ahmad, T.; Aziz, M.N. Data preprocessing and feature selection for machine learning intrusion detection systems. ICIC Express Lett. 2019, 13, 93–101. [Google Scholar]
- Dressel, J.; Farid, H. The accuracy, fairness, and limits of predicting recidivism. Sci. Adv. 2018, 4, eaao5580. [Google Scholar] [CrossRef]
- Scendoni, R.; Ribeiro, I.; Cingolani, M.; Giovagnoni, A.; Curzi, M.; Fedeli, P.; Cameriere, R. A new analytical cut-off point for determining 18 years of age using MRI on medial clavicular epiphysis. Leg. Med. 2022, 54, 102010. [Google Scholar] [CrossRef]
- Scendoni, R.; Cingolani, M.; Giovagnoni, A.; Fogante, M.; Fedeli, P.; Pigolkin, Y.I.; Ferrante, L.; Cameriere, R. Analysis of carpal bones on MR images for age estimation: First results of a new forensic approach. Forensic Sci. Int. 2020, 313, 110341. [Google Scholar] [CrossRef] [PubMed]
- Angelakopoulos, N.; Galić, I.; De Luca, S.; Campobasso, C.P.; Martino, F.; De Micco, F.; Coccia, E.; Cameriere, R. Skeletal age assessment by measuring planar projections of carpals and distal epiphyses of ulna and radius bones in a sample of South African subadults. Aust. J. Forensic Sci. 2022, 54, 75–87. [Google Scholar] [CrossRef]
- Khademi, A.; Honavar, V. Algorithmic Bias in Recidivism Prediction: A Causal Perspective. In Proceedings of the AAAI 2020-34th AAAI Conference on Artificial Intelligence, New York, NY, USA, 7–12 February 2020. [Google Scholar]
- Abrams, D.S.; Bertrand, M.; Mullainathan, S. Do judges vary in their treatment of race? J. Leg. Stud. 2012, 41, 347–384. [Google Scholar] [CrossRef]
- De Micco, F.; Fineschi, V.; Banfi, G.; Frati, P.; Oliva, A.; Travaini, G.V.; Picozzi, M.; Curcio, G.; Pecchia, L.; Petitti, T.; et al. From COVID-19 Pandemic to Patient Safety: A New “Spring” for Telemedicine or a Boomerang Effect? Front. Med. 2022, 9, 901788. [Google Scholar] [CrossRef]
- European Commission for the Efficiency of Justice (CEPEJ). European Ethical Charter on the Use of Artificial Intelligence in Judicial Systems and Their Environment. Available online: https://rm.coe.int/ethical-charter-en-for-publication-4-december-2018/16808f699c (accessed on 18 June 2022).
- Gunning, D.; Aha, D.W. DARPA’s explainable artificial intelligence program. AI Mag. 2019, 40, 44–58. [Google Scholar]
- Janssen, M.; Kuk, G. The challenges and limits of big data algorithms in technocratic governance. Gov. Inf. Q. 2016, 33, 371–377. [Google Scholar] [CrossRef]
- Van Berkel, N.; Goncalves, J.; Hettiachchi, D.; Wijenayake, S.; Kelly, R.M.; Kostakos, V. Crowdsourcing perceptions of fair predictors for machine learning: A recidivism case study. In Proceedings of the ACM on Human-Computer Interaction, Paphos, Cyprus, 2–6 September 2019. [Google Scholar]
- Dodge, J.; Vera Liao, Q.; Zhang, Y.; Bellamy, R.K.E.; Dugan, C. Explaining models: An empirical study of how explanations impact fairness judgment. In Proceedings of the IUI ‘19: Proceedings of the 24th International Conference on Intelligent User Interfaces, Marina del Ray, CA, USA, 17–20 March 2019. [Google Scholar]
- Zanzotto, F.M. Human-in-the-loop Artificial Intelligence. J. Artif. Intell. Res. 2019, 64, 243–252. [Google Scholar] [CrossRef]
- De Micco, F.; De Benedictis, A.; Fineschi, V.; Frati, P.; Ciccozzi, M.; Pecchia, L.; Alloni, R.; Petrosillo, N.; Filippi, S.; Ghilardi, G.; et al. From Syndemic Lesson after COVID-19 Pandemic to a “Systemic Clinical Risk Management” Proposal in the Perspective of the Ethics of Job Well Done. Int. J. Environ. Res. Public Health 2022, 19, 15. [Google Scholar] [CrossRef]
- Sheridan, T. Human supervisory control of robot systems. In Proceedings of the IEEE International Conference on Robotics and Automation, San Francisco, CA, USA, 7–10 April 1986. [Google Scholar]
| Authors | Dataset Combined | ML Techniques |
|---|---|---|
| Butsara et al. (2019) [21] | Data by central correctional institution for drug addicts and central women correctional institution in Thailand | Data standardization + Feature selection and CV |
| Duwe and Kim (2017) [22] | Minnesota Screening Tool Assessing Recidivism Risk (MnSTARR) + Minnesota Sex Offender Screening Tool-3 (MnSOST-3) | CV |
| Ghasemi et al. (2021) [23] | Level of Service/Case Management Inventory (LS/CMI) | CV |
| Haarsma et al. (2020) [24] | NeuroCognitive Risk Assessment (NCRA) + demographic feature set | Feature selection + CV |
| Karimi-Haghighi and Castillo (2021) [25] | RisCanvi | CV |
| Ozkan et al. (2019) [26] | Florida Department of Juvenile Justice (FDJJ) | Feature selection |
| Salo et al. (2019) [27] | Finnish Risk and Needs Assessment Form (Riski-ja tarvearvio [RITA]) Finnish Prisoner Database + static predictors | CV |
| Singh and Mohapatra (2021) [28] | HCR-20 + clinical and non-clinical risk assessment factors | ANOVA + CV |
| Ting et al. (2018) [29] | Youth Level of Service/Case Management Inventory 2.0 (YLS/CMI) | |
| Tolan et al. (2019) [30] | Structured Assessment of Violence Risk in Youth (SAVRY) + static features | CV |
| Tollenaar et al. (2013) [31] | StatRec with Dutch Offender’s Index | |
| Tollenaar et al. (2019) [32] | Dutch Offender’s Index (DOI) | CV |
| Dataset | Type of Recurrence | Purpose | ML Model | Evaluation Metrics | Evaluation Value |
|---|---|---|---|---|---|
| Thailand | Other | Recidivism in drug distribution | Logistic Regression | ACC | 0.90 |
| MnSTARR+ | General | General recidivism | LogitBoost | ACC AUC | 0.82 0.78 |
| LS/CMI | General | General recidivism | Random Forest | ACC AUC | 0.74 0.75 |
| NCRA+ | General | General recidivism | Glmnet | AUC | 0.70 |
| RisCanvi | Violent | Violent Recidivism | MLP | AUC | 0.78 |
| FDJJ | Sexual | Sexual recidivism in Youth | Random Forest | AUC | 0.71 |
| RITA+ | Other | General and violent recidivism in male | Random Forest | AUC | 0.78 |
| HCR-20+ | General | General recidivism | Ensemble model with NBC, kNN, MLP, PNN, SVM | ACC | 0.87 |
| YLS/CMI | Other | General recidivism in Youth | Random Forest | ACC AUC | 0.65 0.69 |
| SAVRY+ | Other | Violent recidivism in youth | Logistic Regression | AUC | 0.71 |
| StatRec | General | General Recidivism | Logistic Regression | ACC AUC | 0.73 0.78 |
| Sexual | Sexual recidivism | LDA | ACC AUC | 0.96 0.73 | |
| Violent | Violent recidivism | Logistic regression | ACC AUC | 0.78 0.74 | |
| DOI | General | General recidivism | L1–Logistic Regression | ACC AUC | 0.78 0.73 |
| Sexual | Sexual recidivism | L1–Logistic Regression | ACC AUC | 0.96 0.77 | |
| Violent | Violent recidivism | Penalized LDA | ACC AUC | 0.78 0.74 |
| MnSTARR+ | LS/CMI | NCRA+ | HCR-20+ | StatRec | DOI | |
|---|---|---|---|---|---|---|
| ACC | 0.82 | 0.74 | 0.87 | 0.74 | 0.78 | |
| AUC | 0.78 | 0.75 | 0.70 | 0.78 | 0.73 |
| Phase 2 | Phase 3 | ||||
|---|---|---|---|---|---|
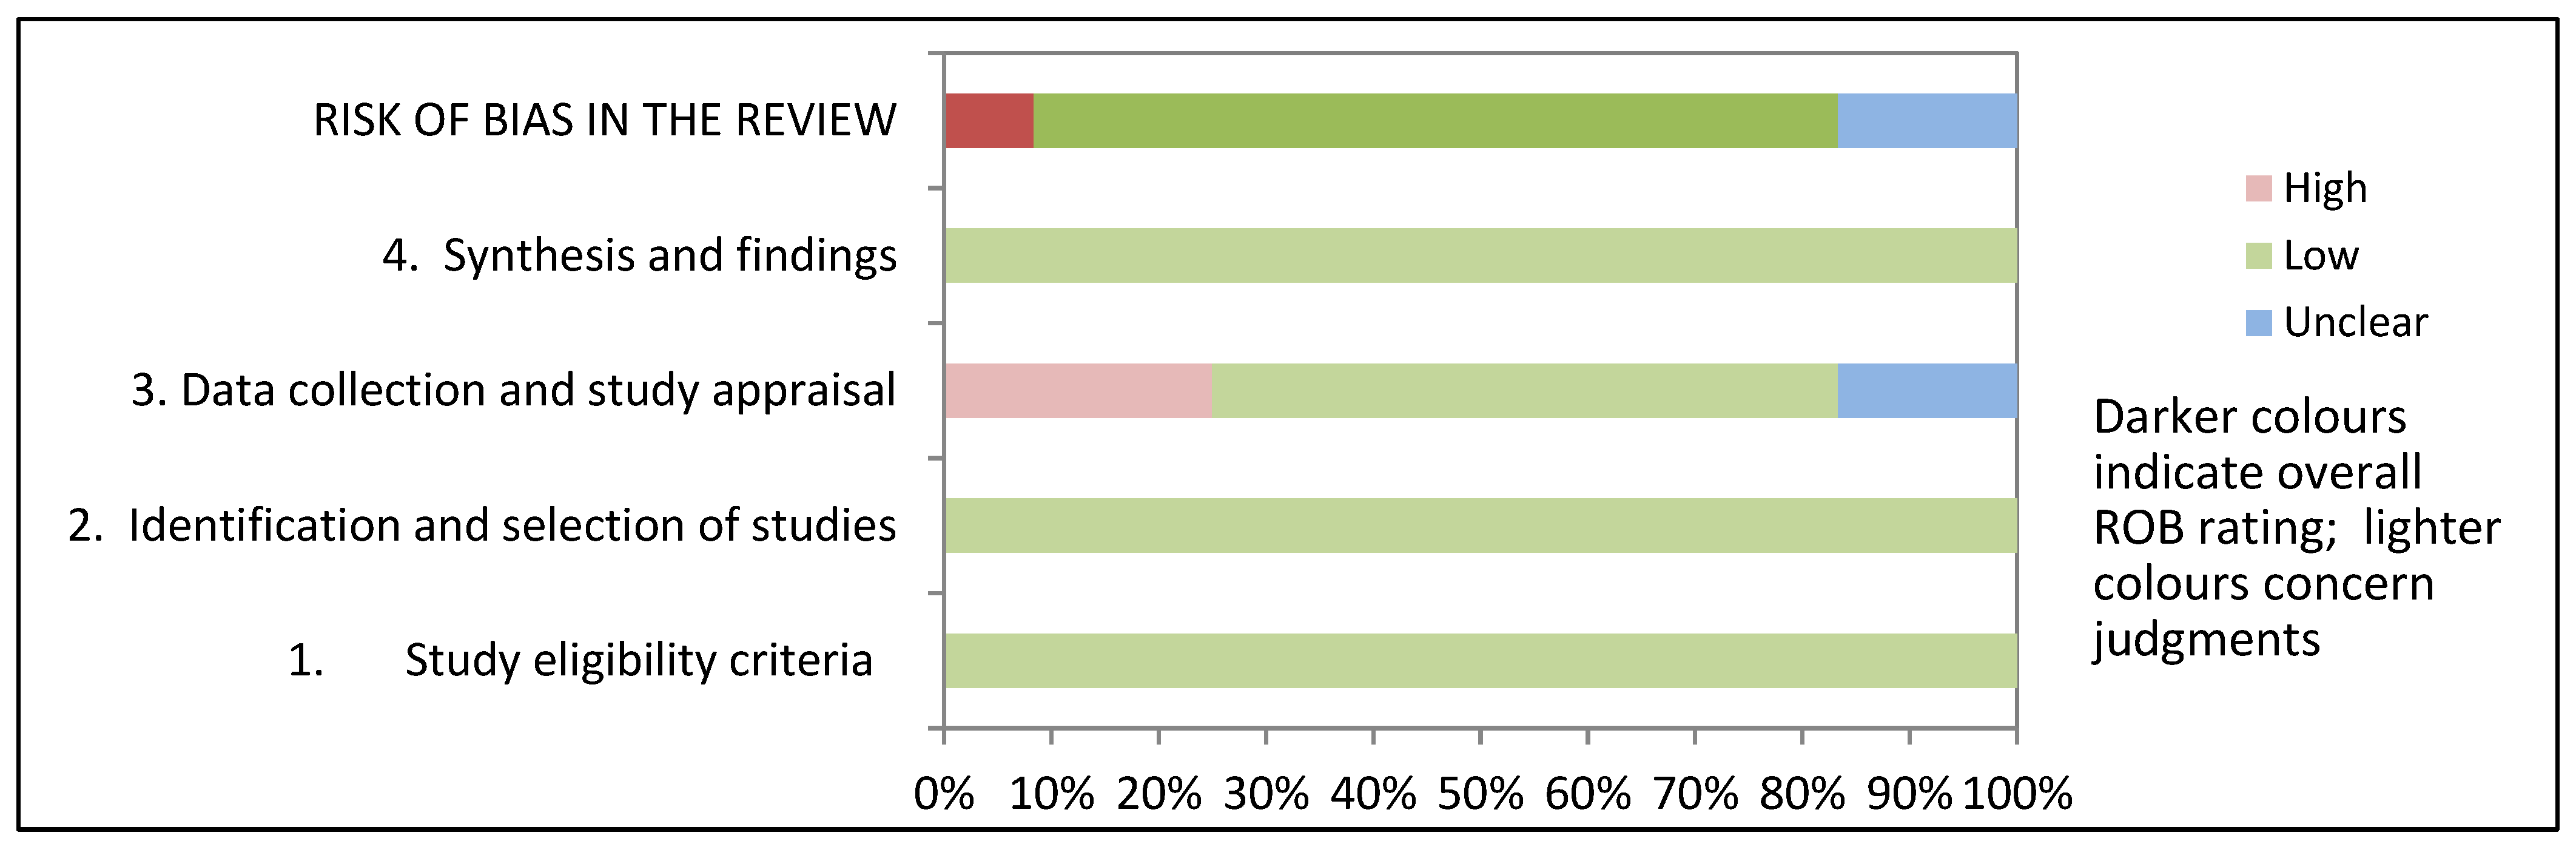
| Review (Name, Year) | 1. Study Eligibility Criteria | 2. Identification and Selection of Studies | 3. Data Collection and Study Appraisal | 4. Synthesis and Findings | Risk of Bias in the Review |
| Butsara et al. (2019) [21] | ☺ | ☺ | ☹ | ☺ | ☹ |
| Duwe and Kim (2017) [22] | ☺ | ☺ | ☺ | ☺ | ☺ |
| Ghasemi et al. (2021) [23] | ☺ | ☺ | ? | ☺ | ☺ |
| Haarsma et al. (2020) [24] | ☺ | ☺ | ☺ | ☺ | ☺ |
| Karimi-Haghighi and Castillo (2021) [25] | ☺ | ☺ | ☺ | ☺ | ☺ |
| Ozkan et al. (2019) [26] | ☺ | ☺ | ☹ | ☺ | ? |
| Salo et al. (2019) [27] | ☺ | ☺ | ? | ☺ | ☺ |
| Singh and Mohapatra (2021) [28] | ☺ | ☺ | ☺ | ☺ | ☺ |
| Ting et al. (2018) [29] | ☺ | ☺ | ☺ | ☺ | ☺ |
| Tolan et al. (2019) [30] | ☺ | ☺ | ☹ | ☺ | ? |
| Tollenaar et al. (2013) [31] | ☺ | ☺ | ☺ | ☺ | ☺ |
| Tollenaar et al. (2019) [32] | ☺ | ☺ | ☺ | ☺ | ☺ |
Publisher’s Note: MDPI stays neutral with regard to jurisdictional claims in published maps and institutional affiliations. |
© 2022 by the authors. Licensee MDPI, Basel, Switzerland. This article is an open access article distributed under the terms and conditions of the Creative Commons Attribution (CC BY) license (https://creativecommons.org/licenses/by/4.0/).
Share and Cite
Travaini, G.V.; Pacchioni, F.; Bellumore, S.; Bosia, M.; De Micco, F. Machine Learning and Criminal Justice: A Systematic Review of Advanced Methodology for Recidivism Risk Prediction. Int. J. Environ. Res. Public Health 2022, 19, 10594. https://doi.org/10.3390/ijerph191710594
Travaini GV, Pacchioni F, Bellumore S, Bosia M, De Micco F. Machine Learning and Criminal Justice: A Systematic Review of Advanced Methodology for Recidivism Risk Prediction. International Journal of Environmental Research and Public Health. 2022; 19(17):10594. https://doi.org/10.3390/ijerph191710594
Chicago/Turabian StyleTravaini, Guido Vittorio, Federico Pacchioni, Silvia Bellumore, Marta Bosia, and Francesco De Micco. 2022. "Machine Learning and Criminal Justice: A Systematic Review of Advanced Methodology for Recidivism Risk Prediction" International Journal of Environmental Research and Public Health 19, no. 17: 10594. https://doi.org/10.3390/ijerph191710594
APA StyleTravaini, G. V., Pacchioni, F., Bellumore, S., Bosia, M., & De Micco, F. (2022). Machine Learning and Criminal Justice: A Systematic Review of Advanced Methodology for Recidivism Risk Prediction. International Journal of Environmental Research and Public Health, 19(17), 10594. https://doi.org/10.3390/ijerph191710594