
Training History, Cardiac Autonomic Recovery from Submaximal Exercise and Associated Performance in Recreational Runners


Abstract
:1. Introduction
2. Materials and Methods
2.1. Subjects
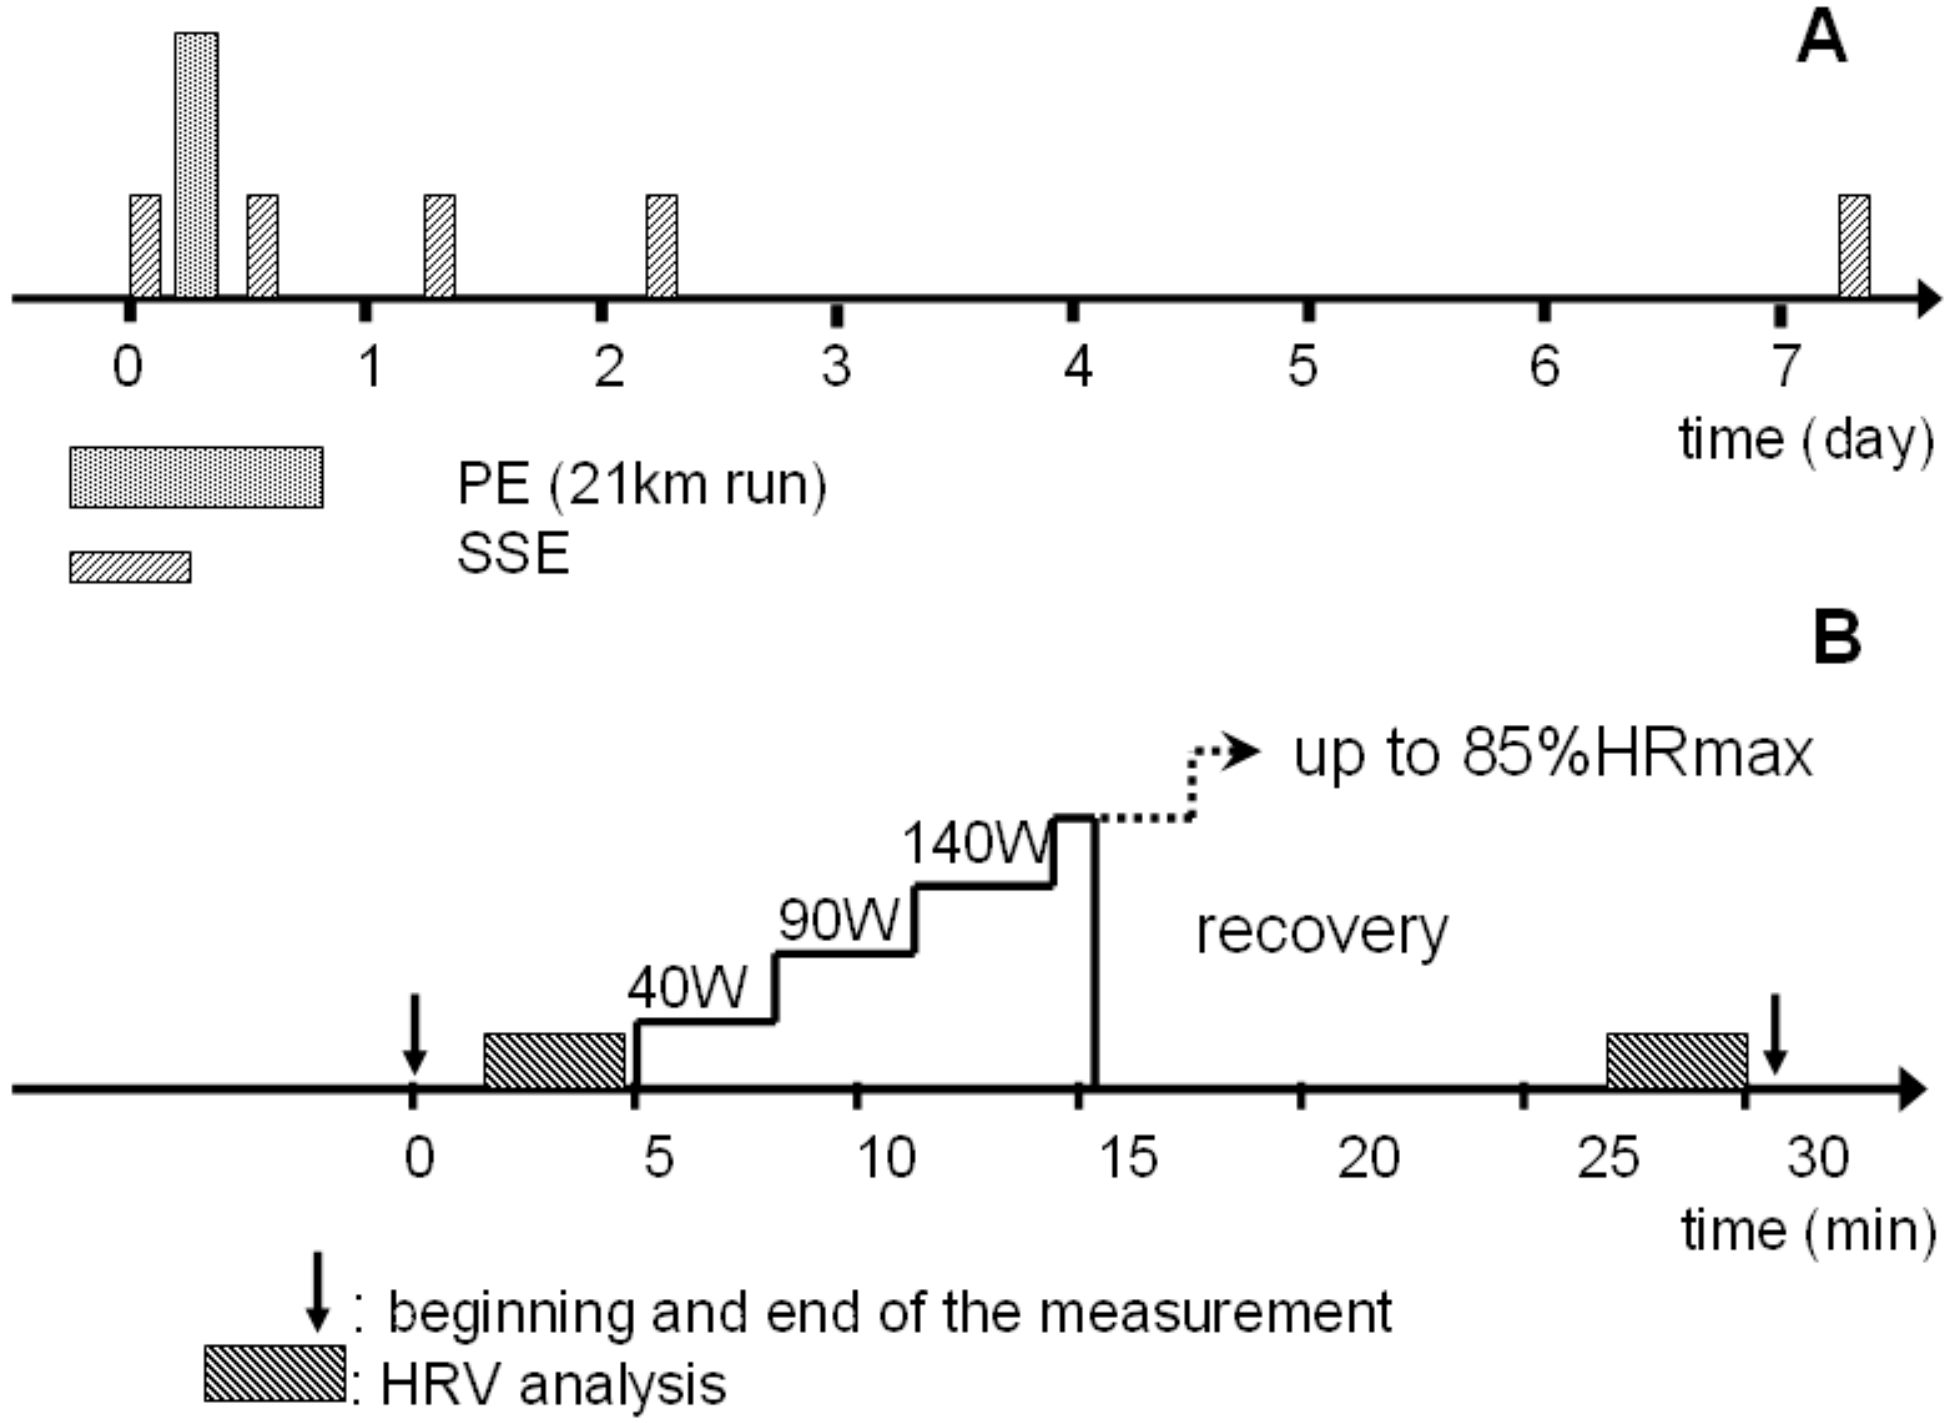
2.2. Procedures
2.3. Heart Rate and Heart Rate Variability Analysis
2.4. Indices of Aerobic Performance
2.5. Subjective Markers
2.6. Other Parameters
2.7. Statistical Analysis
3. Results
3.1. Subject Characteristics
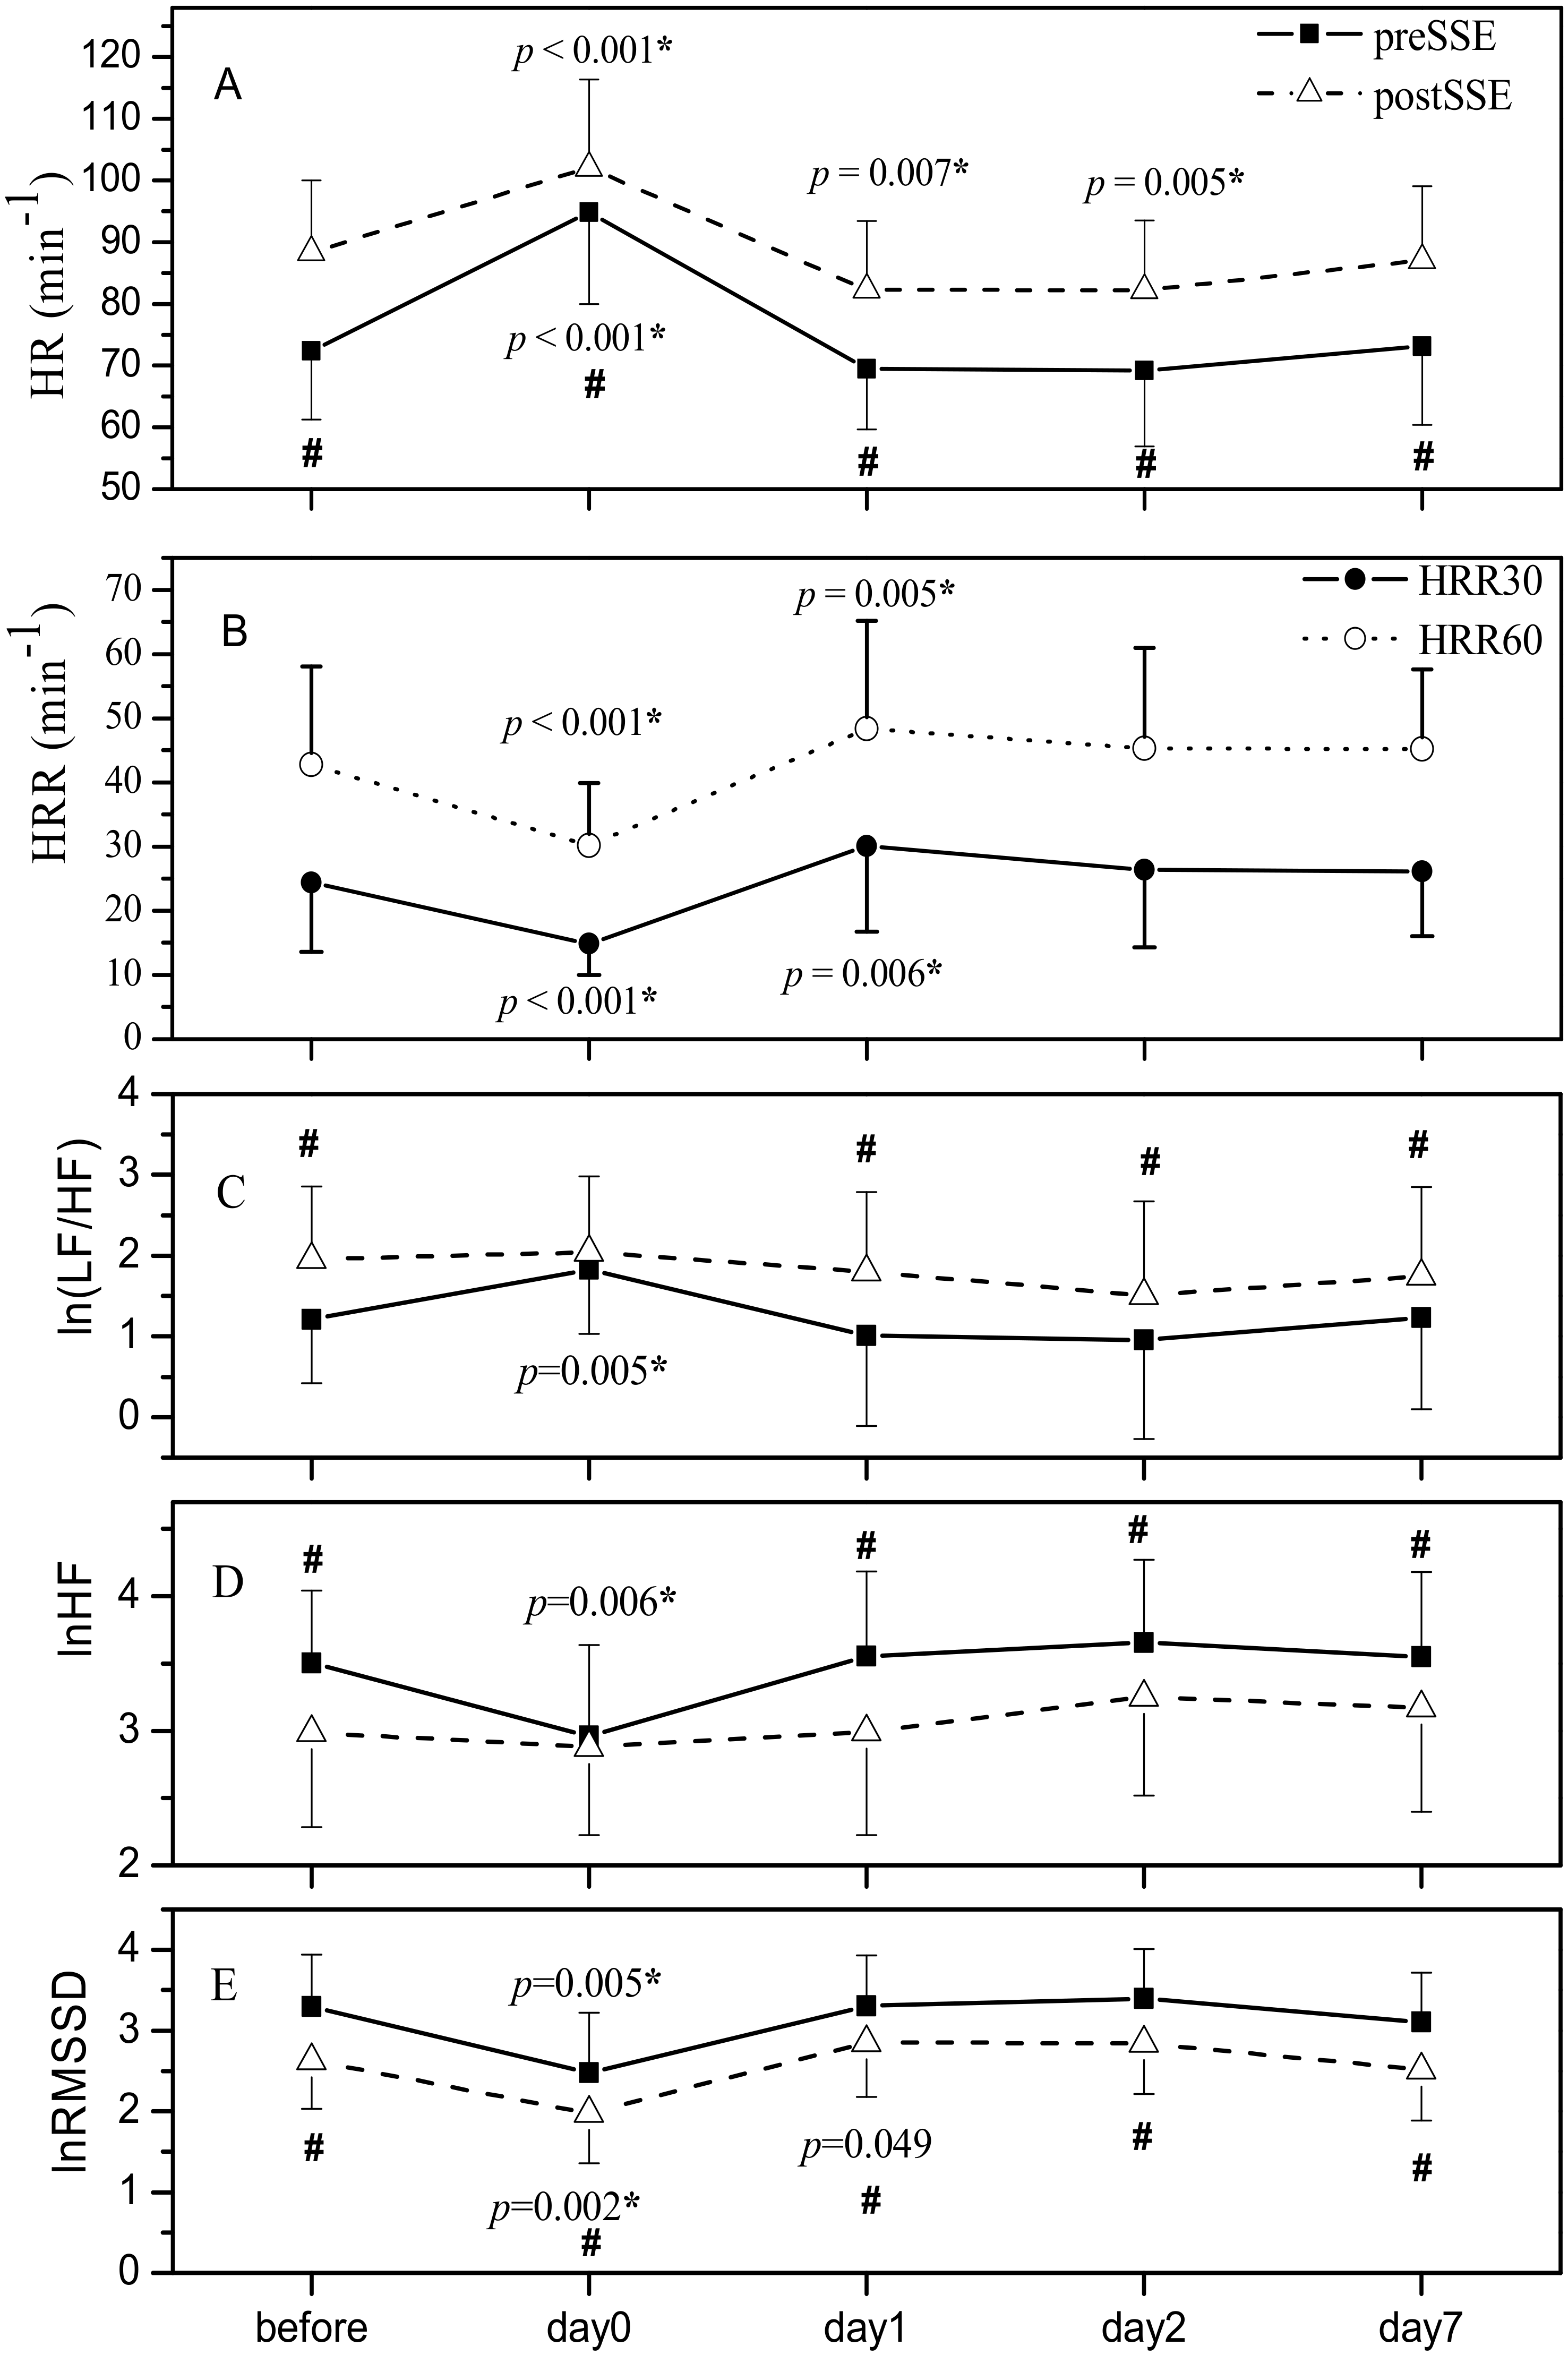
3.2. HR-Derived Measures
3.3. HRV-Derived Measures
3.4. Indices of Aerobic Performance
3.5. Subjective Markers
3.6. Other Parameters
3.7. Relationships between Cardiac Function Indices and Exercise Performance
3.8. Relationships between the Changes of Cardiac Function Indices and Exercise Performance
- The change in Pmax correlated largely to the change in HR preSSE, moderately to the changes in lnRMSSD pre- and postSSE, HR postSSE, as well as to HRR60. Small correlations of the changes in lnHF preSSE and HRR30 with Pmax% were addressed. Pmax% did not correlate with lnHF% postSSE (Table 4);
- The change in HRstmax correlated with a very large r value to the change in HR preSSE, large to the changes in lnRMSSD preSSE and HR postSSE, moderate to lnRMSSD% postSSE, HRR30%, and HRR60% and small to lnHF% preSSE. HRstmax% did not correlate with lnHF% postSSE (Table 4);
- The change in RPE correlated small and negative to lnRMSSD% preSSE and HRR30%. No correlations between RPE% and other cardiac parasympathetic activity-related indices were determined. (Table 4).
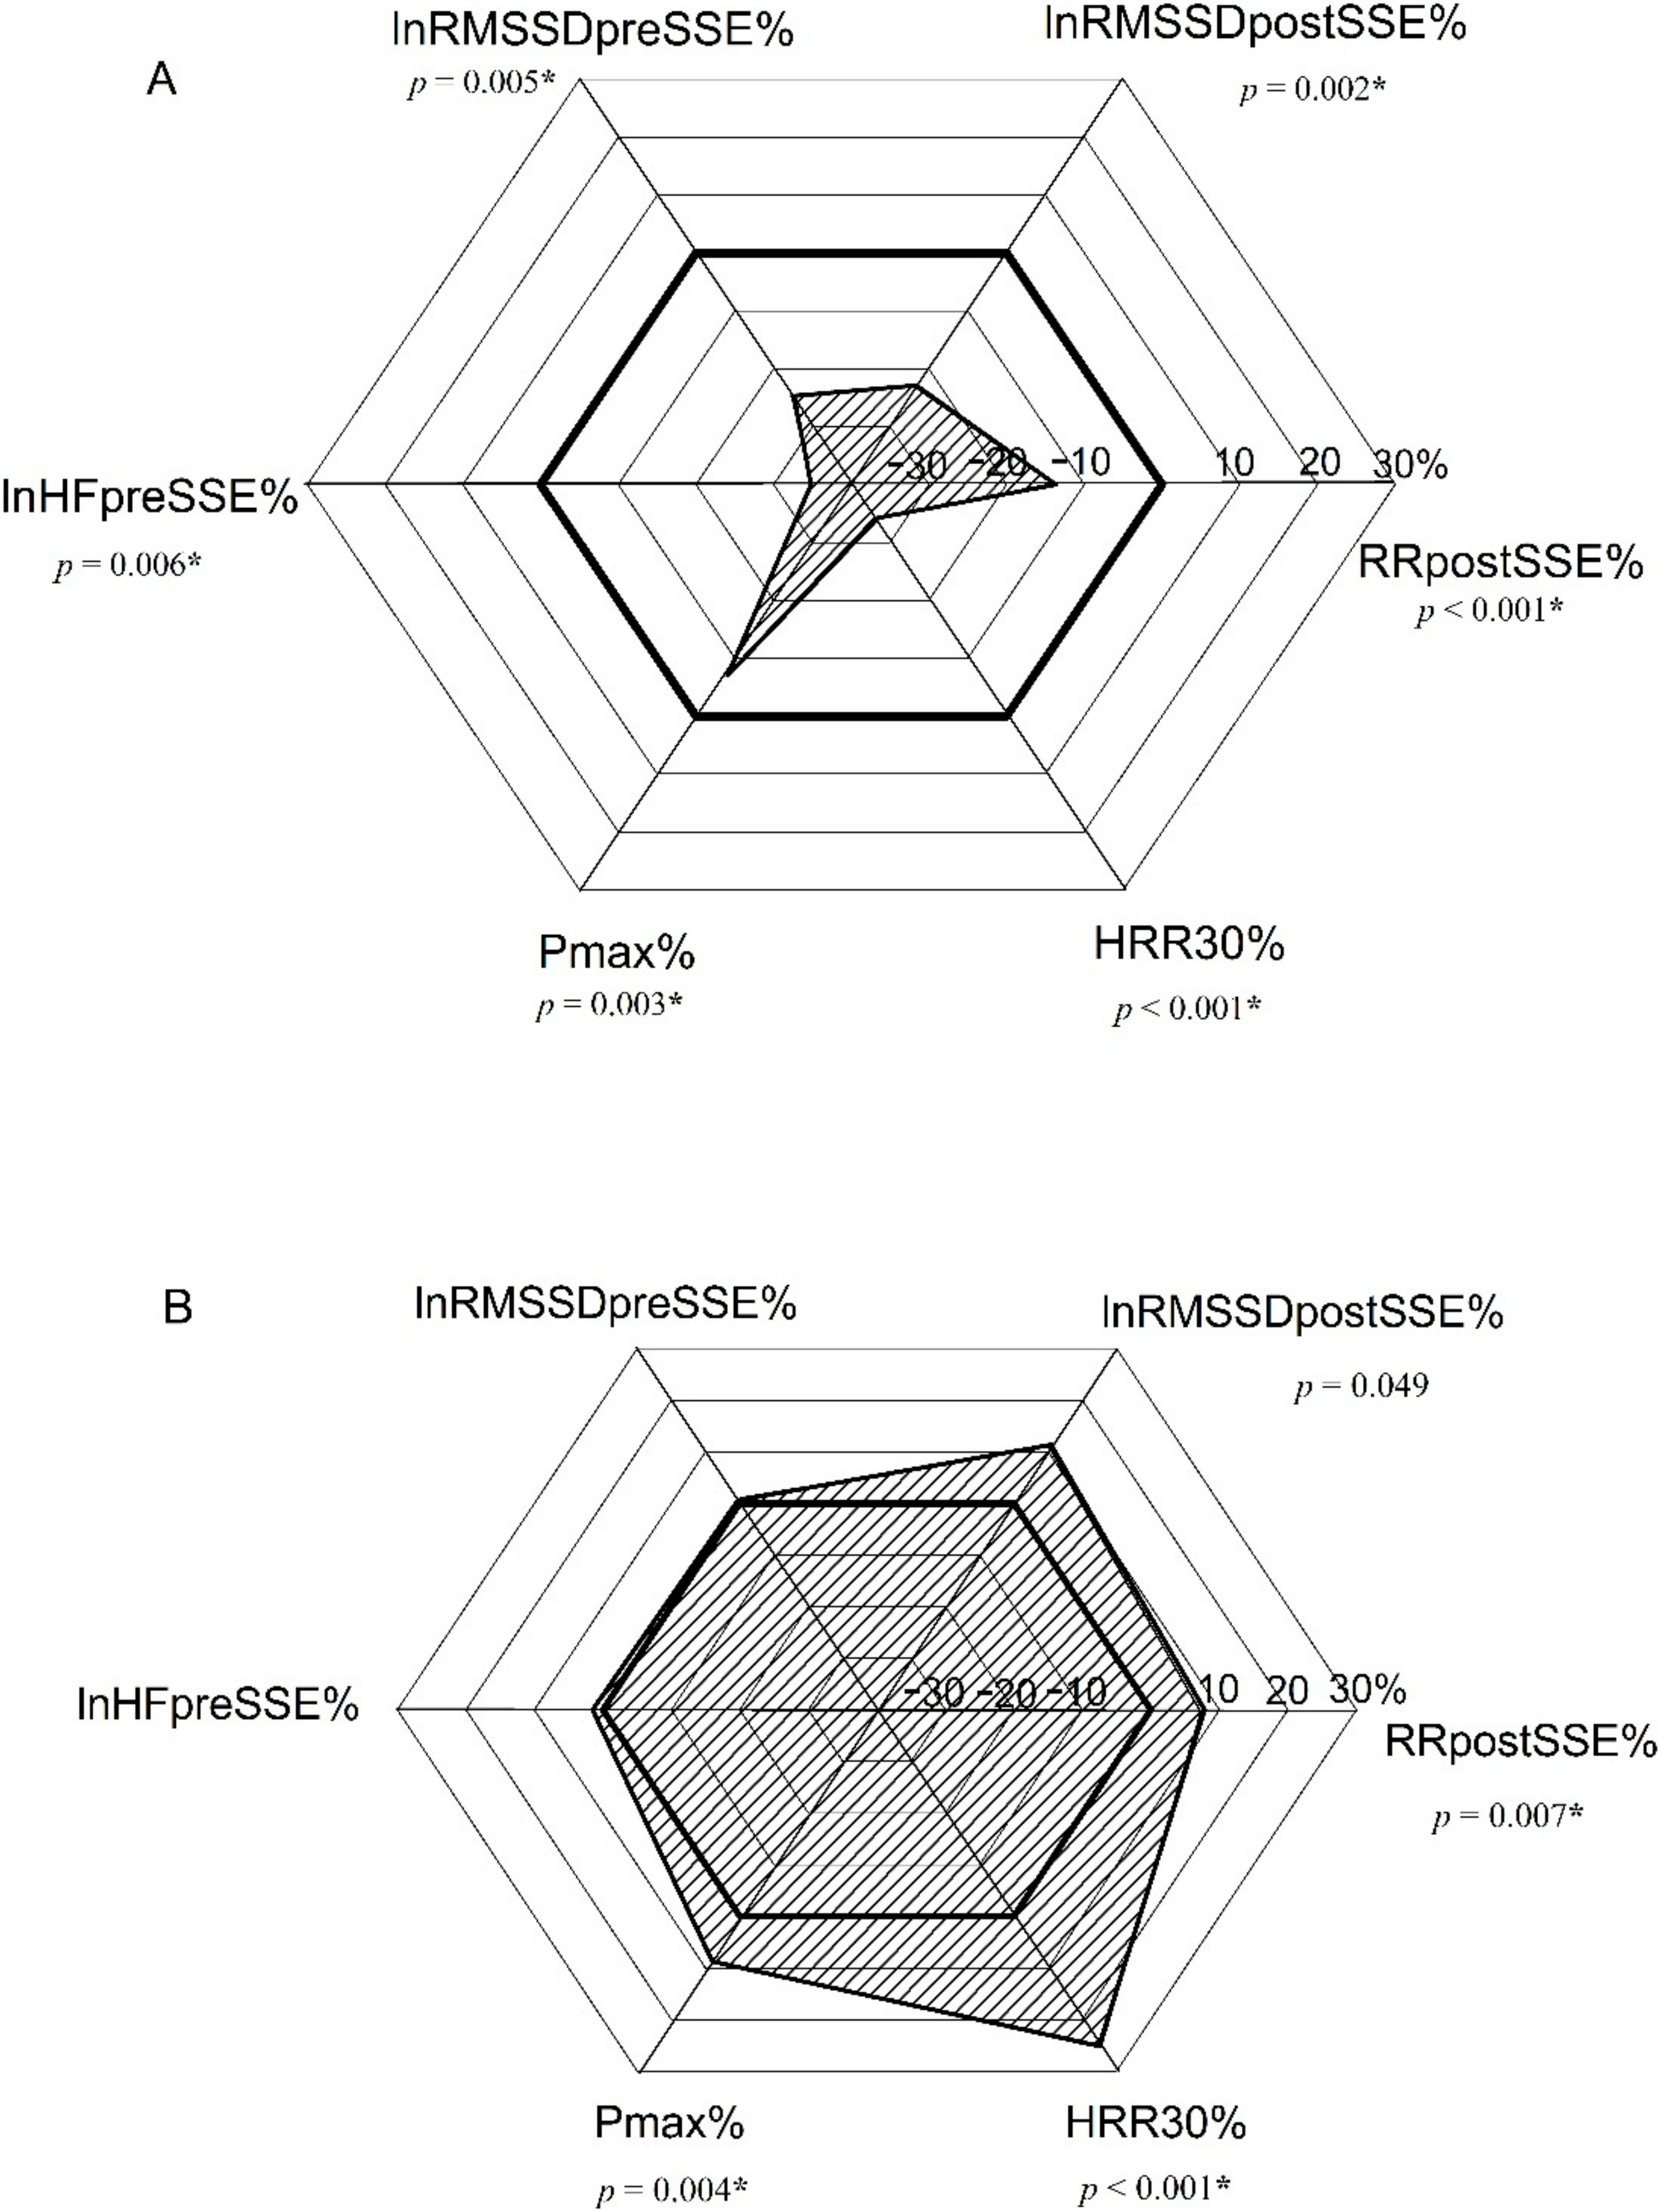
3.9. Multiple Indices Assessment
4. Discussion
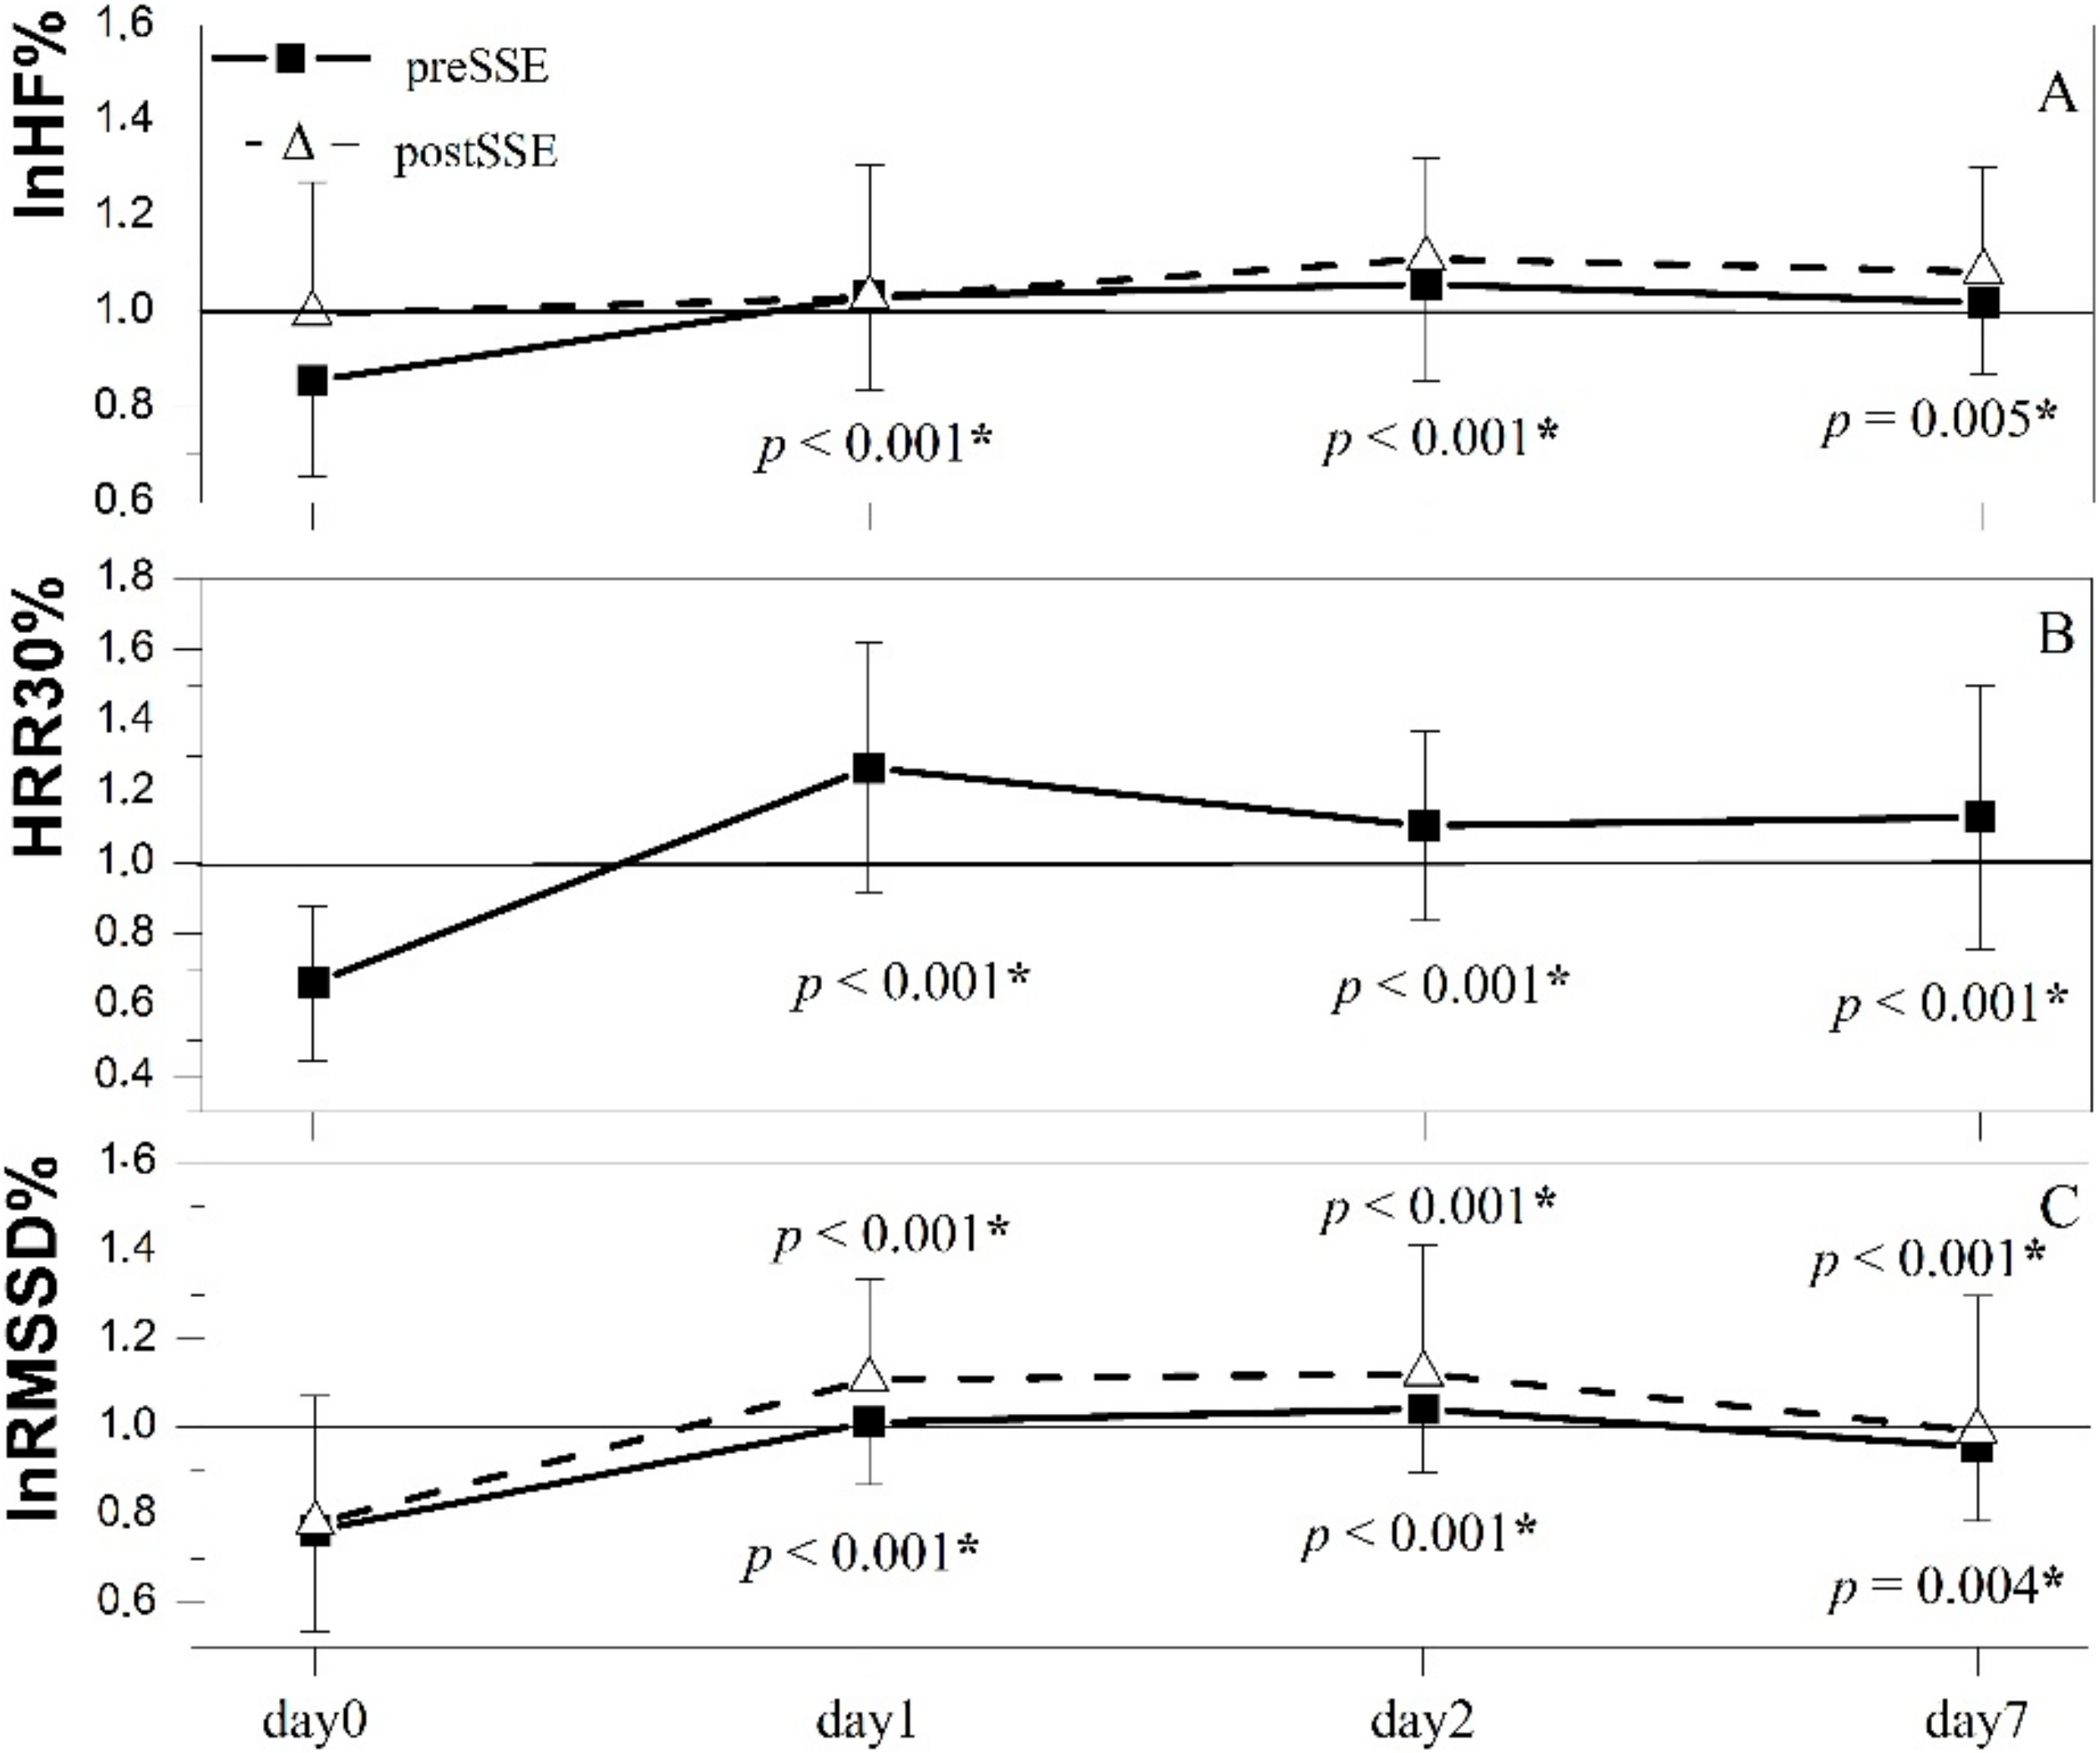
- Cardiac parasympathetic reactivation following short-lasting submaximal exercise subsequent to a half-marathon run exhibited biphasic response on a daily basis, being suppressed when SSE was performed on the same day and overexpressed on the first day after the half-marathon.
- We observed moderate biphasic changes in associated aerobic performance on a daily basis, which is potentially important for elite athletes.
- HRR as an index of parasympathetic reactivation depends on training history, not only on exercise intensity.
- HRR and HR in recovery after short-lasting submaximal exercise reflected training history better than resting values.
- We observed a correlation between the changes in resting and post-short-term submaximal exercise parasympathetic indices throughout recovery after a half-marathon with respect to baseline values and corresponding changes in aerobic power output indices may predict aerobic performance at least one week after prolonged exertion (heavy training) in recreational runners.
- Considering the change of multiple parameters reflecting current cardiac autonomic activity and an athlete’s performance with respect to training history (postSSE HR, HRR, lnRMSSD before and after short-lasting submaximal exercise, resting lnHF and aerobic capacity) offers a more detailed insight into training recovery.
4.1. Same Day Response
4.2. One Day after Half-Marathon
4.3. Day2 and 1 Week after Half-Marathon
4.4. Relationships between Cardiac Function Indices and Their Changes and Exercise Performance
5. Conclusions
Author Contributions
Funding
Institutional Review Board Statement
Informed Consent Statement
Data Availability Statement
Acknowledgments
Conflicts of Interest
References
- Cipryan, L.; Laursen, P.B.; Plews, D.J. Cardiac autonomic response following high-intensity running work-to-rest interval manipulation. Eur. J. Sport Sci. 2015, 16, 808–817. [Google Scholar] [CrossRef] [PubMed]
- Kaikkonen, P.; Rusko, H.; Martinmäki, K. Post-exercise heart rate variability of endurance athletes after different high-intensity exercise interventions. Scand. J. Med. Sci. Sports 2008, 18, 511–519. Available online: https://pubmed.ncbi.nlm.nih.gov/18067516/ (accessed on 12 April 2022). [CrossRef] [PubMed]
- Michael, S.; Graham, K.S.; Davis, G.M. Cardiac Autonomic Responses during Exercise and Post-exercise Recovery Using Heart Rate Variability and Systolic Time Intervals—A Review. Front. Physiol. 2017, 8, 301. [Google Scholar] [CrossRef] [PubMed] [Green Version]
- Facioli, T.P.; Philbois, S.V.; Gastaldi, A.C.; Almeida, D.S.; Maida, K.D.; Rodrigues, J.A.L.; Sánchez-Delgado, J.C.; Souza, H.C.D. Study of heart rate recovery and cardiovascular autonomic modulation in healthy participants after submaximal exercise. Sci. Rep. 2021, 11, 3620. Available online: https://pubmed.ncbi.nlm.nih.gov/33574441/ (accessed on 12 April 2022). [CrossRef] [PubMed]
- Hautala, A.; Tulppo, M.; Mäkikallio, T.H.; Laukkanen, R.; Nissilä, S.; Huikuri, H.V. Changes in cardiac autonomic regulation after prolonged maximal exercise. Clin. Physiol. 2001, 21, 238–245. [Google Scholar] [CrossRef] [PubMed]
- Wiewelhove, T.; Schneider, C.; Döweling, A.; Hanakam, F.; Rasche, C.; Meyer, T.; Kellmann, M.; Pfeiffer, M.; Ferrauti, A. Effects of different recovery strategies following a half-marathon on fatigue markers in recreational runners. PLoS ONE 2018, 13, e0207313. Available online: https://pubmed.ncbi.nlm.nih.gov/30412626/ (accessed on 10 February 2022). [CrossRef] [PubMed] [Green Version]
- Bishop, P.A.; Jones, E.; Woods, A.K. Recovery from training: A brief review. J. Strength Cond. Res. 2008, 22, 1015–1024. Available online: https://journals.lww.com/nsca-jscr/Fulltext/2008/05000/Recovery_From_Training__A_Brief_Review__Brief.49.aspx (accessed on 10 February 2022). [CrossRef] [PubMed]
- Bellinger, P. Functional Overreaching in Endurance Athletes: A Necessity or Cause for Concern? Sports Med. 2020, 50, 1059–1073. [Google Scholar] [CrossRef] [PubMed]
- Stanley, J.; Peake, J.M.; Buchheit, M. Cardiac Parasympathetic Reactivation Following Exercise: Implications for Training Prescription. Sports Med. 2013, 43, 1259–1277. Available online: https://pubmed.ncbi.nlm.nih.gov/23912805/ (accessed on 12 April 2022). [CrossRef]
- White, D.W.; Raven, P.B. Autonomic neural control of heart rate during dynamic exercise: Revisited. J. Physiol. 2014, 592, 2491–2500. [Google Scholar] [CrossRef]
- Van Hooren, B.; Peake, J.M. Do We Need a Cool-Down After Exercise? A Narrative Review of the Psychophysiological Effects and the Effects on Performance, Injuries and the Long-Term Adaptive Response. Sports Med. 2018, 48, 1575–1595. [Google Scholar] [CrossRef] [PubMed] [Green Version]
- Bellenger, C.R.; Fuller, J.; Thomson, R.; Davison, K.; Robertson, E.Y.; Buckley, J. Monitoring Athletic Training Status Through Autonomic Heart Rate Regulation: A Systematic Review and Meta-Analysis. Sports Med. 2016, 46, 1461–1486. Available online: https://pubmed.ncbi.nlm.nih.gov/26888648/ (accessed on 12 April 2022). [CrossRef] [PubMed]
- Manresa-Rocamora, A.; Flatt, A.A.; Casanova-Lizón, A.; Ballester-Ferrer, J.A.; Sarabia, J.M.; Vera-Garcia, F.J.; Moya-Ramón, M. Heart rate-based indices to detect parasympathetic hyperactivity in functionally overreached athletes. A meta-analysis. Scand. J. Med. Sci. Sports 2021, 31, 1164–1182. Available online: https://onlinelibrary.wiley.com/doi/full/10.1111/sms.13932 (accessed on 17 June 2022). [CrossRef] [PubMed]
- Plews, D.J.; Laursen, P.B.; Stanley, J.; Kilding, A.E.; Buchheit, M. Training Adaptation and Heart Rate Variability in Elite Endurance Athletes: Opening the Door to Effective Monitoring. Sports Med. 2013, 43, 773–781. [Google Scholar] [CrossRef]
- Al Haddad, H.; Laursen, P.; Chollet, D.; Ahmaidi, S.; Buchheit, M. Reliability of Resting and Postexercise Heart Rate Measures. Int. J. Sports Med. 2011, 32, 598–605. [Google Scholar] [CrossRef]
- Peçanha, T.; Paula-Ribeiro, M.; Campana-Rezende, E.; Bartels, R.; Marins, J.C.B.; De Lima, J.R.P. Water Intake Accelerates Parasympathetic Reactivation after High-Intensity Exercise. Int. J. Sport Nutr. Exerc. Metab. 2014, 24, 489–496. Available online: https://pubmed.ncbi.nlm.nih.gov/24667231/ (accessed on 12 April 2022). [CrossRef]
- Gourine, A.V.; Ackland, G.L. Cardiac Vagus and Exercise. 2019. Available online: www.physiologyonline.org (accessed on 12 April 2022).
- Buchheit, M.; Gindre, C. Cardiac parasympathetic regulation: Respective associations with cardiorespiratory fitness and training load. Am. J. Physiol. Circ. Physiol. 2006, 291, H451–H458. Available online: https://pubmed.ncbi.nlm.nih.gov/16501030/ (accessed on 12 April 2022). [CrossRef]
- Yamamoto, K.; Miyachi, M.; Saitoh, T.; Yoshioka, A.; Onodera, S. Effects of endurance training on resting and post-exercise cardiac autonomic control. Med. Sci. Sports Exerc. 2001, 33, 1496–1502. Available online: https://pubmed.ncbi.nlm.nih.gov/11528338/ (accessed on 12 April 2022). [CrossRef]
- Danieli, A.; Lusa, L.; Potočnik, N.; Meglič, B.; Grad, A.; Bajrović, F.F. Resting heart rate variability and heart rate recovery after submaximal exercise. Clin. Auton. Res. 2014, 24, 53–61. [Google Scholar] [CrossRef]
- Inbar, O.; Oren, A.; Scheinowitz, M.; Rotstein, A.; Dlin, R.; Casaburi, R. Normal cardiopulmonary responses during incremental exercise in 20 to 70-yr-old men. Med. Sci. Sports Exerc. 1994, 26, 538–546. Available online: https://pubmed.ncbi.nlm.nih.gov/8007799/ (accessed on 4 August 2022). [CrossRef]
- Robergs, R.A.; Robergs, R.A.; Landwehr, R. Commentary the Surprising History of the “HRmax=220-age” Equation. J. Exerc. Physiol. Online 2002, 5, 1–10. Available online: http://130.203.136.95/viewdoc/summary?doi=10.1.1.526.6164 (accessed on 4 August 2022).
- Girona, M.; Grasser, E.K.; Dulloo, A.G.; Montani, J.P. Cardiovascular and metabolic responses to tap water ingestion in young humans: Does the water temperature matter? Acta Physiol. 2014, 211, 358–370. Available online: https://pubmed.ncbi.nlm.nih.gov/24684853/ (accessed on 10 February 2022). [CrossRef] [PubMed]
- Matias, C.N.; Santos, D.; Júdice, P.B.; Magalhães, J.P.; Minderico, C.S.; Fields, D.A.; Lukaski, H.C.; Sardinha, L.B.; Silva, A.M. Estimation of total body water and extracellular water with bioimpedance in athletes: A need for athlete-specific prediction models. Clin. Nutr. 2016, 35, 468–474. Available online: https://pubmed.ncbi.nlm.nih.gov/25886709/ (accessed on 10 February 2022). [CrossRef] [PubMed]
- Lewis, M.J.; Short, A.L. Exercise and cardiac regulation: What can electrocardiographic time series tell us? Scand. J. Med. Sci. Sports 2010, 20, 794–804. Available online: https://onlinelibrary.wiley.com/doi/full/10.1111/j.1600-0838.2010.01150 (accessed on 17 June 2022). [CrossRef]
- Arts, F.J.P.; Kuipers, H.; Jeukendrup, A.E.; Saris, W.H.M. A short cycle ergometer test to predict maximal workload and maximal oxygen uptake. Int. J. Sports Med. 1993, 14, 460–464. Available online: https://pubmed.ncbi.nlm.nih.gov/8300273 (accessed on 10 February 2022). [CrossRef] [PubMed]
- Arts, F.J.P.; Kuipers, H. The relation between power output, oxygen uptake and heart rate in male athletes. Int. J. Sports Med. 1994, 15, 228–231. Available online: https://pubmed.ncbi.nlm.nih.gov/7960315/ (accessed on 10 February 2022). [CrossRef]
- Borg, G.A.V. Psychophysical bases of perceived exertion. Med. Sci. Sports Exerc. 1982, 14, 377–381. Available online: https://pubmed.ncbi.nlm.nih.gov/7154893/ (accessed on 12 April 2022). [CrossRef]
- Kim, H.-Y. Statistical notes for clinical researchers: A one-way repeated measures ANOVA for data with repeated observations. Restor. Dent. Endod. 2015, 40, 91–95. Available online: https://pubmed.ncbi.nlm.nih.gov/25671219/ (accessed on 12 April 2022). [CrossRef]
- Cohen, J. Statistical Power Analysis for the Behavioral Sciences, 2nd ed.; Routledge: London, UK, 2013. [Google Scholar]
- Hopkins, W.G.; Marshall, S.W.; Batterham, A.M.; Hanin, J. Progressive Statistics for Studies in Sports Medicine and Exercise Science. Med. Sci. Sports Exerc. 2009, 41, 3–13. Available online: https://pubmed.ncbi.nlm.nih.gov/19092709/ (accessed on 12 April 2022). [CrossRef] [Green Version]
- Kiviniemi, A.M.; Hautala, A.J.; Kinnunen, H.; Tulppo, M.P. Endurance training guided individually by daily heart rate variability measurements. Eur. J. Appl. Physiol. 2007, 101, 743–751. Available online: https://pubmed.ncbi.nlm.nih.gov/17849143/ (accessed on 15 April 2022). [CrossRef]
- Mertová, M.; Botek, M.; Krejčí, J.; McKune, A.J. Heart rate variability recovery after a skyrunning marathon and correlates of performance. Acta Gymnica 2017, 47, 161–170. [Google Scholar] [CrossRef] [Green Version]
- Fazackerley, L.A.; Fell, J.W.; Kitic, C.M. The effect of an ultra-endurance running race on heart rate variability. Eur. J. Appl. Physiol. 2019, 119, 2001–2009. Available online: https://pubmed.ncbi.nlm.nih.gov/31321510/ (accessed on 12 April 2022). [CrossRef] [PubMed]
- Dalla Vecchia, L.; Traversi, E.; Porta, A.; Lucini, D.; Pagani, M. On site assessment of cardiac function and neural regulation in amateur half marathon runners. Open Heart 2014, 1, e000005. Available online: https://pubmed.ncbi.nlm.nih.gov/25332775/ (accessed on 12 April 2022). [CrossRef] [PubMed] [Green Version]
- Mourot, L.; Fornasiero, A.; Rakobowchuk, M.; Isacco, L.; Brighenti, A.; Stella, F.; Zignoli, A.; Pellegrini, B.; Tarperi, C.; Schena, F. Post-Exercise Hypotension and Reduced Cardiac Baroreflex after Half-Marathon Run: In Men, but Not in Women. Int. J. Environ. Res. Public Health 2020, 17, 6337. Available online: https://pubmed.ncbi.nlm.nih.gov/32878130/ (accessed on 9 May 2022). [CrossRef]
- Dressendorfer, R. Acute Reduction in Maximal Oxygen Uptake After Long-Distance Running. Int. J. Sports Med. 1991, 12, 30–33. Available online: https://pubmed.ncbi.nlm.nih.gov/2030056/ (accessed on 9 May 2022). [CrossRef]
- Hara, K.; Floras, J.S. After-effects of exercise on haemodynamics and muscle sympathetic nerve activity in young patients with dilated cardiomyopathy. Heart 1996, 75, 602–608. Available online: https://pubmed.ncbi.nlm.nih.gov/8697165/ (accessed on 12 April 2022). [CrossRef] [Green Version]
- Cole, C.R.; Foody, J.A.M.; Blackstone, E.H.; Lauer, M.S. Heart Rate Recovery after Submaximal Exercise Testing as a Predictor of Mortality in a Cardiovascularly Healthy Cohort. Ann. Intern. Med. 2000, 132, 552–555. Available online: https://pubmed.ncbi.nlm.nih.gov/10744592/ (accessed on 12 April 2022). [CrossRef]
- Raffin, J.; Barthélémy, J.-C.; Dupré, C.; Pichot, V.; Berger, M.; Féasson, L.; Busso, T.; Da Costa, A.; Colvez, A.; Montuy-Coquard, C.; et al. Exercise Frequency Determines Heart Rate Variability Gains in Older People: A Meta-Analysis and Meta-Regression. Sports Med. 2019, 49, 719–729. Available online: https://pubmed.ncbi.nlm.nih.gov/30945205/ (accessed on 13 April 2022). [CrossRef]
- Kurogi, E.M.; Butcher, R.d.C.G.E.S.; Salvetti, M.d.G. Relationship between functional capacity, performance and symptoms in hospitalized patients with heart failure. Rev. Bras. Enferm. 2020, 73, e20190123. Available online: https://pubmed.ncbi.nlm.nih.gov/32490991/ (accessed on 13 April 2022). [CrossRef]
- Besnier, F.; Labrunée, M.; Richard, L.; Faggianelli, F.; Kerros, H.; Soukarié, L.; Bousquet, M.; Garcia, J.L.; Pathak, A.; Gales, C.; et al. Short-term effects of a 3-week interval training program on heart rate variability in chronic heart failure. A randomised controlled trial. Ann. Phys. Rehabil. Med. 2019, 62, 321–328. Available online: https://pubmed.ncbi.nlm.nih.gov/31352063/ (accessed on 13 April 2022). [CrossRef]
- Fuentes-Abolafio, I.J.; Stubbs, B.; Pérez-Belmonte, L.M.; Bernal-López, M.R.; Gómez-Huelgas, R.; Cuesta-Vargas, A.I. Physical functional performance and prognosis in patients with heart failure: A systematic review and meta-analysis. BMC Cardiovasc. Disord. 2020, 20, 512. Available online: https://pubmed.ncbi.nlm.nih.gov/33297975/ (accessed on 13 April 2022). [CrossRef] [PubMed]
- Sarma, S.; MacNamara, J.; Livingston, S.; Samels, M.; Haykowsky, M.J.; Berry, J.; Levine, B.D. Impact of severe obesity on exercise performance in heart failure with preserved ejection fraction. Physiol. Rep. 2020, 8, e14634. Available online: https://pubmed.ncbi.nlm.nih.gov/33207080/ (accessed on 13 April 2022). [CrossRef] [PubMed]
- Matsumura, S.; Watanabe, K.; Saijo, N.; Ooishi, Y.; Kimura, T.; Kashino, M. Positive Relationship Between Precompetitive Sympathetic Predominance and Competitive Performance in Elite Extreme Sports Athletes. Front. Sports Act. Living 2021, 3. Available online: https://pubmed.ncbi.nlm.nih.gov/34498000/ (accessed on 13 April 2022). [CrossRef]
- Suzic Lazic, J.; Dekleva, M.; Soldatovic, I.; Leischik, R.; Suzic, S.; Radovanovic, D.; Djuric, B.; Nesic, D.; Lazic, M.; Mazic, S. Heart rate recovery in elite athletes: The impact of age and exercise capacity. Clin. Physiol. Funct. Imaging 2017, 37, 117–123. Available online: https://pubmed.ncbi.nlm.nih.gov/26147945/ (accessed on 6 May 2022). [CrossRef] [PubMed]
- Clemente-Suárez, V.J.; Robles-Pérez, J.J.; Fernández-Lucas, J. Psycho-physiological response in an automatic parachute jump. J. Sports Sci. 2016, 35, 1872–1878. Available online: https://pubmed.ncbi.nlm.nih.gov/27724179/ (accessed on 14 April 2022). [CrossRef]
- Buchheit, M.; Laursen, P.B.; Al Haddad, H.; Ahmaidi, S. Exercise-induced plasma volume expansion and post-exercise parasympathetic reactivation. Eur. J. Appl. Physiol. 2009, 105, 471–481. Available online: https://pubmed.ncbi.nlm.nih.gov/19009307/ (accessed on 14 April 2022). [CrossRef]
- Ye, Y.; Tong, T.K.; Kong, Z.; Tao, E.D.; Ying, X.; Nie, J. Cardiac autonomic disturbance following sprint-interval exercise in untrained young males: Does exercise volume matter? J. Exerc. Sci. Fit. 2022, 20, 32–39. Available online: https://pubmed.ncbi.nlm.nih.gov/34987588/ (accessed on 14 April 2022). [CrossRef]
- Kenney, L.W.; Wilmore, J.; Costill, D. Physiology of Sport and Exercise, 6th ed.; Human Kinetics: Champaign, IL, USA, 2015; Available online: https://books.google.com/books/about/Physiology_of_Sport_and_Exercise_6th_Edi.html?hl=sl&id=tsy4BwAAQBAJ (accessed on 9 May 2022).
- Guzzetti, S.; Magatelli, R.; Borroni, E.; Mezzetti, S. Heart rate variability in chronic heart failure. Auton. Neurosci. 2001, 90, 102–105. Available online: https://pubmed.ncbi.nlm.nih.gov/11485275/ (accessed on 15 April 2022). [CrossRef]
- Pearson, M.J.; Smart, N.A. Exercise therapy and autonomic function in heart failure patients: A systematic review and meta-analysis. Heart Fail. Rev. 2018, 23, 91–108. Available online: https://pubmed.ncbi.nlm.nih.gov/29185161/ (accessed on 15 April 2022). [CrossRef]
- Kenttä, G.; Hassmén, P. Overtraining and recovery. A conceptual model. Sports Med. 1998, 26, 1–16. Available online: https://pubmed.ncbi.nlm.nih.gov/9739537/ (accessed on 15 April 2022). [CrossRef]


| Variables | Values |
|---|---|
| Age (years) | 40.4 ± 15.2 |
| Weight (kg) | 72.7 ± 15.3 |
| Height (cm) | 176.8 ± 10.6 |
| BMI (kg/m2) | 23.0 ± 2.7 |
| Physical activity of any kind (days per week) | 4.3 ± 1.2 |
| Running training (days per week) | 2.5 ± 1.2 |
| Mean distance per running training (km/session) | 11.2 ± 3.8 |
| 21 km run score (min) | 126.6 ± 19.1 |
| Mean HR during 21 km run (%HRmax) | 72 ± 11 |
| Before | Day0 | Day1 | Day2 | Day7 | F | p | η2 | |
|---|---|---|---|---|---|---|---|---|
| RPE | 13.17 ± 2.09 | 14.11 ± 2.88 | 13.94 ± 2.88 | 13.06 ± 2.94 | 12.50 ± 2.57 | (2.74; 13.88) 5.95 | <0.001 | 0.25 |
| ES | 0.52; p < 0.001 moderate | 0.51; p < 0.001 moderate | ||||||
| VAS | 2.63 (1.50;3.76) | 16.05 (7.86;24.26) * p < 0.001 | 13.26 (7.44;19.08) * p = 0.006 | 11.63 (5.13;18.13) | 3.05 (1.13;4.97) | <0.001 | ||
| HR/P slope (min−1/W) | 0.42 ± 0.10 | 0.36 ± 0.09 * | 0.39 ± 0.08 | 0.43 ± 0.12 | 0.42 ± 0.11 | (4;68) 11.77 | <0.001 | 0.41 |
| ES | 1.147 p < 0.001 large | |||||||
| Ppeak (W) | 208 (184;233) | 184 (159;210) * p = 0.010 | 221 (196;247) | 211 (187;236) | 205 (178;234) | 0.002 | ||
| Pmax (W) | 269 ± 74 | 249 ± 67 * | 296 ± 63 * | 279 ± 70 | 271 ± 69 | (4;68) 10.21 | <0.001 | 0.38 |
| ES | 0.81; p = 0.003 large | 0.78; p = 0.004 moderate | ||||||
| HRstmax (min−1) | 134.2 ± 14.7 | 146.4 ± 10.8 * | 130.1 ± 13.8 * | 134.1 ± 15.0 | 132.4 ± 16.6 | (4;72) 28.205 | <0.001 | 0.59 |
| ES | 1.33; p < 0.001 large | 0.74; p = 0.005 moderate | ||||||
| TBW (L) | 42.7 ± 10.7 | 42.66 ± 10.7 | 43.33 ± 11.3 | 42.53 ± 10.9 | 42.09 ± 10.8 | (2.26;36.26) 1.84 | 0.17 | 0.10 |
| ECW (L) | 18.08 ± 4.40 | 18.13 ± 4.18 | 17.46 ± 4.41 | 18.29 ± 4.47 | 17.28 ± 3.99 | (1.92;30.78) 0.79 | 0.46 | 0.05 |
| BF (min−1) preSSE | 14.23 ± 3.83 | 17.61 ± 4.65 * | 15.28 ± 4.17 | 14.99 ± 4.00 | 14.51 ± 3.39 | (4;72) 9.89 | <0.001 | 0.36 |
| BF (min−1) postSSE | 16.55 ± 3.58 | 19.18 ± 4.25 * | 17.03 ± 4.18 | 16.58 ± 4.02 | 16.35 ± 3.71 | (4;72) 10.69 | <0.001 | 0.37 |
| Pmax | HRstmax | RPE | |||||
|---|---|---|---|---|---|---|---|
| n | p | r | p | r | p | ||
| HRR30 | 95 | 0.739 | 0.089 | 0.963 | |||
| HRR60 | 95 | 0.253 | 0.815 | 0.499 | |||
| lnRMSSD preSSE | 95 | 0.950 | 0.473 | 0.114 | |||
| lnRMSSD postSSE | 95 | 0.527 | 0.672 | 0.137 | |||
| lnHF preSSE | 95 | 0.117 | 0.099 | 0.089 | |||
| HR preSSE | 95 | 0.007 | −0.283 small | <0.001 * | 0.458 moderate | 0.037 * | −0.214 small |
| HR postSSE | 95 | 0.290 | <0.001 * | 0.492 moderate | 0.039 * | −0.212 small | |
| HRstmax | 95 | 0.022 * | −0.241 small | 0.454 | |||
| RPE | 95 | 0.003 * | 0.308 moderate | 0.454 | |||
| Pmax% | HRstmax% | RPE% | |||||
|---|---|---|---|---|---|---|---|
| n | p | r | p | r | p | r | |
| HRR30% | 76 | 0.049 * | 0.225 small | <0.001 * | −0.431 moderate | 0.022 * | −0.263 small |
| HRR60% | 76 | 0.001 * | 0.374 moderate | 0.006 * | −0.311 moderate | 0.854 | |
| lnRMSSD% preSSE | 76 | <0.001 * | 0.470 moderate | <0.001 * | −0.504 large | 0.0433 * | −0.234 small |
| lnRMSSD% postSSE | 76 | 0.003 * | 0.343 moderate | 0.001 * | −0.364 moderate | 0.071 | |
| lnHF% preSSE | 76 | 0.031 * | 0.254 small | 0.012 * | −0.287 small | 0.729 | |
| lnHF% postSSE | 76 | 0.434 | 0.168 | 0.344 | |||
| HR% preSSE | 76 | <0.001 * | −0.522 large | <0.001 * | 0.749 very large | 0.204 | |
| HR% postSSE | 76 | <0.001 * | −0.487 moderate | <0.001 * | 0.591 large | 0.211 | |
| HRstmax% | 76 | <0.001 * | −0.490 moderate | 0.910 | |||
| RPE% | 76 | 0.933 | 0.910 | ||||
Publisher’s Note: MDPI stays neutral with regard to jurisdictional claims in published maps and institutional affiliations. |
© 2022 by the authors. Licensee MDPI, Basel, Switzerland. This article is an open access article distributed under the terms and conditions of the Creative Commons Attribution (CC BY) license (https://creativecommons.org/licenses/by/4.0/).
Share and Cite
Špenko, M.; Potočnik, I.; Edwards, I.; Potočnik, N. Training History, Cardiac Autonomic Recovery from Submaximal Exercise and Associated Performance in Recreational Runners. Int. J. Environ. Res. Public Health 2022, 19, 9797. https://doi.org/10.3390/ijerph19169797
Špenko M, Potočnik I, Edwards I, Potočnik N. Training History, Cardiac Autonomic Recovery from Submaximal Exercise and Associated Performance in Recreational Runners. International Journal of Environmental Research and Public Health. 2022; 19(16):9797. https://doi.org/10.3390/ijerph19169797
Chicago/Turabian StyleŠpenko, Matic, Ivana Potočnik, Ian Edwards, and Nejka Potočnik. 2022. "Training History, Cardiac Autonomic Recovery from Submaximal Exercise and Associated Performance in Recreational Runners" International Journal of Environmental Research and Public Health 19, no. 16: 9797. https://doi.org/10.3390/ijerph19169797
APA StyleŠpenko, M., Potočnik, I., Edwards, I., & Potočnik, N. (2022). Training History, Cardiac Autonomic Recovery from Submaximal Exercise and Associated Performance in Recreational Runners. International Journal of Environmental Research and Public Health, 19(16), 9797. https://doi.org/10.3390/ijerph19169797