Article

Impact of Body Mass Index on Muscle Strength, Thicknesses, and Fiber Composition in Young Women

1
Department of Physical Education, Korea University, Seoul 02841, Korea
2
Department of Sports Medicine and Sports Nutrition, Faculty of Sport Science, Ruhr-University Bochum, 44801 Bochum, Germany
3
Division of Sports and Exercise Medicine, Department of Sport, Exercise and Health, University of Basel, 4052 Basel, Switzerland
4
Department of Neurology, Ruhr-University Bochum, Kliniken Bergmannsheil, 44801 Bochum, Germany
*
Author to whom correspondence should be addressed.
Int. J. Environ. Res. Public Health 2022, 19(16), 9789; https://doi.org/10.3390/ijerph19169789
Submission received: 8 July 2022 / Revised: 1 August 2022 / Accepted: 5 August 2022 / Published: 9 August 2022

Abstract

:
High body mass index (BMI) may influence muscle strength, muscle thickness (Mtk), and fiber composition. We evaluated these parameters in 31 and 27 women grouped in non-oral contraceptive (non-OC) groups and OC groups, respectively, and further divided them into groups based on BMI: BMIlow, BMInorm, and BMIhigh. Maximum isometric force (Fmax), Mtk, and the relative percentage of muscle fiber composition (%) were examined in both groups. Fmax and Mtk values were significantly greater in the BMIhigh than the BMIlow within the OC group. However, there was no significant difference in the non-OC group. BMIlow and BMInorm groups showed a difference in the distribution of muscle fiber types 1 and 2 with almost the same proportions in both non-OC and OC groups. However, the BMIhigh group showed a difference in the distribution of muscle fiber types 1 and 2, with type 1 about 18.76% higher in the non-OC group. Contrastively, type 2 was about 34.35% higher in the OC group. In this study, we found that there was a significant difference in Fmax and Mtk according to the BMI level in the OC group, but no significant difference was found in the non-OC group. Moreover, the distribution of type 2 muscle fibers tended to be higher in the OC group of BMIhigh, although the sample size was small. Therefore, although no significant difference of Fmax and Mtk was found according to BMI level in the non-OC group in this study, the increase in BMI level appeared to be more associative of muscle strength in the OC group. Based on the present results, future studies are needed that consider the BMI level as well as the presence or absence of OC in future research about women’s muscle strength.

1. Introduction

The menstrual cycle refers to the time interval between the first day of the index and the following period. It is a dynamic and complex process, involving steroid hormones and fluctuations of endogenous estradiol and progesterone levels. The events of the cycle depend on the cell structure of the ovaries, which respond to hormonal signaling by the anterior pituitary gland [1]; the production of hormones by the ovaries is predictable and cyclical within an average of 23–38 days [2,3]. Reis et al. [4] conducted the first interventional study investigating menstrual cycle phase-based strength. They reported an association between the increased strength and endurance of the quadriceps muscle group and elevated estrogen levels (i.e., in late follicular and early luteal phases). Following their results, many subsequent studies have been conducted in the field.
Until now, previous studies reported that endogenous female sex hormones contribute to strength performance [5,6,7], but the results were inconsistent [8,9,10]. According to a recent review [11], it was reported that the menstrual cycle must be taken into consideration in women who do not use oral contraceptives (OC), and individual exercise programs should be mandated for the early follicular phase and all other menstrual cycle phases.
On the contrary, in women consuming exogenous hormones, endogenous hormone fluctuations are unlikely, and endogenous hormone release generally follows a predictable pattern; exogenous hormone supplementation involves taking hormones for 21 days (consumption phase), followed by a 7-day break (withdrawal phase). Consequently, endogenous estrogen and progesterone are suppressed, and according to the intake of constant amounts of exogenous hormone, blood concentrations of estrogen and progesterone remain nearly constant during the 21-day consumption phase [10]. Some evidence suggests that the levels of both endogenous and exogenous female sex steroids fluctuate, affecting exercise performance, strength gain, and anaerobic power [5,12,13,14]. Based on each woman’s response to OC use, along with other factors such as the primary objective for using OCs, a personalized therapeutic approach should be used to achieve better outcomes [15]. Nonetheless, these inconsistent results in menstrual cycle research on exercise performance may be related to methodological problems that mask possible changes during the cycle [16].
Several studies proposed that body weight and weight gain values are critical for the onset of menarche [17,18], and increased subcutaneous fat percentage and BMI levels were associated with menstrual pattern [19]. Thus, BMI strongly correlates with age at menarche and a regular menstrual cycle. The levels of luteinizing [20,21] and follicular stimulating hormones [20,21,22] and progesterone [20,21,23] are significantly lower in the ovulatory phase in obese women than in normal-weight women. Although it is unlikely that gonadotrophins are sequestered in the body fat, this may be the case for lipophilic sex steroids (i.e., progesterone) [24,25,26]; such sequestrated steroid hormones could create a sustained negative feedback loop that involves the hypothalamus and pituitary gland, suggesting that obesity may affect sex steroid hormone regulation in women. In addition, BMI is associated with the strength and cross-sectional area (CSA) of skeletal muscle. Indeed, overweight and obese individuals tend to have greater maximum voluntary contraction and CSA values than normal-weight individuals [27]. These findings are supported by Zoico et al. [28] and Rolland et al. [29]; both studies reported that muscular force and CSA values were 17.0% higher in obese than normal-weight women. However, little is known about the difference of the BMI level on muscle strength and thickness in women, including those who take OC and those who do not.
Therefore, the purpose of this study is to investigate the different muscle strength and muscle thickness in the non-OC and OC group, according to the BMI level. Furthermore, distribution of muscle fibers is investigated according to the BMI level in the non-OC and OC group.

2. Materials and Methods

This study involved 58 female participants who were students from Ruhr-university Bochum in Germany. The participants were randomly selected and the exclusion criterion was any health disorder. The participants were either untrained or moderately trained students that performed less than 2 h of regular physical exercise per week. A total of 31 eumenorrheic healthy women were included in the non-OC group (10, 10, and 11 women were included in the BMIlow < 18.5, 18.5 ≤ BMInorm < 25, and BMIhigh ≥ 25 groups, respectively). In addition, 27 women were included in the OC group (9 per BMI group). Women in the non-OC group had not been taking oral contraceptives or any other hormonal treatments for at least one year prior to participation in this study, and these women did not have a history of any endocrine disorders. Additionally, all women had regular menstrual cycles. Women in the OC groups had been taking monophasic combined OC for at least one year prior to participation in this study and did not have a history of any endocrine disorders (Table 1). The anthropometric data included mean age, height, weight, and BMI values. The participants were informed about the purpose, procedures, and risks associated with the present study before enrolment. All participants provided written informed consent (Figure 1). The study protocol was approved by the Ethics Committee of the Ruhr-University Bochum, Germany (IIA1-070118/07).

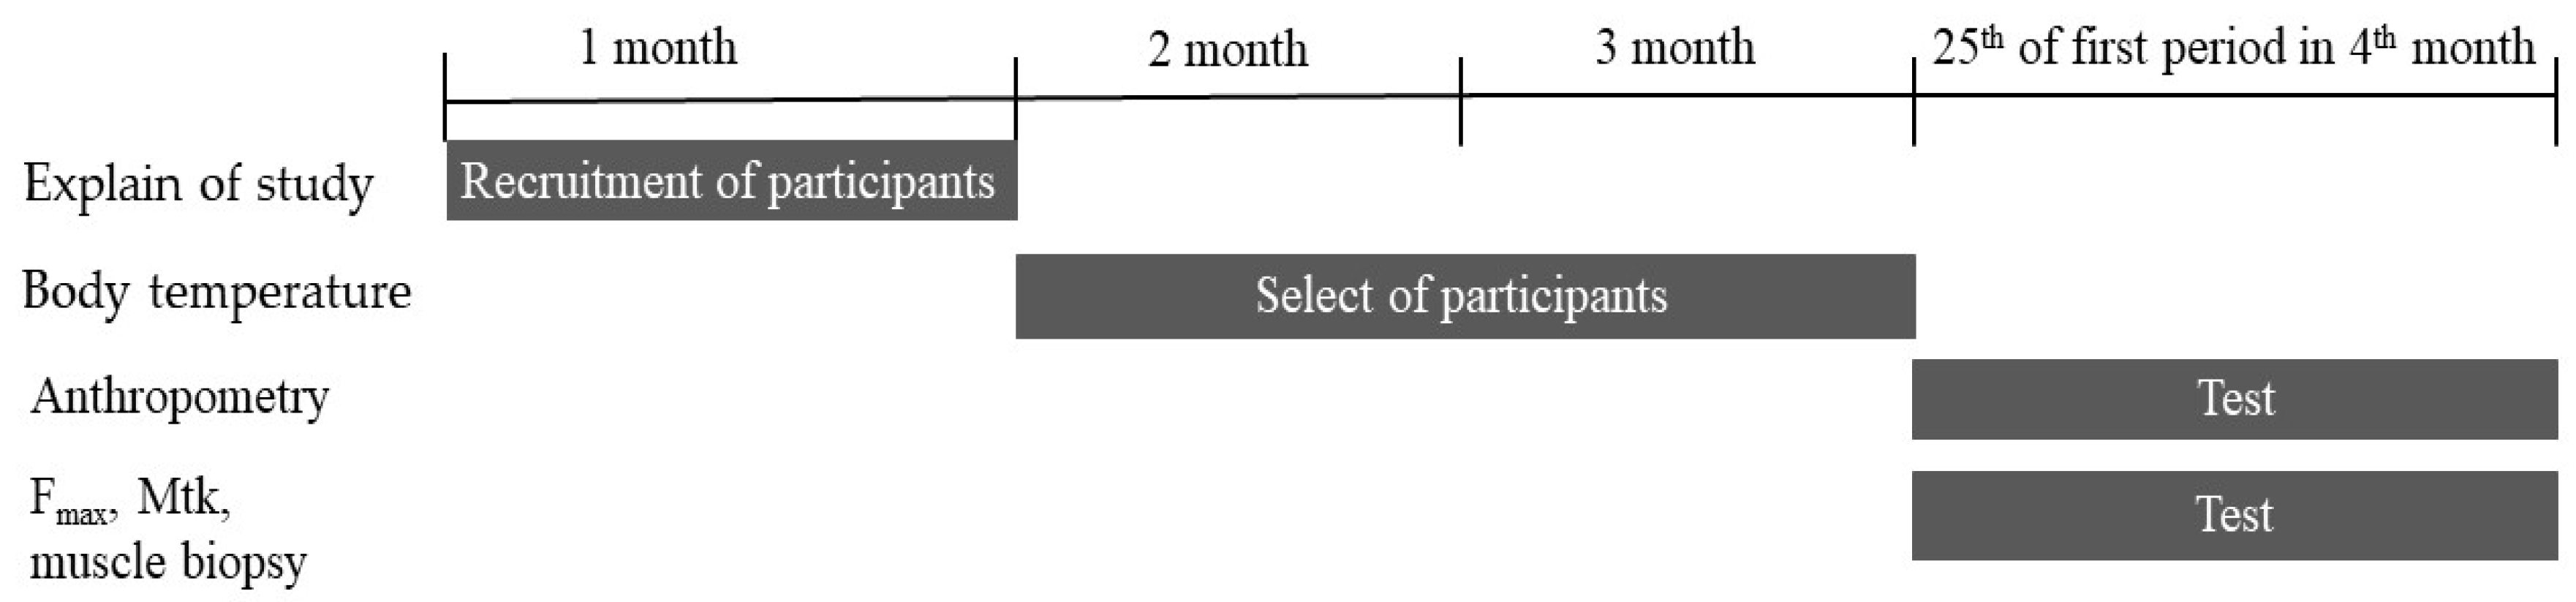
2.1. Menstrual Cycle Monitoring

Women’s body temperature naturally changes during the menstrual cycle. It is lower in the first part of the period and increases during ovulation. The occurrence of ovulation was defined when an increase in basal body temperature of at least 0.3 °C was measured [30,31,32]. This fluctuation of basal body temperature was used to identify people who have a normal menstrual cycle. Moreover, the phases of the menstrual cycle including ovulation are noted in order to individually determine the exact testing schedule (25th day of first period). Between 8:00 a.m. and 8:30 a.m., before rising from bed, the participants were requested to measure their basal body temperature daily using an oral electronic thermometer [33]. When no increase in basal body temperature, i.e., ovulation, was detected during both menstrual cycles, the subject was excluded from the study because she was judged not to have a normal cycle of menstruation.

2.2. Maximum Isometric Force (Fmax) Measurement

The maximum isometric force (Fmax) was determined on a leg press machine (Medizinische Sequenzgeräte, Compass, Germany) using a combined force and load cell (GSV-2ASD, ME-Messsysteme GmbH, Hennigsdorf, Germany). The temperature in the labor room was 20 °C with 50% humidity. Fmax was measured individually for each participant on the 25th day following the first day of their menstrual cycle. Before testing, the participants underwent a 10-min warm-up on a low-resistance bicycle ergometer. They were familiarized with the test and the testing position (knee angle 90°, ankle angle 90°) during the leg press task [34]. Each measurement was repeated three times with 30 s of rest between trials. The highest value was selected among the three measurements for data analysis. A reliability analysis was performed for the isometric measurement; the intraclass correlation coefficient (ICC) was 0.998, which indicates that the system had a high internal consistency and, thus, a high reliability.

2.3. Muscle Thicknesses (Mtk) Measurements

Mtk of the rectus femoris and vastus lateralis of each leg was measured using real time ultrasound imaging, which has been shown to be a reliable method [35]. We used a Vivid I CE 0344 ultrasonography device (GE Medical System, Solingen, Germany) with a parallel scanner (8 L-RS, 4.0–13.3 MHz), which provides a 10-cm depth of sound wave penetration, enabling the analysis of deep lying muscles. Mtk was measured using long-lasting static muscular tension that participants were asked to maintain for at least 30 min before the measurement [36]. Participants were in the supine position, and the ultrasound images were obtained at a point exactly half-way between the anterior superior iliac spine and the upper margin of the patella. The position of the transducer was recorded for each muscle so that it could be precisely reproduced during subsequent measurements. The mean value of the three measurements per muscle was taken for both legs, and the sum of the two Mtks was calculated for both sides of the body. A reliability analysis was performed for Mtk determination. The obtained ICC was 0.997, indicating a high reliability of the ultrasound imaging of Mtk used in this study.

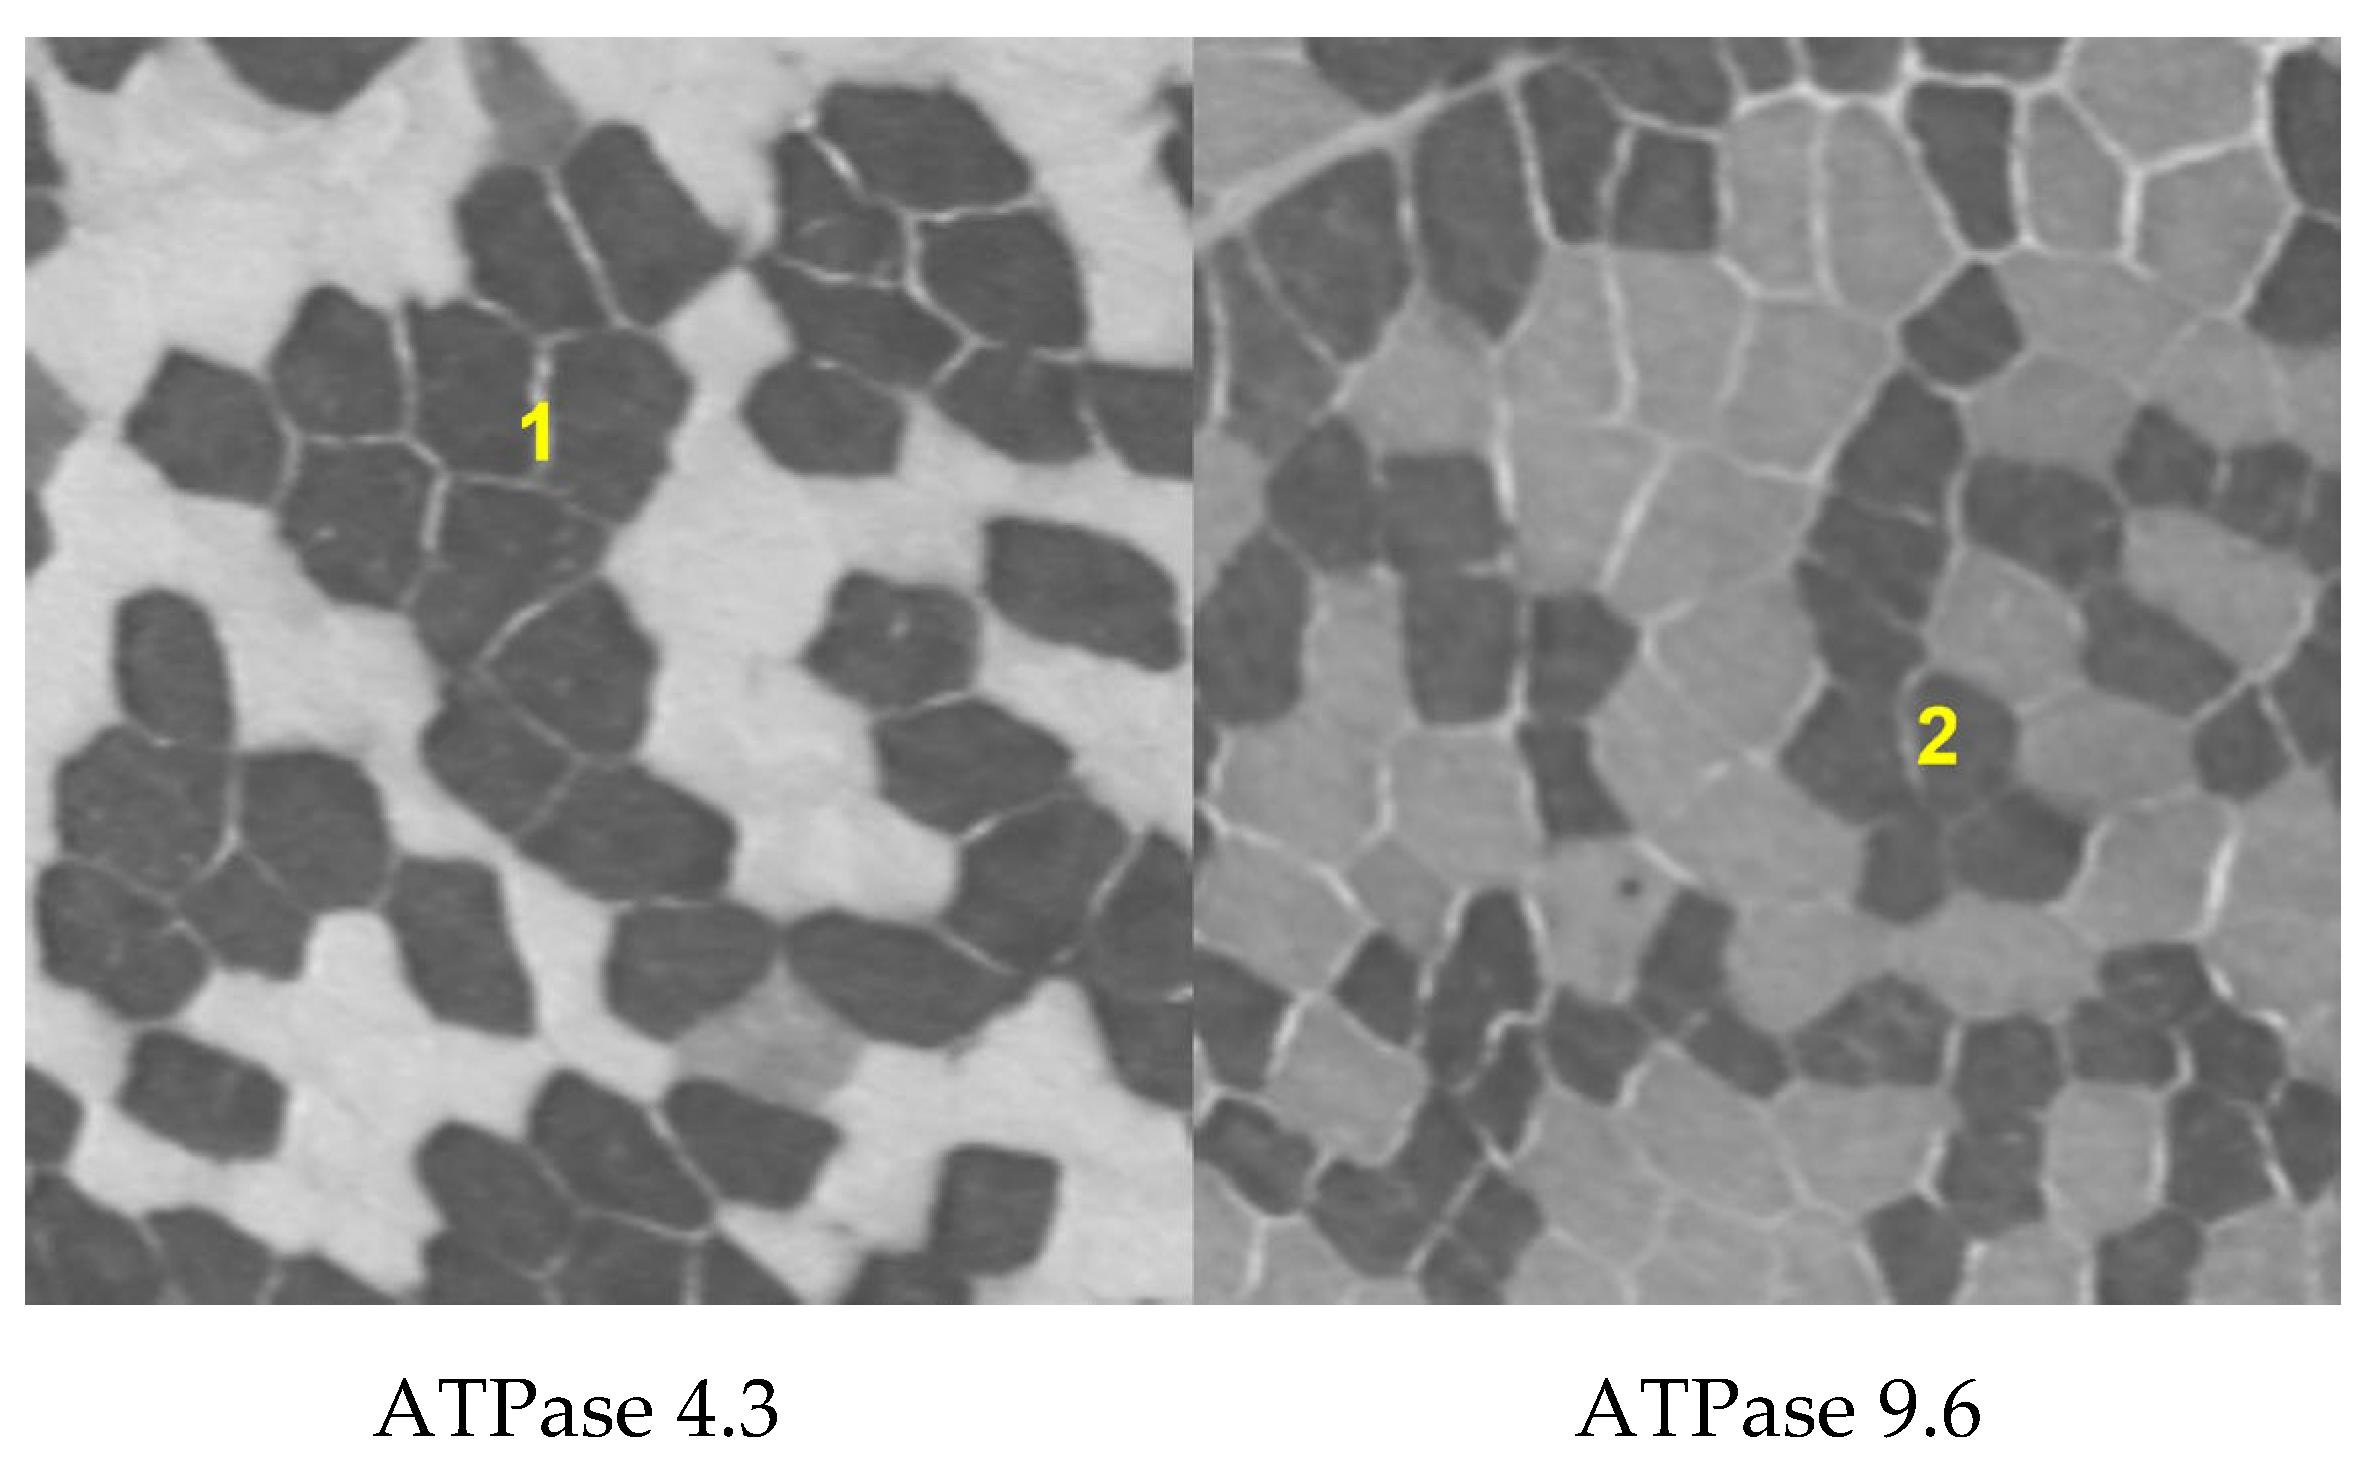
2.4. Analysis of Muscle Fiber Composition

Although the composition of different muscle fiber types is not uniform throughout the body, the composition of the vastus lateralis is considered to be a good indicator of the proportions of fiber types present in other major muscles involved in propulsive or working activities [37,38]. A total of 10 and 5 participants from the non-OC and OC groups, respectively, volunteered to participate in muscle needle biopsies. Under local anesthesia, percutaneous muscle biopsy samples (70–300 mg) were obtained from the vastus lateralis muscle using a previously described technique [39]. Directly after sampling, the tissue was removed from the needle, mounted as a cross-sectional slide in a Tissue-TEK® embedded medium, frozen in isopentane, and placed into an aluminum container to be cooled further with liquid nitrogen before being stored at −80 °C for subsequent analysis [40]. We performed a histochemical analysis using adenosine-triphosphatase (ATPase) staining with alkaline pre-incubation at a pH of 4.3 and 9.6 to determine the proportion of muscle fiber types 1 and 2, respectively [41] (Figure 2). All fibers from a single sample were counted twice; the average of the values obtained was used in the statistical analysis [42].

2.5. Statistical Analysis

A statistical analysis was performed using IBM SPSS Statistics for Windows/Macintosh, ver. 22 (IBM Corp., Armonk, NY, USA). A one-way ANOVA was used to compare the differences in variance among the three BMI groups (BMIlow, BMInorm, and BMIhigh) within the non-OC and OC groups. The Bonferroni correction was used as a post-hoc test to verify the statistical significance of the findings. p-values of < 0.05 were considered to be statistically significant.

3. Results

In the OC, the BMIhigh subgroup had significant higher Fmax (1087.42 ± 311.05 N, p = 0.01) and Mtk (4.71 ± 0.37 cm2, p = 0.03) values than the BMIlow (655.42 ± 114.76 N; 3.88 ± 1.96 cm2, respectively) (Table 2). However, there was no significant difference of Fmax and Mtk between the BMIhigh (782.44 ± 157.00 N, 5.12 ± 0.63 cm2,) and BMIlow (619.26 ± 68.50 N, 4.05 ± 0.51 cm2,) subgroups in the non-OC.
In the BMIlow group, the difference in the distribution of muscle fiber type 1 and 2 showed that type 2 was about 0.86% higher in the non-OC group. Contrastively, type 1 was about 18.46% higher in the OC group.
In the BMInorm group, the difference in the distribution of muscle fiber type 1 and 2 showed that type 2 was about 4.16% higher in the non-OC group and 0.34% in the OC group.
In the BMIhigh group, the difference in the distribution of muscle fiber types 1 and 2 showed that type 1 was about 18.76% higher in the non-OC group. Contrastively, type 2 was about 34.35% higher in the OC group. Among the BMI levels group, the difference in the distribution of muscle fiber type 1 and 2 showed the greatest difference in the BMIhigh group (Table 3).

4. Discussion

The most important finding of the present study is that there were significantly greater values for Fmax and Mtk in the BMIhigh subgroup than the BMIlow subgroup among women consuming OC. The second most important finding of our study is that the OC-BMIhigh group had the greatest difference in proportions between type 1 (32.96%) and type 2 (67.31%) fibers.
Previous studies have reported that younger individuals with obesity may have greater muscle strength than their non-obese counterparts [28,29]. Moreover, higher CSA values may be a result of the load imposed by a larger body weight acting as a chronic stimulus to the muscle tissue [43,44,45]. Maffiuletti et al. concluded that intramuscular fat associated with obesity may confound the relationship between Mtk and strength [45]. This finding may help explain the relatively high strength observed in overweight subjects. The present study shows similar results; participants with a BMIhigh had greater Fmax and Mtk values. However, the BMIhigh subgroup in the non-OC group showed the lowest strength in terms of Fmax/Mtk, while the BMIhigh subgroup in the OC group had the highest strength. More interestingly, although the non-OC group had thicker Mtks in all three subgroups, Fmax and Fmax/Mtk were lower than all the subgroups in the OC group. Previous studies have reported a positive association between CSA and the percentage of type 2 muscle fibers in this population [46]. Concurrently, obese individuals have been shown to have a lower percentage of type 1 muscle fibers than normal-weight individuals [46]. The percentage of type 1 muscle fibers has been inversely related to body fat percentage [47].
Based on the results of previous studies, we analyzed muscle fiber composition to determine the proportion between type 1 and 2 muscle fibers according to BMI levels. In the OC group, a high BMI correlated with a high type 2 muscle fiber ratio, but in the non-OC group, the type 2 ratio did not increase with an increase in BMI. From these findings, it can be speculated that BMI and OC consumption may affect the levels of endogenous and exogenous estradiol and progesterone levels, as well as muscle strength, Mtk, and fiber composition. The impact of BMI on muscle composition and function may differ between OC and non-OC women due to the differences in substrate metabolism caused by endogenous and exogenous estradiol and progesterone during muscle strength training [4,48]. OCs alter steroid hormone concentrations; thus, exogenous and endogenous hormone level fluctuations may correspond to different types of muscle adaptations. Moreover, a high BMI in OC users may exert metabolic effects that could have an impact on physical performance [49].
However, some studies [13,50,51] reported no significant differences in muscle strength during menstrual cycle phases, suggesting that exogenous hormones alone may impact muscle strength. These findings are supported by Janse et al. [16]. Thus, most of the conflicting results in recent research on exercise performance on the menstrual cycle may be explained by methodological differences [16].
Many previous studies have reported that BMI may affect endogenous and exogenous hormone metabolism [52] because of the increased volume of distribution and altered plasma clearance in women with a high BMI. However, studies have also shown that different BMI levels impact strength training adaptation in women who consume OCs compared with those who do not. Thus, future research is required to determine the impact that different BMI levels have on muscle strength and structure in women who consume OCs compared with those who do not.
This study had several limitations. First, although nutrition plays an important role in muscle hypertrophy, we could not investigate its effect because the nutrient intake of the participants could not be assessed. Second, because muscle biopsy was only performed in participants who consented to it, certain analyses were performed on a smaller number of participants than others. Third, a previous study reported that it is necessary to measure an average of 150 muscle fibers to reduce variability [53]. In the present study, only five participants in the non-OC group and five participants in the OC group could be measured due to freeze damage in the muscle cells. Fourth, just leg-press strength was performed in this study; different results may have been obtained if a variety of muscle strengths had been included in the Fmax measurement.

5. Conclusions

In this study, we found that there was a significant difference in Fmax and Mtk according to the BMI level in the OC group, but no significant difference was found in the non-OC group. Moreover, the distribution of type 2 muscle fibers tended to be higher in the OC group of BMIhigh, although the sample size was small. Therefore, although no significant difference of Fmax and Mtk was found according to BMI level in the non-OC group in this study, the increase in BMI level appeared to be more associative of muscle strength in the OC group. Based on the present results, future studies are needed that consider the BMI level as well as the presence or absence of OC in future research about women’s muscle strength.

Author Contributions

Methodology, T.H., A.H. and M.V.; Writing—original draft, E.-S.S.; Writing—review & editing, P.P. and E.-S.S. All authors have read and agreed to the published version of the manuscript.

Funding

This research received no external funding.

Institutional Review Board Statement

The study was conducted in accordance with the Declaration of Helsinki, and approved by Ethics Committee of the Ruhr-University Bochum, Germany (IIA1-070118/07).

Informed Consent Statement

Informed consent was obtained from all subjects involved in the study.

Data Availability Statement

Data sharing is not applicable to this article.

Conflicts of Interest

The authors declare no conflict of interest.

References

  1. Lebrun, C.M. Effect of the different phases of the menstrual cycle and oral contraceptives on athletic performance. Sports Med. 1993, 16, 400–430. [Google Scholar] [CrossRef] [PubMed]
  2. Reilly, T. The Menstrual Cycle and Human Performance: An Overview. Biol. Rhythm. Res. 2000, 31, 29–40. [Google Scholar] [CrossRef]
  3. Oosthuyse, T.; Bosch, A.N. The effect of the menstrual cycle on exercise metabolism: Implications for exercise performance in eumenorrhoeic women. Sports Med. 2010, 40, 207–227. [Google Scholar] [CrossRef] [PubMed]
  4. Reis, E.; Frick, U.; Schmidtbleicher, D. Frequency variations of strength training sessions triggered by the phases of the menstrual cycle. Int. J. Sports Med. 1995, 16, 545–550. [Google Scholar] [CrossRef] [PubMed]
  5. Constantini, N.W.; Dubnov, G.; Lebrun, C.M. The menstrual cycle and sport performance. Clin. Sports Med. 2005, 24, e51–e82, xiii-xiv. [Google Scholar] [CrossRef]
  6. Janse de Jonge, X.A. Effects of the menstrual cycle on exercise performance. Sports Med. 2003, 33, 833–851. [Google Scholar] [CrossRef]
  7. Lebrun, C.M. The effect of the phase of the menstrual cycle and the birth control pill on athletic performance. Clin. Sports Med. 1994, 13, 419–441. [Google Scholar] [CrossRef]
  8. Elliott, K.J.; Cable, N.T.; Reilly, T.; Diver, M.J. Effect of menstrual cycle phase on the concentration of bioavailable 17-beta oestradiol and testosterone and muscle strength. Clin. Sci. 2003, 105, 663–669. [Google Scholar] [CrossRef] [Green Version]
  9. Redman, L.M.; Weatherby, R.P. Measuring performance during the menstrual cycle: A model using oral contraceptives. Med. Sci. Sports Exerc. 2004, 36, 130–136. [Google Scholar] [CrossRef]
  10. Rechichi, C.; Dawson, B.; Goodman, C. Athletic performance and the oral contraceptive. Int. J. Sports Physiol. Perform 2009, 4, 151–162. [Google Scholar] [CrossRef]
  11. McNulty, K.L.; Elliott-Sale, K.J.; Dolan, E.; Swinton, P.A.; Ansdell, P.; Goodall, S.; Thomas, K.; Hicks, K.M. The effects of menstrual cycle phase on exercise performance in eumenorrheic women: A systematic review and meta-analysis. Sports Med. 2020, 50, 1813–1827. [Google Scholar] [CrossRef] [PubMed]
  12. Phillips, S.K.; Sanderson, A.G.; Birch, K.; Bruce, S.A.; Woledge, R.C. Changes in maximal voluntary force of human adductor pollicis muscle during the menstrual cycle. J. Physiol. 1996, 496 Pt 2, 551–557. [Google Scholar] [CrossRef] [PubMed] [Green Version]
  13. Sarwar, R.; Niclos, B.B.; Rutherford, O.M. Changes in muscle strength, relaxation rate and fatiguability during the human menstrual cycle. J. Physiol. 1996, 493 Pt 1, 267–272. [Google Scholar] [CrossRef] [PubMed]
  14. Petrofsky, J.S.; LeDonne, D.M.; Rinehart, J.S.; Lind, A.R. Isometric strength and endurance during the menstrual cycle. Eur. J. Appl. Physiol. Occup. Physiol. 1976, 35, 1–10. [Google Scholar] [CrossRef] [PubMed]
  15. Elliott-Sale, K.J.; McNulty, K.L.; Ansdell, P.; Goodall, S.; Hicks, K.M.; Thomas, K.; Swinton, P.A.; Dolan, E. The effects of oral contraceptives on exercise performance in women: A systematic review and meta-analysis. Sports Med. 2020, 50, 1785–1812. [Google Scholar] [CrossRef] [PubMed]
  16. Janse, D.E.J.X.; Thompson, B.; Han, A. Methodological Recommendations for Menstrual Cycle Research in Sports and Exercise. Med. Sci. Sports Exerc. 2019, 51, 2610–2617. [Google Scholar] [CrossRef] [PubMed]
  17. Frisch, R.E.; Revelle, R. Height and weight at menarche and a hypothesis of menarche. Arch. Dis. Child. 1971, 46, 695–701. [Google Scholar] [CrossRef] [Green Version]
  18. Frisch, R.E.; Revelle, R. Height and weight at menarche and a hypothesis of critical body weights and adolescent events. Science 1970, 169, 397–399. [Google Scholar] [CrossRef]
  19. Dars, S.; Sayed, K.; Yousufzai, Z. Relationship of menstrual irregularities to BMI and nutritional status in adolescent girls. Pak. J. Med. Sci. 2014, 30, 141. [Google Scholar]
  20. Yeung, E.H.; Zhang, C.; Albert, P.S.; Mumford, S.L.; Ye, A.; Perkins, N.J.; Wactawski-Wende, J.; Schisterman, E.F. Adiposity and sex hormones across the menstrual cycle: The BioCycle Study. Int. J. Obes. 2012, 37, 237–243. [Google Scholar] [CrossRef] [Green Version]
  21. Santoro, N.; Lasley, B.; McConnell, D.; Allsworth, J.; Crawford, S.; Gold, E.B.; Finkelstein, J.S.; Greendale, G.A.; Kelsey, J.; Korenman, S.; et al. Body size and ethnicity are associated with menstrual cycle alterations in women in the early menopausal transition: The Study of Women’s Health across the Nation (SWAN) Daily Hormone Study. J. Clin. Endocrinol. Metab. 2004, 89, 2622–2631. [Google Scholar] [CrossRef] [PubMed] [Green Version]
  22. Randolph, J.F., Jr.; Sowers, M.; Gold, E.B.; Mohr, B.A.; Luborsky, J.; Santoro, N.; McConnell, D.S.; Finkelstein, J.S.; Korenman, S.G.; Matthews, K.A.; et al. Reproductive hormones in the early menopausal transition: Relationship to ethnicity, body size, and menopausal status. J. Clin. Endocrinol. Metab. 2003, 88, 1516–1522. [Google Scholar] [CrossRef] [PubMed]
  23. Jain, A.; Polotsky, A.J.; Rochester, D.; Berga, S.L.; Loucks, T.; Zeitlian, G.; Gibbs, K.; Polotsky, H.N.; Feng, S.; Isaac, B.; et al. Pulsatile luteinizing hormone amplitude and progesterone metabolite excretion are reduced in obese women. J. Clin. Endocrinol. Metab. 2007, 92, 2468–2473. [Google Scholar] [CrossRef] [PubMed]
  24. Cheymol, G. Effects of obesity on pharmacokinetics implications for drug therapy. Clin. Pharm. 2000, 39, 215–231. [Google Scholar] [CrossRef] [PubMed]
  25. Castro-Fernandez, C.; Olivares, A.; Soderlund, D.; Lopez-Alvarenga, J.C.; Zambrano, E.; Veldhuis, J.D.; Ulloa-Aguirre, A.; Mendez, J.P. A preponderance of circulating basic isoforms is associated with decreased plasma half-life and biological to immunological ratio of gonadotropin-releasing hormone-releasable luteinizing hormone in obese men. J. Clin. Endocrinol. Metab. 2000, 85, 4603–4610. [Google Scholar] [PubMed] [Green Version]
  26. Azziz, R. Reproductive endocrinologic alterations in female asymptomatic obesity. Fertil Steril 1989, 52, 703–725. [Google Scholar]
  27. Pescatello, L.S.; Kelsey, B.K.; Price, T.B.; Seip, R.L.; Angelopoulos, T.J.; Clarkson, P.M.; Gordon, P.M.; Moyna, N.M.; Visich, P.S.; Zoeller, R.F.; et al. The muscle strength and size response to upper arm, unilateral resistance training among adults who are overweight and obese. J. Strength Cond. Res. 2007, 21, 307–313. [Google Scholar]
  28. Zoico, E.; Di Francesco, V.; Guralnik, J.M.; Mazzali, G.; Bortolani, A.; Guariento, S.; Sergi, G.; Bosello, O.; Zamboni, M. Physical disability and muscular strength in relation to obesity and different body composition indexes in a sample of healthy elderly women. Int J. Obes. Relat. Metab. Disord. 2004, 28, 234–241. [Google Scholar] [CrossRef] [Green Version]
  29. Rolland, Y.; Lauwers-Cances, V.; Pahor, M.; Fillaux, J.; Grandjean, H.; Vellas, B. Muscle strength in obese elderly women: Effect of recreational physical activity in a cross-sectional study. Am. J. Clin. Nutr. 2004, 79, 552–557. [Google Scholar] [CrossRef] [Green Version]
  30. Albertson, B.D.; Zinaman, M.J. The prediction of ovulation and monitoring of the fertile period. Adv. Contracept. 1987, 3, 263–290. [Google Scholar] [CrossRef]
  31. Kelly, G. Body temperature variability (Part 1): A review of the history of body temperature and its variability due to site selection, biological rhythms, fitness, and aging. Altern. Med. Rev. 2006, 11, 278–293. [Google Scholar] [PubMed]
  32. Owen, J.A., Jr. Physiology of the menstrual cycle. Am. J. Clin. Nutr. 1975, 28, 333–338. [Google Scholar] [CrossRef] [PubMed]
  33. Su, H.W.; Yi, Y.C.; Wei, T.Y.; Chang, T.C.; Cheng, C.M. Detection of ovulation, a review of currently available methods. Bioeng. Transl. Med. 2017, 2, 238–246. [Google Scholar] [CrossRef] [PubMed]
  34. Angelozzi, M.; Madama, M.; Corsica, C.; Calvisi, V.; Properzi, G.; McCaw, S.T.; Cacchio, A. Rate of force development as an adjunctive outcome measure for return-to-sport decisions after anterior cruciate ligament reconstruction. J. Orthop. Sports Phys. Ther. 2012, 42, 772–780. [Google Scholar] [CrossRef] [PubMed]
  35. Martinson, H.; Stokes, M.J. Measurement of anterior tibial muscle size using real-time ultrasound imaging. Eur. J. Appl. Physiol. Occup. Physiol. 1991, 63, 250–254. [Google Scholar] [CrossRef] [PubMed]
  36. Reimer, C.D.; Gaulrapp, H.; Kelle, H. Sonographie der Muskeln, Sehnen und Nerven; Deutscher Ärzte-Verlag: Köln, Germany, 2004. [Google Scholar]
  37. Evans, W.J.; Coggan, A.R. Muscle biopsy as a tool in the study of aging. J. Gerontol. Ser. A Biol. Sci. Med. Sci. 1995, 50, 30–34. [Google Scholar] [CrossRef]
  38. Patel, H.P.; Jameson, K.A.; Syddall, H.E.; Martin, H.J.; Stewart, C.E.; Cooper, C.; Sayer, A.A. Developmental influences, muscle morphology, and sarcopenia in community-dwelling older men. J. Gerontol. A Biol. Sci. Med. Sci. 2012, 67, 82–87. [Google Scholar] [CrossRef] [Green Version]
  39. Bergström, J. Muscle electolytes in man. Scand. J. Clin. Lab. Investig. 1962, 14, 1–110. [Google Scholar]
  40. Goebel, H.H. Muscle Biopsy. In Diagnostic Neuropathology; Springer: Berlin/Heidelberg, Germany, 1990; pp. 203–290. [Google Scholar]
  41. Brooke, M.H.; Kaiser, K.K. Three “myosin adenosine triphosphatase” systems: The nature of their pH lability and sulfhydryl dependence. J. Histochem. Cytochem. 1970, 18, 670–672. [Google Scholar] [CrossRef]
  42. Yan, Z. Skeletal muscle adaptation and cell cycle regulation. Exerc. Sport Sci. Rev. 2000, 28, 24–26. [Google Scholar]
  43. Hulens, M.; Vansant, G.; Lysens, R.; Claessens, A.L.; Muls, E.; Brumagne, S. Study of differences in peripheral muscle strength of lean versus obese women: An allometric approach. Int. J. Obes. Relat. Metab. Disord. 2001, 25, 676–681. [Google Scholar] [CrossRef] [PubMed] [Green Version]
  44. Lafortuna, C.L.; Maffiuletti, N.A.; Agosti, F.; Sartorio, A. Gender variations of body composition, muscle strength and power output in morbid obesity. Int. J. Obes 2005, 29, 833–841. [Google Scholar] [CrossRef] [PubMed] [Green Version]
  45. Maffiuletti, N.A.; Jubeau, M.; Munzinger, U.; Bizzini, M.; Agosti, F.; De Col, A.; Lafortuna, C.L.; Sartorio, A. Differences in quadriceps muscle strength and fatigue between lean and obese subjects. Eur. J. Appl. Physiol. 2007, 101, 51–59. [Google Scholar] [CrossRef] [PubMed]
  46. Hickey, M.S.; Carey, J.O.; Azevedo, J.L.; Houmard, J.A.; Pories, W.J.; Israel, R.G.; Dohm, G.L. Skeletal muscle fiber composition is related to adiposity and in vitro glucose transport rate in humans. Am. J. Physiol. 1995, 268 Pt 1, E453–E457. [Google Scholar] [CrossRef] [PubMed]
  47. Wade, A.J.; Marbut, M.M.; Round, J.M. Muscle fibre type and aetiology of obesity. Lancet 1990, 335, 805–808. [Google Scholar] [CrossRef]
  48. Sung, E.; Han, A.; Hinrichs, T.; Vorgerd, M.; Manchado, C.; Platen, P. Effects of follicular versus luteal phase-based strength training in young women. Springerplus 2014, 3, 668. [Google Scholar] [CrossRef] [Green Version]
  49. Rickenlund, A.; Carlstrom, K.; Ekblom, B.; Brismar, T.B.; Von Schoultz, B.; Hirschberg, A.L. Effects of oral contraceptives on body composition and physical performance in female athletes. J. Clin. Endocrinol. Metab. 2004, 89, 4364–4370. [Google Scholar] [CrossRef] [Green Version]
  50. Wirth, J.C.; Lohman, T.G. The relationship of static muscle function to use of oral contraceptives. Med. Sci. Sports Exerc. 1982, 14, 16–20. [Google Scholar] [CrossRef]
  51. Peters, C.; Burrows, M. Androgenicity of the progestin in oral contraceptives does not affect maximal leg strength. Contraception 2006, 74, 487–491. [Google Scholar] [CrossRef]
  52. Higginbotham, S. Contraceptive considerations in obese women: Release date 1 September 2009, SFP Guideline 20091. Contraception 2009, 80, 583–590. [Google Scholar]
  53. Lexell, J.; Taylor, C.; Sjostrom, M. Analysis of sampling errors in biopsy techniques using data from whole muscle cross sections. J. Appl. Physiol. 1985, 59, 1228–1235. [Google Scholar] [CrossRef] [PubMed]
Figure 1. Flow diagram for the selection of study participants and experimental procedure.
Ijerph 19 09789 g001
Figure 2. Histochemical analysis used to determine the proportion of muscle fiber types 1 and 2 using adenosine-triphosphatase staining.
Ijerph 19 09789 g002
Table 1. Participants’ characteristics.
Characteristicsnon-OC (n = 31)OC (n = 27)
BMIlow
(n = 10)
BMInorm
(n = 10)
BMIhigh
(n = 11)
BMIlow
(n = 9)
BMInorm
(n = 9)
BMIhigh
(n = 9)
Age (y)25.10 ± 4.6126.18 ± 4.6225.00 ± 4.6924.25 ± 4.3324.90 ± 4.0925.20 ± 5.31
Height (m)1.66 ± 0.041.62 ± 0.061.64 ± 0.041.65 ± 0.081.66 ± 0.061.67 ± 0.06
Weight (kg)49.70 ± 3.5958.91 ± 5.0375.00 ± 5.1348.13 ± 6.1360.80 ± 4.3277.20 ± 4.85
BMI (kg/m2)17.94 ± 1.1422.43 ± 1.1927.84 ± 1.9117.67 ± 0.9522.13 ± 0.99 27.28 ± 1.65
non-OC, not taking oral contraceptive; OC, taking oral contraceptive; BMIlow, body mass index < 18.5; BMInorm, 18.5 ≤ body mass index < 25; BMIhigh, body mass index ≥ 25. Values are presented as mean ± standard deviation.
Table 2. Fmax, Mtk, and Fmax/Mtk for the BMIlow, BMInorm, and BMIhigh subgroups in the non-OC and OC.
Variablesnon-OC (n = 31) OC (n = 27)
BMIlow
(n = 10)
BMInorm
(n = 10)
BMIhigh
(n = 11)
FpBMIlow
(n = 9)
BMInorm
(n = 9)
BMIhigh
(n = 9)
Fp
Fmax
(N)
619.26 ± 68.50657.09 ± 128.18782.44 ± 157.001.650.23655.42 ± 114.76842.02 ± 136.321087.42 ± 311.055.770.01 *
Mtk
(cm2)
4.05 ± 0.514.34 ± 0.755.12 ± 0.632.190.153.88 ± 1.964.15 ± 0.374.71 ± 0.374.520.03 *
Fmax/Mtk
(N)
155.62 ± 31.36156.31 ± 44.79152.00 ± 18.720.140.99168.66 ± 36.26203.06 ± 27.93232.46 ± 71.541.940.18
OC, taking oral contraceptive; non-OC, not taking oral contraceptive; Fmax, maximum isometric force; Mtk, sum of m. rectus femoris and m. vastus lateralis muscle thickness; Fmax/Mtk, Fmax divided by Mtk; BMIlow, body mass index < 18.5; BMInorm, 18.5 ≤ body mass index < 25; BMIhigh, body mass index ≥ 25. Values are presented as the mean ± standard deviation. * Significantly different compared to the BMIlow and BMIhigh (p < 0.05).
Table 3. Proportion of muscle fiber types 1 and 2 from the vastus lateralis for the BMIlow, BMInorm, and BMIhigh subgroups in the non-OC and OC.
Groupnon-OC
(n = 5)
OC
(n = 5)
Muscle fiber typeType 1Type 2Type 1Type 2
BMIlow (%)49.5750.4359.2340.77
BMInorm(%)47.9252.0849.8350.17
BMIhigh(%)59.3840.6232.9667.31
OC, taking oral contraceptive; non-OC, not taking oral contraceptive; BMIlow, body mass index < 18.5; BMInorm, 18.5 ≤ body mass index < 25; BMIhigh, body mass index ≥ 25.
Publisher’s Note: MDPI stays neutral with regard to jurisdictional claims in published maps and institutional affiliations.

