
Effects of Intermittent Energy Restriction Alone and in Combination with Sprint Interval Training on Body Composition and Cardiometabolic Biomarkers in Individuals with Overweight and Obesity

 ,
,  ,
,
Abstract
:1. Introduction
2. Materials and Methods
2.1. Participants
2.2. Study Overview
2.3. Randomisation and Intervention Protocols
2.4. Anthropometric and Fitness Assessments
2.4.1. Body Weight, Height and Body Mass Index
2.4.2. Body Composition Assessment
2.5. Haemodynamic Assessment
2.5.1. Central and Peripheral Blood Pressure
2.5.2. Pulse Wave Velocity
2.6. Aerobic Capacity (VO2) Testing
2.7. Cardiometabolic Biomarker Assessment
2.7.1. Serum and Plasma Markers of Metabolic and Cardiovascular Risk
2.7.2. Oral Glucose Tolerance Testing
2.8. Nutritional Intake Assessment
2.9. Physical Activity Monitoring
2.10. Statistical Analysis
3. Results
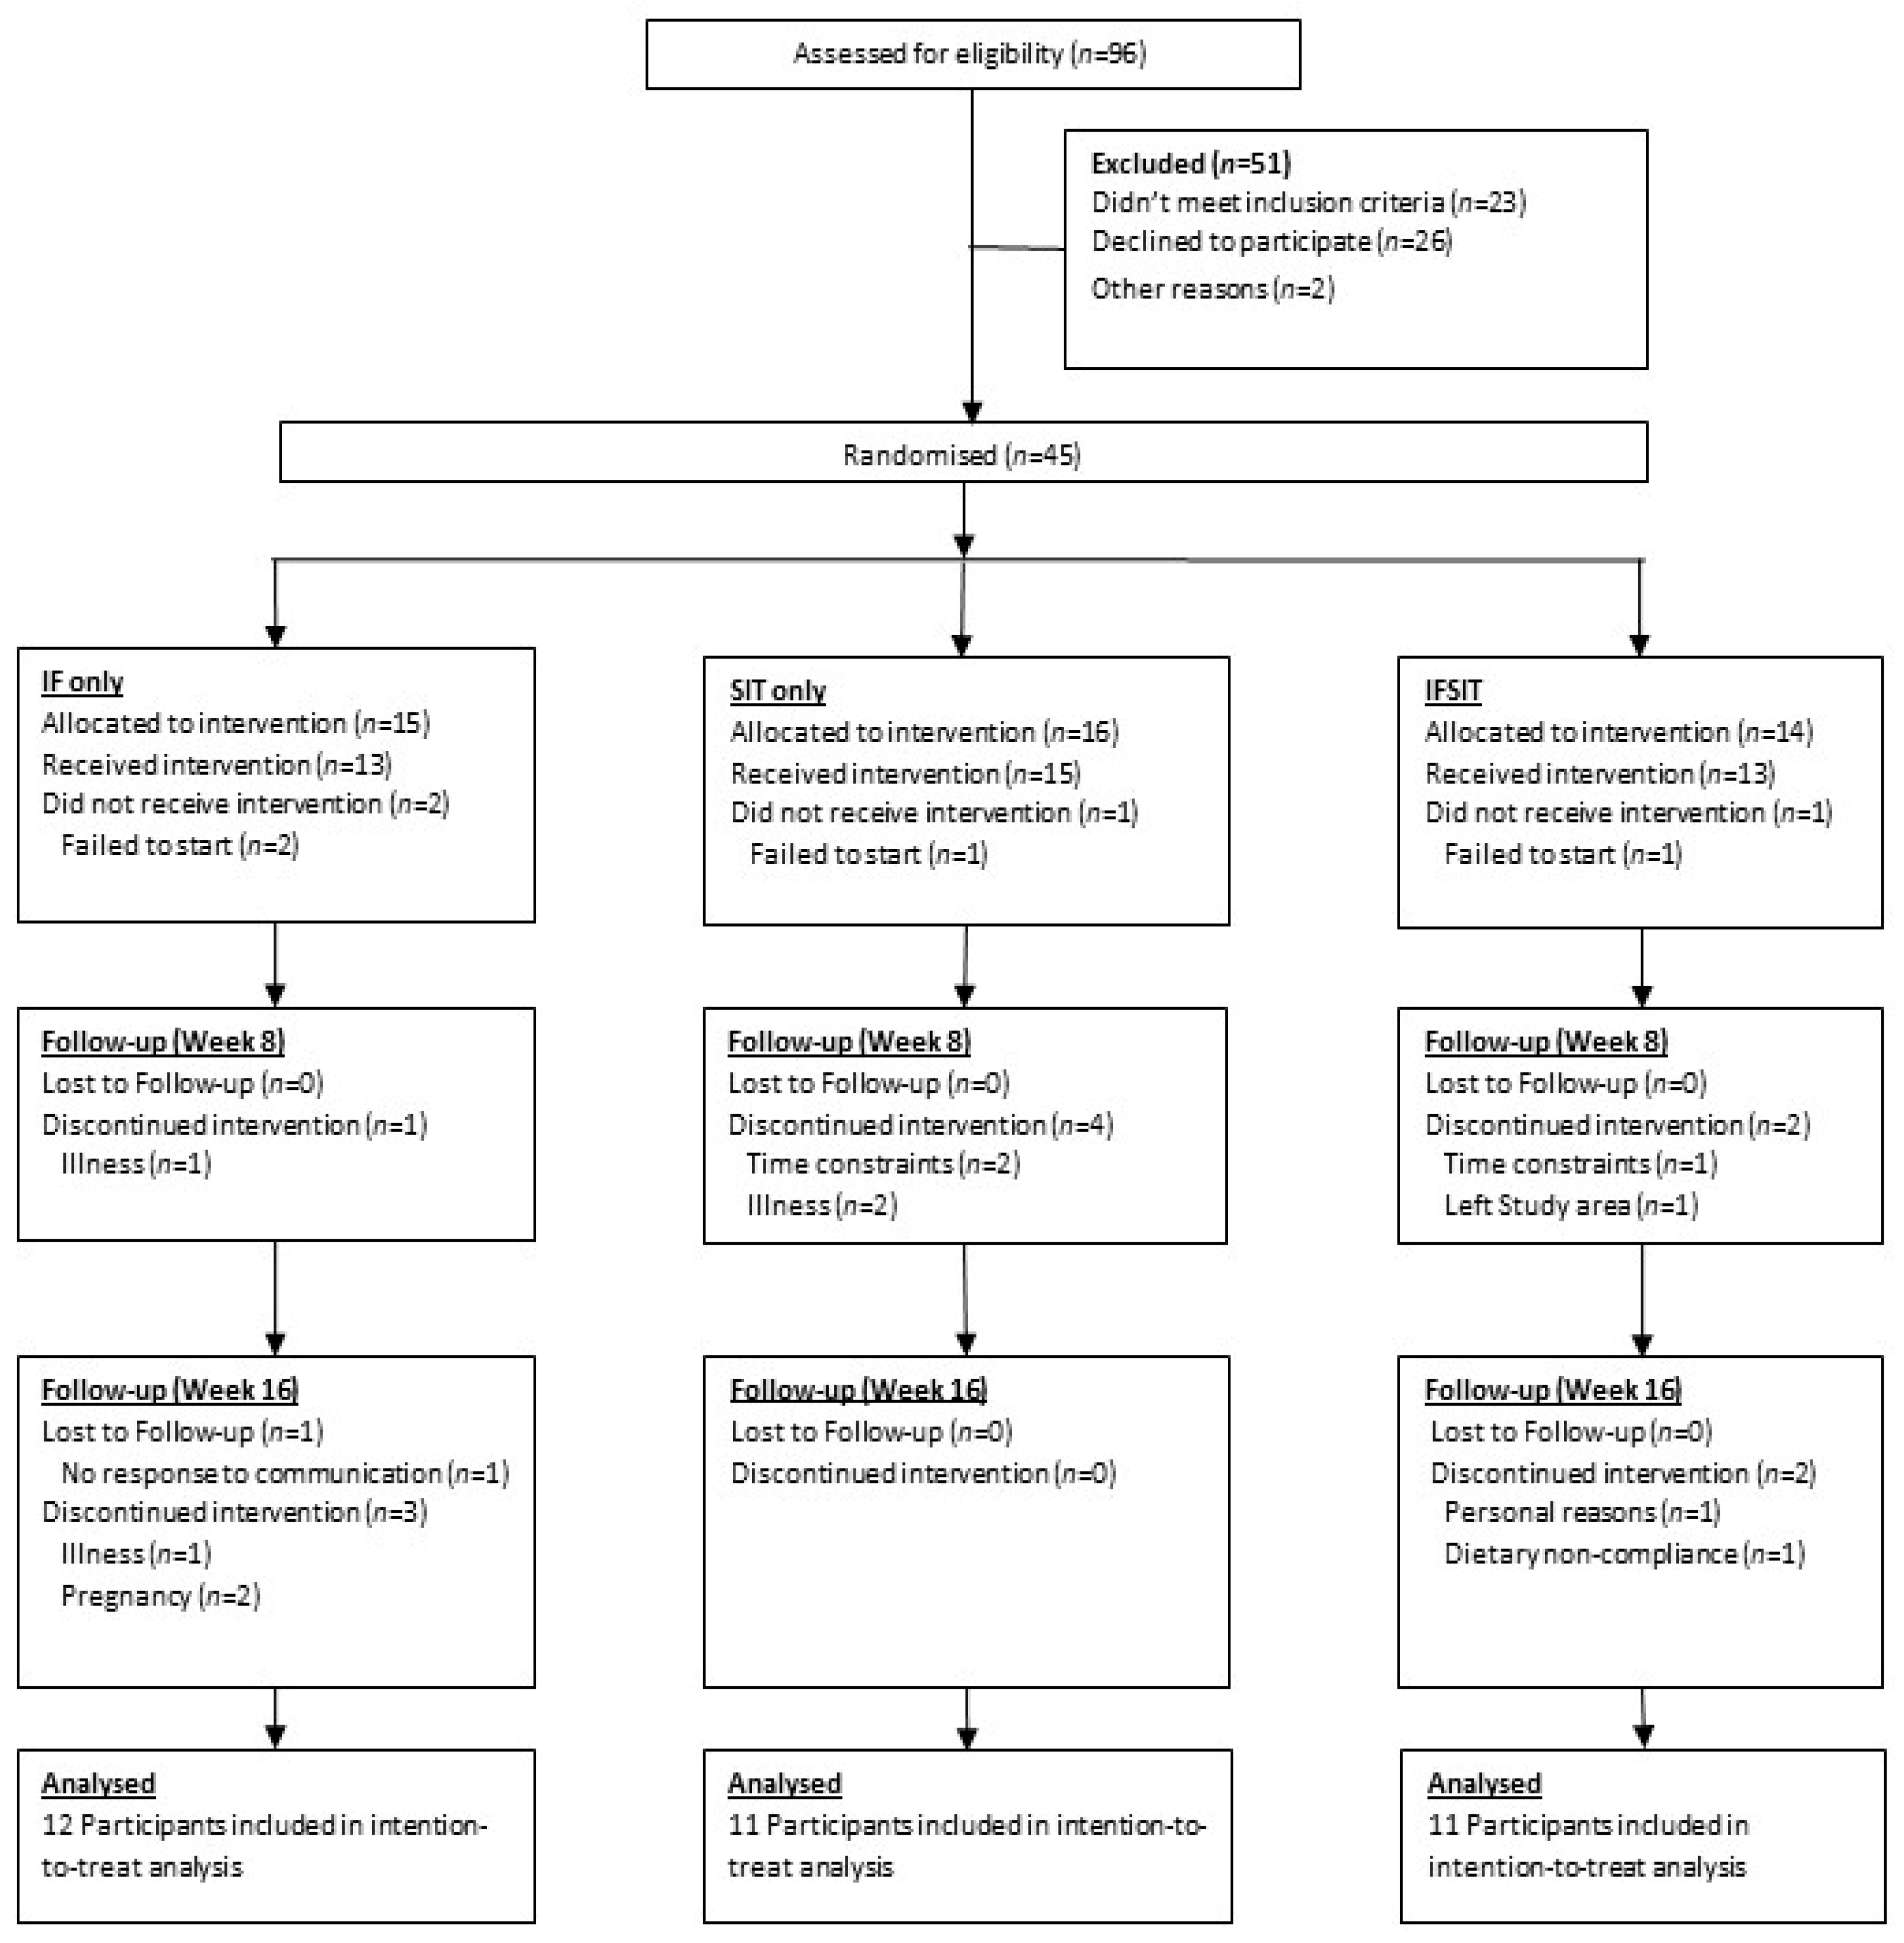
3.1. Participants
3.2. Adherence to Exercise and/or Dietary Intervention
3.3. Anthropometric Analysis before and after Intervention
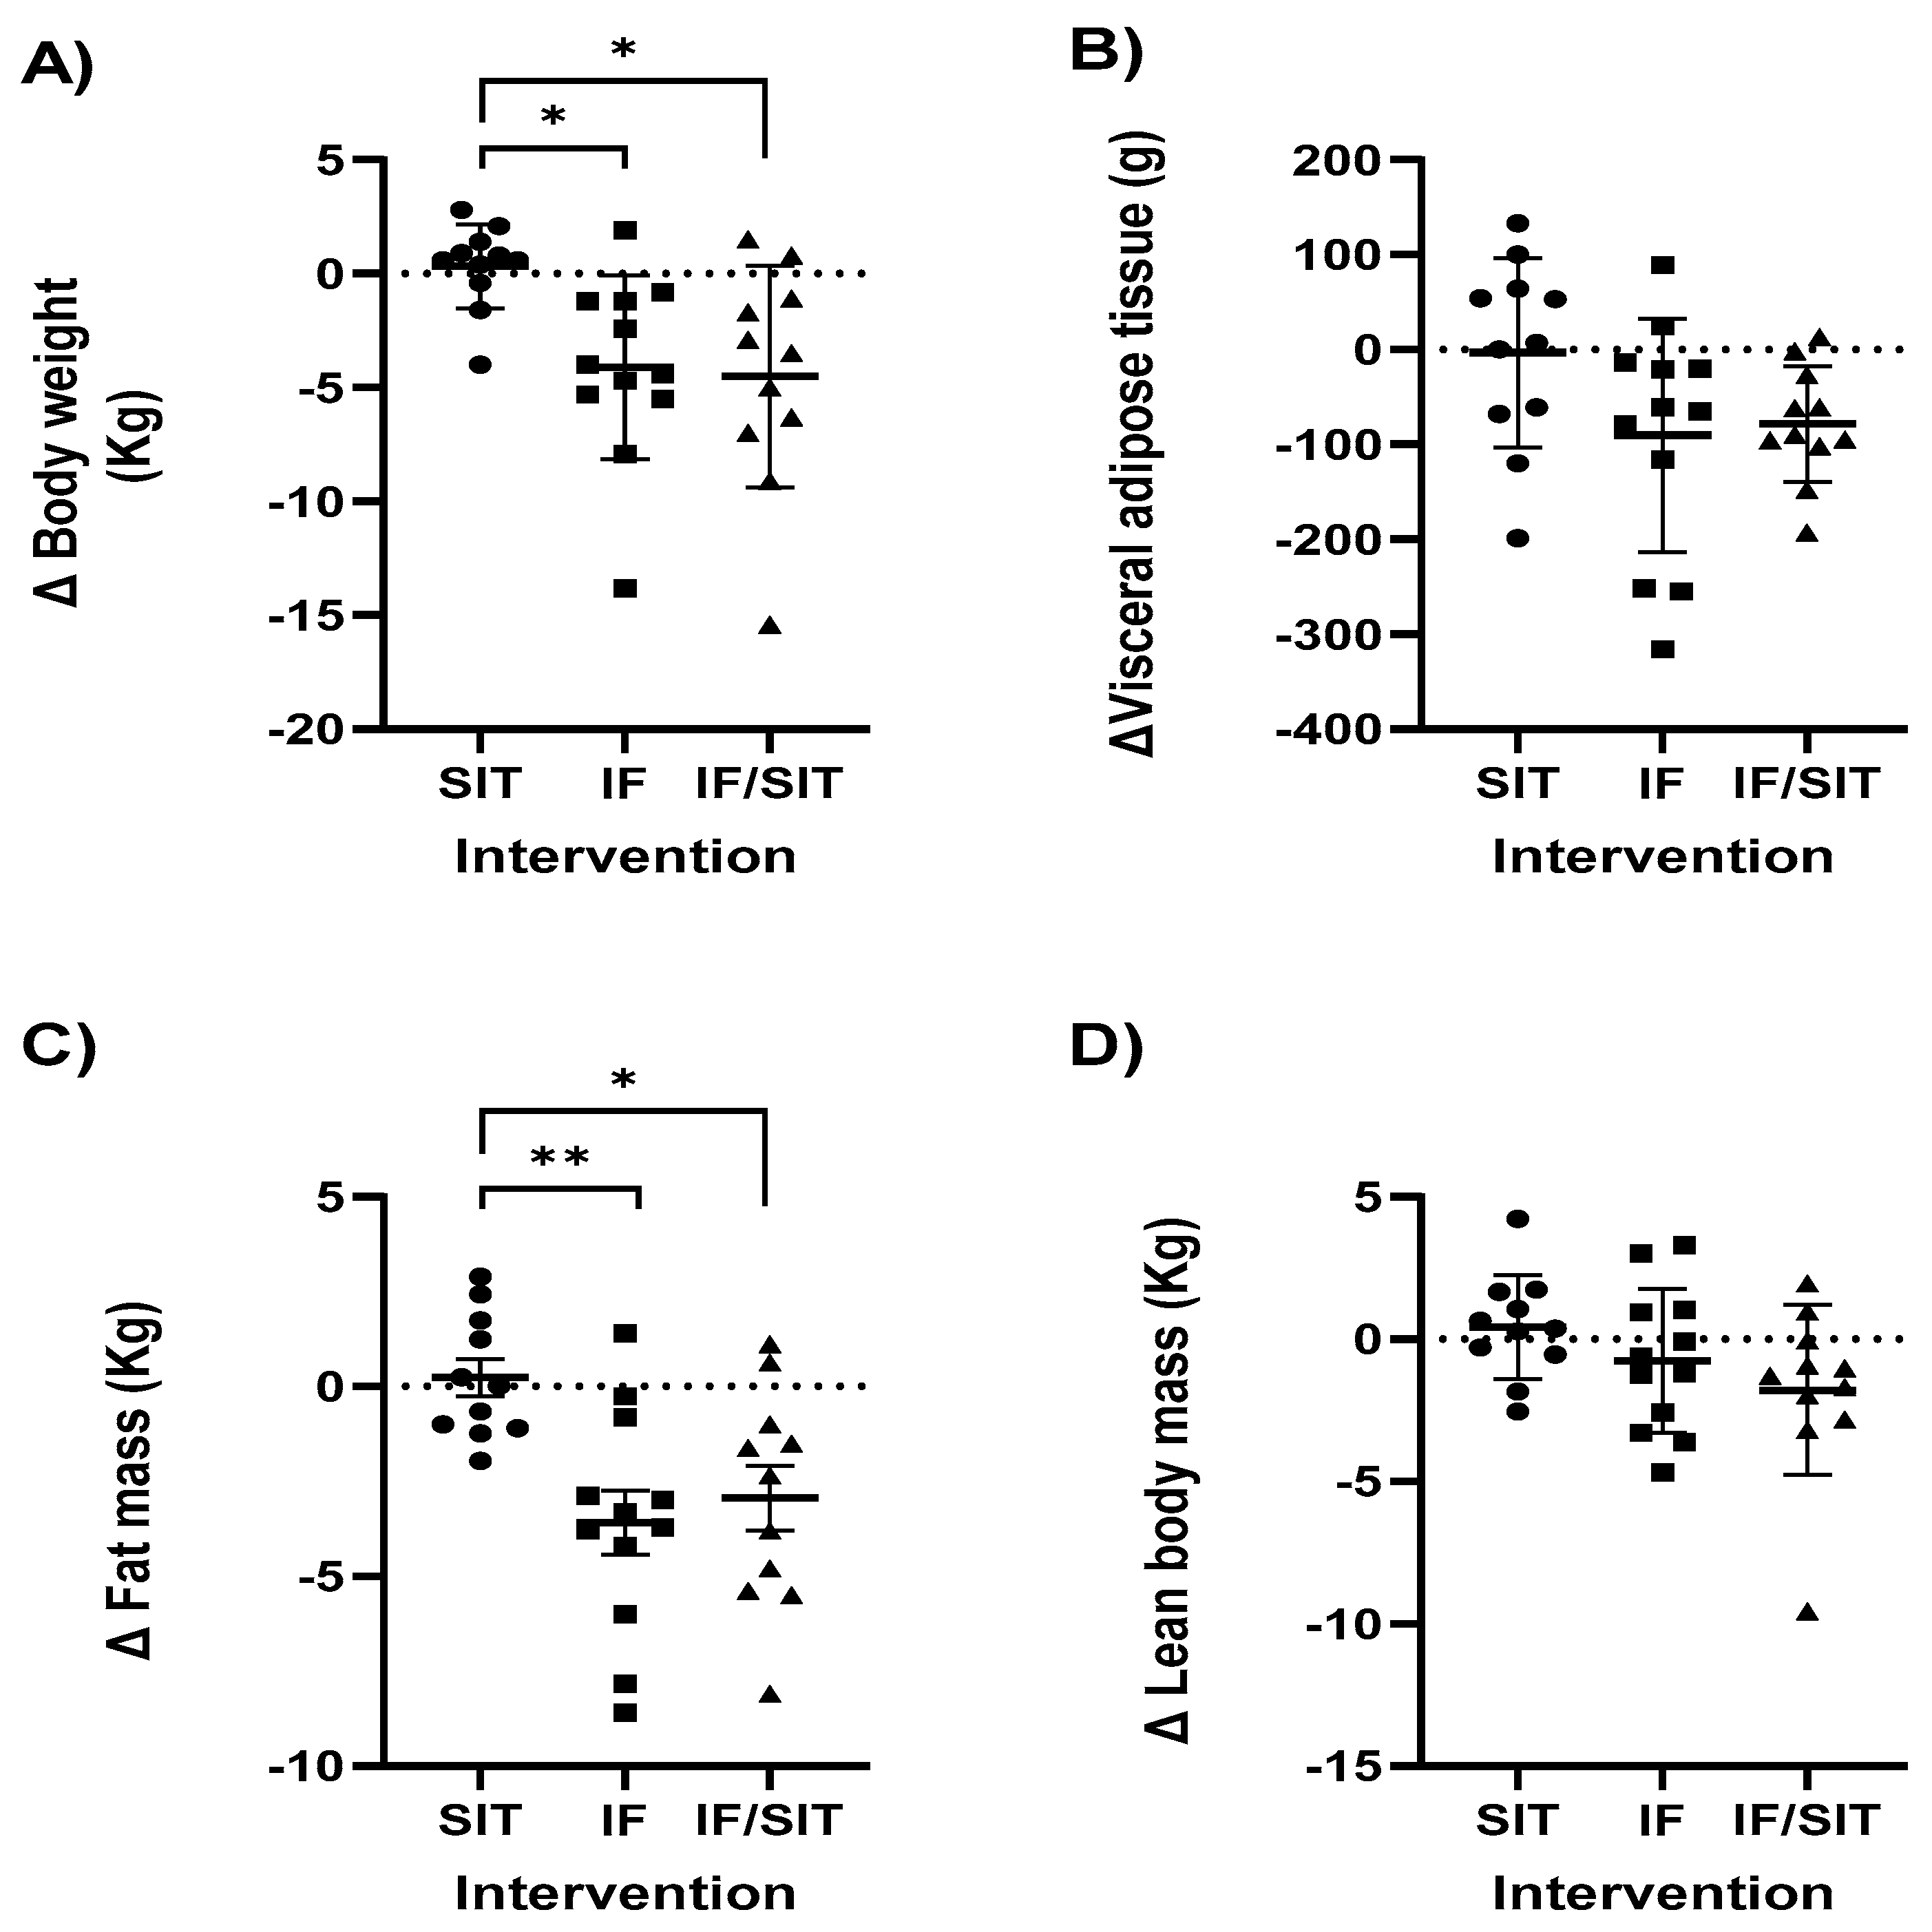
3.3.1. Body Weight
3.3.2. Waist Circumference and Waist to Hip Ratio
3.3.3. Body Composition
3.4. Aerobic Capacity
3.5. Haemodynamic Measures
3.6. Cardiometabolic Biomarkers
3.6.1. Triglycerides, Total Cholesterol, LDL and HDL
3.6.2. Glucose, Markers of Glucose Tolerance and Insulin Resistance
3.7. Dietary Intake Analysis
3.8. Physical Activity Levels
4. Discussion
5. Conclusions
Author Contributions
Funding
Institutional Review Board Statement
Informed Consent Statement
Data Availability Statement
Acknowledgments
Conflicts of Interest
References
- Roser, H.; Roser, M. Obesity. Available online: https://ourworldindata.org/obesity (accessed on 1 May 2022).
- Stenvinkel, P. Obesity—A disease with many aetiologies disguised in the same oversized phenotype: Has the overeating theory failed? Nephrol. Dial. Transplant. 2015, 30, 1656–1664. [Google Scholar] [CrossRef] [PubMed] [Green Version]
- Donnelly, J.E.; Blair, S.N.; Jakicic, J.M.; Manore, M.M.; Rankin, J.W.; Smith, B.K.; American College of Sports Medicine. American College of Sports Medicine Position Stand. Appropriate physical activity intervention strategies for weight loss and prevention of weight regain for adults. Med. Sci. Sports Exerc. 2009, 41, 459–471. [Google Scholar] [CrossRef] [PubMed]
- Neter, J.E.; Stam, B.E.; Kok, F.J.; Grobbee, D.E.; Geleijnse, J.M. Influence of weight reduction on blood pressure: A meta-analysis of randomized controlled trials. Hypertension 2003, 42, 878–884. [Google Scholar] [CrossRef] [PubMed]
- Clark, J.E. Diet, exercise or diet with exercise: Comparing the effectiveness of treatment options for weight-loss and changes in fitness for adults (18–65 years old) who are overfat, or obese; systematic review and meta-analysis. J. Diabetes Metab. Disord. 2015, 14, 31. [Google Scholar] [CrossRef] [Green Version]
- Tchernof, A.; Nolan, A.; Sites, C.K.; Ades, P.A.; Poehlman, E.T. Weight loss reduces C-reactive protein levels in obese postmenopausal women. Circulation 2002, 105, 564–569. [Google Scholar] [CrossRef] [Green Version]
- MacLean, P.S.; Wing, R.R.; Davidson, T.; Epstein, L.; Goodpaster, B.; Hall, K.D.; Levin, B.E.; Perri, M.G.; Rolls, B.J.; Rosenbaum, M.; et al. NIH working group report: Innovative research to improve maintenance of weight loss. Obesity 2015, 23, 7–15. [Google Scholar] [CrossRef]
- Rynders, C.A.; Thomas, E.A.; Zaman, A.; Pan, Z.; Catenacci, V.A.; Melanson, E.L. Effectiveness of Intermittent Fasting and Time-Restricted Feeding Compared to Continuous Energy Restriction for Weight Loss. Nutrients 2019, 11, 2442. [Google Scholar] [CrossRef] [Green Version]
- Dote-Montero, M.; Sanchez-Delgado, G.; Ravussin, E. Effects of Intermittent Fasting on Cardiometabolic Health: An Energy Metabolism Perspective. Nutrients 2022, 14, 489. [Google Scholar] [CrossRef]
- O’Connor, S.G.; Boyd, P.; Bailey, C.P.; Shams-White, M.M.; Agurs-Collins, T.; Hall, K.; Reedy, J.; Sauter, E.R.; Czajkowski, S.M. Perspective: Time-Restricted Eating Compared with Caloric Restriction: Potential Facilitators and Barriers of Long-Term Weight Loss Maintenance. Adv. Nutr. 2021, 12, 325–333. [Google Scholar] [CrossRef]
- Patikorn, C.; Roubal, K.; Veettil, S.K.; Chandran, V.; Pham, T.; Lee, Y.Y.; Giovannucci, E.L.; Varady, K.A.; Chaiyakunapruk, N. Intermittent Fasting and Obesity-Related Health Outcomes: An Umbrella Review of Meta-analyses of Randomized Clinical Trials. JAMA Netw. Open 2021, 4, e2139558. [Google Scholar] [CrossRef]
- Sutton, E.F.; Beyl, R.; Early, K.S.; Cefalu, W.T.; Ravussin, E.; Peterson, C.M. Early Time-Restricted Feeding Improves Insulin Sensitivity, Blood Pressure, and Oxidative Stress Even without Weight Loss in Men with Prediabetes. Cell Metab. 2018, 27, 1212–1221.e3. [Google Scholar] [CrossRef] [PubMed] [Green Version]
- Weiss, E.P.; Jordan, R.C.; Frese, E.M.; Albert, S.G.; Villareal, D.T. Effects of Weight Loss on Lean Mass, Strength, Bone, and Aerobic Capacity. Med. Sci. Sports Exerc. 2017, 49, 206–217. [Google Scholar] [CrossRef] [PubMed]
- Templeman, I.; Smith, H.A.; Chowdhury, E.; Chen, Y.C.; Carroll, H.; Johnson-Bonson, D.; Hengist, A.; Smith, R.; Creighton, J.; Clayton, D.; et al. A randomized controlled trial to isolate the effects of fasting and energy restriction on weight loss and metabolic health in lean adults. Sci. Transl. Med. 2021, 13, eabd8034. [Google Scholar] [CrossRef] [PubMed]
- Roman, Y.M.; Dominguez, M.C.; Easow, T.M.; Pasupuleti, V.; White, C.M.; Hernandez, A.V. Effects of intermittent versus continuous dieting on weight and body composition in obese and overweight people: A systematic review and meta-analysis of randomized controlled trials. Int. J. Obes. 2019, 43, 2017–2027. [Google Scholar] [CrossRef] [PubMed]
- Dulloo, A.G.; Jacquet, J.; Miles-Chan, J.L.; Schutz, Y. Passive and active roles of fat-free mass in the control of energy intake and body composition regulation. Eur. J. Clin. Nutr. 2017, 71, 353–357. [Google Scholar] [CrossRef] [Green Version]
- Anton, S.D.; Moehl, K.; Donahoo, W.T.; Marosi, K.; Lee, S.A.; Mainous, A.G., 3rd; Leeuwenburgh, C.; Mattson, M.P. Flipping the Metabolic Switch: Understanding and Applying the Health Benefits of Fasting. Obesity 2018, 26, 254–268. [Google Scholar] [CrossRef]
- Alhamdan, B.A.; Garcia-Alvarez, A.; Alzahrnai, A.H.; Karanxha, J.; Stretchberry, D.R.; Contrera, K.J.; Utria, A.F.; Cheskin, L.J. Alternate-day versus daily energy restriction diets: Which is more effective for weight loss? A systematic review and meta-analysis. Obes. Sci. Pract. 2016, 2, 293–302. [Google Scholar] [CrossRef]
- Lees, M.J.; Hodson, N.; Moore, D.R. A muscle-centric view of time-restricted feeding for older adults. Curr. Opin. Clin. Nutr. Metab. Care 2021, 24, 521–527. [Google Scholar] [CrossRef]
- Keenan, S.; Cooke, M.B.; Belski, R. The Effects of Intermittent Fasting Combined with Resistance Training on Lean Body Mass: A Systematic Review of Human Studies. Nutrients 2020, 12, 2349. [Google Scholar] [CrossRef]
- Gibala, M.J.; Little, J.P.; Macdonald, M.J.; Hawley, J.A. Physiological adaptations to low-volume, high-intensity interval training in health and disease. J. Physiol. 2012, 590, 1077–1084. [Google Scholar] [CrossRef]
- Trapp, E.G.; Chisholm, D.J.; Freund, J.; Boutcher, S.H. The effects of high-intensity intermittent exercise training on fat loss and fasting insulin levels of young women. Int. J. Obes. 2008, 32, 684–691. [Google Scholar] [CrossRef] [PubMed] [Green Version]
- Gillen, J.B.; Martin, B.J.; MacInnis, M.J.; Skelly, L.E.; Tarnopolsky, M.A.; Gibala, M.J. Twelve Weeks of Sprint Interval Training Improves Indices of Cardiometabolic Health Similar to Traditional Endurance Training despite a Five-Fold Lower Exercise Volume and Time Commitment. PLoS ONE 2016, 11, e0154075. [Google Scholar] [CrossRef] [PubMed]
- Wilson, R.A.; Deasy, W.; Stathis, C.G.; Hayes, A.; Cooke, M.B. Intermittent Fasting with or without Exercise Prevents Weight Gain and Improves Lipids in Diet-Induced Obese Mice. Nutrients 2018, 10, 346. [Google Scholar] [CrossRef] [Green Version]
- Wilson, R.A.; Stathis, C.G.; Hayes, A.; Cooke, M.B. Intermittent Fasting and High-Intensity Exercise Elicit Sexual-Dimorphic and Tissue-Specific Adaptations in Diet-Induced Obese Mice. Nutrients 2020, 12, 1764. [Google Scholar] [CrossRef] [PubMed]
- National Health and Medical Research Council. Australian Dietary Guidelines Summary; National Health and Medical Research Council: Canberra, Australia, 2013.
- Tang, Q.; Li, X.; Song, P.; Xu, L. Optimal cut-off values for the homeostasis model assessment of insulin resistance (HOMA-IR) and pre-diabetes screening: Developments in research and prospects for the future. Drug Discov. Ther. 2015, 9, 380–385. [Google Scholar] [CrossRef] [PubMed] [Green Version]
- Tinsley, G.M.; La Bounty, P.M. Effects of intermittent fasting on body composition and clinical health markers in humans. Nutr. Rev. 2015, 73, 661–674. [Google Scholar] [CrossRef]
- Varady, K.A.; Cienfuegos, S.; Ezpeleta, M.; Gabel, K. Clinical application of intermittent fasting for weight loss: Progress and future directions. Nat. Rev. Endocrinol. 2022, 18, 309–321. [Google Scholar] [CrossRef]
- Welton, S.; Minty, R.; O’Driscoll, T.; Willms, H.; Poirier, D.; Madden, S.; Kelly, L. Intermittent fasting and weight loss: Systematic review. Can. Fam. Physician 2020, 66, 117–125. [Google Scholar]
- Harvie, M.; Wright, C.; Pegington, M.; McMullan, D.; Mitchell, E.; Martin, B.; Cutler, R.G.; Evans, G.; Whiteside, S.; Maudsley, S.; et al. The effect of intermittent energy and carbohydrate restriction v. daily energy restriction on weight loss and metabolic disease risk markers in overweight women. Br. J. Nutr. 2013, 110, 1534–1547. [Google Scholar] [CrossRef] [Green Version]
- Schubel, R.; Nattenmuller, J.; Sookthai, D.; Nonnenmacher, T.; Graf, M.E.; Riedl, L.; Schlett, C.L.; von Stackelberg, O.; Johnson, T.; Nabers, D.; et al. Effects of intermittent and continuous calorie restriction on body weight and metabolism over 50 wk: A randomized controlled trial. Am. J. Clin. Nutr. 2018, 108, 933–945. [Google Scholar] [CrossRef]
- Fitzgerald, K.C.; Vizthum, D.; Henry-Barron, B.; Schweitzer, A.; Cassard, S.D.; Kossoff, E.; Hartman, A.L.; Kapogiannis, D.; Sullivan, P.; Baer, D.J.; et al. Effect of intermittent vs. daily calorie restriction on changes in weight and patient-reported outcomes in people with multiple sclerosis. Mult. Scler. Relat. Disord. 2018, 23, 33–39. [Google Scholar] [CrossRef] [PubMed]
- Sundfor, T.M.; Svendsen, M.; Tonstad, S. Effect of intermittent versus continuous energy restriction on weight loss, maintenance and cardiometabolic risk: A randomized 1-year trial. Nutr. Metab. Cardiovasc. Dis. 2018, 28, 698–706. [Google Scholar] [CrossRef] [PubMed] [Green Version]
- Harris, L.; McGarty, A.; Hutchison, L.; Ells, L.; Hankey, C. Short-term intermittent energy restriction interventions for weight management: A systematic review and meta-analysis. Obes. Rev. 2018, 19, 1–13. [Google Scholar] [CrossRef] [PubMed] [Green Version]
- Headland, M.; Clifton, P.M.; Carter, S.; Keogh, J.B. Weight-Loss Outcomes: A Systematic Review and Meta-Analysis of Intermittent Energy Restriction Trials Lasting a Minimum of 6 Months. Nutrients 2016, 8, 354. [Google Scholar] [CrossRef] [Green Version]
- Heymsfield, S.B.; Gonzalez, M.C.; Shen, W.; Redman, L.; Thomas, D. Weight loss composition is one-fourth fat-free mass: A critical review and critique of this widely cited rule. Obes. Rev. 2014, 15, 310–321. [Google Scholar] [CrossRef]
- Harvie, M.N.; Pegington, M.; Mattson, M.P.; Frystyk, J.; Dillon, B.; Evans, G.; Cuzick, J.; Jebb, S.A.; Martin, B.; Cutler, R.G.; et al. The effects of intermittent or continuous energy restriction on weight loss and metabolic disease risk markers: A randomized trial in young overweight women. Int. J. Obes. 2011, 35, 714–727. [Google Scholar] [CrossRef] [Green Version]
- Hutchison, A.T.; Liu, B.; Wood, R.E.; Vincent, A.D.; Thompson, C.H.; O’Callaghan, N.J.; Wittert, G.A.; Heilbronn, L.K. Effects of Intermittent Versus Continuous Energy Intakes on Insulin Sensitivity and Metabolic Risk in Women with Overweight. Obesity 2019, 27, 50–58. [Google Scholar] [CrossRef] [Green Version]
- Varady, K.A. Intermittent versus daily calorie restriction: Which diet regimen is more effective for weight loss? Obes. Rev. 2011, 12, e593–e601. [Google Scholar] [CrossRef]
- Enriquez Guerrero, A.; San Mauro Martin, I.; Garicano Vilar, E.; Camina Martin, M.A. Effectiveness of an intermittent fasting diet versus continuous energy restriction on anthropometric measurements, body composition and lipid profile in overweight and obese adults: A meta-analysis. Eur. J. Clin. Nutr. 2021, 75, 1024–1039. [Google Scholar] [CrossRef]
- Sultana, R.N.; Sabag, A.; Keating, S.E.; Johnson, N.A. The Effect of Low-Volume High-Intensity Interval Training on Body Composition and Cardiorespiratory Fitness: A Systematic Review and Meta-Analysis. Sports Med. 2019, 49, 1687–1721. [Google Scholar] [CrossRef]
- Guo, Z.; Cai, J.; Wu, Z.; Gong, W. Effect of High-Intensity Interval Training Combined with Fasting in the Treatment of Overweight and Obese Adults: A Systematic Review and Meta-Analysis. Int. J. Environ. Res. Public Health 2022, 19, 4638. [Google Scholar] [CrossRef] [PubMed]
- Martinez-Rodriguez, A.; Rubio-Arias, J.A.; Garcia-De Frutos, J.M.; Vicente-Martinez, M.; Gunnarsson, T.P. Effect of High-Intensity Interval Training and Intermittent Fasting on Body Composition and Physical Performance in Active Women. Int. J. Environ. Res. Public Health 2021, 18, 6431. [Google Scholar] [CrossRef] [PubMed]
- Areta, J.L.; Burke, L.M.; Camera, D.M.; West, D.W.; Crawshay, S.; Moore, D.R.; Stellingwerff, T.; Phillips, S.M.; Hawley, J.A.; Coffey, V.G. Reduced resting skeletal muscle protein synthesis is rescued by resistance exercise and protein ingestion following short-term energy deficit. Am. J. Physiol. Endocrinol. Metab. 2014, 306, E989–E997. [Google Scholar] [CrossRef] [PubMed]
- Carbone, J.W.; McClung, J.P.; Pasiakos, S.M. Recent Advances in the Characterization of Skeletal Muscle and Whole-Body Protein Responses to Dietary Protein and Exercise during Negative Energy Balance. Adv. Nutr. 2019, 10, 70–79. [Google Scholar] [CrossRef] [PubMed]
- Pasiakos, S.M.; Cao, J.J.; Margolis, L.M.; Sauter, E.R.; Whigham, L.D.; McClung, J.P.; Rood, J.C.; Carbone, J.W.; Combs, G.F., Jr.; Young, A.J. Effects of high-protein diets on fat-free mass and muscle protein synthesis following weight loss: A randomized controlled trial. FASEB J. 2013, 27, 3837–3847. [Google Scholar] [CrossRef] [Green Version]
- Stokes, T.; Hector, A.J.; Morton, R.W.; McGlory, C.; Phillips, S.M. Recent Perspectives Regarding the Role of Dietary Protein for the Promotion of Muscle Hypertrophy with Resistance Exercise Training. Nutrients 2018, 10, 180. [Google Scholar] [CrossRef] [Green Version]
- Bhutani, S.; Klempel, M.C.; Kroeger, C.M.; Trepanowski, J.F.; Varady, K.A. Alternate day fasting and endurance exercise combine to reduce body weight and favorably alter plasma lipids in obese humans. Obesity 2013, 21, 1370–1379. [Google Scholar] [CrossRef]
- Oh, M.; Kim, S.; An, K.Y.; Min, J.; Yang, H.I.; Lee, J.; Lee, M.K.; Kim, D.I.; Lee, H.S.; Lee, J.W.; et al. Effects of alternate day calorie restriction and exercise on cardio-metabolic risk factors in overweight and obese adults: An exploratory randomized controlled study. BMC Public Health 2018, 18, 1124. [Google Scholar] [CrossRef]
- Cho, A.R.; Moon, J.Y.; Kim, S.; An, K.Y.; Oh, M.; Jeon, J.Y.; Jung, D.H.; Choi, M.H.; Lee, J.W. Effects of alternate day fasting and exercise on cholesterol metabolism in overweight or obese adults: A pilot randomized controlled trial. Metabolism 2019, 93, 52–60. [Google Scholar] [CrossRef]
- Tjonna, A.E.; Leinan, I.M.; Bartnes, A.T.; Jenssen, B.M.; Gibala, M.J.; Winett, R.A.; Wisloff, U. Low- and high-volume of intensive endurance training significantly improves maximal oxygen uptake after 10-weeks of training in healthy men. PLoS ONE 2013, 8, e65382. [Google Scholar] [CrossRef] [Green Version]
- Poon, E.T.; Siu, P.M.; Wongpipit, W.; Gibala, M.; Wong, S.H. Alternating high-intensity interval training and continuous training is efficacious in improving cardiometabolic health in obese middle-aged men. J. Exerc. Sci. Fit. 2022, 20, 40–47. [Google Scholar] [CrossRef] [PubMed]
- Poon, E.T.-C.; Little, J.P.; Sit, C.H.-P.; Wong, S.H.-S. The effect of low-volume high-intensity interval training on cardiometabolic health and psychological responses in overweight/obese middle-aged men. J. Sports Sci. 2020, 38, 1997–2004. [Google Scholar] [CrossRef] [PubMed]
- Batacan, R.B., Jr.; Duncan, M.J.; Dalbo, V.J.; Tucker, P.S.; Fenning, A.S. Effects of high-intensity interval training on cardiometabolic health: A systematic review and meta-analysis of intervention studies. Br. J. Sports Med. 2017, 51, 494–503. [Google Scholar] [CrossRef] [PubMed]
- Gist, N.H.; Fedewa, M.V.; Dishman, R.K.; Cureton, K.J. Sprint interval training effects on aerobic capacity: A systematic review and meta-analysis. Sports Med. 2014, 44, 269–279. [Google Scholar] [CrossRef]
- Kodama, S.; Saito, K.; Tanaka, S.; Maki, M.; Yachi, Y.; Asumi, M.; Sugawara, A.; Totsuka, K.; Shimano, H.; Ohashi, Y.; et al. Cardiorespiratory fitness as a quantitative predictor of all-cause mortality and cardiovascular events in healthy men and women: A meta-analysis. JAMA 2009, 301, 2024–2035. [Google Scholar] [CrossRef] [Green Version]
- Ortega, R.M.; Perez-Rodrigo, C.; Lopez-Sobaler, A.M. Dietary assessment methods: Dietary records. Nutr. Hosp. 2015, 31 (Suppl. 3), 38–45. [Google Scholar] [CrossRef]


| SIT | IF | IF/SIT | |
|---|---|---|---|
| n | 11 | 12 | 11 |
| Age | 32 ± 8.3 | 37 ± 5.9 | 39 ± 6.8 |
| Sex(M/F) | 1/10 | 2/10 | 3/8 |
| Height (cm) | 168 ± 9.3 | 164 ± 5.5 | 167 ± 8.1 |
| Weight (kg) | 90 ± 20 | 82 ± 12 | 96 ± 8.1 |
| BMI (kg/m2) | 32 ± 4.4 | 30 ± 3.9 * | 34 ± 2.1 * |
| Hip Measurement (cm) | 114 ± 10.5 | 112 ± 7.7 | 118 ± 7.8 |
| Waist Measurement (cm) | 101 ± 13 | 98 ± 13 | 105 ± 5.3 |
| Visceral Fat Mass (g) | 653 ± 256 | 616 ± 221 | 681 ± 135 |
| Fat Mass (kg) | 34 ± 8.3 | 31 ± 7.9 | 36 ± 9.7 |
| Lean Mass (kg) | 53 ± 14 | 47 ± 6.2 | 56 ± 9.7 |
| Ethnic Origin: | |||
| Aboriginal and Torres Strait Islander | 0 | 0 | 1 |
| Asian | 1 | 2 | 0 |
| European | 10 | 10 | 10 |
| VO2peak (mL·kg−1·min−1) | 27.8 ± 4.4 | 26.4 ± 5.4 | 28.7 ± 9.6 |
| VO2peak (L/min) | 2.61 ± 0.92 | 2.02 ± 0.54 | 2.74 ± 0.95 |
| SIT | IF | IF/SIT | ||||
|---|---|---|---|---|---|---|
| Week | Week 0 | Week 16 | Week 0 | Week 16 | Week 0 | Week 16 |
| n = 11 | n = 9 | n = 12 | n = 8 | n = 11 | n = 11 | |
| Waist circumference (cm) | 100 ± 13 | 99 ± 13 | 97 ± 13 | 94 ± 10 | 105 ± 8 | 96 ± 12 |
| Waist to Hip ratio | 0.88 ± 0.07 | 0.87 ± 0.08 | 0.87 ± 0.08 | 0.86 ± 0.07 | 0.89 ± 0.07 | 0.84 ± 0.08 |
| SIT | IF | IF/SIT | ||||
|---|---|---|---|---|---|---|
| Week | Week 0 | Week 16 | Week 0 | Week 16 | Week 0 | Week 16 |
| n = 11 | n = 9 | n = 12 | n = 8 | n = 11 | n = 11 | |
| PBP Systolic (mmHg) | 130 ± 13 | 127 ± 13 | 122 ± 9 | 123 ± 8 | 130 ± 12 | 134 ± 12 |
| PBP Diastolic (mmHg) | 80 ± 8 | 77 ± 10 | 76 ± 7 | 77 ± 7 | 77 ± 7 | 80 ± 6 |
| CBP Systolic (mmHg) | 115 ± 11 | 116 ± 15 | 110 ± 7 | 111 ± 7 | 116 ± 11 | 120 ± 11 |
| CBP Diastolic (mmHg) | 81 ± 8 | 78 ± 11 | 77 ± 7 | 77 ± 7 | 78 ± 7 | 81 ± 6 |
| Pulse wave velocity (m/s) | 6.1 ± 1.0 | 6.3 ± 1.4 | 5.8 ± 0.9 | 5.7 ± 0.8 | 6.6 ± 0.7 | 6.6 ± 0.9 |
| SIT | IF | IF/SIT | ||||
|---|---|---|---|---|---|---|
| Week | Week 0 | Week 16 | Week 0 | Week 16 | Week 0 | Week 16 |
| n = 11 | n = 9 | n = 12 | n = 8 | n = 11 | n = 11 | |
| Fasting Glucose (mmol/L) | 4.9 ± 0.6 | 4.8 ± 0.7 | 5.0 ± 0.6 | 5.0 ± 0.6 | 4.9 ± 0.4 | 4.8 ± 0.3 |
| HbA1c (mmol/mol) | 32 ± 3.4 | 32 ± 4.1 | 33 ± 3.5 | 33 ± 4.2 | 31 ± 3.3 | 32 ± 2.7 |
| Glucose Tolerance (AUC) | 777 ± 194 | 793 ± 158 | 840 ± 223 | 769 ± 192 | 817 ± 169 | 714 ± 133 |
| HOMA-IR | 1.6 ± 0.8 | 1.8 ± 1.0 | 1.5 ± 0.5 | 1.4 ± 0.5 | 1.7 ± 0.7 | 1.5 ± 0.6 |
| Total Cholesterol (mmol/L) | 4.5 ± 1 | 4.4 ± 0.9 | 4.7 ± 1.7 | 4.6 ± 1.9 | 4.7 ± 1.0 | 4.4 ± 1.0 |
| Triglycerides (mmol/L) | 1.0 ± 0.5 | 1.1 ± 0.6 | 1.2 ± 0.6 | 1.1 ± 0.6 | 1.0 ± 0.5 | 0.9 ± 0.3 |
| LDL Cholesterol (mmol/L) | 2.5 ± 0.7 | 2.4 ± 0.7 | 2.8 ± 1.0 | 2.7 ± 1.3 | 2.9 ± 0.9 | 2.8 ± 0.9 |
| HDL Cholesterol (mmol/L) | 1.4 ± 0.3 | 1.5 ± 0.4 | 1.7 ± 0.5 | 1.7 ± 0.4 | 1.3 ± 0.3 | 1.3 ± 0.3 |
| SIT | IF | IF/SIT | |||||||
|---|---|---|---|---|---|---|---|---|---|
| Week | 0 | 8 | 16 | 0 | 8 | 16 | 0 | 8 | 16 |
| n = 7 | n = 7 | n = 7 | n = 6 | n = 6 | n = 6 | n = 7 | n = 7 | n = 7 | |
| CHO (g·kg·bw per day) | 2.14 ± 0.7 | 1.83 ± 0.8 | 1.76 ± 0.8 | 2.20 ± 0.9 | 2.27 ± 0.4 | 1.63 ± 1.0 | 2.22 ± 1.2 | 1.79 ± 0.60 | 1.79 ± 0.41 |
| Fat (g·kg·bw per day) | 0.63 ± 0.2 | 0.73 ± 0.4 | 0.61 ± 0.2 | 0.73 ± 0.3 | 0.73 ± 0.2 | 0.68 ± 0.2 | 0.88 ± 0.6 | 0.68 ± 0.28 | 0.61 ± 0.19 |
| Protein (g·kg·bw per day) | 0.83 ± 0.2 | 0.81 ± 0.3 | 0.97 ± 0.3 | 0.81 ± 0.4 | 1.86 ± 0.7 | 0.97 ± 0.5 | 0.89 ± 0.7 | 0.79 ± 0.59 | 0.80 ± 0.64 |
| Avg. DCI (kcal) | 1710 ± 305 | 1688 ± 652 | 1862 ± 902 | 1594 ± 322 | 1574 ± 479 | 1450 ± 267 | 2181 ± 1057 | 1698 ± 400 | 1687 ± 479 |
| DCI (% of predicted RDI) | 91 ± 22 | 83 ± 49 | 83 ± 10 | 88 ± 19 | 86 ± 23 | 81 ± 10 | 104 ± 61 | 83 ± 19 | 69 ± 36 |
| Avg. Fasting CI (kcal) | n/a | n/a | n/a | 463 ± 103 | 541 ± 84 | 495 ± 91 | 543 ± 180 | 604 ± 171 | 521 ± 174 |
| CIF (% of predicted RDI) | n/a | n/a | n/a | 25 ± 3.1 | 29.7 ± 2.8 | 28 ± 4.5 | 24.7 ± 6.6 | 29.5 ± 8.2 | 24.8 ± 7.1 |
| SIT | IF | IF/SIT | |||||||
|---|---|---|---|---|---|---|---|---|---|
| Week | 0 | 8 | 16 | 0 | 8 | 16 | 0 | 8 | 16 |
| n = 11 | n = 9 | n = 8 | n = 8 | n = 8 | n = 8 | n = 9 | n = 9 | n = 9 | |
| Total physical activity (MET-min/week) | 1722 ± 1046 | 2780 ± 2539 | 2136 ± 1616 | 4611 ± 5410 | 2388 ± 2224 | 1980 ± 1621 | 3964 ± 4459 | 3933 ± 2924 | 4552 ± 5503 |
| Intensity (walking/moderate/ vigorous) % | 36/41/23 | 49/48/3 | 53/47/0 | 45/43/12 | 50/41/9 | 53/47/0 | 25/39/36 | 27/55/18 | 19/40/41 |
Publisher’s Note: MDPI stays neutral with regard to jurisdictional claims in published maps and institutional affiliations. |
© 2022 by the authors. Licensee MDPI, Basel, Switzerland. This article is an open access article distributed under the terms and conditions of the Creative Commons Attribution (CC BY) license (https://creativecommons.org/licenses/by/4.0/).
Share and Cite
Cooke, M.B.; Deasy, W.; Ritenis, E.J.; Wilson, R.A.; Stathis, C.G. Effects of Intermittent Energy Restriction Alone and in Combination with Sprint Interval Training on Body Composition and Cardiometabolic Biomarkers in Individuals with Overweight and Obesity. Int. J. Environ. Res. Public Health 2022, 19, 7969. https://doi.org/10.3390/ijerph19137969
Cooke MB, Deasy W, Ritenis EJ, Wilson RA, Stathis CG. Effects of Intermittent Energy Restriction Alone and in Combination with Sprint Interval Training on Body Composition and Cardiometabolic Biomarkers in Individuals with Overweight and Obesity. International Journal of Environmental Research and Public Health. 2022; 19(13):7969. https://doi.org/10.3390/ijerph19137969
Chicago/Turabian StyleCooke, Matthew B., William Deasy, Elya J. Ritenis, Robin A. Wilson, and Christos G. Stathis. 2022. "Effects of Intermittent Energy Restriction Alone and in Combination with Sprint Interval Training on Body Composition and Cardiometabolic Biomarkers in Individuals with Overweight and Obesity" International Journal of Environmental Research and Public Health 19, no. 13: 7969. https://doi.org/10.3390/ijerph19137969
APA StyleCooke, M. B., Deasy, W., Ritenis, E. J., Wilson, R. A., & Stathis, C. G. (2022). Effects of Intermittent Energy Restriction Alone and in Combination with Sprint Interval Training on Body Composition and Cardiometabolic Biomarkers in Individuals with Overweight and Obesity. International Journal of Environmental Research and Public Health, 19(13), 7969. https://doi.org/10.3390/ijerph19137969