
Commonalities in Metabolic Reprogramming between Tobacco Use and Oral Cancer

 ,
, 

Abstract
:1. Introduction
2. Materials and Methods
2.1. Literature Review
Searches and Study Selection
2.2. Preparation of NIST Reference Urine from Smokers and Non-Smokers for UHPLC-HR-MS Metabolomics
2.3. Preparation of Malignant and Non-Malignant Oral Tissue from a Tissue Microarray (TMA) for UHPLC-HR-MS Metabolomics
2.4. Preparation of CAL-27 Cells Treated with Vehicle or the Tobacco Carcinogen 4-(Methylnitrosamino)-1-(3-pyridyl)-1-butanone (NNK) for UHPLC-HR-MS Metabolomics
2.5. Metabolomics Analysis via Ultra High-Pressure Liquid Chromatography Combined with High Resolution Mass Spectrometry (UHPLC-HR-MS)
2.6. Metabolite Identification/Annotation
2.7. Multivariate, Univariate, and Pathway Analysis of Metabolomics Data
3. Results
3.1. Literature Review
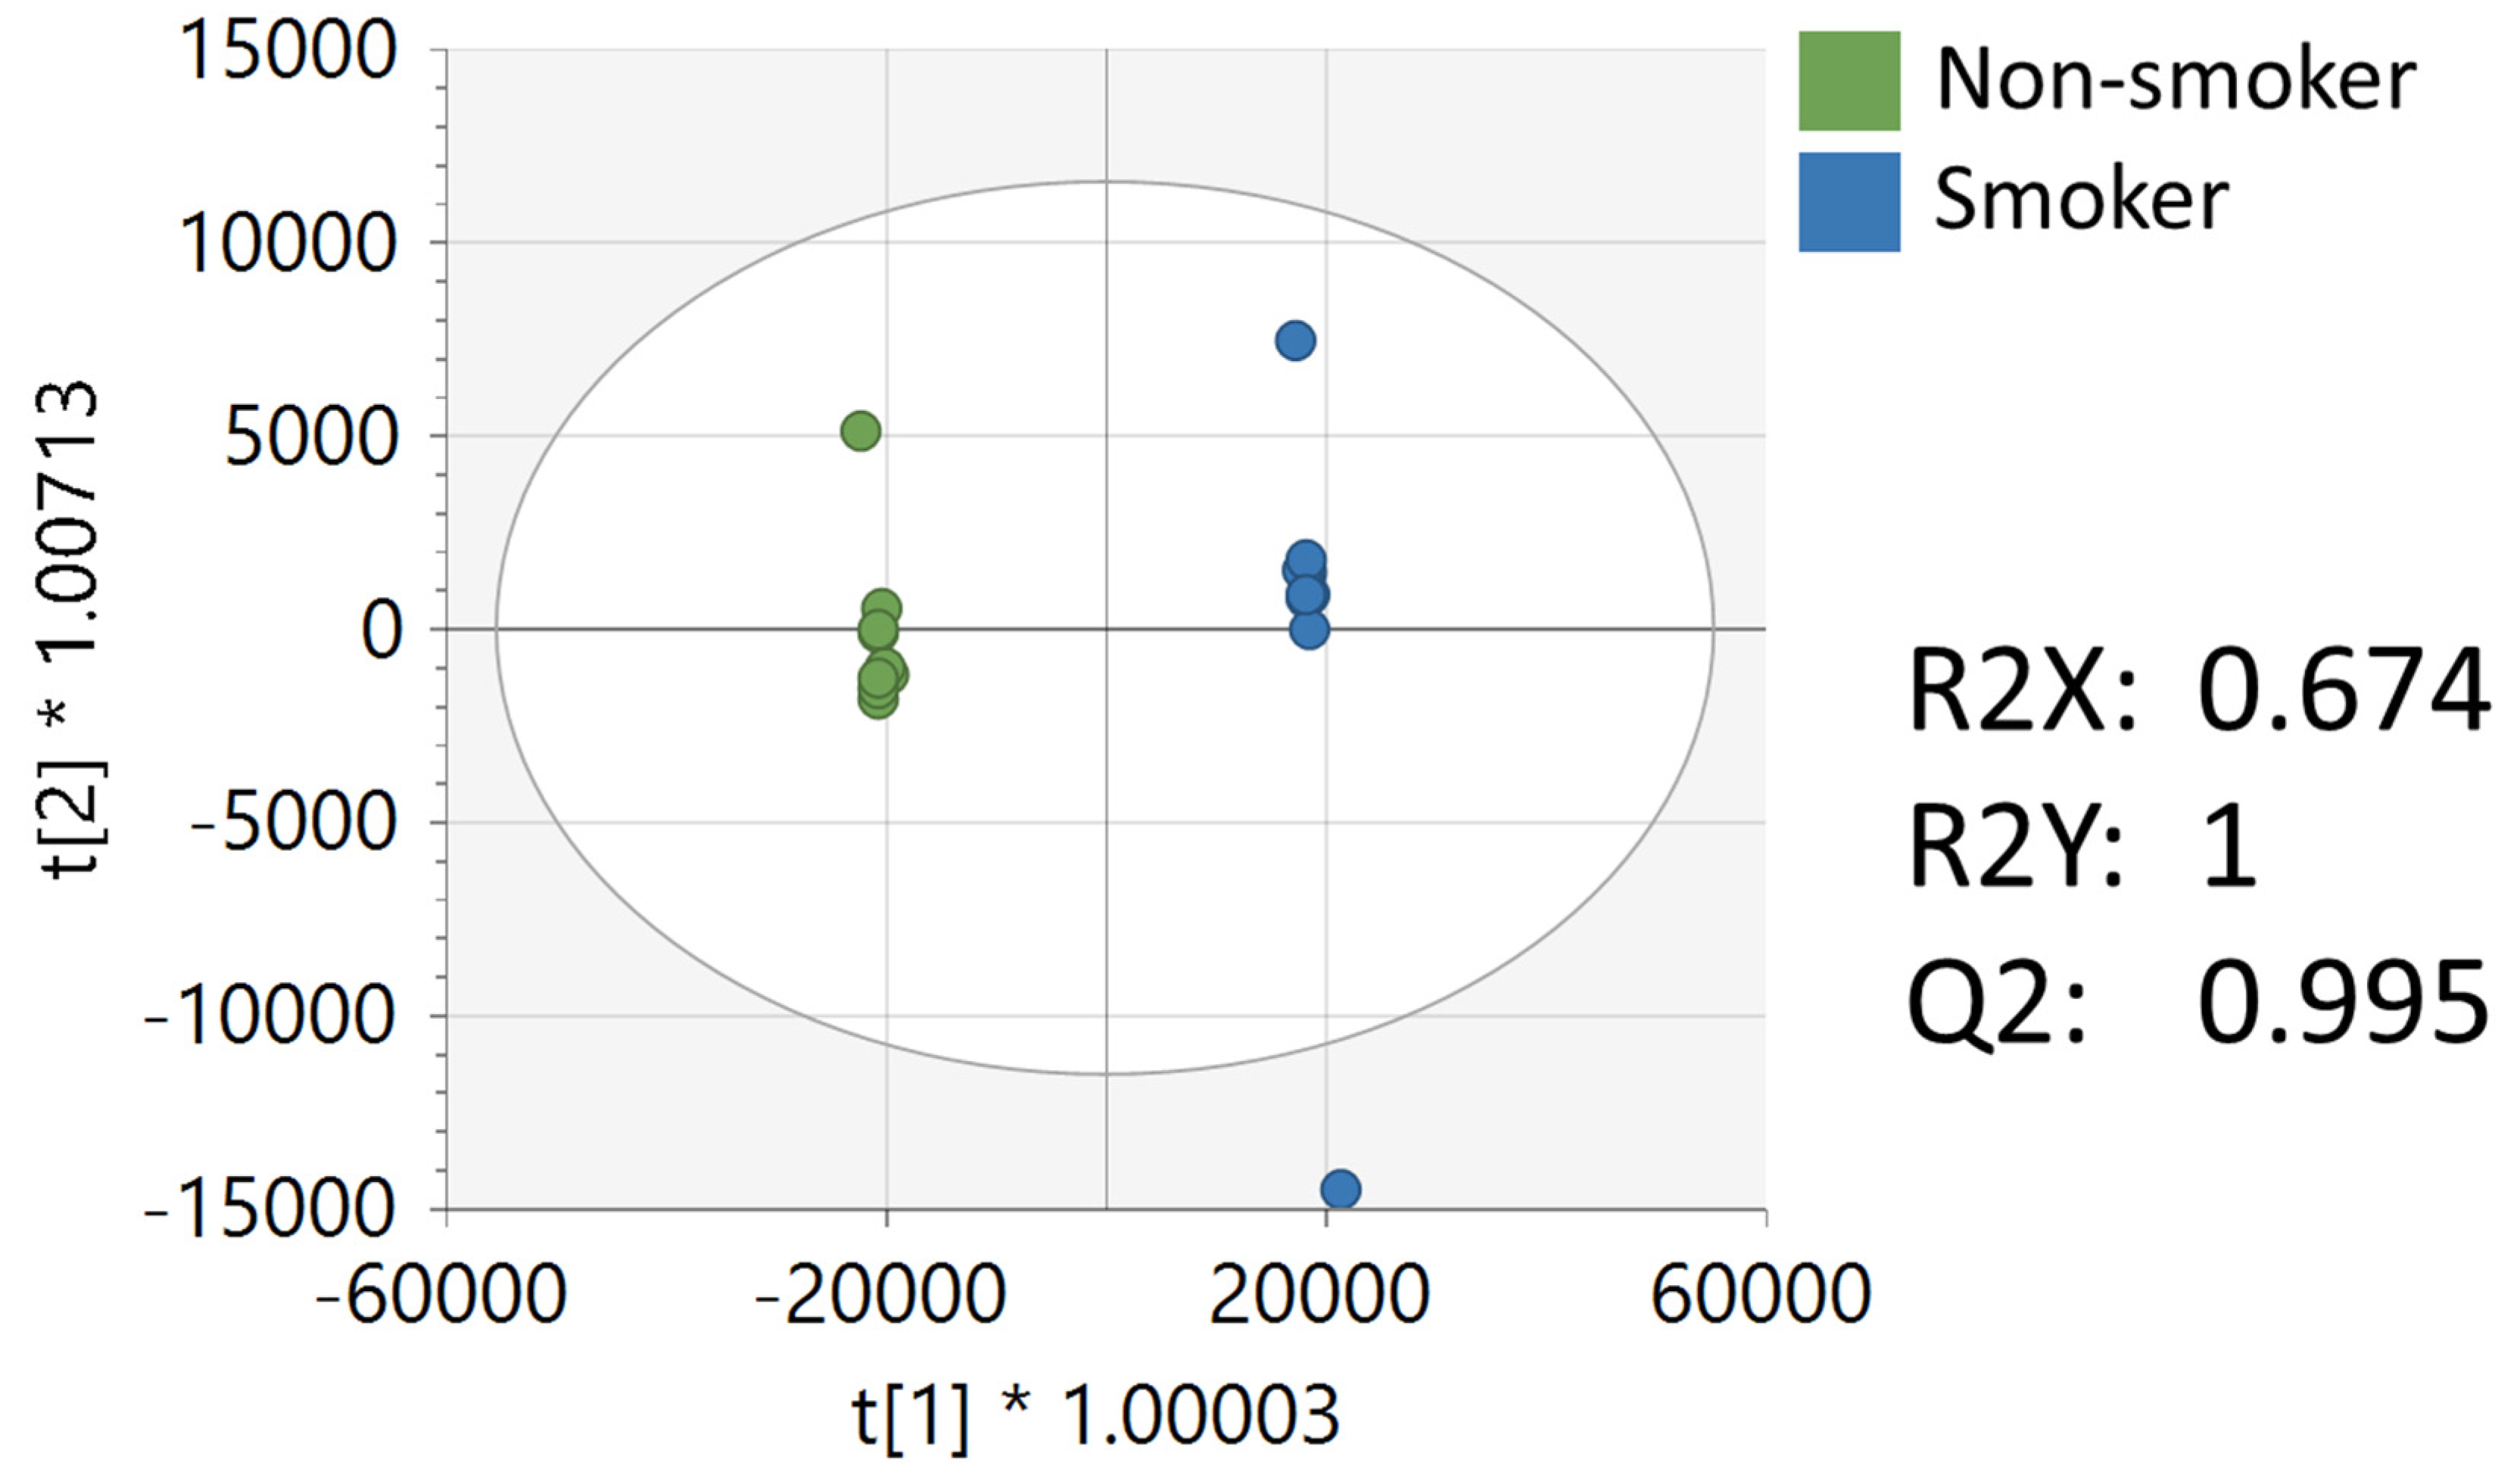
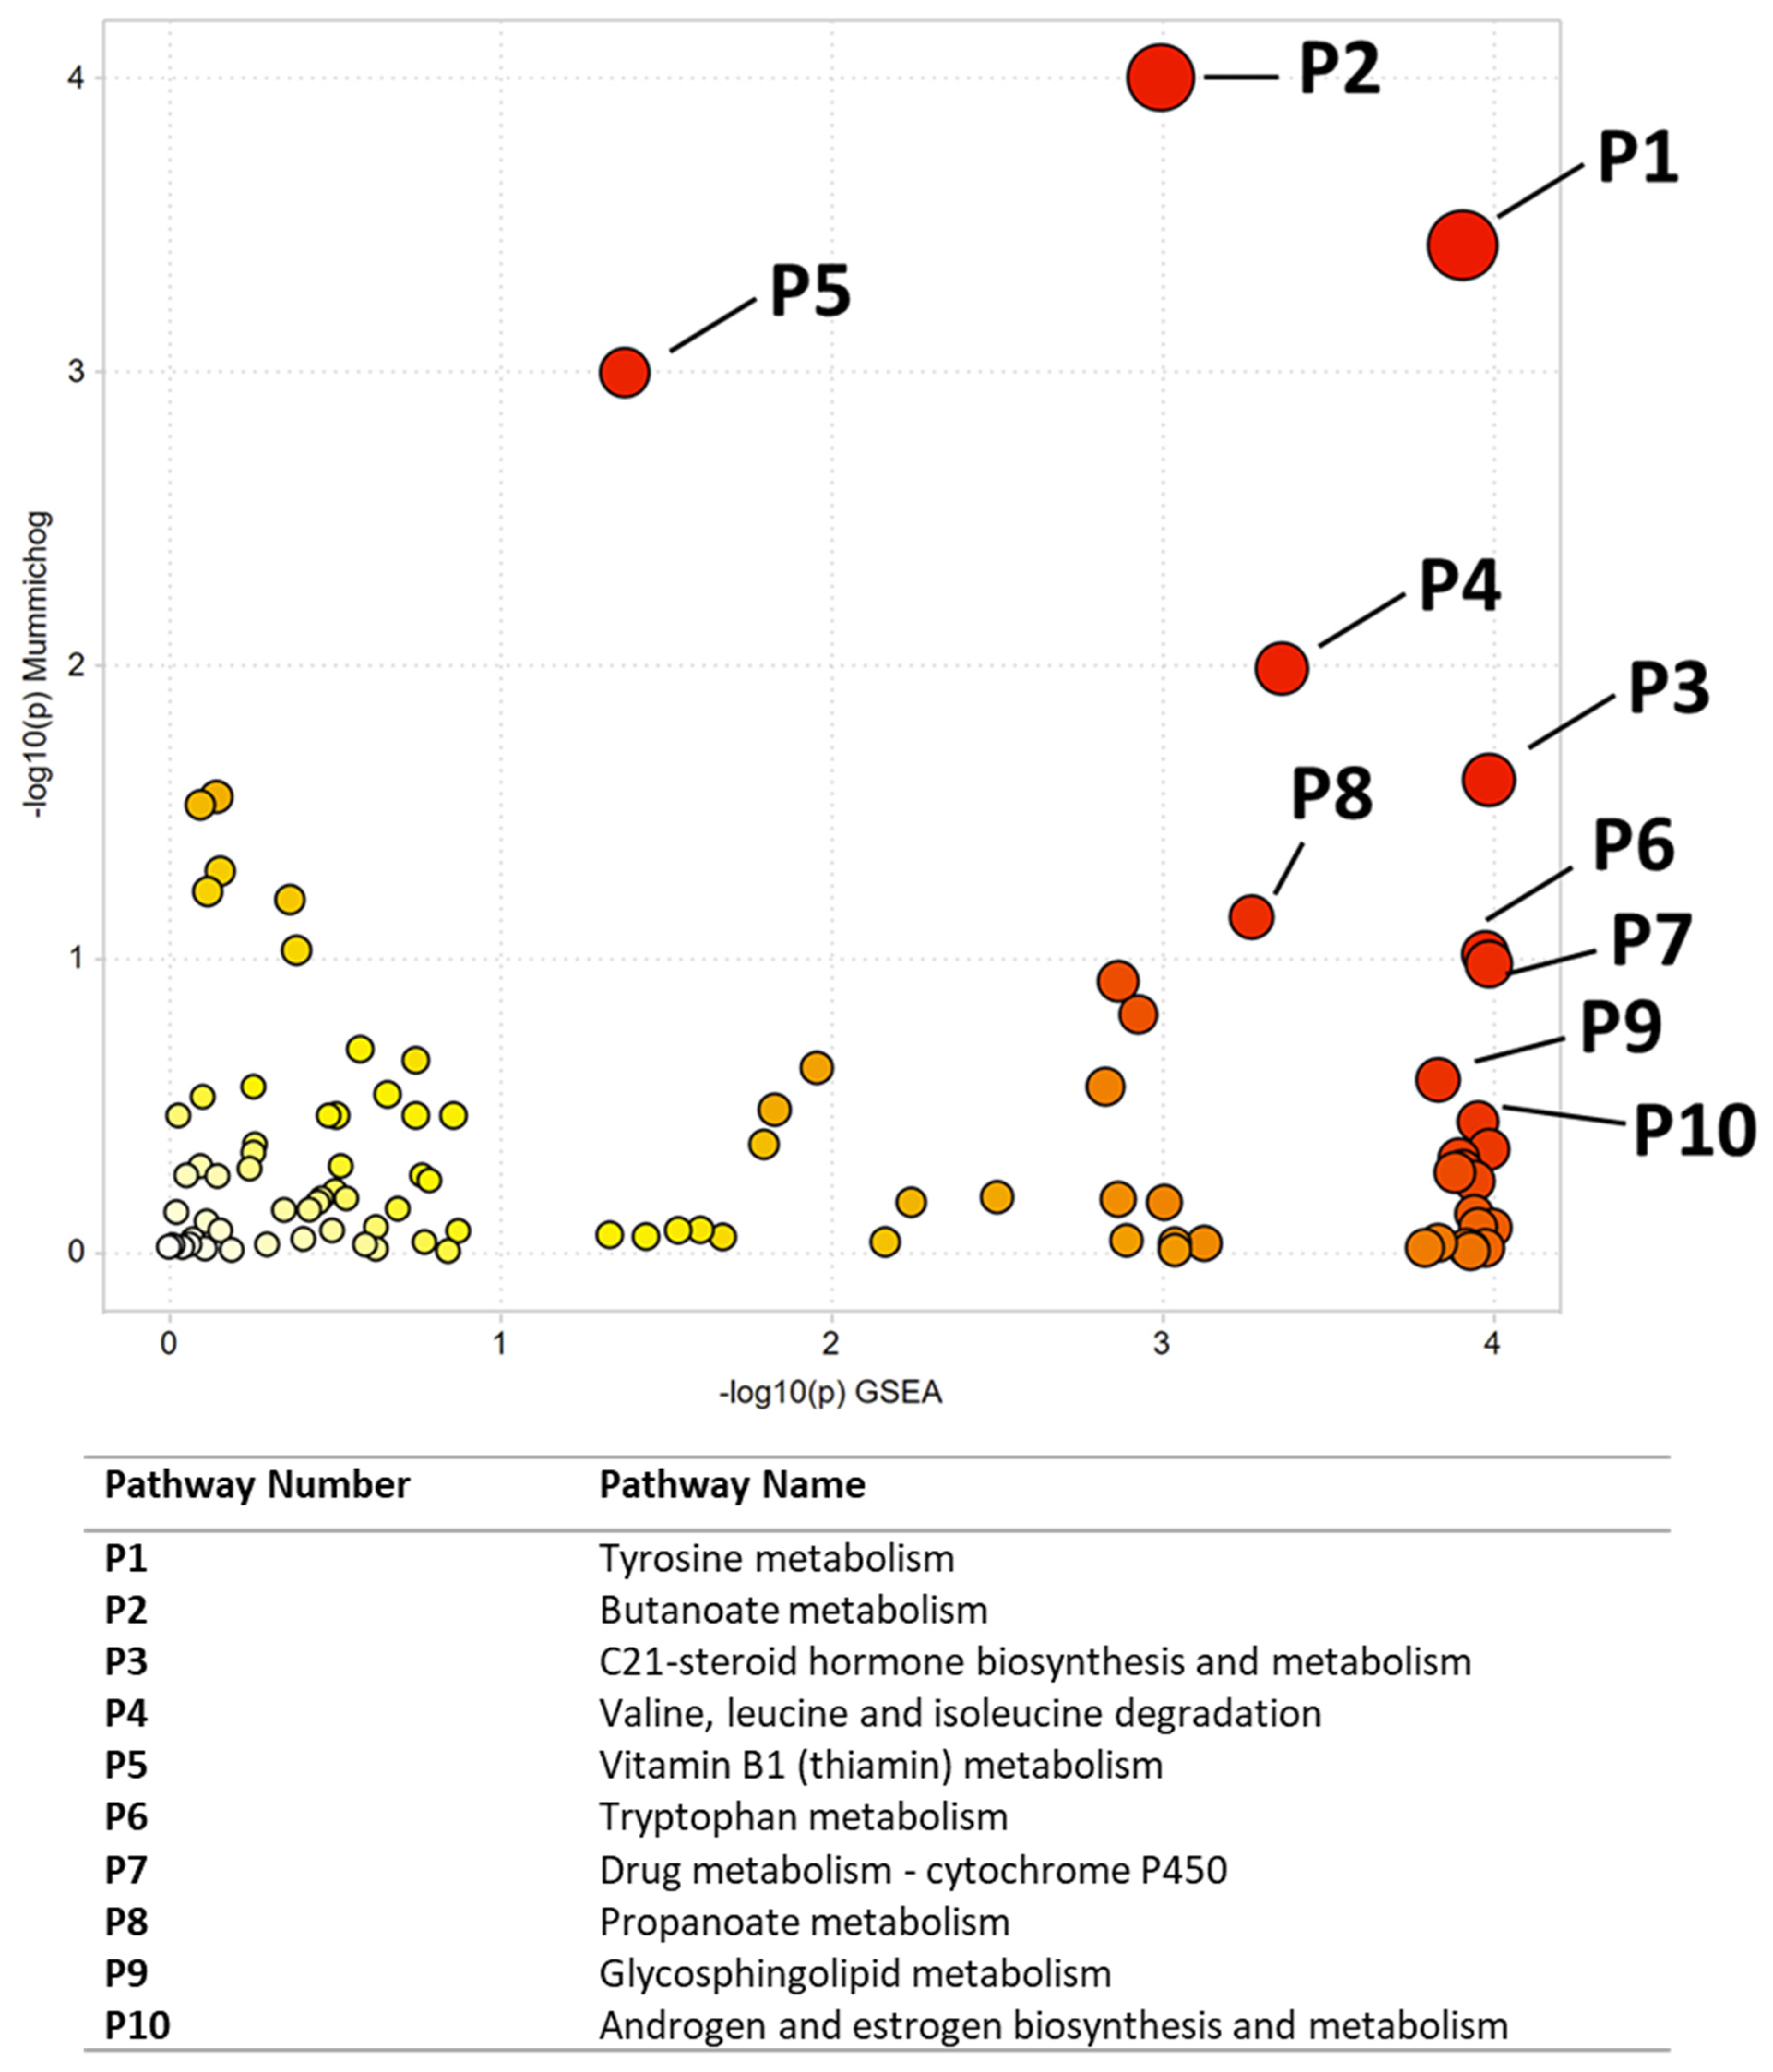
3.2. Metabolomics Analysis of NIST Reference Material from Smokers and Non-Smokers
3.3. Metabolomics Analysis of Cancerous and Non-Cancerous Oral Tissue from a Tissue Microarray
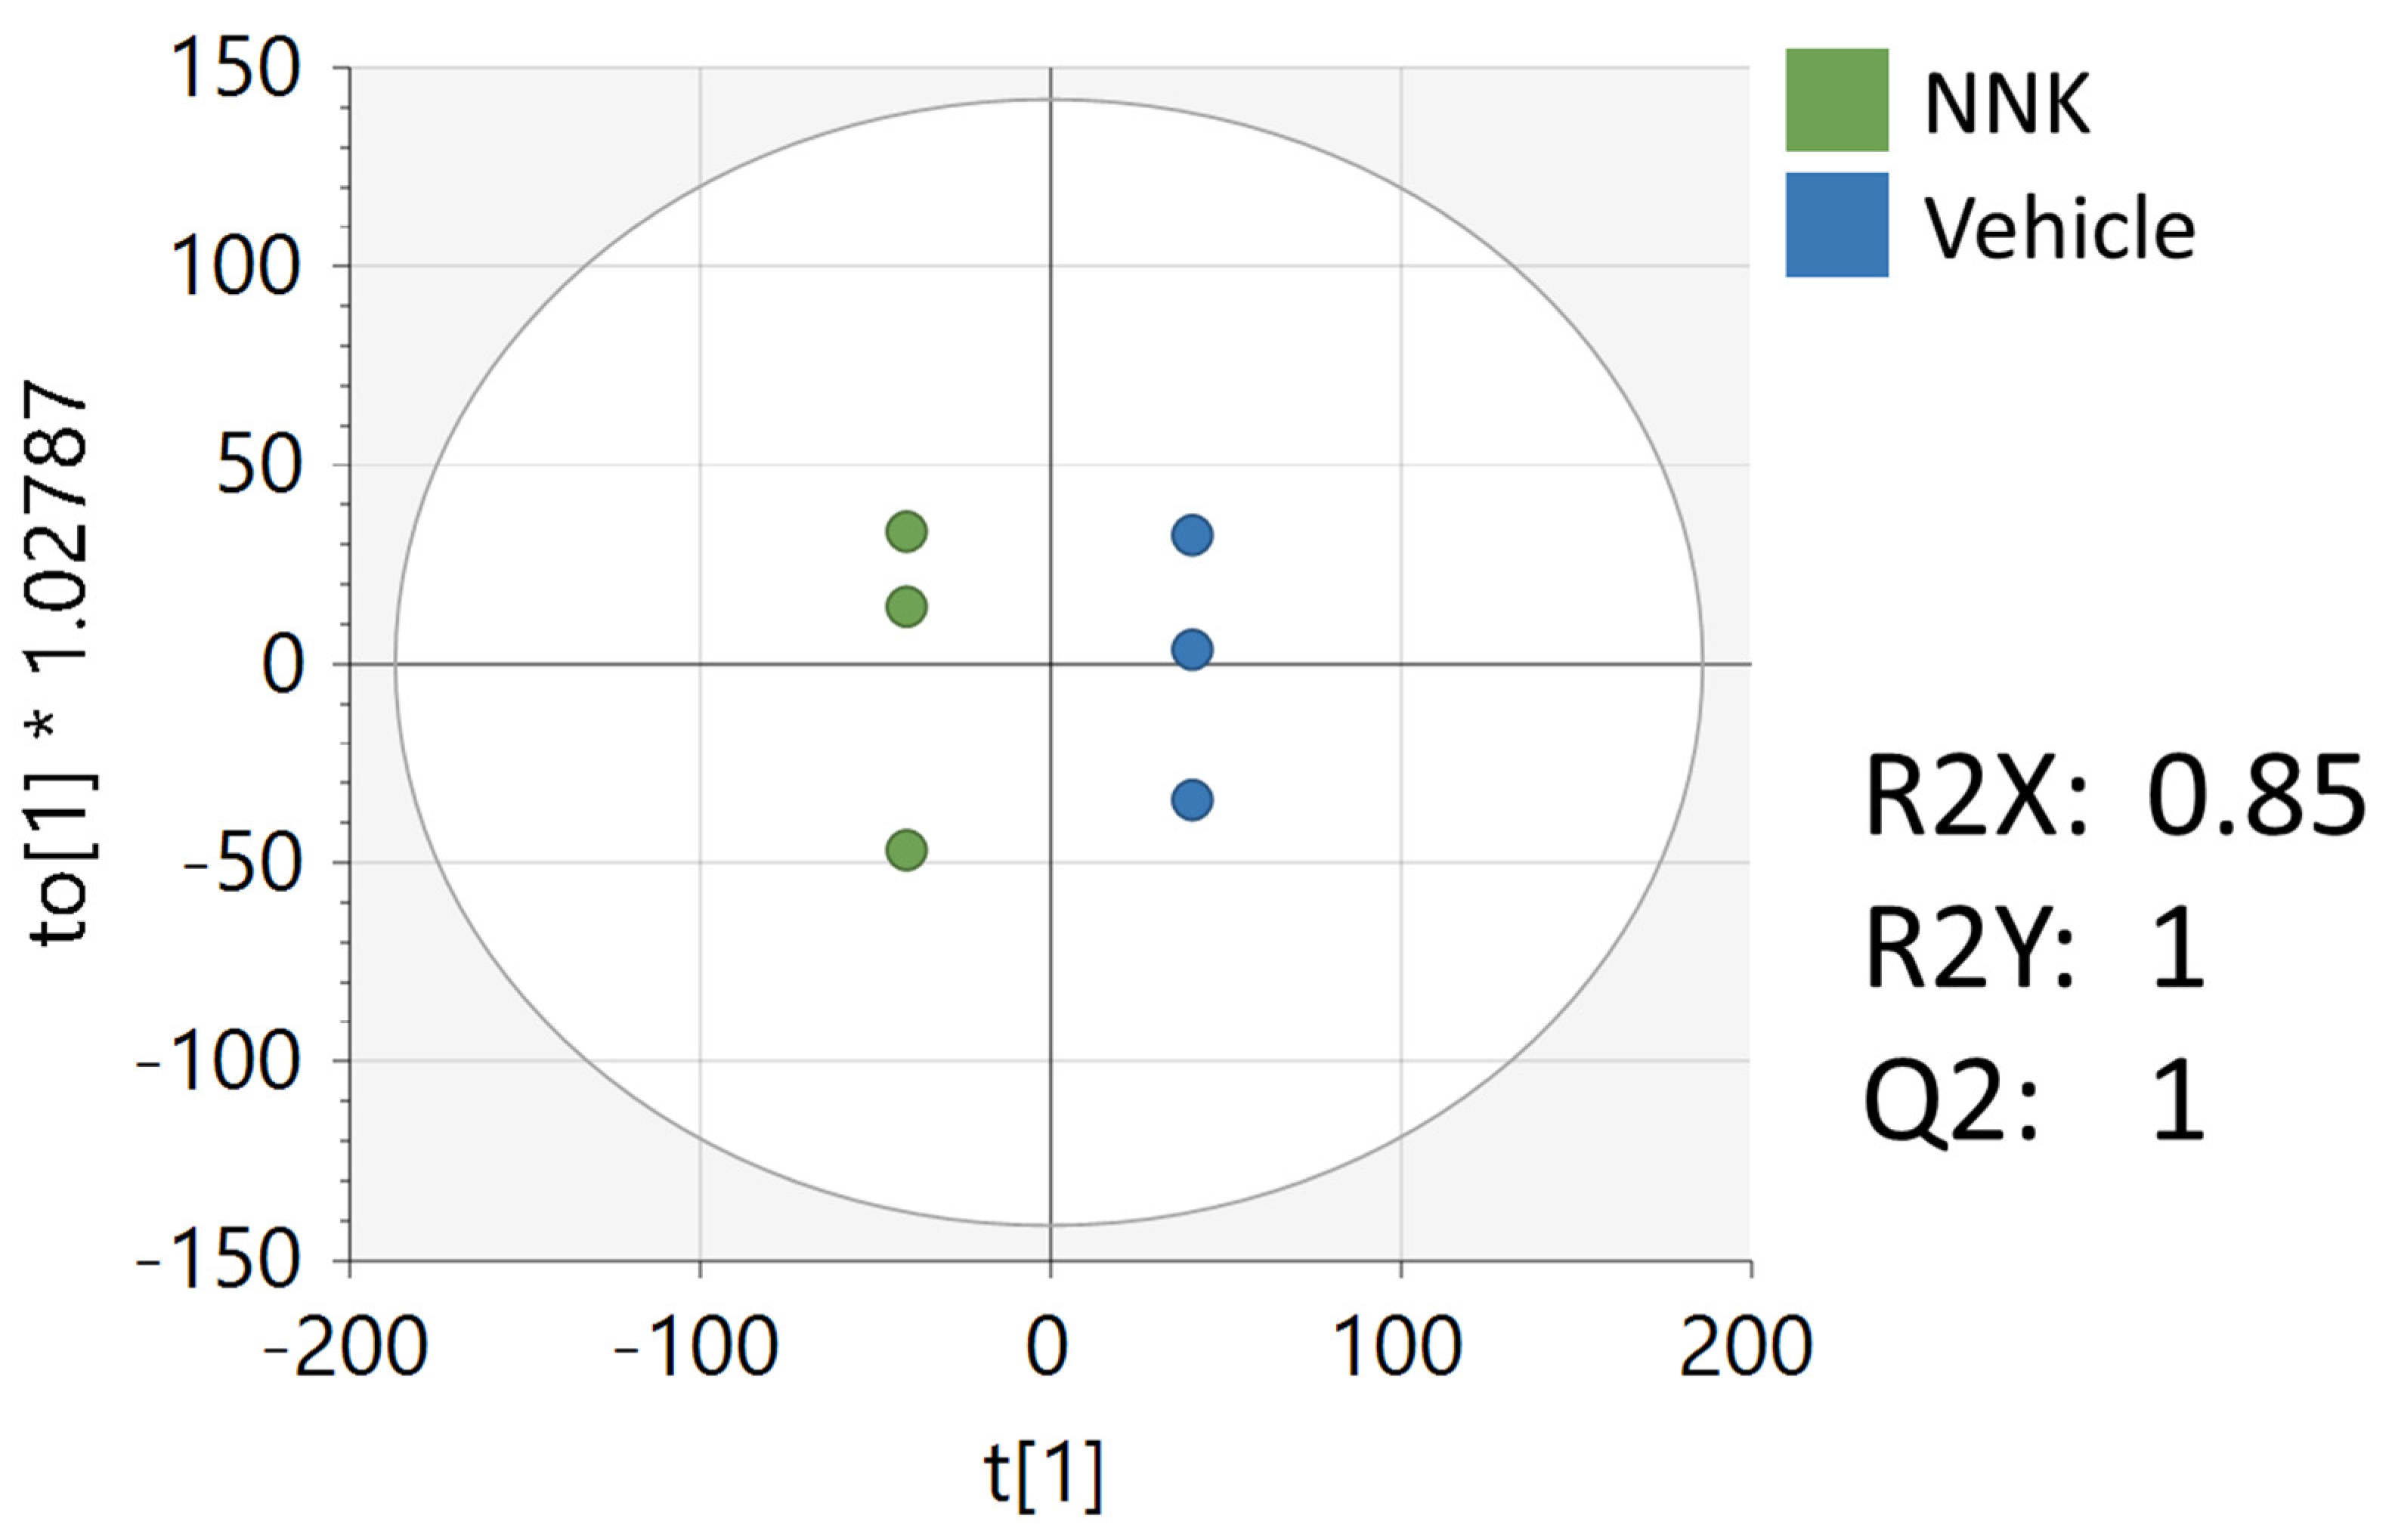
3.4. Metabolomics Analysis of CAL-27 Cells Treated with NNK
4. Discussion
Commonalities between Altered Pathways between Studies
5. Conclusions
Supplementary Materials
Author Contributions
Funding
Data Availability Statement
Acknowledgments
Conflicts of Interest
References
- Perez-Warnisher, M.T.; De Miguel, M.P.C.; Seijo, L.M. Tobacco use worldwide: Legislative efforts to curb consumption. Ann. Glob. Health 2018, 84, 571–579. [Google Scholar] [CrossRef] [PubMed]
- World Health Organization. WHO Report on the Global Tobacco Epidemic, 2017: Monitoring Tobacco Use and Prevention Policies; WHO: Geneva, Switzerland, 2017; ISBN 9241512822. [Google Scholar]
- Zheng, T.; Boyle, P.; Zhang, B.; Zhang, Y.; Owens, P.H.; Lan, Q.; Wise, J. Tobacco use and risk of oral cancer. In Tobacco and Public Health: Science and Policy; Oxford University Press: Oxford, UK, 2004; pp. 399–432. [Google Scholar]
- DeBerardinis, R.J.; Chandel, N.S. Fundamentals of cancer metabolism. Sci. Adv. 2016, 2, e1600200. [Google Scholar] [CrossRef] [PubMed]
- Rahman, M.; Hasan, M.R. Cancer metabolism and drug resistance. Metabolites 2015, 5, 571–600. [Google Scholar] [CrossRef] [PubMed]
- Boroughs, L.K.; DeBerardinis, R.J. Metabolic pathways promoting cancer cell survival and growth. Nat. Cell Biol. 2015, 17, 351–359. [Google Scholar] [CrossRef] [PubMed]
- Faubert, B.; Solmonson, A.; DeBerardinis, R.J. Metabolic reprogramming and cancer progression. Science 2020, 368, eaaw5473. [Google Scholar] [CrossRef] [PubMed]
- Vander Heiden, M.G. Targeting cancer metabolism: A therapeutic window opens. Nat. Rev. Drug Discov. 2011, 10, 671–684. [Google Scholar] [CrossRef]
- Rivera, C. Essentials of oral cancer. Int. J. Clin. Exp. Pathol. 2015, 8, 11884–11894. [Google Scholar]
- Moretton, A.; Loizou, J.I. Interplay between cellular metabolism and the dna damage response in cancer. Cancers 2020, 12, 2051. [Google Scholar] [CrossRef]
- Rushing, B.R.; Schroder, M.; Sumner, S.C.J. Comparison of Lysis and Detachment Sample Preparation Methods for Cultured Triple-Negative Breast Cancer Cells Using UHPLC–HRMS-Based Metabolomics. Metabolites 2022, 12, 168. [Google Scholar] [CrossRef]
- Li, S.; Li, Y.; Rushing, B.R.; Harris, S.E.; McRitchie, S.L.; Jones, J.C.; Dominguez, D.; Sumner, S.J.; Dohlman, H.G. Multi-omics analysis of glucose-mediated signaling by a moonlighting Gβ protein Asc1/RACK1. PLoS Genet. 2021, 17, e1009640. [Google Scholar] [CrossRef]
- Li, S.; Li, Y.; Rushing, B.R.; Harris, S.E.; McRitchie, S.L.; Sumner, S.J.; Dohlman, H.G. Multi-omics analysis of multiple glucose-sensing receptor systems in yeast. Biomolecules 2022, 12, 175. [Google Scholar] [CrossRef] [PubMed]
- Li, Y.Y.; Rushing, B.; Schroder, M.; Sumner, S.; Kay, C.D. Exploring the Contribution of (Poly)phenols to the Dietary Exposome Using High Resolution Mass Spectrometry Untargeted Metabolomics. Mol. Nutr. Food Res. 2022, 2100922, 1–9. [Google Scholar] [CrossRef] [PubMed]
- Sharma, J.; Rushing, B.R.; Hall, M.S.; Helke, K.L.; McRitchie, S.L.; Krupenko, N.I.; Sumner, S.J.; Krupenko, S.A. Sex-Specific Metabolic Effects of Dietary Folate Withdrawal in Wild-Type and Aldh1l1 Knockout Mice. Metabolites 2022, 12, 454. [Google Scholar] [CrossRef] [PubMed]
- Rushing, B.; McRitchie, S.; Arbeeva, L.; Nelson, A.; Azcarate-Peril, M.; Li, Y.; Qian, Y.; Pathmasiri, W.; Sumner, S.; Loeser, R. Fecal metabolomics reveals products of dysregulated proteloysis and altered microbial metabolism in obesity-related osteoarthritis. Osteoarthr. Cartil. 2022, 30, 81–91. [Google Scholar] [CrossRef]
- Broadhurst, D.; Goodacre, R.; Reinke, S.N.; Kuligowski, J.; Wilson, I.D.; Lewis, M.R.; Dunn, W.B. Guidelines and considerations for the use of system suitability and quality control samples in mass spectrometry assays applied in untargeted clinical metabolomic studies. Metabolomics 2018, 14, 72. [Google Scholar] [CrossRef]
- Pang, Z.; Chong, J.; Zhou, G.; De Lima Morais, D.A.; Chang, L.; Barrette, M.; Gauthier, C.; Jacques, P.É.; Li, S.; Xia, J. MetaboAnalyst 5.0: Narrowing the gap between raw spectra and functional insights. Nucleic Acids Res. 2021, 49, 388–396. [Google Scholar] [CrossRef] [PubMed]
- Gu, F.; Caporaso, N.E.; Schairer, C.; Fortner, R.T.; Xu, X.; Hankinson, S.E.; Eliassen, A.H.; Ziegler, R.G. Urinary concentrations of estrogens and estrogen metabolites and smoking in caucasian women. Cancer Epidemiol. Biomark. Prev. 2013, 22, 58–68. [Google Scholar] [CrossRef] [PubMed]
- Aug, A.; Altraja, S.; Kilk, K.; Porosk, R.; Soomets, U.; Altraja, A. E-cigarette affects the metabolome of primary normal human bronchial epithelial cells. PLoS ONE 2015, 10, e0142053. [Google Scholar] [CrossRef]
- Ghasemi, A.; Syedmoradi, L.; Momenan, A.A.; Zahediasl, S.; Azizi, F. The influence of cigarette and qalyan (hookah) smoking on serum nitric oxide metabolite concentration. Scand. J. Clin. Lab. Investig. 2010, 70, 116–121. [Google Scholar] [CrossRef]
- Hsu, P.C.; Lan, R.S.; Brasky, T.M.; Marian, C.; Cheema, A.K.; Ressom, H.W.; Loffredo, C.A.; Pickworth, W.B.; Shields, P.G. Metabolomic profiles of current cigarette smokers. Mol. Carcinog. 2017, 56, 594–606. [Google Scholar] [CrossRef]
- Nelson, T.M.; Borgogna, J.C.; Michalek, R.D.; Roberts, D.W.; Rath, J.M.; Glover, E.D.; Ravel, J.; Shardell, M.D.; Yeoman, C.J.; Brotman, R.M. Cigarette smoking is associated with an altered vaginal tract metabolomic profile. Sci. Rep. 2018, 8, 852. [Google Scholar] [CrossRef] [PubMed]
- Windham, G.C.; Mitchell, P.; Anderson, M.; Lasley, B.L. Cigarette smoking and effects on hormone function in premenopausal women. Environ. Health Perspect. 2005, 113, 1285–1290. [Google Scholar] [CrossRef]
- Lokki, A.I.; Heikkinen-Eloranta, J.; Öhman, H.; Heinonen, S.; Surcel, H.M.; Nielsen, H.S. Smoking during pregnancy reduces Vitamin D levels in a Finnish birth register cohort. Public Health Nutr. 2020, 23, 1273–1277. [Google Scholar] [CrossRef] [PubMed]
- Zhao, J.; Leung, J.Y.Y.; Lin, S.L.; Mary Schooling, C. Cigarette smoking and testosterone in men and women: A systematic review and meta-analysis of observational studies. Prev. Med. 2016, 85, 1–10. [Google Scholar] [CrossRef] [PubMed]
- He, Y.; Luo, Y.; Chen, H.; Chen, J.; Fu, Y.; Hou, H.; Hu, Q. Profiling of carboxyl-containing metabolites in smokers and non-smokers by stable isotope labeling combined with LC-MS/MS. Anal. Biochem. 2019, 569, 1–9. [Google Scholar] [CrossRef] [PubMed]
- Ulvik, A.; Ebbing, M.; Hustad, S.; Midttun, Ø.; Nygård, O.; Vollset, S.E.; Bønaa, K.H.; Nordrehaug, J.E.; Nilsen, D.W.; Schirmer, H.; et al. Long- and short-term effects of tobacco smoking on circulating concentrations of B vitamins. Clin. Chem. 2010, 56, 755–763. [Google Scholar] [CrossRef]
- Zappacpsta, B.; Persichilli, S.; De Sole, P.; Mordente, A.; Giardina, B. Effect of smoking one cigarette on antioxidant metabolites in the saliva of healthy smokers. Arch. Oral. Biol. 1999, 44, 485–488. [Google Scholar] [CrossRef]
- Van der Plas, A.; Pouly, S.; de La Bourdonnaye, G.; Ng, W.T.; Baker, G.; Ludicke, F. Influence of smoking and smoking cessation on levels of urinary 11-dehydro thromboxane B2. Toxicol. Rep. 2018, 5, 561–567. [Google Scholar] [CrossRef]
- Nadruz, W.; Gonçalves, A.; Claggett, B.; Querejeta Roca, G.; Shah, A.M.; Cheng, S.; Heiss, G.; Ballantyne, C.M.; Solomon, S.D. Influence of cigarette smoking on cardiac biomarkers: The Atherosclerosis Risk in Communities (ARIC) Study. Eur. J. Heart Fail. 2016, 18, 629–637. [Google Scholar] [CrossRef]
- Pfeiffer, C.M.; Sternberg, M.R.; Schleicher, R.L.; Rybak, M.E. Dietary supplement use and smoking are important correlates of biomarkers of water-soluble vitamin status after adjusting for sociodemographic and lifestyle variables in a representative sample of U.S. Adults. J. Nutr. 2013, 143, 957–965. [Google Scholar] [CrossRef]
- Schectman, G.; Byrd, J.C.; Gruchow, H.W. The influence of smoking on vitamin C status in adults. Am. J. Public Health 1989, 79, 158–162. [Google Scholar] [CrossRef] [PubMed]
- Tiboni, G.M.; Bucciarelli, T.; Giampietro, F.; Sulpizio, M.; Di Ilio, C. Influence of cigarette smoking on vitamin E, vitamin A, β-carotene and lycopene concentrations in human pre-ovulatory follicular fluid. Int. J. Immunopathol. Pharmacol. 2004, 17, 389–393. [Google Scholar] [CrossRef] [PubMed]
- Tuenter, A.; Bautista Nino, P.K.; Vitezova, A.; Pantavos, A.; Bramer, W.M.; Franco, O.H.; Felix, J.F. Folate, vitamin B12, and homocysteine in smoking-exposed pregnant women: A systematic review. Matern. Child Nutr. 2019, 15, e12675. [Google Scholar] [CrossRef] [PubMed]
- Need, A.G.; Kemp, A.; Giles, N.; Morris, H.A.; Horowitz, M.; Nordin, B.E.C. Relationships between intestinal calcium absorption, serum vitamin D metabolites and smoking in postmenopausal women. Osteoporos. Int. 2002, 13, 83–88. [Google Scholar] [CrossRef]
- Cichosz, S.L.; Jensen, M.H.; Hejlesen, O. Associations between smoking, glucose metabolism and lipid levels: A cross-sectional study. J. Diabetes Complicat. 2020, 34, 107649. [Google Scholar] [CrossRef]
- Grøndahl, M.F.; Bagger, J.I.; Lund, A.; Faurschou, A.; Rehfeld, J.F.; Holst, J.J.; Vilsbøll, T.; Knop, F.K. Effects of smoking versus nonsmoking on postprandial glucose metabolism in heavy smokers compared with nonsmokers. Diabetes Care 2018, 41, 1260–1267. [Google Scholar] [CrossRef]
- Keser, A.; Nesil, T.; Kanit, L.; Pogun, S. Brain nitric oxide metabolites in rats preselected for nicotine preference and intake. Neurosci. Lett. 2013, 545, 102–106. [Google Scholar] [CrossRef]
- Ko, C.H.; Chan, R.L.Y.; Siu, W.S.; Shum, W.T.; Leung, P.C.; Zhang, L.; Cho, C.H. Deteriorating Effect on Bone Metabolism and Microstructure by Passive Cigarette Smoking Through Dual Actions on Osteoblast and Osteoclast. Calcif. Tissue Int. 2015, 96, 389–400. [Google Scholar] [CrossRef]
- Carnevale, R.; Sciarretta, S.; Violi, F.; Nocella, C.; Loffredo, L.; Perri, L.; Peruzzi, M.; Marullo, A.G.M.; De Falco, E.; Chimenti, I.; et al. Acute Impact of Tobacco vs. Electronic Cigarette Smoking on Oxidative Stress and Vascular Function. Chest 2016, 150, 606–612. [Google Scholar] [CrossRef]
- Özdemir, B.; Özmeric, N.; Elgün, S.; Barış, E. Smoking and gingivitis: Focus on inducible nitric oxide synthase, nitric oxide and basic fibroblast growth factor. J. Periodontal Res. 2016, 51, 596–603. [Google Scholar] [CrossRef]
- Richie, J.P.; Kleinman, W.; Marina, P.; Abraham, P.; Wynder, E.L.; Muscat, J.E. Blood iron, glutathione, and micronutrient levels and the risk of oral cancer. Nutr. Cancer 2008, 60, 474–482. [Google Scholar] [CrossRef]
- Tiziani, S.; Lopes, V.; Günther, U.L. Early stage diagnosis of oral cancer using 1H NMR-Based metabolomics1,2. Neoplasia 2009, 11, 269–276. [Google Scholar] [CrossRef]
- Wei, J.; Xie, G.; Zhou, Z.; Shi, P.; Qiu, Y.; Zheng, X.; Chen, T.; Su, M.; Zhao, A.; Jia, W. Salivary metabolite signatures of oral cancer and leukoplakia. Int. J. Cancer 2011, 129, 2207–2217. [Google Scholar] [CrossRef]
- Sugimoto, M.; Wong, D.T.; Hirayama, A.; Soga, T.; Tomita, M. Capillary electrophoresis mass spectrometry-based saliva metabolomics identified oral, breast and pancreatic cancer-specific profiles. Metabolomics 2010, 6, 78–95. [Google Scholar] [CrossRef] [PubMed]
- Xie, G.X.; Chen, T.L.; Qiu, Y.P.; Shi, P.; Zheng, X.J.; Su, M.M.; Zhao, A.H.; Zhou, Z.T.; Jia, W. Urine metabolite profiling offers potential early diagnosis of oral cancer. Metabolomics 2012, 8, 220–231. [Google Scholar] [CrossRef]
- Umashree, N.; Roopavathi, K.; Shakya, H. Salivary Analysis of Nitrate, Nitrite and Tobacco Specific Nitrosamines Biomarkers in Oral Cancer Patients and its Correlation with Histopathological Grading. Indian J. Stomatol. 2014, 5, 90–94. [Google Scholar]
- Yuvaraj, M.; Udayakumar, K.; Jayanth, V.; Rao, A.P.; Bharanidharan, G.; Koteeswaran, D.; Munusamy, B.D.; Krishna, C.M.; Ganesan, S. Fluorescence spectroscopic characterization of salivary metabolites of oral cancer patients. J. Photochem. Photobiol. B 2014, 130, 153–160. [Google Scholar] [CrossRef] [PubMed]
- Wang, Q.; Gao, P.; Cheng, F.; Wang, X.; Duan, Y. Measurement of salivary metabolite biomarkers for early monitoring of oral cancer with ultra performance liquid chromatography-mass spectrometry. Talanta 2014, 119, 299–305. [Google Scholar] [CrossRef]
- Bhat, M.; Prasad, K.V.V.; Trivedi, D.; Rajeev, B.; Battur, H. Pyruvic acid levels in serum and saliva: A new course for oral cancer screening? J. Oral Maxillofac. Pathol. 2016, 20, 102–105. [Google Scholar] [CrossRef]
- Ishikawa, S.; Sugimoto, M.; Kitabatake, K.; Sugano, A.; Nakamura, M.; Kaneko, M.; Ota, S.; Hiwatari, K.; Enomoto, A.; Soga, T.; et al. Identification of salivary metabolomic biomarkers for oral cancer screening. Sci. Rep. 2016, 6, 31520. [Google Scholar] [CrossRef] [PubMed]
- Ishikawa, S.; Sugimoto, M.; Kitabatake, K.; Tu, M.; Sugano, A.; Yamamori, I.; Iba, A.; Yusa, K.; Kaneko, M.; Ota, S.; et al. Effect of timing of collection of salivary metabolomic biomarkers on oral cancer detection. Amino Acids 2017, 49, 761–770. [Google Scholar] [CrossRef] [PubMed]
- Lohavanichbutr, P.; Zhang, Y.; Wang, P.; Gu, H.; Nagana Gowda, G.A.; Djukovic, D.; Buas, M.F.; Raftery, D.; Chen, C. Salivary metabolite profiling distinguishes patients with oral cavity squamous cell carcinoma from normal controls. PLoS ONE 2018, 13, e0204249. [Google Scholar] [CrossRef] [PubMed]
- Chan, M.Y.; Lee, B.J.; Chang, P.S.; Hsiao, H.Y.; Hsu, L.P.; Chang, C.H.; Lin, P.T. The risks of ubiquinone and β-carotene deficiency and metabolic disorders in patients with oral cancer. BMC Cancer 2020, 20, 310. [Google Scholar] [CrossRef] [PubMed]
- Mukhopadhyay, S.; Ghosh, S.; Das, D.; Arun, P.; Roy, B.; Biswas, N.K.; Maitra, A.; Majumder, P.P. Application of Random Forest and data integration identifies three dysregulated genes and enrichment of Central Carbon Metabolism pathway in Oral Cancer. BMC Cancer 2020, 20, 1219. [Google Scholar] [CrossRef]
- Lieu, E.L.; Nguyen, T.; Rhyne, S.; Kim, J. Amino acids in cancer. Exp. Mol. Med. 2020, 52, 15–30. [Google Scholar] [CrossRef]
- Warburg, O. On the Origin of Cancer Cells. Science 1956, 3191, 309–414. [Google Scholar] [CrossRef]
- Vander Heiden, M.G.; Cantley, L.C.; Thompson, C.B. Understanding the Warburg Effect: The Metabolic Requirements of Cell Proliferation. Science 2009, 324, 1029–1033. [Google Scholar] [CrossRef]
- Koundouros, N.; Poulogiannis, G. Reprogramming of fatty acid metabolism in cancer. Br. J. Cancer 2020, 122, 4–22. [Google Scholar] [CrossRef]
- Nagarajan, S.R.; Butler, L.M.; Hoy, A.J. The diversity and breadth of cancer cell fatty acid metabolism. Cancer Metab. 2021, 9, 2. [Google Scholar] [CrossRef]
- Doldo, E.; Costanza, G.; Agostinelli, S.; Tarquini, C.; Ferlosio, A.; Arcuri, G.; Passeri, D.; Scioli, M.G.; Orlandi, A. Vitamin A, cancer treatment and prevention: The new role of cellular retinol binding proteins. Biomed Res. Int. 2015, 2015, 624627. [Google Scholar] [CrossRef]
- Sankaranarayanan, R.; Mathew, B. Retinoids as cancer-preventive agents. IARC Sci. Publ. 1996, 139, 47–59. [Google Scholar]
- Peterson, C.T.; Rodionov, D.A.; Osterman, A.L.; Peterson, S.N. B Vitamins and Their Role in Immune Regulation and Cancer. Nutrients 2020, 12, 3380. [Google Scholar] [CrossRef] [PubMed]
- Gui, X.; Yang, Z.; Li, M.D. Effect of Cigarette Smoke on Gut Microbiota: State of Knowledge. Front. Physiol. 2021, 12, 624627. [Google Scholar] [CrossRef] [PubMed]
- Rowland, I.; Gibson, G.; Heinken, A.; Scott, K.; Swann, J.; Thiele, I.; Tuohy, K. Gut microbiota functions: Metabolism of nutrients and other food components. Eur. J. Nutr. 2018, 57, 1–24. [Google Scholar] [CrossRef]
- Rubinow, K.B. An intracrine view of sex steroids, immunity, and metabolic regulation. Mol. Metab. 2018, 15, 92–103. [Google Scholar] [CrossRef] [PubMed]
- Aird, K.M.; Zhang, R. Nucleotide Metabolism, Oncogene-Induced Senescence and Cancer. Cancer Lett. 2015, 356, 204–210. [Google Scholar] [CrossRef] [PubMed]
- Wiggs, A.; Molina, S.; Sumner, S.J.; Rushing, B.R. A Review of Metabolic Targets of Anticancer Nutrients and Nutraceuticals in Pre-Clinical Models of Triple-Negative Breast Cancer. Nutrients 2022, 14, 1990. [Google Scholar] [CrossRef]
- Bender, R.; Lange, S. Adjusting for multiple testing—When and how? J. Clin. Epidemiol. 2001, 54, 343–349. [Google Scholar] [CrossRef]
- Xi, B.; Gu, H.; Baniasadi, H.; Raftery, D. Statistical Analysis and Modeling of Mass Spectrometry-Based Metabolomics Data. Methods Mol. Biol. 2014, 1198, 333–353. [Google Scholar] [CrossRef]
- Rothman, K.J. No adjustments are needed for multiple comparisons. Epidemiology 1990, 1, 43–46. [Google Scholar] [CrossRef]


| Author | Reference | Change in Compound(s) from Smoking | Sample Type | Sample Size |
|---|---|---|---|---|
| Gu et al. | [19] | ↑ 2-, 4-hydroxylation of estrogen ↓ total parent estrogen and estrogen metabolites | Urine | 603 |
| Aug et al. | [20] | ↑ ADP, α-ketoglutarate, gln, creatine, hypoxanthine, aconitic acid ↓ phospholipids, inorganic phosphate, spermidine | Primary Cells | - |
| Ghasemi et al. | [21] | ↑ NO and NOx levels | Serum | 333 |
| Hsu et al. | [22] | ↓ glutamate, glycerophospholipids, and cAMP | Serum | 105 |
| Nelson et al. | [23] | ↑ biogenic amines ↓ dipeptides | Mid-vaginal swabs | 36 |
| Windham et al. | [24] | ↑ FSH | Urine | 403 |
| Lokki et al. | [25] | ↓ 25-hydroxyvitamin D | Serum | 359 |
| Zhao et al. | [26] | ↑ testosterone in men but not in women | Serum | 19,406 |
| He et al. | [27] | ↑ myristic acid and 3β-hydroxy-5-cholestenoic acid ↓ 7Z, 10Z-hexadecadienoic acid | Serum | 70 |
| Ulvik et al. | [28] | ↓ folate, riboflavin, pyridoxal 5’phosphate (PLP) | Serum | 6775 |
| Zappacosta et al. | [29] | ↑ glutathione | Saliva | 40 |
| Van der Plas et al. | [30] | ↑ 11-dehydrothromboxane B2 levels | Urine | 5087 |
| Nadruz et al. | [31] | ↑ N-terminal pro-brain natriuretic peptide (NT-proBNP) and high-sensitivity Troponin T (hs-TnT) | Blood | 9649 |
| Pfeiffer et al. | [32] | ↑ total homocysteine (tHcy) ↓vitamin C, PLP, 4-pyridoxic acid, serum folate, and RBC folate | Blood | 8944 |
| Schectman et al. | [33] | ↓ serum vitamin C | Serum | 11,592 |
| Tiboni et al. | [34] | ↓ β-carotene | Plasma and follicular fluid | 60 |
| Tuenter et al. | [35] | ↑ homocysteine ↓ folate and vitamin B12 | Multiple | 37,822 |
| Need et al. | [36] | ↓ calcium absorption rate, vitamin D metabolites, and PTH. | Blood and Urine | 405 |
| Cichosz et al. | [37] | ↑ triglycerides and LDL ↓ HDL, oral glucose tolerance test (OGTT) scores | Blood | 12,460 |
| Grøndahl et al. | [38] | ↑ fasting glucagon ↓ post meal glucose | Blood | 23 |
| Keser et al. | [39] | ↑NO | Brain Tissue | 58 |
| Ko et al. | [40] | ↑ calcium, phosphorous, and deoxypyridinoline | Urine and Serum | 60 |
| Carnevale et al. | [41] | ↑ oxidative stress markers ↓ nitric oxide bioavailability and vitamin E | Blood | 40 |
| Özdemir et al. | [42] | ↑ iNOS expression | Gingival tissue and gingival crevicular fluid | 41 |
| Author | Reference | Metabolic Alterations Due to Cancer Status | Population Size | Sample Type |
|---|---|---|---|---|
| Richie et al. | [43] | ↓ iron and glutathione | 200 | Serum |
| Tiziani et al. | [44] | ↑ sarcosine, dimethylglycine, betaine, choline, asparagine, ornithine, phenylalanine, glucose, acetoacetate, acetone, and 3-hydroxybutyrate ↓ levels of creatinine, creatine, gly, ser, pyruvate, ala, lactate, ile, leu, lys, thr, tyr, val, gln, pro, and citrate | 25 | Serum |
| Wei et al. | [45] | ↑ n-eicosanoic acid and lactic acid ↓ γ-aminobutyric acid, phe, and val | 103 | Saliva |
| Sugimoto et al. | [46] | ↑ ala, leu, Ile, his, val, trp, glu, thr, taurine, and carnitine | 215 | Saliva |
| Xie et al. | [47] | ↓ cys and tyr | 103 | Urine |
| Umashree et al. | [48] | ↑ nitrate and nitrite | 50 | Saliva |
| Yuvaraj et al. | [49] | ↑ porphyrin | 123 | Saliva |
| Wang et al. | [50] | ↓ phe and leu | 90 | Saliva |
| Bhat et al. | [51] | ↑ pyruvic acid | 50 | Saliva and serum |
| Ishikawa et al. | [52] | ↑ glutaminolysis, lactate, kynurenine, SAM, and pipecolate ↓ glycolysis intermediates | 68 | Saliva |
| Ishikawa et al. | [53] | ↑ N,N-dimethylglycine, isopropanolamine, cystine, trimethylamine N-oxide, guanosine, hypotaurine, SAM, and pipecolate | 66 | Saliva |
| Lohavanichbutr et al. | [54] | alterations in glu, gln, gly, ser, thr, arg, pro, ala, asp metabolism and TCA cycle metabolism | 100 | Saliva |
| Chan et al. | [55] | ↓ ubiquinone and β-carotene | 194 | Serum |
| Mukhopadhyay et al. | [56] | multiple alterations in central carbon metabolism | 40 | Oral Tissue |
| Pathway Number | Pathway Name | Combined p-Value |
|---|---|---|
| P1 | Tyrosine metabolism | 0.00044 |
| P2 | Butanoate metabolism | 0.00046 |
| P3 | C21-steroid hormone biosynthesis and metabolism | 0.00645 |
| P4 | Valine, leucine and isoleucine degradation | 0.00673 |
| P5 | Vitamin B1 (thiamin) metabolism | 0.01029 |
| P6 | Tryptophan metabolism | 0.01565 |
| P7 | Drug metabolism-cytochrome P450 | 0.01626 |
| P8 | Propanoate metabolism | 0.0254 |
| P9 | Glycosphingolipid metabolism | 0.03312 |
| P10 | Androgen and estrogen biosynthesis and metabolism | 0.03626 |
| P11 | Linoleate metabolism | 0.0402 |
| P12 | Sialic acid metabolism | 0.04572 |
| P13 | Biopterin metabolism | 0.04786 |
| P14 | Pyrimidine metabolism | 0.04879 |
| P15 | Galactose metabolism | 0.0494 |
| Peak | Ontology | Compound Name | p-Value | Fold Change (Smoker/ Non-Smoker) | VIP |
|---|---|---|---|---|---|
| 0.63_147.0765 m/z | OL1 | Glutamine | 2.17 × 10⁻⁵ | −1.7 | 1.2 |
| 0.64_117.0538 n | OL1 | Guanidineacetic Acid | 2.17 × 10⁻⁵ | −1.3 | 1.1 |
| 0.64_75.0684 n | OL1 | Trimethylamine Oxide | 2.17 × 10⁻⁵ | −1.2 | 1.2 |
| 0.71_157.0608 m/z | OL1 | Formiminoglutamic Acid | 2.17 × 10⁻⁵ | 1.2 | 1.1 |
| 0.71_161.0688 n | OL1 | 2-Aminoadipic Acid | 2.17 × 10⁻⁵ | −1.7 | 1.3 |
| 0.71_203.1502 m/z | OL1 | N,N-Dimethyl-Arginine | 2.17 × 10⁻⁵ | 1.2 | 1.1 |
| 0.73_163.0601 m/z | OL1 | Mannose | 2.17 × 10⁻⁵ | −3.4 | 1.3 |
| 0.82_115.0390 m/z | OL1 | Xylose | 2.17 × 10⁻⁵ | −1.8 | 1.3 |
| 0.82_174.0641 n | OL1 | N-Acetylasparagine | 2.17 × 10⁻⁵ | 1.2 | 1.2 |
| 0.82_180.0867 m/z | OL1 | D-(+)-Glucosamine | 2.17 × 10⁻⁵ | −2.2 | 1.3 |
| 1.02_112.0273 n | OL1 | Uracil | 2.17 × 10⁻⁵ | −1.6 | 1.2 |
| 1.04_147.0532 n | OL1 | Threo-3-Methylaspartate | 2.17 × 10⁻⁵ | 1.4 | 1.3 |
| 1.10_134.0580 n | OL1 | Deoxyribose | 2.17 × 10⁻⁵ | −1.6 | 1.3 |
| 1.10_193.0972 m/z | OL1 | Trans-3’-Hydroxycotinine | 2.17 × 10⁻⁵ | 33.3 | 1.3 |
| 1.11_139.0026 m/z | OL1 | Aconitic Acid | 2.17 × 10⁻⁵ | −1.3 | 1.2 |
| 1.18_262.1283 m/z | OL1 | Succinylcarnitine | 2.17 × 10⁻⁵ | −1.3 | 1.2 |
| 1.20_167.0219 n | OL1 | Quinolinate | 2.17 × 10⁻⁵ | −1.3 | 1.2 |
| 1.26_163.1230 m/z | OL1 | Nicotine | 2.17 × 10⁻⁵ | 45.2 | 1.3 |
| 1.48_153.0408 m/z | OL1 | Xanthine | 2.17 × 10⁻⁵ | −1.6 | 1.3 |
| 1.60_179.1179 m/z | OL1 | (1′S,2′S)-Nicotine 1′-Oxide | 2.17 × 10⁻⁵ | 37.8 | 1.3 |
| 1.70_176.0322 n | OL1 | 1,2,3-Propanetricarboxylic | 2.17 × 10⁻⁵ | 3.7 | 1.3 |
| 1.74_153.0408 m/z | OL1 | Xanthine | 2.17 × 10⁻⁵ | −12.3 | 1.3 |
| 1.82_178.1106 n | OL1 | (1′S,2′S)-Nicotine 1′-Oxide | 2.17 × 10⁻⁵ | 35.1 | 1.3 |
| 1.86_145.0496 m/z | OL1 | 3-Hydroxyadipic 3,6 Lactone | 2.17 × 10⁻⁵ | −2.7 | 1.3 |
| 1.99_177.1023 m/z | OL1 | Cotinine | 2.17 × 10⁻⁵ | 31.0 | 1.3 |
| 2.01_162.0529 n | OL1 | 3-Hydroxyadipic Acid | 2.17 × 10⁻⁵ | −1.4 | 1.3 |
| 2.37_144.0424 n | OL1 | 3-Hydroxyadipic 3,6 Lactone | 2.17 × 10⁻⁵ | −1.4 | 1.2 |
| 2.44_127.0391 m/z | OL1 | 3-Hydroxy-3-Methylglutaric Acid | 2.17 × 10⁻⁵ | −1.5 | 1.3 |
| 2.48_267.0966 n | OL1 | Adenosine | 2.17 × 10⁻⁵ | 1.3 | 1.1 |
| 2.60_183.0532 n | OL1 | 4-Pyridoxic Acid | 2.17 × 10⁻⁵ | −1.4 | 1.2 |
| 2.62_145.0496 m/z | OL1 | 2-Hydroxyadipic Acid | 2.17 × 10⁻⁵ | −1.6 | 1.2 |
| 2.83_269.0879 m/z | OL1 | Inosine | 2.17 × 10⁻⁵ | −12.3 | 1.3 |
| 3.01_166.0491 n | OL1 | 7-Methylxanthine | 2.17 × 10⁻⁵ | −1.6 | 1.3 |
| 3.19_165.0790 n | OL1 | Phenylalanine | 2.17 × 10⁻⁵ | 1.2 | 1.2 |
| 3.28_166.0491 n | OL1 | 3-Methylxanthine | 2.17 × 10⁻⁵ | −2.2 | 1.3 |
| 3.45_151.0634 n | OL1 | Acetaminophen | 2.17 × 10⁻⁵ | −3.6 | 1.3 |
| 3.49_232.1543 m/z | OL1 | Isobutyryl-L-Carnitine | 2.17 × 10⁻⁵ | −1.4 | 1.2 |
| 3.71_153.0427 n | OL1 | 3-Hydroxyanthranilate | 2.17 × 10⁻⁵ | −2.1 | 1.3 |
| 3.73_221.0722 n | OL1 | N-Acetyl-S-(3-Hydroxypropyl)Cysteine | 2.17 × 10⁻⁵ | 4.6 | 1.3 |
| 3.84_195.0532 n | OL1 | 3-Hydroxyhippuric Acid | 2.17 × 10⁻⁵ | 1.4 | 1.2 |
| 3.88_151.0634 n | OL1 | Acetaminophen | 2.17 × 10⁻⁵ | −4.2 | 1.3 |
| 4.03_196.0597 n | OL1 | 1,3-Dimethyluric Acid | 2.17 × 10⁻⁵ | −1.5 | 1.3 |
| 4.03_219.1107 n | OL1 | Pantothenate | 2.17 × 10⁻⁵ | −1.3 | 1.2 |
| 4.22_180.0647 n | OL1 | 3,7-Dimethylxanthine | 2.17 × 10⁻⁵ | −1.9 | 1.3 |
| 4.64_196.0605 m/z | OL1 | 4-Hydroxyhippuric Acid | 2.17 × 10⁻⁵ | −7.3 | 1.3 |
| 5.05_235.0878 n | OL1 | N-Acetyl-S-(3-Hydroxypropyl-1-Methyl)-L-Cysteine | 2.17 × 10⁻⁵ | 3.8 | 1.3 |
| 5.28_122.0368 n | OL1 | 4-Hydroxybenzaldehyde | 2.17 × 10⁻⁵ | −1.4 | 1.3 |
| 5.28_179.0582 n | OL1 | Hippuric Acid | 2.17 × 10⁻⁵ | −1.4 | 1.2 |
| 5.92_194.0804 n | OL1 | 1,3,7-Trimethylxanthine | 2.17 × 10⁻⁵ | −1.8 | 1.3 |
| 7.14_193.0740 n | OL1 | 4-Methylhippuric Acid | 2.17 × 10⁻⁵ | 3.6 | 1.3 |
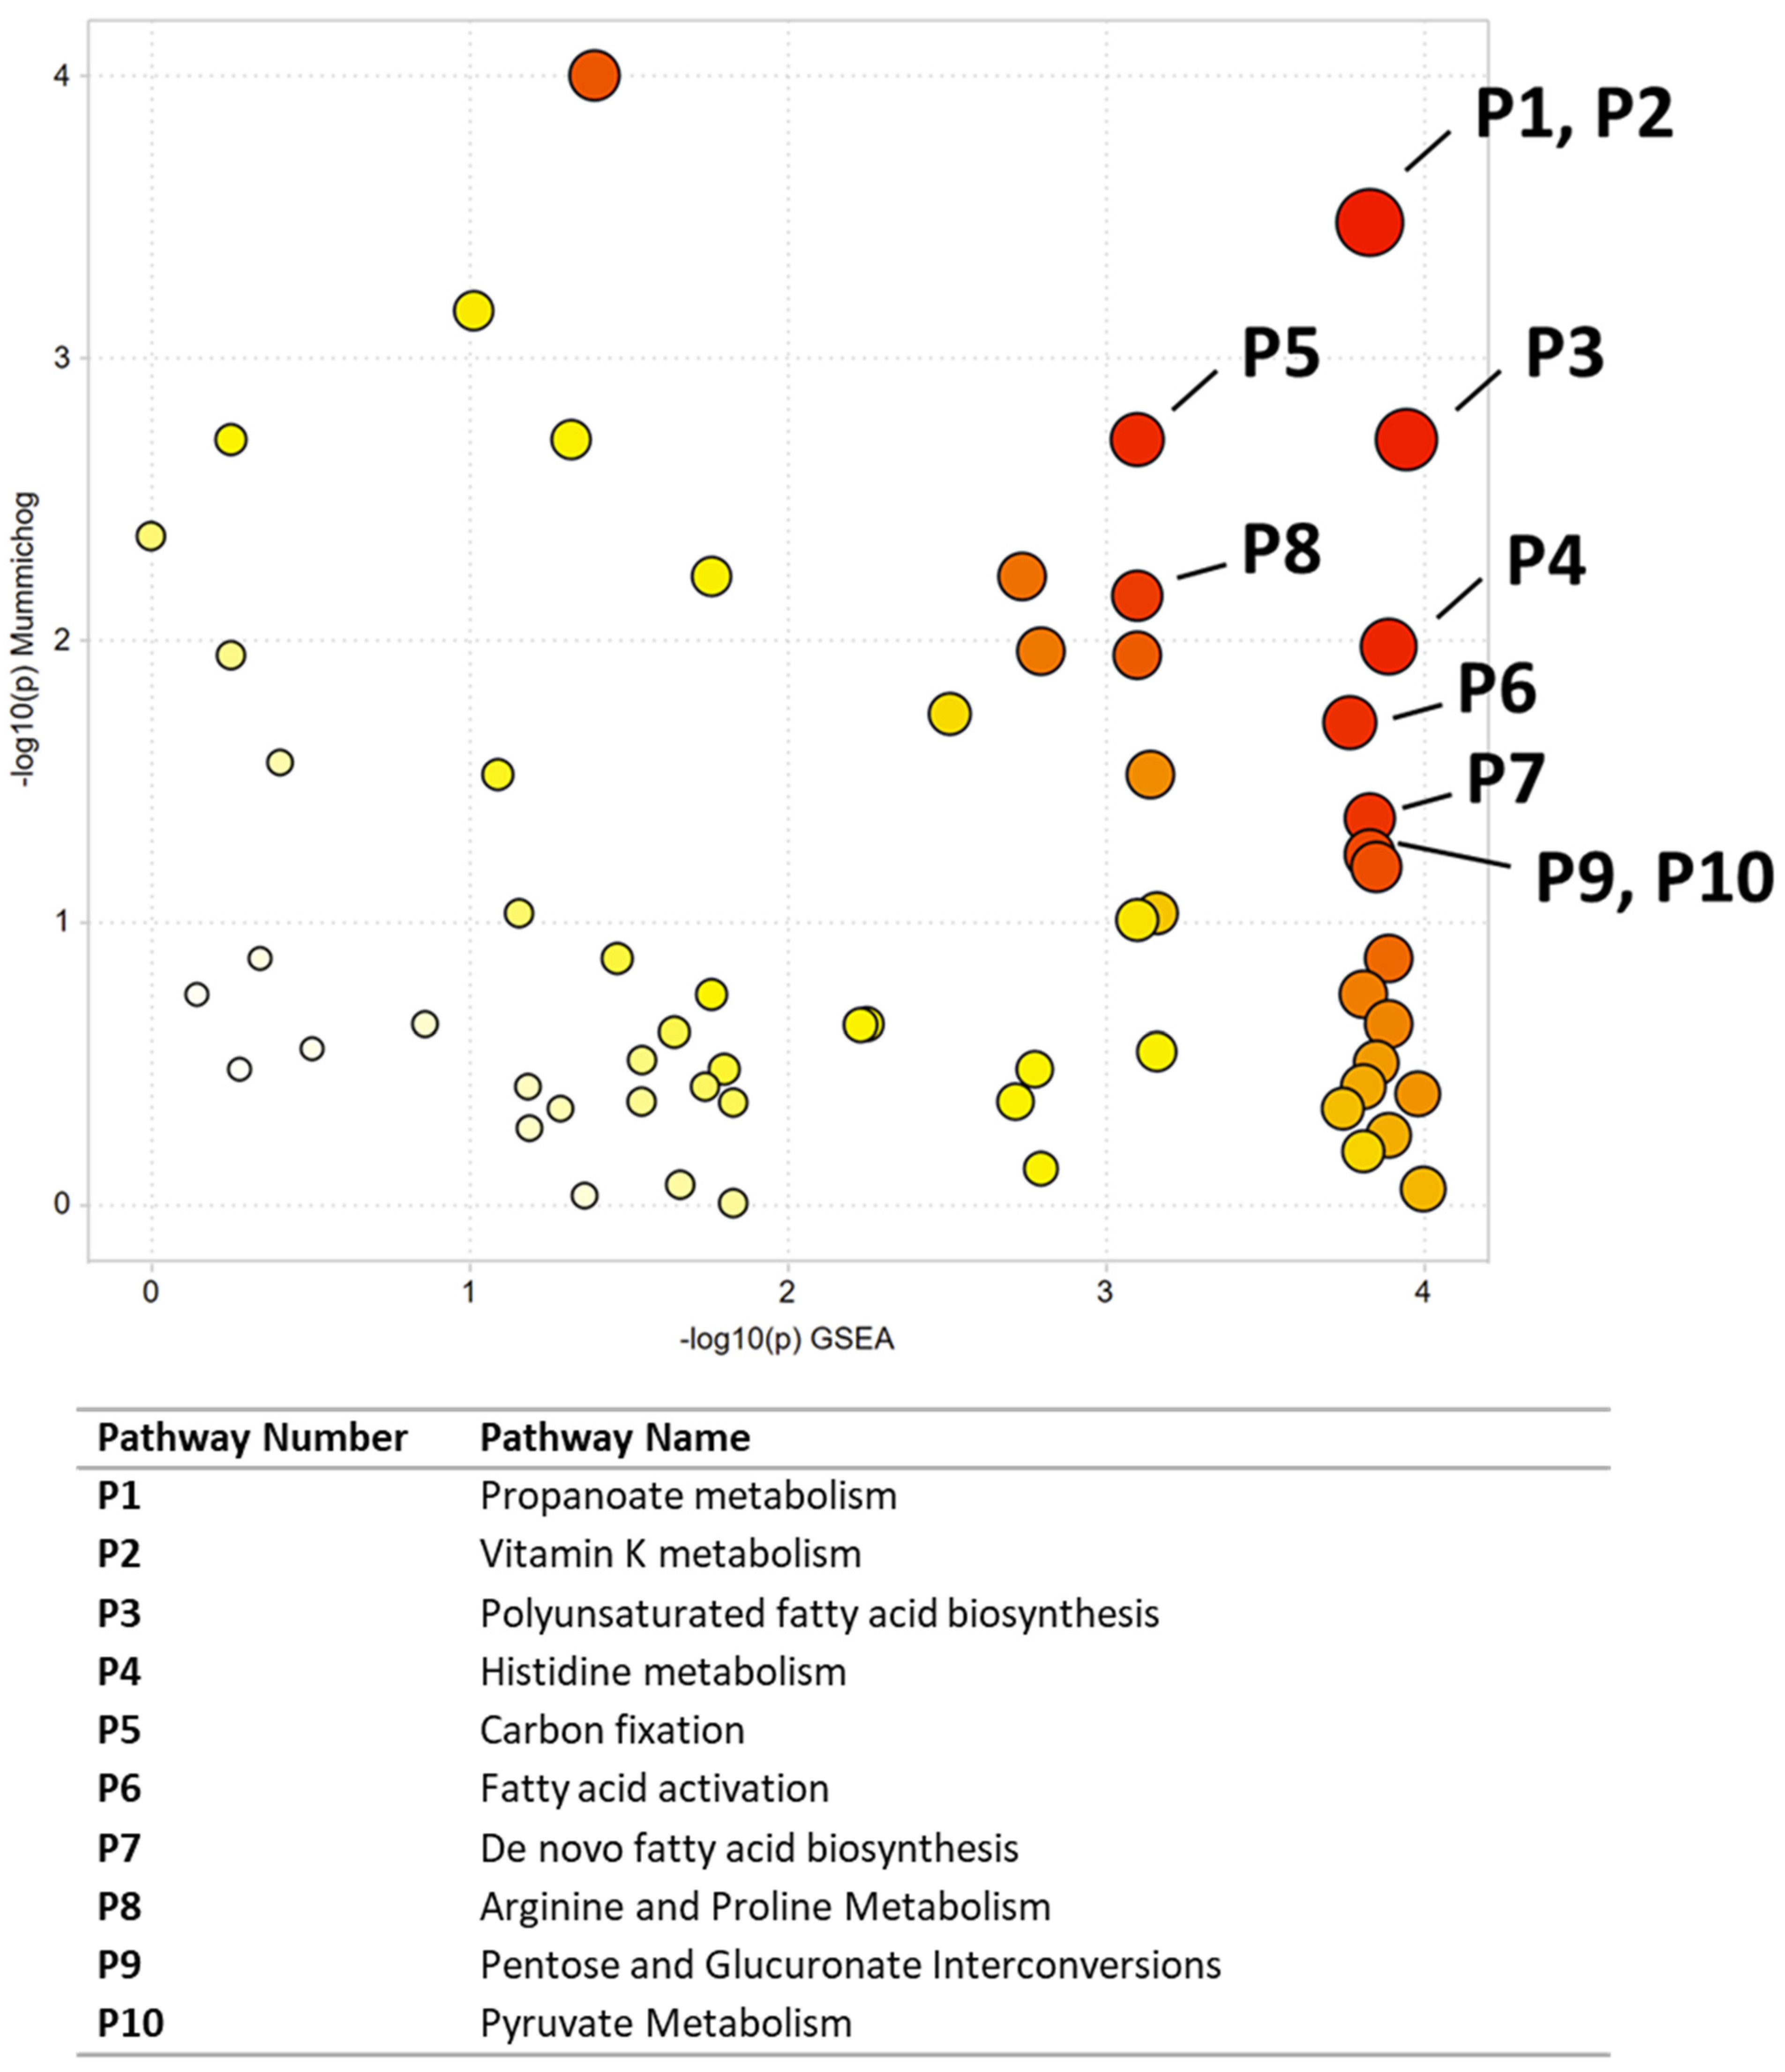
| Pathway Number | Pathway Name | Combined p-Value |
|---|---|---|
| P1 | Propanoate metabolism | 0.00848 |
| P2 | Vitamin K metabolism | 0.00848 |
| P3 | Polyunsaturated fatty acid biosynthesis | 0.01344 |
| P4 | Histidine metabolism | 0.02389 |
| P5 | Carbon fixation | 0.02778 |
| P6 | Fatty acid activation | 0.03208 |
| P7 | De novo fatty acid biosynthesis | 0.03863 |
| P8 | Arginine and Proline Metabolism | 0.04103 |
| P9 | Pentose and Glucuronate Interconversions | 0.04226 |
| P10 | Pyruvate Metabolism | 0.04226 |
| P11 | Linoleate metabolism | 0.04284 |
| P12 | Methionine and cysteine metabolism | 0.04714 |
| P13 | TCA cycle | 0.04752 |
| Peak | Ontology | Accepted Compound ID | p-Value | Fold Change (Malignant/Normal) | VIP |
|---|---|---|---|---|---|
| 6.02_265.1041 m/z | PDa | 2-Aminoadenosine | 1.6 × 10⁻⁵ | 1.2 | 1.4 |
| 13.94_347.1822 m/z | PDa | Hymeglusin | 5.6 × 10⁻⁵ | 1.3 | 1.2 |
| 16.97_320.2577 m/z | OL2b | Eicosapentaenoate | 9.6 × 10⁻⁵ | −2.1 | 2.1 |
| 10.97_307.1510 m/z | PDa | 5-(Galactosylhydroxy)-L-lysine | 1.6 × 10⁻⁴ | 1.1 | 1.4 |
| 12.37_326.0001 n | PDa | Tris(1-chloro-2-propyl) phosphate | 2.3 × 10⁻⁴ | 1.2 | 1.4 |
| 0.67_148.0967 m/z | PDa | 4-Hydroxy-L-isoleucine | 4.5 × 10⁻⁴ | 1.2 | 1.2 |
| 14.90_361.2341 m/z | PDa | Leukotriene B3 | 6.8 × 10⁻⁴ | 1.7 | 1.0 |
| 15.58_391.2446 m/z | PDa | 15(R)-15-Methylprostaglandin F2α | 7.9 × 10⁻⁴ | −1.3 | 1.6 |
| 15.30_487.3235 m/z | PDa | Glycolic acid pentaethoxylate lauryl ether | 9.0 × 10⁻⁴ | 3.8 | 1.0 |
| 8.91_227.0675 m/z | OL2a | Azelate | 1.6 × 10⁻³ | −1.5 | 1.4 |
| 13.22_491.2608 m/z | PDa | 5α-Androstan-3α,17β-diol-O-3-β-glucuronic acid | 2.1 × 10⁻³ | −1.1 | 1.4 |
| 14.67_331.1001 m/z | PDa | 2’,3’-Isopropylideneinosine | 2.8 × 10⁻³ | 1.5 | 0.9 |
| 9.88_293.1353 m/z | PDa | His-His | 3.2 × 10⁻³ | 1.1 | 1.2 |
| 0.67_112.0504 m/z | OL2a | Cytosine | 3.7 × 10⁻³ | 1.5 | 0.8 |
| 14.41_377.2655 m/z | PDa | 2-Linoleoylglycerol | 4.0 × 10⁻³ | 1.2 | 1.3 |
| 8.03_201.1118 m/z | OL2a | 3-Hydroxydecanedioic acid | 5.2 × 10⁻³ | 1.1 | 1.3 |
| 11.66_271.0935 m/z | OL2a | Monocyclohexyl phthalate | 5.4 × 10⁻³ | 3.0 | 1.5 |
| 16.24_423.3071 m/z | PDa | 1,2-Didecanoyl-sn-glycerol | 6.6 × 10⁻³ | −1.1 | 1.3 |
| 16.54_409.2918 m/z | PDa | Leupeptin | 7.9 × 10⁻³ | −1.3 | 1.2 |
| 11.98_333.1665 m/z | PDa | [5-Formyl-2-(2-hydroxypropan-2-yl)-4a,6-dimethyl-2,3,4,7,8,8a-hexahydrochromen-4-yl] acetate | 8.0 × 10⁻³ | 1.1 | 1.2 |
| 10.41_180.1016 m/z | OL2a | Propham | 1.1 × 10⁻² | 13.8 | 1.0 |
| 15.19_373.2341 m/z | PDa | 5-Heptenoic acid, 7-[(1R,4S,5S,6R)-6-[(1E,3S)-3-hydroxy-1-octen-1-yl]-2-oxabicyclo [2.2.1]hept-5-yl]-, (5Z)- | 1.1 × 10⁻² | −1.2 | 1.3 |
| 11.35_250.1200 n | PDa | 1,2-Benzenedicarboxylic acid, dipropyl ester | 1.2 × 10⁻² | 1.2 | 1.2 |
| 4.83_189.1231 m/z | PDa | Leu-Gly | 1.3 × 10⁻² | 2.2 | 0.9 |
| 17.00_371.1005 m/z | PDa | Cyclopentasiloxane, decamethyl- | 1.4 × 10⁻² | 1.2 | 1.1 |
| 16.44_371.1005 m/z | PDa | Cyclopentasiloxane, decamethyl- | 1.5 × 10⁻² | 1.5 | 1.1 |
| 16.61_359.2160 m/z | PDa | 5,8,11,14-Tetraoxa-2-azahexadecanoic acid, 16-amino-, 1,1-dimethylethyl ester | 1.5 × 10⁻² | 1.5 | 1.3 |
| 0.70_212.0914 m/z | OL2a | Malonyl-carnitine | 1.5 × 10⁻² | −1.3 | 1.3 |
| 16.92_423.3073 m/z | PDa | 1,2-Didecanoyl-sn-glycerol | 1.7 × 10⁻² | −1.1 | 1.2 |
| 11.19_149.0228 m/z | PDa | 1,2-Benzenedicarboxylic acid | 1.7 × 10⁻² | 1.1 | 1.2 |
| 14.43_314.1874 n | PDa | 7-Oxoabieta-8,11,13-trien-18-oic acid | 1.7 × 10⁻² | 1.1 | 0.9 |
| 0.67_134.0811 m/z | OL2a | 1-Aminocyclopropanecarboxylic acid | 2.0 × 10⁻² | 1.3 | 1.2 |
| 11.53_376.2012 m/z | PDa | 3-[3-(Dimethylamino)propyl]-4-hydroxy-N-[4-(4-pyridyl)phenyl]benzamide | 2.1 × 10⁻² | 1.1 | 1.3 |
| 15.81_328.2605 n | PDa | Monopalmitolein (9c) | 2.3 × 10⁻² | −1.1 | 1.2 |
| 16.82_409.2918 m/z | PDa | Leupeptin | 2.8 × 10⁻² | 1.1 | 1.3 |
| 16.64_425.3020 m/z | PDa | 1-Octadecyl lysophosphatidic acid | 2.8 × 10⁻² | 1.5 | 0.7 |
| 16.97_386.2844 m/z | PDa | 2-Methylarachidonoyl-2’-fluoroethylamide | 2.9 × 10⁻² | −2.6 | 0.9 |
| 13.96_317.1506 m/z | PDa | 4-(4-(1H-Indol-3-yl)-3,6-dihydro-1(2H)-pyridinyl)-1H-pyrazolo [3,4-d]pyrimidine | 3.0 × 10⁻² | −1.8 | 1.1 |
| 12.32_251.1248 m/z | OL2b | 5-Methylcytosine | 3.2 × 10⁻² | 1.1 | 1.0 |
| 15.40_419.3124 m/z | OL2a | 5-Dodecenoic acid | 3.2 × 10⁻² | 1.2 | 1.3 |
| 14.88_421.2552 m/z | PDa | Phe-Val-Arg | 3.2 × 10⁻² | 1.6 | 1.3 |
| 7.55_288.1543 n | PDa | Arg-Asn | 3.7 × 10⁻² | 1.1 | 1.4 |
| 14.72_407.2761 m/z | PDa | 17,20-Dimethyl Prostaglandin F1α | 3.8 × 10⁻² | 1.2 | 1.3 |
| 14.64_274.2138 n | PDa | Monolaurin | 3.8 × 10⁻² | −1.1 | 1.4 |
| 10.71_231.1025 m/z | OL2a | 4-hydroxybenzophenone | 4.1 × 10⁻² | −4.5 | 1.0 |
| 8.94_180.0636 n | OL2b | Galactose | 4.2 × 10⁻² | 1.2 | 0.3 |
| 18.48_384.3384 n | OL2b | 7-Dehydrocholesterol | 4.3 × 10⁻² | −2.0 | 1.1 |
| 9.99_376.2013 m/z | PDa | N,N-dimethyl-4-[[4-(dimethylamino)phenyl](4-nitrophenyl)methyl]aniline | 4.3 × 10⁻² | 1.1 | 1.1 |
| 16.13_274.2159 m/z | PDa | α-Pyrrolidinooctanophenone | 4.8 × 10⁻² | 2.2 | 0.9 |
| 1.06_135.0026 m/z | OL2a | Glyceraldehyde | 4.8 × 10⁻² | 1.2 | 0.8 |
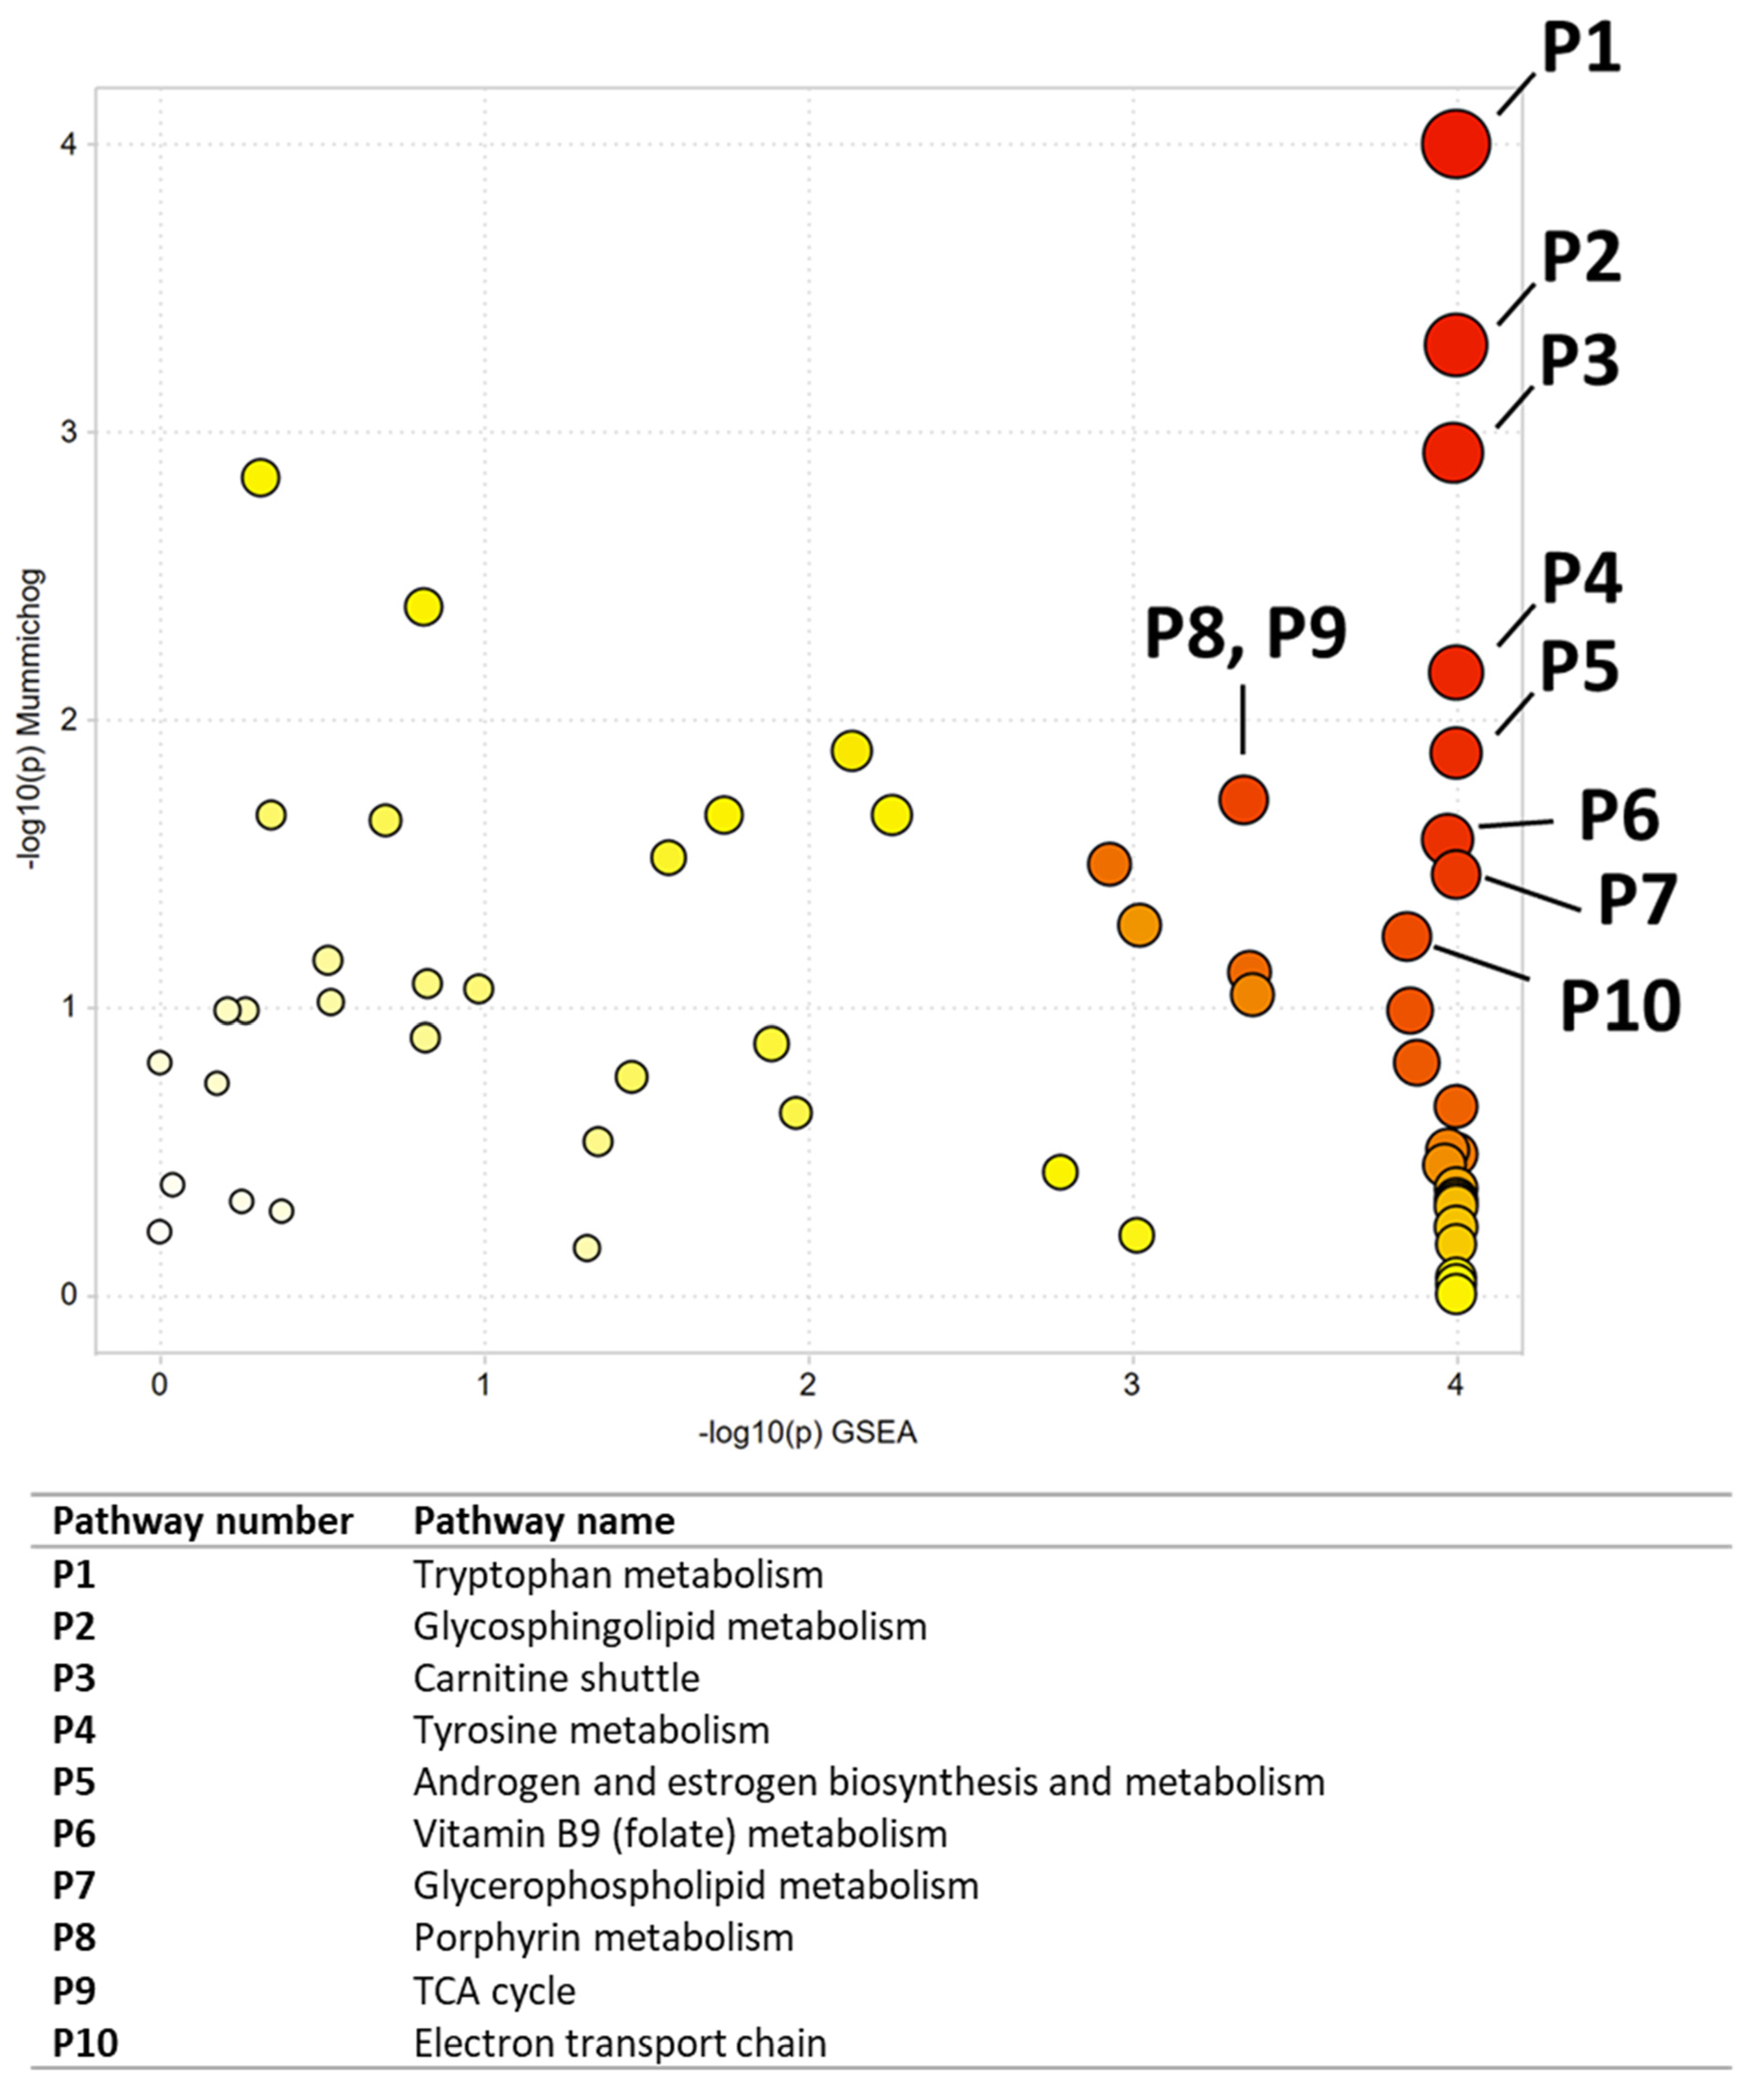
| Pathway Number | Pathway Name | Combined p-Value |
|---|---|---|
| P1 | Tryptophan metabolism | 0.00068 |
| P2 | Glycosphingolipid metabolism | 0.00148 |
| P3 | Carnitine shuttle | 0.00225 |
| P4 | Tyrosine metabolism | 0.00511 |
| P5 | Androgen and estrogen biosynthesis and metabolism | 0.0069 |
| P6 | Vitamin B9 (folate) metabolism | 0.00977 |
| P7 | Glycerophospholipid metabolism | 0.01083 |
| P8 | Porphyrin metabolism | 0.01565 |
| P9 | TCA cycle | 0.01565 |
| P10 | Electron transport chain | 0.01578 |
| P11 | Glycosphingolipid biosynthesis-globoseries | 0.02045 |
| P12 | Glycosphingolipid biosynthesis-ganglioseries | 0.02419 |
| P13 | Pyrimidine metabolism | 0.02521 |
| P14 | Phosphatidylinositol phosphate metabolism | 0.02873 |
| P15 | Fatty acid oxidation | 0.02947 |
| P16 | Linoleate metabolism | 0.02994 |
| P17 | Putative anti-Inflammatory metabolites formation from EPA | 0.03024 |
| P18 | Glycolysis and Gluconeogenesis | 0.03086 |
| P19 | Glutamate metabolism | 0.03221 |
| P20 | Purine metabolism | 0.03356 |
| P21 | C21-steroid hormone biosynthesis and metabolism | 0.03387 |
| P22 | De novo fatty acid biosynthesis | 0.03387 |
| P23 | Fatty acid activation | 0.03521 |
| P24 | Arachidonic acid metabolism | 0.03565 |
| P25 | Methionine and cysteine metabolism | 0.03607 |
| P26 | Drug metabolism-cytochrome P450 | 0.03884 |
| P27 | Xenobiotics metabolism | 0.04127 |
| P28 | Blood Group Biosynthesis | 0.04192 |
| P29 | Glycosphingolipid biosynthesis-lactoseries | 0.04192 |
| P30 | Glycosphingolipid biosynthesis-neolactoseries | 0.04192 |
| P31 | O-Glycan biosynthesis | 0.04192 |
| P32 | Vitamin A (retinol) metabolism | 0.04645 |
| P33 | Hyaluronan Metabolism | 0.04681 |
| P34 | Fatty Acid Metabolism | 0.04753 |
| P35 | Aspartate and asparagine metabolism | 0.04921 |
| Peak | Ontology | Compound Name | p-Value | Fold Change (NNK/Vehicle) | VIP |
|---|---|---|---|---|---|
| 9.55_167.0700 m/z | OL2b | 4-Hydroxy-3-Methoxyphenylglycol | 1.0 × 10⁻³ | 26.8 | 1.5 |
| 13.96_300.2892 m/z | PDa | Phytosphingosine | 2.0 × 10⁻³ | 1.9 | 1.5 |
| 0.65_118.0862 m/z | OL2a | Betaine | 2.0 × 10⁻³ | 1.6 | 1.5 |
| 18.47_791.5832 n | PDa | Docosahexaenoyl PAF C-16 | 3.4 × 10⁻³ | 2.0 | 1.5 |
| 16.04_481.3528 n | PDa | Lyso-PAF C-16 | 4.2 × 10⁻³ | 2.2 | 1.5 |
| 18.81_506.3603 m/z | PDa | 1-Stearoyl-2-hydroxy-sn-glycero-3-phosphocholine | 4.3 × 10⁻³ | 3.9 | 1.5 |
| 17.99_728.5830 n | PDa | N-Oleoyl-D-erythro-sphingosylphosphorylcholine | 5.0 × 10⁻³ | 3.0 | 1.5 |
| 17.70_687.4836 n | PDa | PE(16:1(5Z)/16:1(5Z)) | 5.4 × 10⁻³ | 3.5 | 1.5 |
| 3.74_154.0497 m/z | OL2a | 3-Hydroxyanthranilate | 5.4 × 10⁻³ | 3.9 | 1.5 |
| 3.74_232.1541 m/z | OL1 | Butanoylcarnitine | 6.1 × 10⁻³ | 1.6 | 1.5 |
| 1.08_175.0480 n | OL1 | N-Acetylaspartate | 6.4 × 10⁻³ | 2.0 | 1.5 |
| 16.57_509.3842 n | PDa | Lyso-PAF C-18 | 6.8 × 10⁻³ | 1.9 | 1.5 |
| 13.29_181.1221 m/z | PDa | Methyl perillate | 7.4 × 10⁻³ | −1.3 | 1.5 |
| 0.79_157.0107 m/z | OL2a | Malic acid | 8.2 × 10⁻³ | 1.4 | 1.5 |
| 19.23_771.6143 n | PDa | 1-(1Z-Octadecenyl)-2-(9Z-octadecenoyl)-sn-glycero-3-phosphocholine | 8.3 × 10⁻³ | 1.7 | 1.5 |
| 13.70_299.2820 n | PDa | D-erythro-C18-Sphingosine | 8.7 × 10⁻³ | 2.2 | 1.5 |
| 4.44_160.0756 m/z | OL1 | Indoleacetaldehyde | 8.8 × 10⁻³ | 1.8 | 1.5 |
| 4.90_246.1697 m/z | OL1 | Valerylcarnitine | 9.7 × 10⁻³ | 1.9 | 1.5 |
| 1.42_542.0684 m/z | PDa | Cyclic adenosine diphosphate ribose | 1.1 × 10⁻² | 2.2 | 1.5 |
| 2.87_150.0549 m/z | OL2b | Pyridoxal | 1.1 × 10⁻² | 1.9 | 1.5 |
| 17.70_729.5309 n | PDa | 1,2-Dipalmitoleoyl-sn-glycero-3-phosphocholine | 1.1 × 10⁻² | 2.3 | 1.5 |
| 15.46_310.2867 n | PDa | 14(Z)-Eicosenoic acid | 1.2 × 10⁻² | −1.2 | 1.5 |
| 18.31_742.5371 m/z | PDa | 1,2-Dipalmitoyl-sn-glycero-3-phosphoethanolamine-N,N-dimethyl | 1.2 × 10⁻² | 2.1 | 1.5 |
| 13.60_318.2998 m/z | PDa | Phytosphingosine | 1.2 × 10⁻² | 1.6 | 1.5 |
| 17.46_674.5361 n | PDa | SM(d18:1/14:0) | 1.2 × 10⁻² | 2.1 | 1.5 |
| 4.44_144.0807 m/z | OL2b | Indole-3-Ethanol | 1.2 × 10⁻² | 1.6 | 1.5 |
| 9.10_242.0800 n | OL1 | Lumichrome | 1.3 × 10⁻² | 2.6 | 1.5 |
| 3.33_148.0524 n | OL2b | trans-Cinnamic acid | 1.3 × 10⁻² | 1.6 | 1.5 |
| 1.78_131.0946 n | OL1 | Isoleucine | 1.3 × 10⁻² | 1.6 | 1.5 |
| 4.13_219.1105 n | PDa | Pantothenic Acid | 1.4 × 10⁻² | 1.8 | 1.5 |
| 19.36_506.3603 m/z | PDa | 1-Stearoyl-2-hydroxy-sn-glycero-3-phosphocholine | 1.5 × 10⁻² | 1.7 | 1.5 |
| 15.46_262.2294 n | PDa | Farnesyl acetone | 1.5 × 10⁻² | −1.2 | 1.5 |
| 16.36_549.3794 n | PDa | 1-O-Hexadecyl-2-O-(2E-butenoyl)-sn-glyceryl-3-phosphocholine | 1.5 × 10⁻² | 1.9 | 1.5 |
| 1.08_172.0401 m/z | OL2a | Methionine | 1.5 × 10⁻² | 2.3 | 1.5 |
| 18.41_730.5988 n | PDa | N-Stearoyl-4-sphingenyl-1-O-phosphorylcholine | 1.6 × 10⁻² | 2.2 | 1.5 |
| 15.93_480.3445 m/z | PDa | 1-(1Z-Hexadecenyl)-sn-glycero-3-phosphocholine | 1.7 × 10⁻² | 2.9 | 1.5 |
| 1.42_663.1081 n | PDa | Nicotinamide adenine dinucleotide (NAD) | 1.7 × 10⁻² | 1.6 | 1.5 |
| 18.15_715.5152 n | PDa | 2-Linoleoyl-1-palmitoyl-sn-glycero-3-phosphoethanolamine | 1.7 × 10⁻² | 1.5 | 1.5 |
| 0.67_212.0428 m/z | PDa | Phosphocreatine | 1.8 × 10⁻² | 1.8 | 1.5 |
| 1.60_204.0629 m/z | OL2a | Tyrosine | 1.9 × 10⁻² | 2.0 | 1.5 |
| 0.96_162.0760 m/z | OL1 | 2-Aminoadipic acid | 1.9 × 10⁻² | 3.4 | 1.5 |
| 2.19_218.1385 m/z | OL1 | Propanoylcarnitine | 1.9 × 10⁻² | 1.7 | 1.4 |
| 0.86_426.9911 m/z | PDa | Uridine 5’-diphosphate | 2.0 × 10⁻² | 1.6 | 1.4 |
| 18.15_504.3444 m/z | PDa | 1-(9Z-Octadecenoyl)-sn-glycero-3-phosphocholine | 2.1 × 10⁻² | 2.0 | 1.5 |
| 16.06_327.2289 m/z | OL2a | arachidonic acid | 2.2 × 10⁻² | 1.3 | 1.4 |
| 4.44_146.0600 m/z | OL2b | Indole-3-aldehyde | 2.2 × 10⁻² | 1.6 | 1.5 |
| 13.14_224.1410 n | OL2b | Methyl jasmonate | 2.2 × 10⁻² | −1.2 | 1.5 |
| 4.44_227.0788 m/z | OL2a | Tryptophan | 2.3 × 10⁻² | 1.6 | 1.4 |
| 4.44_187.0632 n | OL2b | Indoleacrylic acid | 2.4 × 10⁻² | 1.5 | 1.4 |
| 17.51_677.4994 n | PDa | 1,2-Ditetradecanoyl-sn-glycero-3-phosphocholine | 2.4 × 10⁻² | 2.1 | 1.5 |
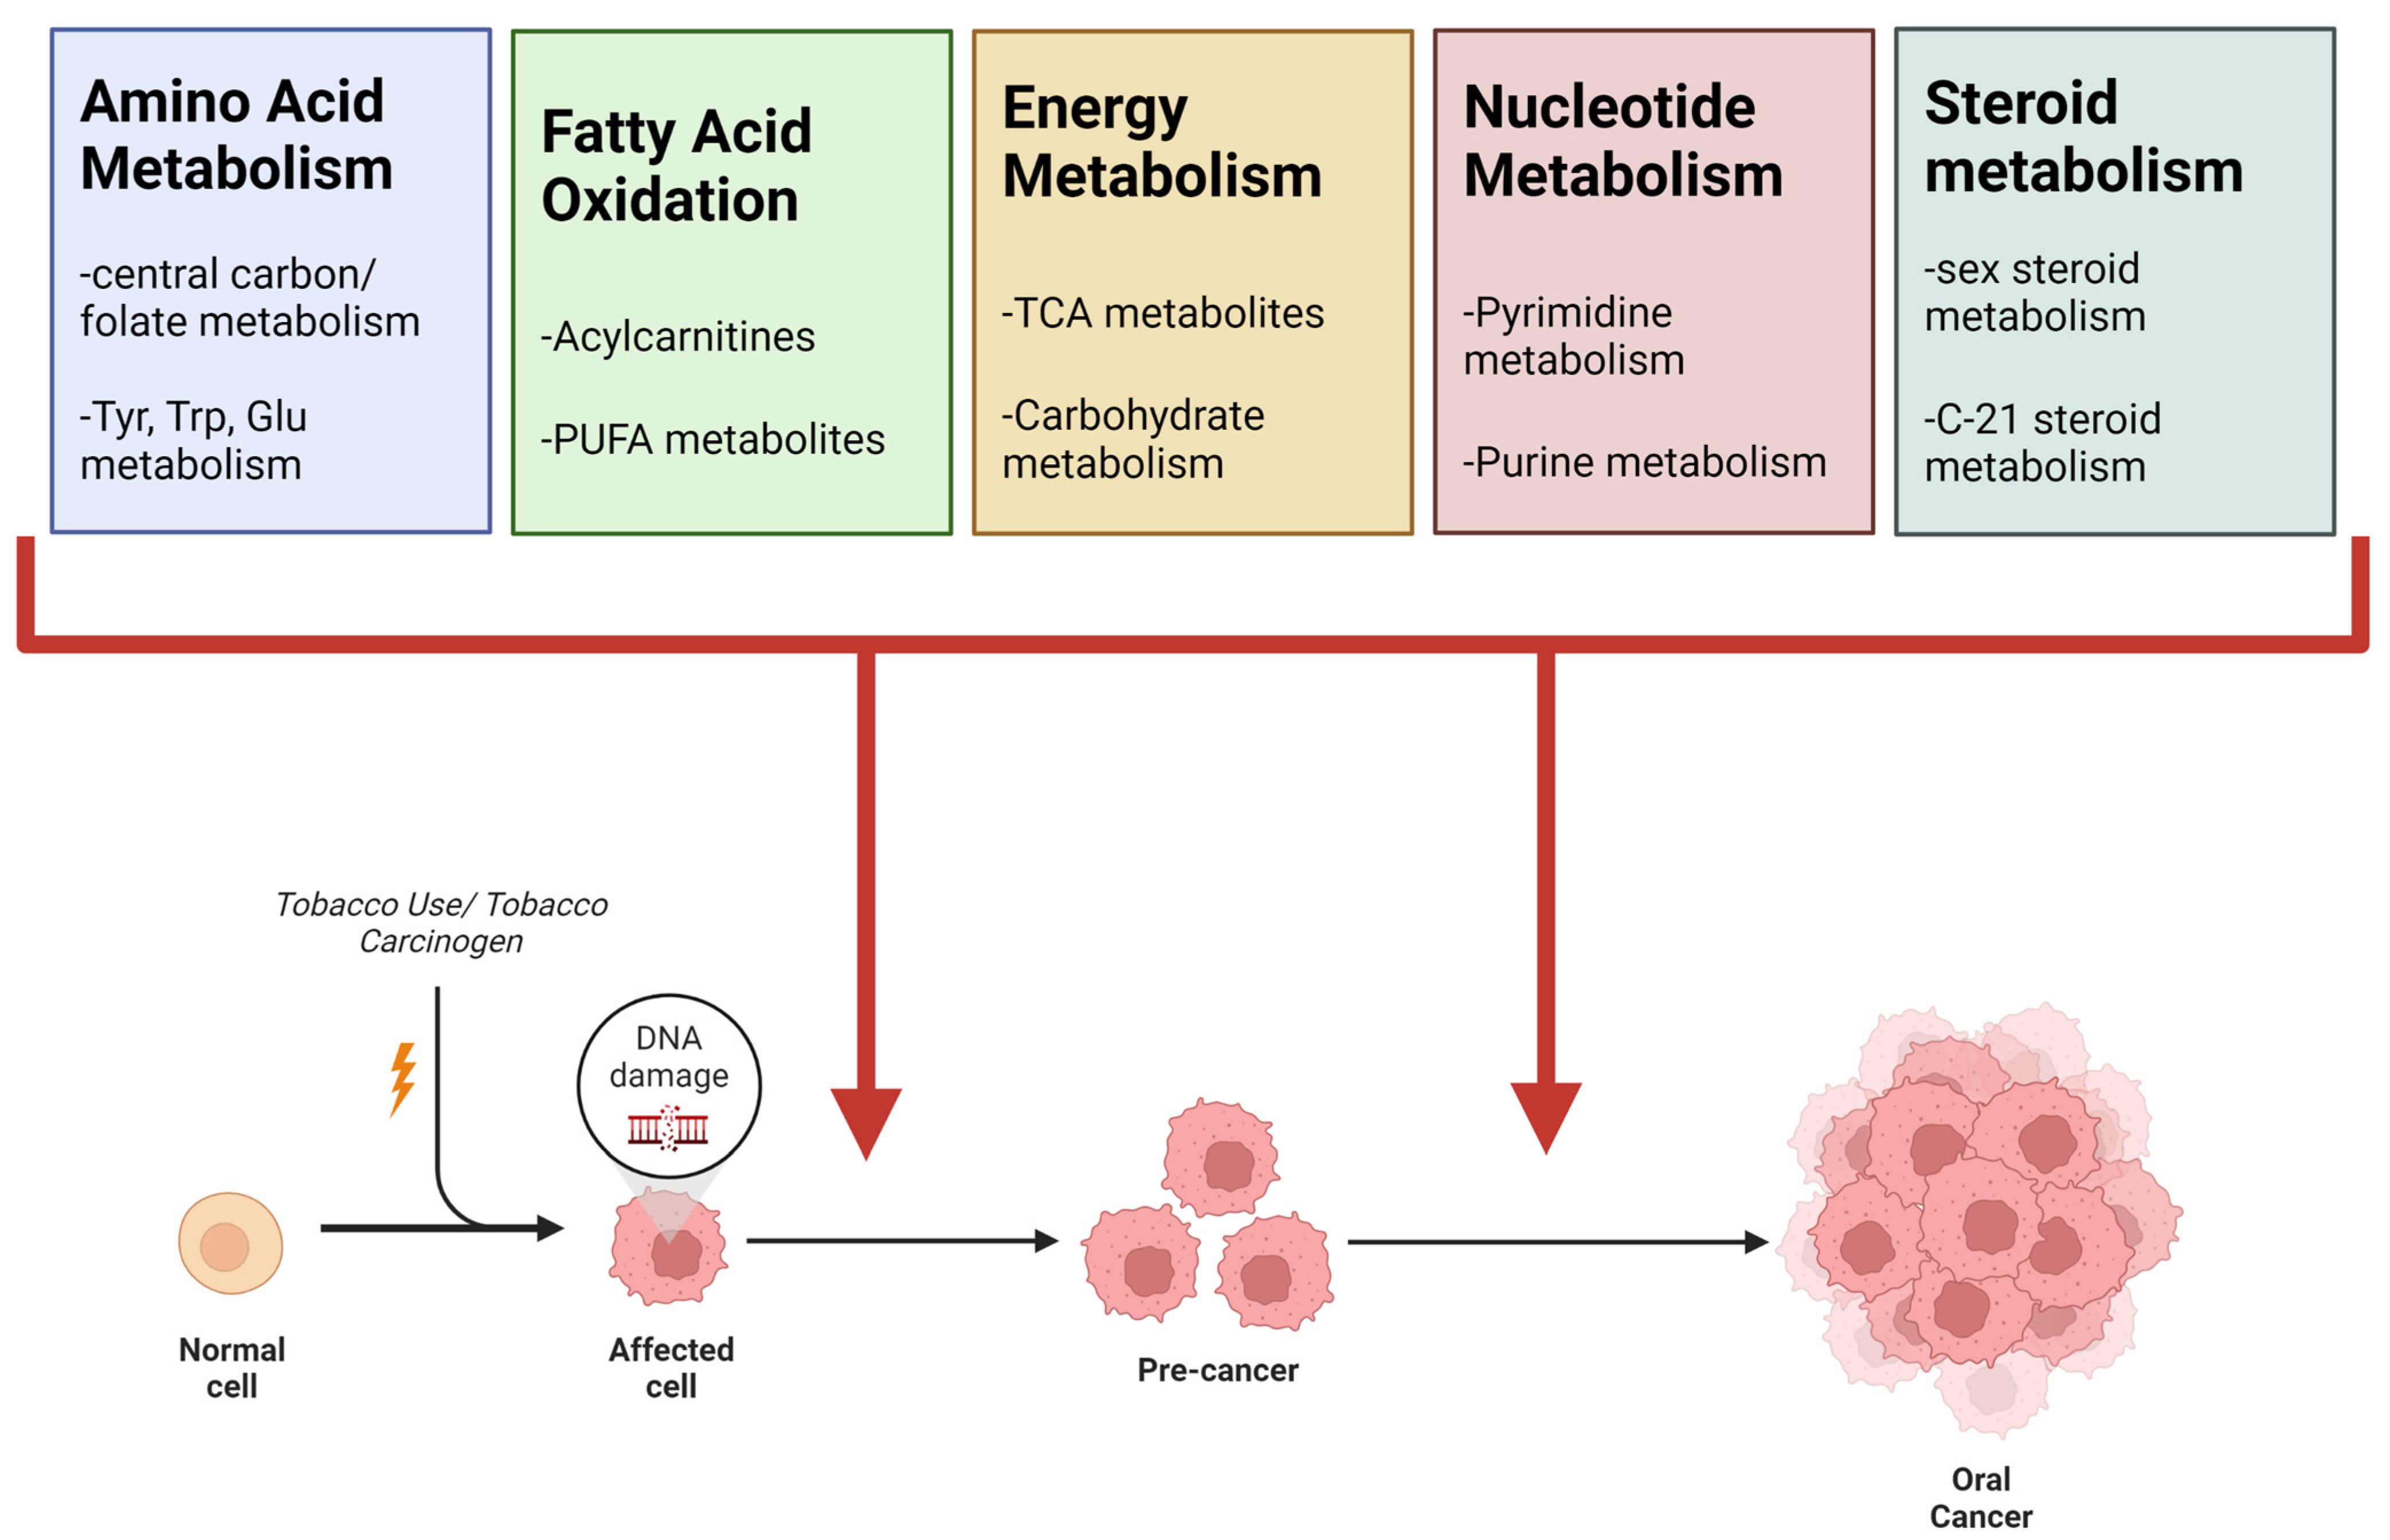
| Pathway Name | Smoking Literature Review | Oral Cancer Literature Review | NIST Smokers vs. Non-Smokers | TMA Malignant vs. Normal | CAL27 NNK vs. Vehicle |
|---|---|---|---|---|---|
| Super-Pathway: Amino Acid Metabolism | X | X | X | X | X |
| Tryptophan metabolism | X | X | |||
| Tyrosine metabolism | X | X | |||
| Glutamate metabolism | X | ||||
| Aspartate and asparagine metabolism | X | ||||
| Methionine and cysteine metabolism | X | X | |||
| Alanine and Aspartate Metabolism | |||||
| Valine, leucine and isoleucine degradation | X | ||||
| Arginine and Proline Metabolism | X | ||||
| Histidine metabolism | X | ||||
| Super-pathway: Carbohydrate Metabolism and Oxidative Phosphorylation | X | X | X | X | X |
| Glycolysis and Gluconeogenesis | X | ||||
| Galactose metabolism | X | ||||
| Sialic acid metabolism | X | ||||
| TCA cycle | X | X | |||
| Pyruvate Metabolism | X | ||||
| Electron transport chain | X | ||||
| Super-pathway: Vitamin Metabolism | X | X | X | X | X |
| Vitamin B9 (folate) metabolism | X | ||||
| Vitamin A (retinol) metabolism | X | ||||
| Vitamin B1 (thiamin) metabolism | X | ||||
| Vitamin K metabolism | X | ||||
| Vitamin B6 (pyridoxine) metabolism | X | ||||
| Super-Pathway: Fatty Acid Metabolism | X | X | X | X | X |
| Carnitine shuttle | X | X | |||
| Fatty acid oxidation | X | X | |||
| De novo fatty acid biosynthesis | X | X | |||
| Fatty acid activation | X | X | |||
| Super-pathway: Polyunsaturated Fatty Acid Metabolism | X | X | X | X | X |
| Linoleate metabolism | X | X | X | ||
| Putative anti-Inflammatory metabolites formation from EPA | X | ||||
| Arachidonic acid metabolism | X | ||||
| Polyunsaturated fatty acid biosynthesis | X | ||||
| Super-pathway: Steroid Metabolism | X | X | X | ||
| Androgen and estrogen biosynthesis and metabolism | X | X | |||
| C21-steroid hormone biosynthesis and metabolism | X | X | |||
| Super-pathway: Nucleotide Metabolism | X | X | X | ||
| Pyrimidine metabolism | X | X | |||
| Purine metabolism | X | ||||
| Pentose and Glucuronate Interconversions | X |
Publisher’s Note: MDPI stays neutral with regard to jurisdictional claims in published maps and institutional affiliations. |
© 2022 by the authors. Licensee MDPI, Basel, Switzerland. This article is an open access article distributed under the terms and conditions of the Creative Commons Attribution (CC BY) license (https://creativecommons.org/licenses/by/4.0/).
Share and Cite
Rushing, B.R.; Tilley, S.; Molina, S.; Schroder, M.; Sumner, S. Commonalities in Metabolic Reprogramming between Tobacco Use and Oral Cancer. Int. J. Environ. Res. Public Health 2022, 19, 10261. https://doi.org/10.3390/ijerph191610261
Rushing BR, Tilley S, Molina S, Schroder M, Sumner S. Commonalities in Metabolic Reprogramming between Tobacco Use and Oral Cancer. International Journal of Environmental Research and Public Health. 2022; 19(16):10261. https://doi.org/10.3390/ijerph191610261
Chicago/Turabian StyleRushing, Blake R., Spencer Tilley, Sabrina Molina, Madison Schroder, and Susan Sumner. 2022. "Commonalities in Metabolic Reprogramming between Tobacco Use and Oral Cancer" International Journal of Environmental Research and Public Health 19, no. 16: 10261. https://doi.org/10.3390/ijerph191610261
APA StyleRushing, B. R., Tilley, S., Molina, S., Schroder, M., & Sumner, S. (2022). Commonalities in Metabolic Reprogramming between Tobacco Use and Oral Cancer. International Journal of Environmental Research and Public Health, 19(16), 10261. https://doi.org/10.3390/ijerph191610261