1. Introduction
Public health emergencies have increased in frequency on a global scale over the past decades. Some of the most renowned emergencies include the SARS outbreak in China in 2003 and the H1N1 flu outbreak that started in the United States in 2009 and spread across 214 countries and regions. In 2013, the H7N9 epidemic caused panic among the public [
1]. The occurrence of these public health emergencies is usually followed by a shortage of specialized hospitals and hospital beds. A recent example of a major public health emergency is the COVID-19 outbreak at the end of 2019, which led to an extreme shortage of emergency medical facilities and imposed a major challenge to the global public health emergency system due to its fast propagation, broad scope of infection, and difficult prevention and control. Therefore, the location-allocation problem (LAP) of emergency facilities has become an important research problem in emergency management. An effective mode of medical rescue after the outbreak of a major public health emergency relies on the timely transportation of medical supplies and workers to the field using modern equipment, such as intelligently extended vehicle-mounted mobile cabin hospitals or folding portable cabin hospitals. Following the COVID-19 outbreak, the Chinese government expedited the construction of over 20 mobile cabin hospitals in Wuhan to control the further spread of the virus. As the virus spread across the globe, other countries, such as Russia, Korea, Italy, Iran, and Germany, started building their own emergency medical facilities. Mobile cabin hospitals have proven very useful in the quarantine, providing facilities for accommodation, testing, and medical treatment of confirmed and suspected COVID-19 cases. Responding to this public health emergency in time can aid in the rapid recovery of infected persons, thus greatly reducing pandemic-related deaths and curbing the spread of the virus. In this case, the making of emergency medical facility location-allocation decisions has received much attention from academia, the government, and society at large.
Introduced by Cooper [
2] in 1963, the concept of LAP has aroused several researches in the context of public health emergencies. Recent theoretical studies on LAP in logistics systems have taken several constraint conditions into account, including waiting time, facility capacity limitations, and service time. Previous studies have further extended LAP into random LAP and multistage LAP and have mainly focused on the various constraint conditions of business logistics systems and the improvement of solving algorithms. However, only few researchers have paid attention to the complexity of public health emergency logistics and the LAP of emergency medical facilities in special scenarios. To fill this gap, this study considers the influence of the number of infected persons in pandemic-stricken areas on the demand for emergency medical facilities. To minimize the total emergency rescue time on the precondition that all patients are treated, the LAP of emergency medical facilities was selected as the research object, an LAP optimization model was built, and the corresponding algorithm was proposed to formulate an emergency medical facility location-allocation optimization scheme for emergency management departments.
As mentioned, the research problem in this study is a generalization of emergency medical facility location-allocation problem (EMFLAP) model, which is an extension of the facility location-allocation problem (FLAP). The objective function of the model is to minimize the total time of relief operations for EMFLAP plans, and the problem involves a location decision for optimally locating emergency medical facilities and an allocation decision to allocate the affected area’s patients to emergency medical facilities, i.e., which emergency medical facilities to open and how to assign the patients to the opened emergency medical facilities. Due to the cases uncertainty in public health emergencies, how to predict the number of affected persons in a disaster-struck area becomes necessary. Therefore, accounting for the uncertainties of model parameters for EMFLAP, the technique of the grey forecasting model is introduced to deal with the issue of forecasting cases associated with each affected area. These problems are one of the most critical strategic decisions for emergency management personnel.
This study offers several contributions to the literature. First, an appropriate forecasting method was adopted to calculate the level of demand for emergency facilities, and an LAP optimization model of emergency medical facilities in the context of public health emergencies was constructed. Second, a serial-number-coded genetic algorithm (SNCGA) was proposed, which not only is capable of naturally solving certain problems and processing complex model constraint conditions but is also convenient for the dynamic variation operation of genetic algorithms (GAs). This process simplifies the calculation of the objective function, reduces the calculation complexity, and verifies the feasibility and validity of algorithms.
The rest of this study is organized as follows.
Section 2 reviews the relevant literature and distinguishes this study from previous works.
Section 3 predictively analyzes the development trend of major public health emergencies in the context of pandemics, builds an LAP model of emergency medical facilities, designs an improved GA according to the model features, and compares the coding performance of this algorithm with that of a simple (standard) genetic algorithm (SGA).
Section 4 improves the SGA, uses the improved GA to solve the emergency medical facility LAP model in Wuhan, China, as a calculation example, and compares these two algorithms in terms of their calculation time and objective function results.
Section 5 concludes the study and proposes directions for future research.
2. State of the Art
Numerous theoretical studies on LAP optimization have been reported. The theoretical discussions on the various types of LAP optimization models and their improved algorithms in business logistics systems have also expanded to include the topic of LAP optimization in emergency logistics systems.
Following the introduction of facility LAP, LAP optimization models and algorithms, mainly including multistage LAP, multi-objective LAP, and random LAP, have been widely studied in business logistics systems research. George et al. [
3] examined the multistage facility LAP and proposed a mixed-integer programming approach and a dynamic programming approach. Ghodratnama et al. [
4] developed a bi-objective new hub location-allocation model for congestion and production scheduling. Hajipour et al. [
5] proposed a multi-objective multi-layer facility location-allocation model with congested facilities using classical queuing systems, a Pareto-based multi-objective meta heuristic approach based on the multi-objective vibration damping optimization, and the multi-objective harmony search algorithm to find and analyze Pareto optimal solutions. Constantine et al. [
6] proposed the emergency facility location problem, which has been extensively studied in succeeding research. Khalili-Damghani et al. [
7] proposed a bi-level two-echelon mathematical model to minimize pre-disaster costs and maximize post-disaster relief coverage areas and to determine the optimal number and location of distribution centers while minimizing the inventory costs of relief supplies. Specific to the emergency logistics system of the U.S. Federal Emergency Management Agency, Afshar et al. [
8] proposed a mathematical model that controls the flow of several relief commodities from different sources through the supply chain and until they were delivered to the recipients. Considering the psychological punishment cost of victims, Hu et al. [
9] developed novel mathematical programs for multi-step evacuation and sheltering with the goal of minimizing monetary costs and psychological penalties.
The above studies have built emergency facility location decision models from different angles and designed the corresponding rescue schemes. Multi-objective optimization models are often used by researchers to improve the efficiency and effectiveness of humanitarian rescue facilities, including refuges, medical centers, warehouses, and distribution centers. Baharmand et al. [
10] proposed a bi-objective multi-layer location-allocation model that could help temporary distribution centers make location-allocation decisions when responding to sudden disasters. Abounacer et al. [
11] solved a three-objective location-transportation problem by determining the number, the position, and the mission of required humanitarian aid distribution centers (HADC) within the disaster-struck region and by dealing with the distribution of aid from HADCs to demand points. They also proposed an epsilon-constraint method for addressing this problem and proved that this solution could generate the exact Pareto front. Barzinpour et al. [
12] developed a new multi-objective mixed-integer linear programming model to solve the emergency facility location problem and the allocation of affected people to local emergency management facilities. Loree et al. [
13] developed a mathematical model that determined the location of distribution points and the allocation of inventories in post-disaster humanitarian logistics. Praneetpholkrang et al. [
14] proposed a multi-objective optimization model for determining the allocation of shelters in response to humanitarian relief logistics and then used the epsilon constraint method and goal programming (GP) to solve this model. Considering factors such as the level of decision making, the utilization efficiency, and capacity constraints of shelters, He et al. [
15] constructed a bi-level multi-objective location-allocation model. Ghasemi et al. [
16] proposed an uncertain multi-objective multi-commodity multi-period multi-vehicle location-allocation mixed-integer mathematical programing model for the response phase of earthquakes and then solved this model by using the modified multiple-objective particle swarm optimization (PSO), non-dominated sorting GA-II, and epsilon constraint method. They found that the multi-objective PSO algorithm was superior to the other solving methods.
An emergency medical facility location-allocation scheme is urgently needed following the declaration of a public health emergency. LAP is an NP-hard problem [
17,
18] that can be effectively solved by heuristic algorithms. The proposed effectiveness means that solutions can be obtained using the heuristic algorithm within a reasonable computational time. The simplex algorithm, widely used weighted-sum (WS) approach, and ∈-constraint (EC) method work well for small-sized instances, but they have difficulty in solving large-sized instances due to the NP-hardness of the studied problem [
19]. Thus, several heuristic algorithms (e.g., ant colony optimization, genetic algorithm, and particle swarm optimization, etc.) have been proposed to solve location allocation problems, each of which has several limitations, such as accuracy, time, and flexibility, besides their advantages. Thus, a large amount of solution approaches for different models have been proposed in the past decades. A series of heuristic algorithms, including hybrid algorithms, have also been developed to solve complicated LAP. For instance, a hybrid method of genetic algorithm and sub-gradient technique is used to solve the problem efficiently [
20]; a hybrid intelligent algorithm that integrates the simplex algorithm, fuzzy simulations, and a genetic algorithm is produced [
21]; and an ant colony optimization (ACO)-based heuristic is developed for solving the model [
22]. Sharma et al. [
23] developed a tool called hybridization or integration of different techniques to locate temporary blood banks during and after a disaster that could serve hospitals in the shortest possible response time and then used the tabu search heuristic method to calculate the optimal number of temporary blood centers while considering the cost components. Given the disaster-induced demands and the available transportation infrastructure in disaster response, Chen et al. [
24] applied integer programming and network-based partitioning to determine temporary locations for on-post emergency medical service facilities and adapted Lagrangian relaxation to extend this problem further to a larger scale. To respond quickly to emergencies, Toro-Díaz et al. [
25] developed a mathematical formulation that combines an integer programming model representing location and dispatching decisions with a hypercube model representing the queuing elements and congestion phenomena and then proposed an optimization framework based on GA. Therefore, using heuristic (intelligent) algorithms (e.g., ant colony optimization, genetic algorithm, and particle swarm optimization, etc.) can effectively solve the problems. To this end, a serial-number-coded genetic algorithm (SNCGA) is designed for solving the problem in the study.
Researchers have solved all kinds of facility LAPs by using heuristic algorithms, such as the tabu search heuristic method, PSO, and GA, etc. However, the calculation efficiency of these algorithms needs improvement. For instance, the standard GA, also known as SGA, has a very long chromosome string length due to the adopted coding scheme. This approach also involves complex calculations and consumes large memory, which are not conducive to reducing the algorithm complexity, processing constraint conditions, executing genetic operations, and reducing the algorithm calculation time. Some researchers have improved GA [
26,
27], but the early-maturing problem of GA has also been addressed inefficiently in previous research.
Major public health emergencies are known for their suddenness, complexity, and destructiveness, all of which introduce huge challenges in rapid emergency response. Emergency medical facility security work serves as the foundation for defeating pandemics, and the basis for this security work lies in an accurate demand forecasting. The demand for emergency medical facilities is positively correlated with the number of infected persons and can be estimated by predicting the number of infected persons after the occurrence of a major public health emergency. The number of infected persons has been forecasted by some researchers using big data and various forecasting models, which provide a reference for making decisions in rescue work. Ginsberg et al. [
28] analyzed large numbers of Google search queries to track influenza-like illnesses in a population and accurately estimate the current level of weekly influenza activity in each region of the U.S. Wu et al. [
29] used a susceptible-exposed-infectious-recovered (SEIR) metapopulation model to predict the cross-infection probability of infectious diseases and used Markov chain Monte Carlo methods to estimate the basic reproductive number. On the basis of the relationship between the spread of viruses and social networks, Nikakhtar et al. [
30] developed a simulation model wherein a virus spreads across a social network, and the infected patients were directed to a healthcare system. However, the validity and reliability of big data (e.g., Google search)-based flu forecasting cannot be easily verified (Lazer et al.) [
31]. Therefore, the evolution trends of public health emergencies have been forecasted by some researchers by using corrected infectious disease transmission dynamics SEIR models. To estimate parameters from the time series data on daily incidence and mortality associated with the Ebola outbreak in the Democratic Republic of Congo in 1995, Lekone et al. [
32] developed a stochastic discrete-time SEIR model for infectious diseases. Boldog et al. [
33] developed a computational tool to assess the risk of COVID-19 outbreaks outside China and then estimated the dependence of the risk of a major outbreak in a country from imported cases on key parameters. To estimate the COVID-19 epidemiology curve, Andelic et al. [
34] utilized the artificial intelligence (AI) method called genetic programming (GP) algorithm to develop a symbolic expression (mathematical equation) that can be used for the estimation of the epidemiology curve for the entire U.S. with high accuracy. While these researchers have used specific models or algorithms to predict the occurrence and development of infectious diseases and to analyze epidemic trends, the timeliness and accuracy of their forecasting methods hardly meet the demand of major public health emergencies.
The above literature review reveals that: (1) the existing studies have built emergency facility location decision models from different angles and designed the corresponding rescue schemes; however, emergency facility location-allocation decisions have been rarely studied; (2) the number of infected persons in public health emergencies has been independently studied, or the emergency facility LAP has been independently explored in previous research; and (3) researchers have solved all kinds of facility LAPs by using heuristic algorithms; however, the calculation efficiency of these algorithms needs improvement. Leknes et al. [
35] presented a new mixed-integer model for this problem that is particularly suitable for regions with heterogeneous demand and multiple performance measures. This model decides the locations/allocation of stations/ambulances and then calculates the service and arrival rates for each station and the probabilities that a call is served by a particular station. However, emergency facility location-allocation decisions have been rarely studied based on emergency facility demand forecasting. Therefore, an appropriate forecasting method was used in this study to predict the number of infected persons and to further calculate the demand for of emergency medical facilities. An emergency medical facility location-allocation optimization model and algorithm were also proposed to improve emergency rescue efficiency.
3. Methodology
3.1. Problem Description and Assumptions
3.1.1. Problem Description
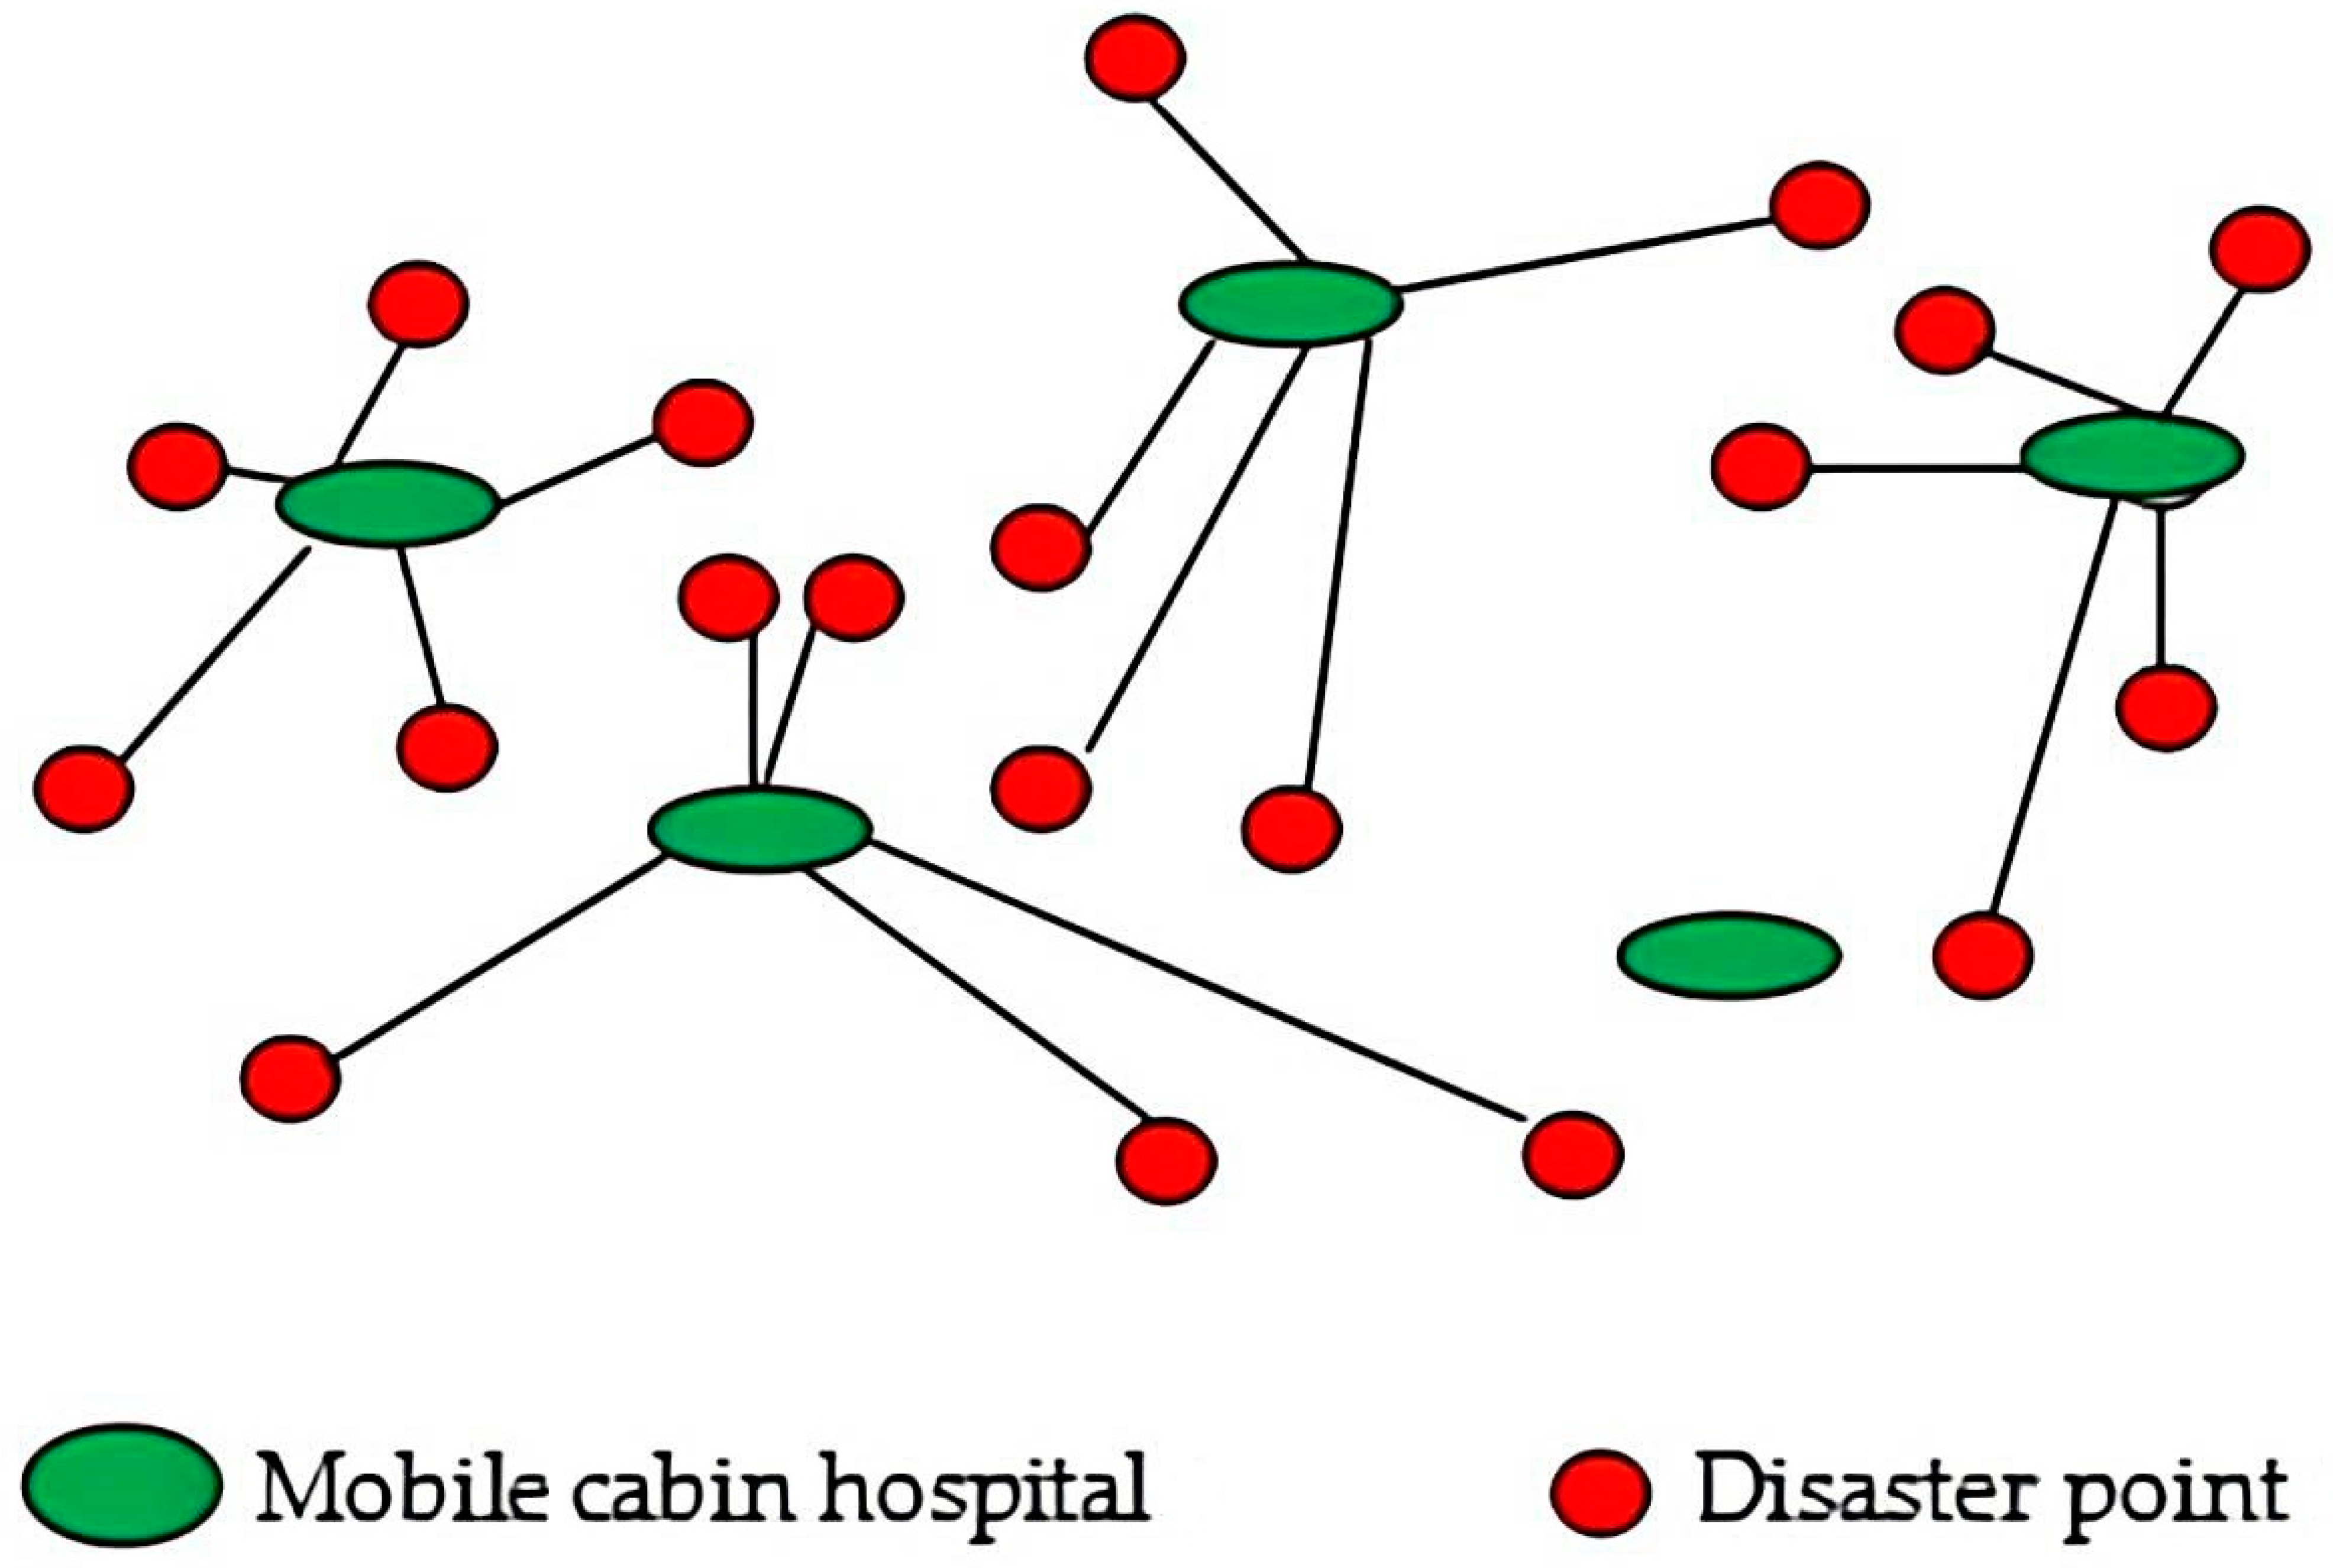
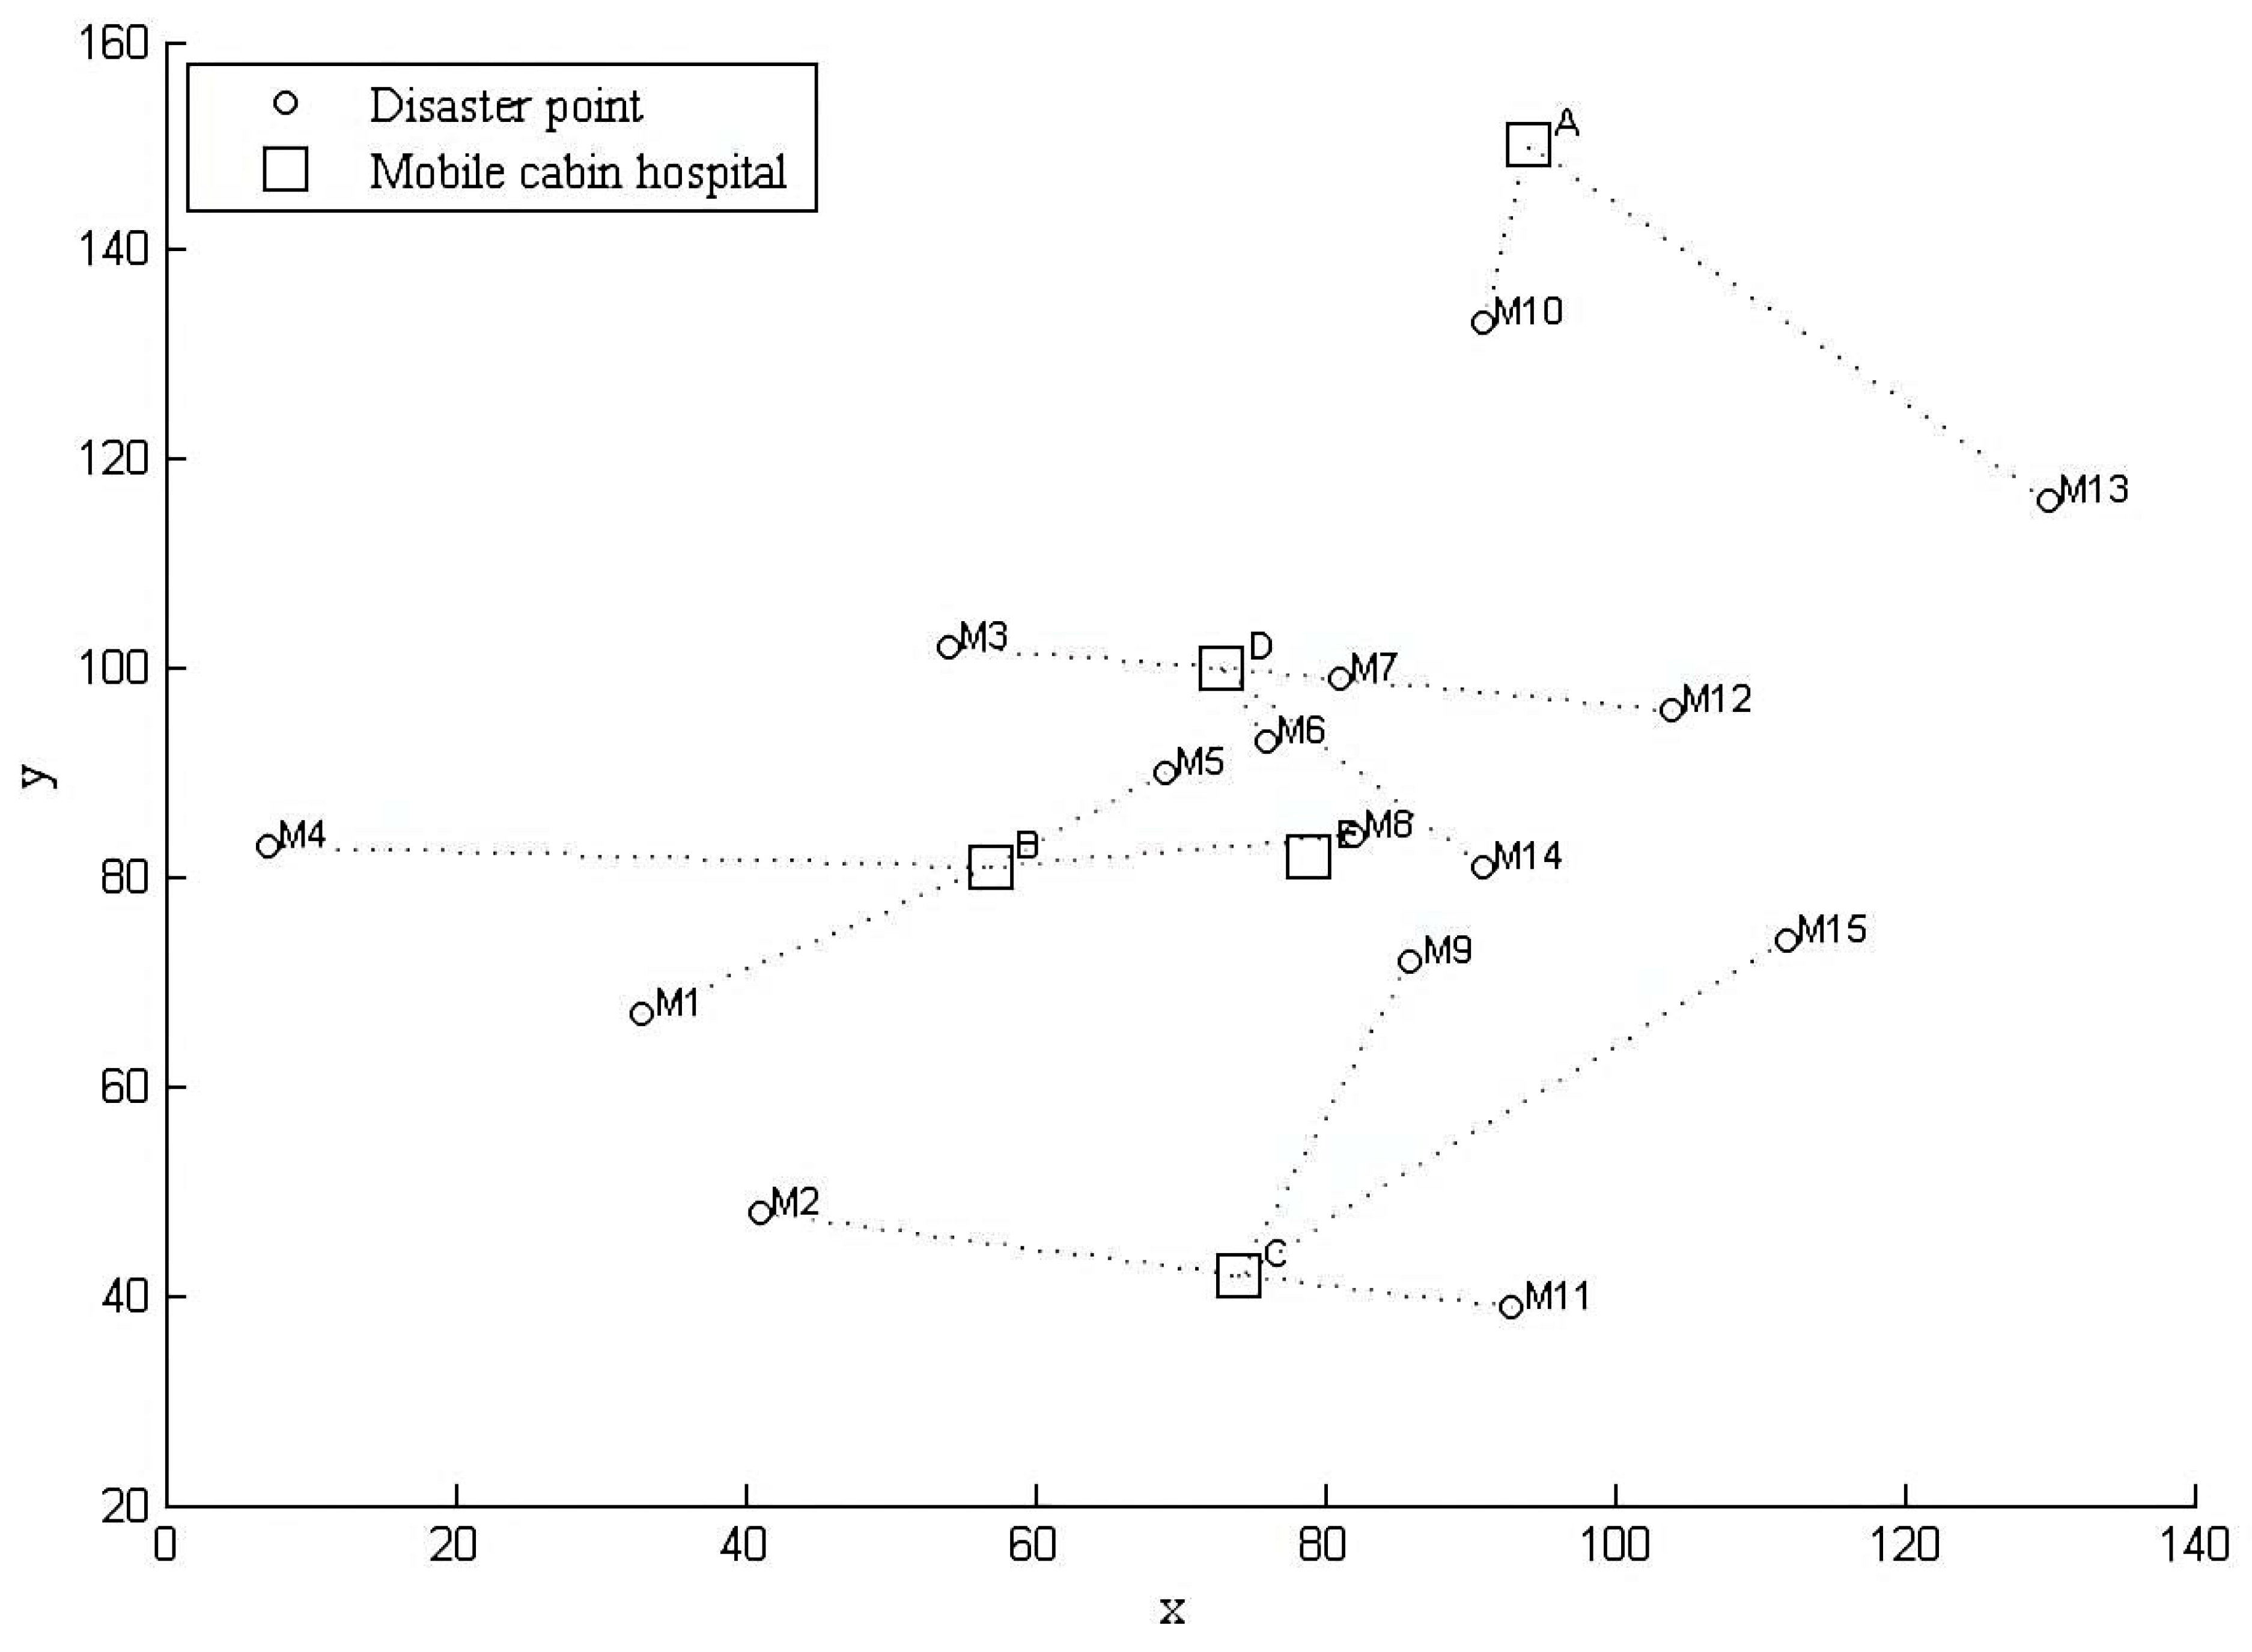
In response to major public health emergencies, temporary emergency medical facilities, such as mobile cabin hospitals, should be built to treat the patients, prevent the spread of diseases, and reduce the associated mortality. An important link in rescue operations during major public health emergency is the selection of an appropriate method for predicting the number of affected persons in disaster-struck areas and for making informed decisions that can guide the design of an emergency medical facility location-allocation scheme. This link directly affects the prevention and control of pandemics.
Figure 1 illustrates the location-allocation network of mobile cabin hospitals.
3.1.2. Assumptions
On the basis of the aforementioned features, the following assumptions were made: (1) each infected patient needs a hospital bed. Therefore, the total number of emergency medical facilities (i.e., mobile cabin hospitals) can be inferred by predicting the number of cases; and (2) according to the current situation, the construction period of newly built and rebuilt mobile cabin hospitals is already known. The definitions of symbols used throughout this study are presented below:
Parameters:
is a set of disaster points;
is a set of potential mobile cabin hospitals;
denotes the time spent in constructing the temporary mobile cabin hospital p;
represents the maximum admission capacity of potential mobile cabin hospital p;
denotes the distance between the affected area m and the potential mobile cabin hospital p, , where and represent the x and y coordinates of node m, respectively;
is the average time spent in transporting each infected patient from a disaster point to a mobile cabin hospital per unit and distance;
denotes the population at disaster point m;
is the number of infected persons at disaster point m, where is the infection rate calculated by dividing the accumulative number of infected persons at a time point by the total population.
Decision variables:
denotes the restored values of the grey forecasting model;
equals 1 if the potential mobile cabin hospital p is selected and equals 0 otherwise;
equals 1 if the affected area m is assigned to the selected mobile cabin hospital p and equals 0 otherwise.
3.2. Grey Model and Tests
The basic principles and modelling mechanism of GM (1, 1) is discussed as follows [
36,
37]:
Step 1. For n (n ≥ 4) samples, the original time sequence, , is given as: , then is called the accumulating generation operator (AGO) sequence of , where , and is called the mean generation of consecutive neighbors sequence of .
Step 2. The first-order grey differential equation can be constructed as follows:
where
a and
b are the development and control coefficients, respectively. These coefficients can be obtained as follows using the least-squares estimation method:
, where
is a sequence of parameters,
and
. The mean sequence generating equation of Equation (1) is called the differential equation, which can be derived as
Step 3. Following the above equation, the grey prediction equation can be described as follows:
where
indicates the prediction of
at time point k and the initial condition,
. The inverse AGO (IAGO) sequence can be obtained as follows:
Although the grey forecasting model can effectively solve the system forecasting problem induced by small amount of information, this model cannot easily predict sequences because the number of infected cases is influenced by all kinds of factors after the occurrence of a public health emergency. Therefore, the following tests should be performed:
Stepwise ratio test: To test the appropriate regularity of a data sequence, let . More values falling between and indicates a better modeling effect; that is, when , the GM (1, 1) modeling effect is the best;
Accuracy test: Let be the absolute error, where . Then, the relative error, mean relative error, mean absolute error, and variance are , , , and , respectively. Let and be the mean value and variance of the original data, respectively. Then, the ratio of the mean square error and small error probability are and , respectively. To test the similarity and proximity of the simulated and original data, let , , and . The relevancy degree is derived as . The model equation shows good forecasting accuracy and can be used in predicting future data when the mean relative error ≤ 0.01, the ratio of mean square error ≤ 0.35, the small error probability ≥ 0.95, and the relevancy degree ≥ 0.90.
3.3. EMFLAP Model and Solution
According to the above definitions, the total number of emergency medical facilities (i.e., mobile cabin hospitals) was inferred via epidemic forecasting through the grey forecasting model (Equation (4)). Emergency medical facility LAP (EMFLAP) optimization models were then constructed as follows:
where objective function (5) indicates the minimum time consumed by an emergency medical facility location-allocation scheme in case of a public health emergency, including the time to construct mobile cabin hospitals and the time spent in transporting the infected patients. Equation (6) indicates that the total number of infected patients allocated from all disaster points to a mobile cabin hospital does not exceed the maximum number of patients that can be accommodated by this hospital. Equations (7) and (8) suggest that once established, each mobile cabin hospital needs to serve disaster points that can only be allocated to already-built mobile cabin hospitals. Equation (9) shows that each disaster point is served and only allocated to one mobile cabin hospital. Equation (10) shows that the number of established mobile cabin hospitals does not exceed the total number of potential hospitals. Equation (11) reveals that the total capacity of built mobile cabin hospitals should meet the demand of newly infected patients. Equation (12) represents a decision variable constraint.
LAP is an NP-hard problem that cannot be easily solved using an accurate algorithm in case this problem has a large scale. However, this problem can be effectively solved using intelligent algorithms. On the basis of the above model features, this study designed SNCGA, which has several obvious advantages over the GAs used by Mokhtarzadeh et al. [
18] and Tang et al. [
19] to solve LAP. The specific steps in algorithm are discussed as follows:
Step 1. Setting of algorithm parameters: Let Po, GP, Maxgen, Pc, and Pm be the number of individuals in the population (population size), generation gap, maximum number of generations, crossover rate, and mutation rate, respectively.
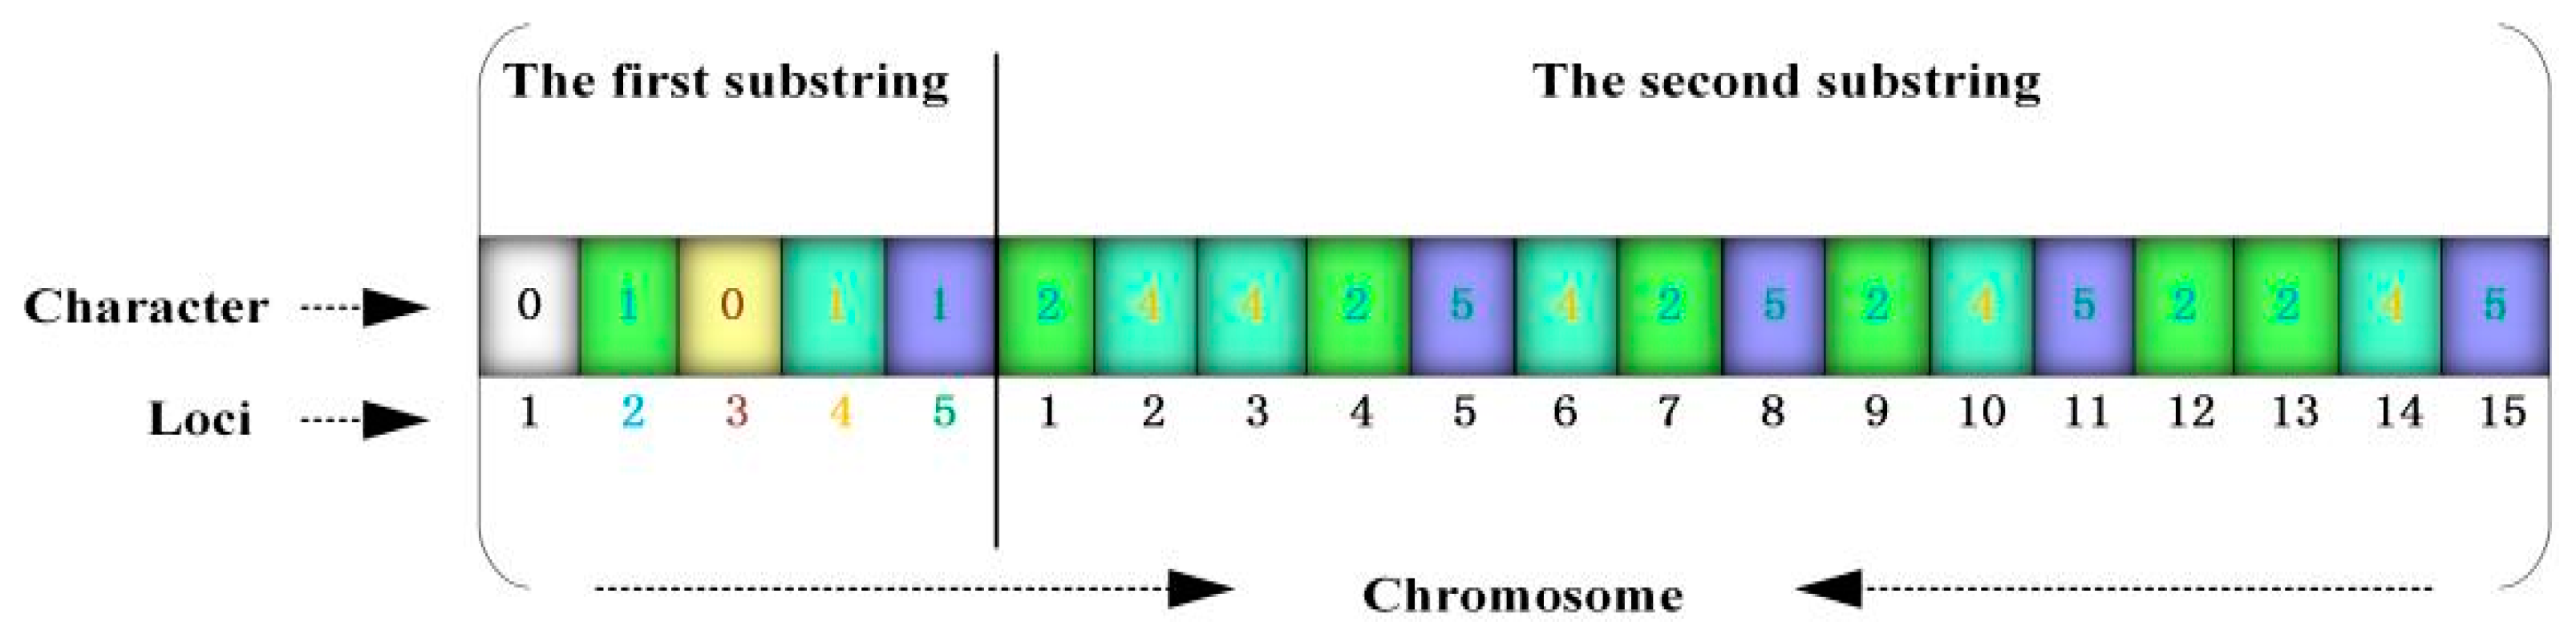
Step 2. Chromosome coding and construction of initial population: SGA is a population-type operating algorithm that is mostly coded using a binary-coded chromosome, where binary symbols 0 and 1 indicate that the facility is not established and is established, respectively. The EMFLAP with M rescue points and P potential emergency medical facilities is coded as
. In this way, the length of every chromosome string is P + M digits and comprises two substrings, where the genic value of the first substring is either 0 or 1 (indicating that the facility is not established or is established) and that of the second substring is the corresponding genic loci when the genic value of the first substring is 1 (indicating the allocation of established emergency medical facilities to the disaster points). The decision parameters are coded accordingly. The coding results under P = 5 and M = 15 are displayed in
Figure 2. The 2nd, 4th, and 5th emergency medical facilities in the substring 1 are then built; the established emergency medical facility 2 in substring 2 is allocated to the 1st, 4th, 7th, 9th, 12th, and 13th disaster points; the established facility 4 is allocated to the 2nd, 3rd, 6th, 10th, and 14th disaster points; and the established facility 5 is allocated to the 5th, 8th, 11th, and 15th disaster points. Although binary coding, which is commonly used by GA, can indicate whether an emergency facility is established, this approach cannot reflect the structural characteristics of the problem to be solved. Therefore, the problem of allocating emergency facilities to disaster points needs to be addressed. The GA search space will sharply increase when this problem has a large scale.
A Po-row and P-column matrix Chrom1 with elements of 0 and 1 is constructed, and a Po-row and M-column random matrix Chrom2 with elements of 1-P is established using the randint function. Chrom = [Chrom1, Chrom2] is then defined as the established initial population.
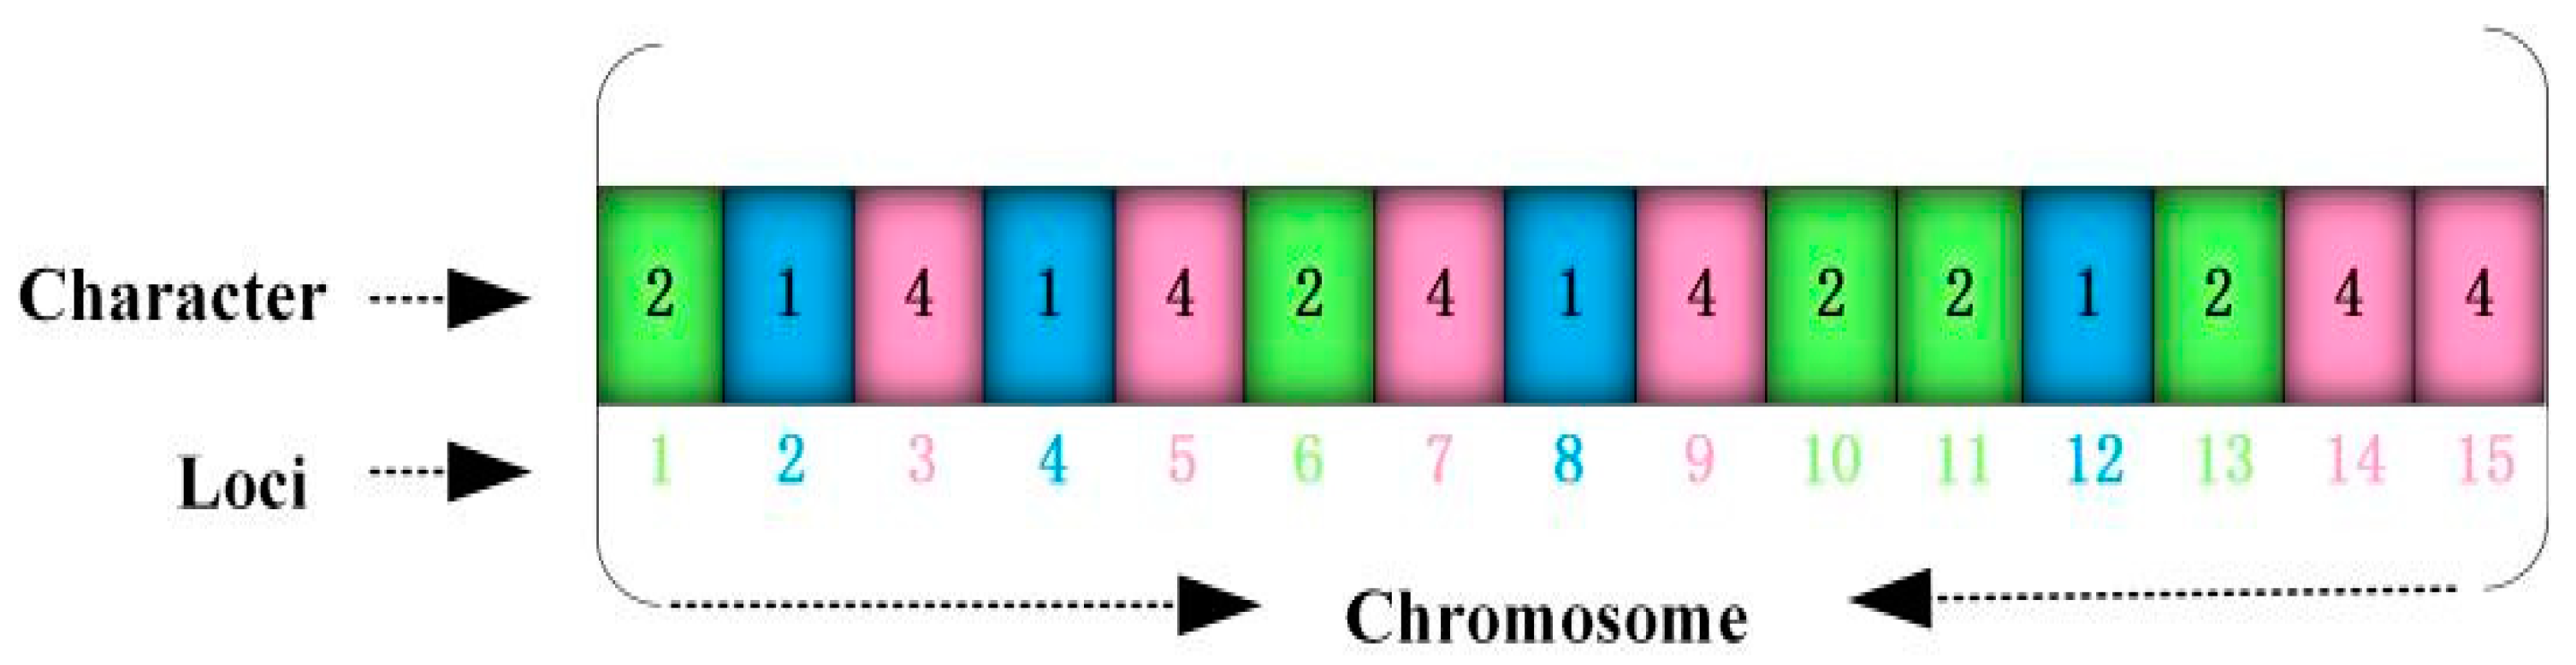
For a specific application problem, how to design a perfect coding scheme is an important research direction of GA. To overcome the deficiency of SGA in binary coding, an improved GA algorithm called SNCGA was proposed to address the LAP of emergency medical facilities in the context of public health emergencies. The strength of SNCGA lies in coding natural numbers and combining them with the serial numbers at the corresponding locations. In other words, the natural number (genic value) of each chromosome (individual) may indicate whether an emergency medical facility has been established. The gene locus corresponding to this genic value is referred to as the serial number of a disaster point. Therefore, the correspondence between the genic value (serial number of an emergency medical facility) and gene locus (serial number of a disaster point) reflects the allocation of established emergency medical facilities to disaster points. Specifically, the EMFLAP with M disaster points and P potential emergency medical facilities can be coded as
, and the length of each chromosome string comprises M digits. The coding results under P = 5 and M = 15 are presented in
Figure 3. The mobile cabin hospital 1 is allocated to the 2nd, 4th, 8th, and 12th disaster points; the mobile cabin hospital 2 is allocated to the 1st, 6th, 10th, 11th, and 13th disaster points; and the mobile cabin hospital 4 is allocated to the 3rd, 5th, 7th, 9th, 14th, and 15th disaster points. Compared with the traditional GA, SNCGA offers the following advantages when solving LAP:
SNCGA can conveniently handle the complex constraint conditions in the model. The union set of string characters represents a set of established mobile cabin hospitals (e.g., hospitals 1, 2, and 4 are established in
Figure 3), and the capacity constraint of mobile cabin hospitals can be conveniently handled using the penalty function method. The string position reflects that all disaster points are allocated to cabin hospitals;
Relative to the binary coding used by SGA to solve LAP, each chromosome string has P + M digits. The proposed serial-number-coding technology GA (SNCGA) only contains M digits, thereby greatly reducing the computation time and space and reducing the algorithm complexity. The efficiency of GA obviously increases along with the problem scale (quantities of P and M).
The Genetic Algorithm Toolbox for MATLAB, which was developed by the University of Sheffield, was used to generate an initial random population. First, the crtbase function was used to build a vector with a length of M and containing M basic characters (0, 1, 2,…, P − 1) with a base number of P. Second, a matrix (Chrom) with a random number of elements (the basic characters are decided by the corresponding vector) was created using the crtbp function plus 1 to ensure that the serial numbers of rows and columns are not equal to 0 during the matrix processing. The initial population (Chrom) was eventually obtained.
Step 3. Calculate fitness: Fitness fi (Chromi (gen)) indicates the fitness of chromosome i of Chrom at the gen. This parameter is obtained by converting the objective function; that is, the fitness function fi = 1/Z (i), Z (i) is the objective functional value of chromosome i.
Step 4. Genetic operations:
Selection operation. Stochastic universal sampling was combined with a fitness-based reinsertion method (an elitist strategy);
Crossover operation. A multi-points crossover operator (a crossover operator with great destruction was used) can help the algorithm search for the solution space. The disruptive nature of multi-point crossover appears to encourage the exploration of the search space rather than favoring the convergence to highly fit individuals early in the search, thus making the search more robust [
38];
Mutation operation. A real-valued mutation was used, and the range of mutation was restricted after adding the field descriptor to ensure that the boundaries of decision variables are not exceeded after the mutation.
Step 5. Termination conditions of the algorithm: When gen ≤ Maxgen, steps 3 and 4 were repeated. The algorithm terminates when gen > Maxgen.


