
Households’ Direct Economic Burden Associated with Chronic Non-Communicable Diseases in Saudi Arabia

 , , , ,
Abstract
1. Introduction
2. Materials and Methods
2.1. Study Design
2.2. Study Population and Sampling Methods
2.3. Data Collection
2.4. Measures and Questionnaire
2.5. The Dependent Variable
2.6. Independent Variables
2.7. Ethics, Consent, and Permissions
2.8. Statistical Analysis
3. Results
4. Discussion
5. Conclusions
Author Contributions
Funding
Institutional Review Board Statement
Informed Consent Statement
Data Availability Statement
Acknowledgments
Conflicts of Interest
References
- Islam, S.M.S.; Purnat, T.D.; Phuong, N.T.A.; Mwingira, U.; Schacht, K.; Fröschl, G. Non Communicable Diseases (NCDs) in developing countries: A symposium report. Glob. Health 2014, 10, 81. [Google Scholar] [CrossRef] [PubMed]
- Tyrovolas, S.; El Bcheraoui, C.; Alghnam, S.A.; Alhabib, K.F.; Almadi, M.A.H.; Al-Raddadi, R.M.; Bedi, N.; El Tantawi, M.; Krish, V.S.; Memish, Z.A.; et al. The burden of disease in Saudi Arabia 1990–2017: Results from the Global Burden of Disease Study 2017. Lancet Planet. Health 2020, 4, e195–e208. [Google Scholar] [CrossRef]
- World Health Organization. Noncommunicable Diseases Progress Monitor 2015. Available online: https://apps.who.int/iris/bitstream/handle/10665/184688/9789241509459_eng.pdf?sequence=1 (accessed on 11 January 2022).
- Rahman, R. The Privatization of Health Care System in Saudi Arabia. Health Serv. Insights 2020, 13, 1178632920934497. [Google Scholar] [CrossRef]
- Essue, B.M.; Laba, T.L.; Knaul, F.; Chu, A.; Minh, H.V.; Nguyen, T.; Jan, S. Economic Burden of Chronic Ill Health and Injuries for Households in Low- and Middle-Income Countries. In Disease Control Priorities: Improving Health and Reducing Poverty, 3rd ed.; The World Bank: Washington, DC, USA, 2017; Volume 9, pp. 121–143. [Google Scholar]
- World Health Organization. United Nations Interagency Task Force on the Prevention and Control of Noncommunicable Diseases. Available online: https://apps.who.int/iris/handle/10665/275090 (accessed on 11 January 2022).
- World Health Organization. Global Health Expenditure Database (GHED). 2017. Available online: https://apps.who.int/nha/database (accessed on 11 January 2022).
- Almutairi, K.M.; Moussa, M. Systematic review of quality of care in Saudi Arabia A forecast of a high quality health care OPEN ACCESS. Saudi Med. J. 2014, 35, 802–809. [Google Scholar]
- Dodd, R.; Palagyi, A.; Guild, L.; Jha, V.; Jan, S. The impact of out-of-pocket costs on treatment commencement and adherence in chronic kidney disease: A systematic review. Health Policy Plan. 2018, 33, 1047–1054. [Google Scholar] [CrossRef]
- Lafata, J.E.; Cerghet, M.; Dobie, E.; Schultz, L.; Tunceli, K.; Reuther, J.; Elias, S. Measuring adherence and persistence to disease-modifying agents among patients with relapsing remitting multiple sclerosis. J. Am. Pharm. Assoc. 2008, 48, 752–757. [Google Scholar] [CrossRef]
- Paez, K.A.; Zhao, L.; Hwang, W. Rising out-of-pocket spending for chronic conditions: A ten-year trend. Health Aff. 2009, 28, 15–25. [Google Scholar] [CrossRef]
- Burney, N.A.; Alenezi, M.; Al-Musallam, N.; Al-Khayat, A. The demand for medical care services: Evidence from Kuwait based on households’ out-of-pocket expenses. Appl. Econ. 2016, 48, 2636–2650. [Google Scholar] [CrossRef]
- Lin, T.Y.; Zhang, X.Y.; Fang, P.Q.; Min, R. Out-of-pocket expenses for myasthenia gravis patients in China: A study on patients insured by basic medical insurance in China, 2013–2015. Orphanet J. Rare Dis. 2020, 15, 13. [Google Scholar] [CrossRef]
- Van Minh, H.; Xuan Tran, B. Assessing the household financial burden associated with the chronic non-communicable diseases in a rural district of Vietnam. Glob. Health Action 2012, 5, 18892. [Google Scholar] [CrossRef] [PubMed][Green Version]
- Huffman, M.D.; Rao, K.D.; Pichon-Riviere, A.; Zhao, D.; Harikrishnan, S.; Ramaiya, K.; Ajay, V.S.; Goenka, S.; Calcagno, J.I.; Caporale, J.E.; et al. A cross-sectional study of the microeconomic impact of cardiovascular disease hospitalization in four low-and middle-income countries. PLoS ONE 2011, 6, e20821. [Google Scholar] [CrossRef]
- Murphy, A.; Palafox, B.; Walli-Attaei, M.; Powell-Jackson, T.; Rangarajan, S.; Alhabib, K.F.; Calik, K.B.; Chifamba, J.; Choudhury, T.; Dagenais, G.; et al. The household economic burden of non-communicable diseases in 18 countries. BMJ Glob. Health 2020, 5, e002040. [Google Scholar] [CrossRef]
- Jan, S.; Laba, T.L.; Essue, B.M.; Gheorghe, A.; Muhunthan, J.; Engelgau, M.; Mahal, A.; Griffiths, U.; McIntyre, D.; Meng, Q.; et al. Action to address the household economic burden of non-communicable diseases. Lancet 2018, 391, 2047–2058. [Google Scholar] [CrossRef]
- Al-Hanawi, M.K.; Mwale, M.L.; Qattan, A.M.N. Health Insurance and Out-Of-Pocket Expenditure on Health and Medicine: Heterogeneities along Income. Front. Pharmacol. 2021, 12, 715. [Google Scholar] [CrossRef]
- General Authority for Statistics. GASTAT Releases Results of Household Health Survey, 2018. Available online: https://www.stats.gov.sa/en/news/326 (accessed on 11 January 2022).
- General Authority for Statistics. Establishments Census 2010. Available online: https://www.stats.gov.sa/en/13 (accessed on 11 January 2022).
- Rose, A.M.C.; Grais, R.F.; Coulombier, D.; Ritter, H. A comparison of cluster and systematic sampling methods for measuring crude mortality. Bull. World Health Organ 2006, 84, 290. [Google Scholar] [CrossRef]
- World Health Organization. The WHO STEPwise Approach to Surveillance of Noncommunicable Diseases (STEPS). Available online: https://www.who.int/ncd_surveillance/en/steps_framework_dec03.pdf (accessed on 11 January 2022).
- Andersen, R.M. Revisiting the behavioral model and access to medical care: Does it matter? J. Health Soc. Behav. 1995, 36, 1–10. [Google Scholar] [CrossRef]
- World Health Organization. Distribution of Health Payments and Catastrophic Expenditures Methodology/by Ke Xu. Available online: https://apps.who.int/iris/handle/10665/69030 (accessed on 11 January 2022).
- Howe, L.D.; Hargreaves, J.R.; Gabrysch, S.; Huttly, S.R.A. Is the wealth index a proxy for consumption expenditure? A systematic review. J. Epidemiol. Community Health 2009, 63, 871–877. [Google Scholar] [CrossRef]
- Gwatkin, D.R.; Rutstein, S.; Johnson, K.; Suliman, E.; Wagstaff, A.; Amouzou, A. Socio-Economic Differences in Health, Nutrition, and Population Within Developing Countries: An Overview. J. Am. Med. Assoc. 2007, 298, 1943–1949. [Google Scholar]
- Alomar, R.S.; Parslow, R.C.; Law, G.R. Development of two socioeconomic indices for Saudi Arabia. BMC Public Health 2018, 18, 791. [Google Scholar] [CrossRef]
- Chua, K.P.; Lee, J.M.; Conti, R.M. Out-of-Pocket Spending for Insulin, Diabetes-Related Supplies, and Other Health Care Services Among Privately Insured US Patients With Type 1 Diabetes. JAMA Intern. Med. 2020, 180, 1012–1014. [Google Scholar] [CrossRef]
- Datta, B.K.; Husain, M.J.; Asma, S. Assessing the relationship between out-of-pocket spending on blood pressure and diabetes medication and household catastrophic health expenditure: Evidence from Pakistan. Int. J. Equity Health. 2019, 18, 9. [Google Scholar] [CrossRef]
- Fox, K.M.; Grandy, S. Out-of-pocket expenses and healthcare resource utilization among individuals with or at risk of diabetes mellitus. Curr. Med. Res. Opin. 2008, 24, 3323–3329. [Google Scholar] [CrossRef]
- Shumet, Y.; Mohammed, S.A.; Kahissay, M.H.; Demeke, B. Catastrophic health expenditure among chronic patients attending dessie referral hospital, Northeast Ethiopia. Clin. Outcomes Res. 2021, 13, 99–107. [Google Scholar] [CrossRef] [PubMed]
- Pallegedara, A. Impacts of chronic non-communicable diseases on households’ out-of-pocket healthcare expenditures in Sri Lanka. Int. J. Health Econ. Manag. 2018, 18, 301–319. [Google Scholar] [CrossRef] [PubMed]
- Wallace, E.; Salisbury, C.; Guthrie, B.; Lewis, C.; Fahey, T.; Smith, S.M. Managing patients with multimorbidity in primary care. Br. Med. J. 2015, 350, h176. [Google Scholar] [CrossRef] [PubMed]
- Hong, G.S.; Kim, S.Y. Out-of-Pocket Health Care Expenditure Patterns and Financial Burden across the Life Cycle Stages. J. Consum. Aff. 2000, 34, 291–313. [Google Scholar] [CrossRef]
- You, X.; Kobayashi, Y. Determinants of out-of-pocket health expenditure in China: Analysis using China Health and Nutrition Survey data. Appl. Health Econ. Health Policy 2011, 9, 39–50. [Google Scholar] [CrossRef]
- Li, Y.; Wu, Q.; Xu, L.; Legge, D.; Hao, Y.; Gao, L.; Ning, N.; Wan, G. Factors affecting catastrophic health expenditure and impoverishment from medical expenses in China: Policy implications of universal health insurance. Bull. World Health Organ. 2012, 90, 664–671. [Google Scholar] [CrossRef]
- Yardim, M.S.; Cilingiroglu, N.; Yardim, N. Catastrophic health expenditure and impoverishment in Turkey. Health Policy 2010, 94, 26–33. [Google Scholar] [CrossRef]
- Arsenijevic, J.; Pavlova, M.; Groot, W. Measuring the catastrophic and impoverishing effect of household health care spending in Serbia. Soc. Sci. Med. 2013, 78, 17–25. [Google Scholar] [CrossRef]
- Li, X.; Shen, J.J.; Lu, J.; Wang, Y.; Sun, M.; Li, C.; Chang, F.; Hao, M. Household catastrophic medical expenses in eastern China: Determinants and policy implications. BMC Health Serv. Res. 2013, 13, 506. [Google Scholar] [CrossRef]
- Gotsadze, G.; Zoidze, A.; Rukhadze, N. Household catastrophic health expenditure: Evidence from georgia and its policy implications. BMC Health Serv. Res. 2009, 9, 69. [Google Scholar] [CrossRef]
- Liu, H.; Zhu, H.; Wang, J.; Qi, X.; Zhao, M.; Shan, L.; Gao, L.; Kang, Z.; Jiao, M.; Pan, L.; et al. Catastrophic health expenditure incidence and its equity in China: A study on the initial implementation of the medical insurance integration system. BMC Public Health 2019, 19, 1761. [Google Scholar] [CrossRef]
- Makinen, M.; Waters, H.; Rauch, M.; Almagambetova, N.; Bitran, R.; Gilson, L.; Mcintyre, D.; Pannarunothai, S.; Prieto, A.L.; Ubilla, G.; et al. Inequalities in health care use and expenditures: Empirical data from eight developing countries and countries in transition. Bull. World Health Organ. 2000, 78, 55–65. [Google Scholar]
- Kawabata, K.; Xu, K.; Carrin, G. Preventing impoverishment through protection against catastrophic health expenditure. Bull. World Health Organ. 2002, 80, 612. [Google Scholar]
- Bajari, P.; Dalton, C.; Hong, H.; Khwaja, A. Moral hazard, adverse selection, and health expenditures: A semiparametric analysis. RAND J. Econ. 2014, 45, 747–763. [Google Scholar] [CrossRef]
- Deressa, W.; Hailemariam, D.; Ali, A. Economic costs of epidemic malaria to households in rural Ethiopia. Trop. Med. Int. Health 2007, 12, 1148–1156. [Google Scholar] [CrossRef]
- Lambrew, J.M.; Defriese, G.H.; Carey, T.S.; Ricketts, T.C.; Biddle, A.K. The effects of having a regular doctor on access to primary care. Med. Care 1996, 34, 138–151. [Google Scholar] [CrossRef]
- Dallmeyer, S.; Wicker, P.; Breuer, C. The relationship between physical activity and out-of-pocket health care costs of the elderly in Europe. Eur. J. Public Health 2020, 30, 628–632. [Google Scholar] [CrossRef]
- Anong, S.T.; Ajongwen, P.; Chandwani, S. Chronic Conditions, Medical Out-of-Pocket Expenditure Burden, and Perceived Health. Fam. Consum. Sci. Res. J. 2016, 45, 150–165. [Google Scholar] [CrossRef]
- Moynihan, R.; Sanders, S.; Michaleff, Z.A.; Scott, A.M.; Clark, J.; To, E.J.; Jones, M.; Kitchener, E.; Fox, M.; Johansson, M.; et al. Impact of COVID-19 pandemic on utilisation of healthcare services: A systematic review. BMJ Open 2021, 11, e045343. [Google Scholar] [CrossRef]
- Vision 2030. National Transformation Program. Available online: https://www.vision2030.gov.sa/v2030/vrps/ntp/ (accessed on 11 January 2022).
- Almalki, Z.S.; Alotaibi, A.A.; Alzaidi, W.S.; Alghamdi, A.A.; Bahowirth, A.M.; Alsalamah, N.M. Economic benefits of implementing patient-centered medical home among patients with hypertension. Clin. Outcomes Res. 2018, 10, 665–673. [Google Scholar] [CrossRef]
- Almalki, Z.S.; Karami, N.A.; Almsoudi, I.A.; Alhasoun, R.K.; Mahdi, A.T.; Alabsi, E.A.; Alshahrani, S.M.; Alkhdhran, N.D.; Alotaib, T.M. Patient-centered medical home care access among adults with chronic conditions: National Estimates from the medical expenditure panel survey 11 Medical and Health Sciences 1117 Public Health and Health Services. BMC Health Serv. Res. 2018, 18, 744. [Google Scholar]


| Characteristics | N | Percentage (%) |
|---|---|---|
| Predisposing | ||
| Gender | ||
| Female | 189 | 24.51 |
| Male | 582 | 75.49 |
| Age group, year | ||
| ≤29 | 321 | 27.3 |
| 30–39 | 209 | 27.11 |
| 40–49 | 158 | 20.49 |
| 50–59 | 160 | 20.75 |
| ≥60 | 136 | 17.64 |
| Marital status | ||
| Not married | 138 | 17.9 |
| Married | 633 | 82.1 |
| Living condition | ||
| Alone | 63 | 8.17 |
| With family | 708 | 91.83 |
| Educational status | ||
| Illiterate/read/write | 116 | 15.05 |
| School degree | 334 | 43.32 |
| Higher education | 321 | 41.63 |
| Number of family members in the household | ||
| ≤3 | 254 | 32.94 |
| 4–6 | 342 | 44.36 |
| ≥7 | 175 | 22.7 |
| Presence of at least one member less than 14 years in the household | ||
| No | 364 | 47.21 |
| Yes | 407 | 52.79 |
| Enabling | ||
| Residential area | ||
| Rural | 173 | 22.44 |
| Urban | 598 | 77.56 |
| Household head employment status | ||
| Unemployed | 350 | 45.4 |
| Employed | 421 | 54.6 |
| SES index | ||
| 0–20% Poorest | 102 | 13.23 |
| 20–40% Poor | 219 | 28.4 |
| 40–60% Middle | 184 | 23.87 |
| 60–80% Wealthy | 153 | 19.84 |
| 80–100% Most wealthy | 113 | 14.66 |
| Health Insurance | ||
| No | 648 | 56.84 |
| Yes | 492 | 43.16 |
| Having a regular doctor | ||
| No | 413 | 53.57 |
| Yes | 358 | 46.43 |
| Need-based | ||
| Level of physical activity | ||
| Active | 292 | 37.87 |
| Moderately active | 272 | 35.28 |
| Inactive | 207 | 26.85 |
| Presence of at least one member with a disability | ||
| No | 563 | 75.37 |
| Yes | 184 | 24.63 |
| NCDs | ||
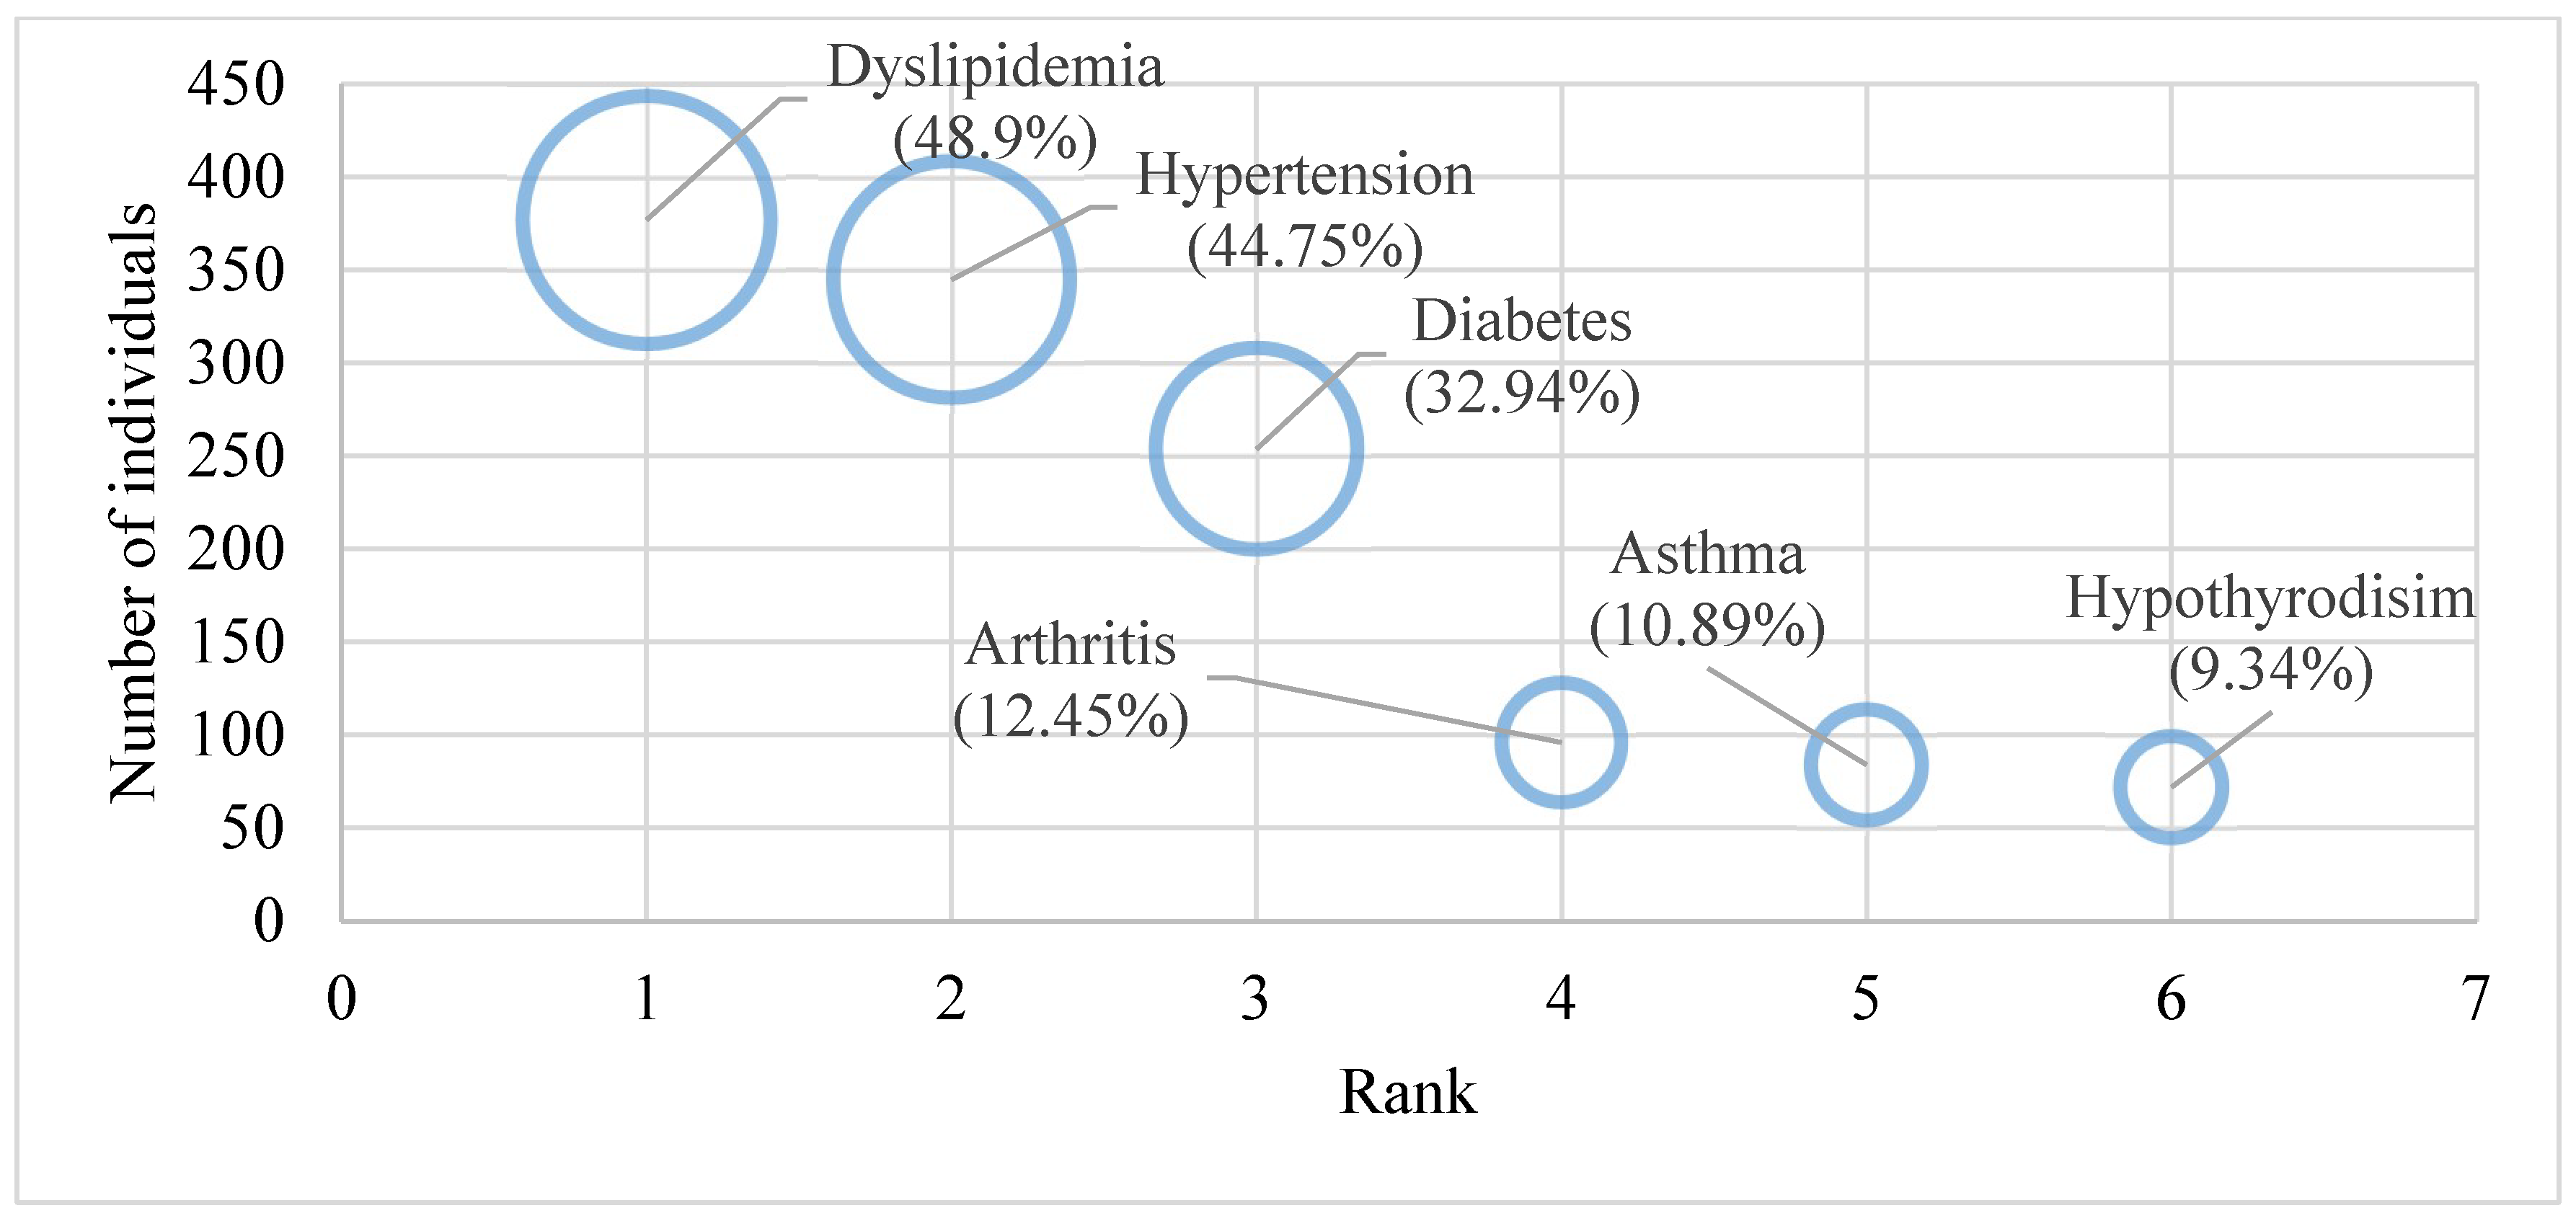
| Hypertension | 345 | 44.75 |
| Diabetes | 254 | 32.94 |
| Asthma | 84 | 10.89 |
| Dyslipidemia | 377 | 48.9 |
| Hypothyroidism | 72 | 9.34 |
| Arthritis | 96 | 12.45 |
| Health in the last two months before the interview | ||
| Very Poor | 117 | 15.18 |
| Poor | 178 | 23.09 |
| Average | 168 | 21.79 |
| Good | 119 | 15.43 |
| Very Good | 189 | 24.51 |
| Independent Variable | Hypertension | Diabetes | Dyslipidemia | Asthma | Hypothyroidism | Arthritis |
|---|---|---|---|---|---|---|
| Adjusted β-Coefficient (SE) | ||||||
| Gender (reference category: Female) | ||||||
| Male | 0.209 (0.073) * | 0.099 (0.101) | 0.385 (0.075) * | −0.371 (0.143) * | −0.0786 (0.232) | 0.481 (0.192) * |
| Age group, year (reference category: ≤29) | ||||||
| 30–39 | −0.166 (0.098) | 0.045 (0.142) | 0.149 (0.211) | −0.356 (0.224) | 0.368 (0.339) | 0.313 (0.327) |
| 40–49 | 0.091 (0.103) | 0.106 (0.126) | 0.199 (0.107) * | −0.071 (0.213) | 0.156 (0.317) | 0.001 (0.274) |
| 50–59 | 0.095 (0.090) * | 0.311 (0.121) * | 0.072 (0.101) | 0.114 (0.203) | 0.035 (0.277) | 0.193 (0.056) * |
| ≥60 | 0.088 (0.056) ** | 0.457 (0.144) *** | 0.113 (0.103) * | 0.159 (0.337) | −0.041 (0.331) | 0.478 (0.312) * |
| Marital Status (reference category: Not married) | ||||||
| Married | 0.184 (0.086) | 0.252 (0.117) | 0.187 (0.093) | 0.143 (0.122) | −0.315 (0.323) | −0.087 (0.224) |
| Living condition (reference category: Alone) | ||||||
| With family | 0.258 (0.305) | 0.011 (0.124) | 0.196 (0.211) | 0.093 (0.101) | 0.147 (0.251) | 0.109 (0.293) |
| Educational status (reference category: Illiterate/read/write) | ||||||
| School degree | 0.256 (0.085) * | 0.267 (0.118) * | 0.122 (0.094) * | 0.014 (0.165) | 0.114 (0.281) | 0.108 (0.226) |
| Higher education | 0.278 (0.096) *** | 0.707 (0.126) ** | 0.588 (0.095) *** | 0.427 (0.178) ** | 0.257 (0.295) | 0.177 (0.236) |
| Number of family members in the household (reference category: ≤3) | ||||||
| 4–6 | 0.055 (0.110) | 0.251 (0.128) * | 0.337 (0.101) * | 0.384 (0.227) * | 0.297 (0.336) | 0.375 (0.226) * |
| ≥7 | 0.215 (0.115) ** | 0.431 (0.131) *** | 0.494 (0.106) ** | 0.089 (0.241) | 0.299 (0.364) | 0.128 (0.244) |
| At least one member less than 14 years in the household (reference category: No) | ||||||
| Yes | 0.222 (0.064) *** | 0.197 (0.094) ** | 0.253 (0.371) | 0.406 (0.131) * | 0.056 (0.241) | 0.147 (0.183) |
| Residential area (reference category: Rural) | ||||||
| Urban | 0.301 (0.061) *** | 0.193 (0.082) ** | 0.147 (0.067) ** | 0.046 (0.123) | 0.387 (0.221) * | 0.254 (0.166) * |
| Household head employment status (reference category: Unemployed) | ||||||
| Employed | 0.116 (0.085) ** | 0.171 (0.114) * | 0.052 (0.087) | −0.147 (0.154) | 0.211 (0.284) | −0.026 (0.212) |
| The household SES index (reference category: Q1 (Poorest) (lowest 20%) | ||||||
| Q2 (Poor) | −0.023 (0.084) | 0.115 (0.108) * | −0.041 (0.095) | −0.151 (0.175) | 0.388 (0.381) * | 0.203 (0.234) |
| Q3 (Middle) | 0.184 (0.099) * | 0.174 (0.138) * | 0.079 (0.107) | 0.236 (0.211) * | 0.206 (0.378) | 0.124 (0.296) |
| Q4 (Wealthy) | 0.099 (0.197) | 0.127 (0.112) ** | 0.164 (0.105) * | 0.444 (0.201) ** | 0.591 (0.315) ** | 0.502 (0.274) ** |
| Q5 (Wealthiest) (higher 20%) | 0.198 (0.106) ** | 0.244 (0.156) ** | 0.193 (0.117) ** | 0.237 (0.212) * | 0.395 (0.455) | 0.364 (0.289) ** |
| Health Insurance (reference category: No) | ||||||
| Yes | 0.201 (0.061) *** | 0.141 (0.091) ** | 0.066 (0.166) | −0.102 (0.128) | 0.114 (0.115) | 0.128 (0.137) * |
| Having a regular doctor (reference category: No) | ||||||
| Yes | −0.194 (0.074) ** | −0.117 (0.112) * | −0.178 (0.081) ** | −0.221 (0.163) * | −0.041 (0.156) | −0.058 (0.081) * |
| Level of physical activity (reference category: Active) | ||||||
| Moderately active | −0.019 (0.076) | 0.024 (0.111) | 0.111 (0.087) | 0.261 (0.174) * | 0.438 (0.291) * | −0.181 (0.202) |
| Inactive | 0.094 (0.085) * | 0.222 (0.127) * | 0.171 (0.093) * | 0.062 (0.189) | 0.309 (0.323) | 0.343 (0.221) * |
| At least one member with a disability in the household (reference category: No) | ||||||
| Yes | 0.148 (0.163) | 0.156 (0.141) | 0.081 (0.071) | 0.152 (0.134) | 0.234 (0.224) | 0.133 (0.141) |
| Health in the last two months before the interview (reference category: very good) | ||||||
| Very Poor | 0.218 (0.088) *** | 0.233 (0.139) ** | 0.231 (0.097) *** | 0.244 (0.041) *** | 0.476 (0.301) * | 0.101 (0.056) *** |
| Poor | 0.199 (0.086) ** | 0.291 (0.138) * | 0.332 (0.099) *** | 0.246 (0.231) | 0.338 (0.116) ** | 0.545 (0.205) *** |
| Average | 0.041 (0.096) | 0.089 (0.131) | 0.237 (0.101) | 0.079 (0.243) | 0.389 (0.325) * | 0.429 (0.205) * |
| Good | 0.124 (0.183) | 0.102 (0.129) | 0.141 (0.197) | −0.155 (0.216) | 0.378 (0.545) | 0.511 (0.247) * |
Publisher’s Note: MDPI stays neutral with regard to jurisdictional claims in published maps and institutional affiliations. |
© 2022 by the authors. Licensee MDPI, Basel, Switzerland. This article is an open access article distributed under the terms and conditions of the Creative Commons Attribution (CC BY) license (https://creativecommons.org/licenses/by/4.0/).
Share and Cite
Almalki, Z.S.; Alahmari, A.K.; Alqahtani, N.; Alzarea, A.I.; Alshehri, A.M.; Alruwaybiah, A.M.; Alanazi, B.A.; Alqahtani, A.M.; Ahmed, N.J. Households’ Direct Economic Burden Associated with Chronic Non-Communicable Diseases in Saudi Arabia. Int. J. Environ. Res. Public Health 2022, 19, 9736. https://doi.org/10.3390/ijerph19159736
Almalki ZS, Alahmari AK, Alqahtani N, Alzarea AI, Alshehri AM, Alruwaybiah AM, Alanazi BA, Alqahtani AM, Ahmed NJ. Households’ Direct Economic Burden Associated with Chronic Non-Communicable Diseases in Saudi Arabia. International Journal of Environmental Research and Public Health. 2022; 19(15):9736. https://doi.org/10.3390/ijerph19159736
Chicago/Turabian StyleAlmalki, Ziyad S., Abdullah K. Alahmari, Nasser Alqahtani, Abdulaziz Ibrahim Alzarea, Ahmed M. Alshehri, Abdulrahman M. Alruwaybiah, Bader A. Alanazi, Abdulhadi M. Alqahtani, and Nehad J. Ahmed. 2022. "Households’ Direct Economic Burden Associated with Chronic Non-Communicable Diseases in Saudi Arabia" International Journal of Environmental Research and Public Health 19, no. 15: 9736. https://doi.org/10.3390/ijerph19159736
APA StyleAlmalki, Z. S., Alahmari, A. K., Alqahtani, N., Alzarea, A. I., Alshehri, A. M., Alruwaybiah, A. M., Alanazi, B. A., Alqahtani, A. M., & Ahmed, N. J. (2022). Households’ Direct Economic Burden Associated with Chronic Non-Communicable Diseases in Saudi Arabia. International Journal of Environmental Research and Public Health, 19(15), 9736. https://doi.org/10.3390/ijerph19159736