
Diagnostic Accuracy of Pulp Vitality Tests and Pulp Sensibility Tests for Assessing Pulpal Health in Permanent Teeth: A Systematic Review and Meta-Analysis

 ,
,  , , ,
, , ,  ,
,  ,
,  ,
, 
Abstract
:1. Introduction
2. Materials and Methods
2.1. Protocol and Registration
2.2. Search Strategy
2.3. Inclusion Criteria Outline According to the PICOS Strategy
2.4. Exclusion Criteria
- Articles published in non-English language.
- Nonclinical studies, in vitro studies and animal studies.
- Studies reporting about a single intervention without a comparison group.
- Studies on deciduous teeth.
- Studies not fully available in the database.
- Article reporting only abstracts, of which full text articles were not available.
- Studies not reporting primary outcomes of accuracy, sensitivity and specificity as well as where primary outcomes are not possible to calculate from the given raw data.
- Case reports, case series, reviews and in-studies.
2.5. Screening Process
2.6. Data Extraction
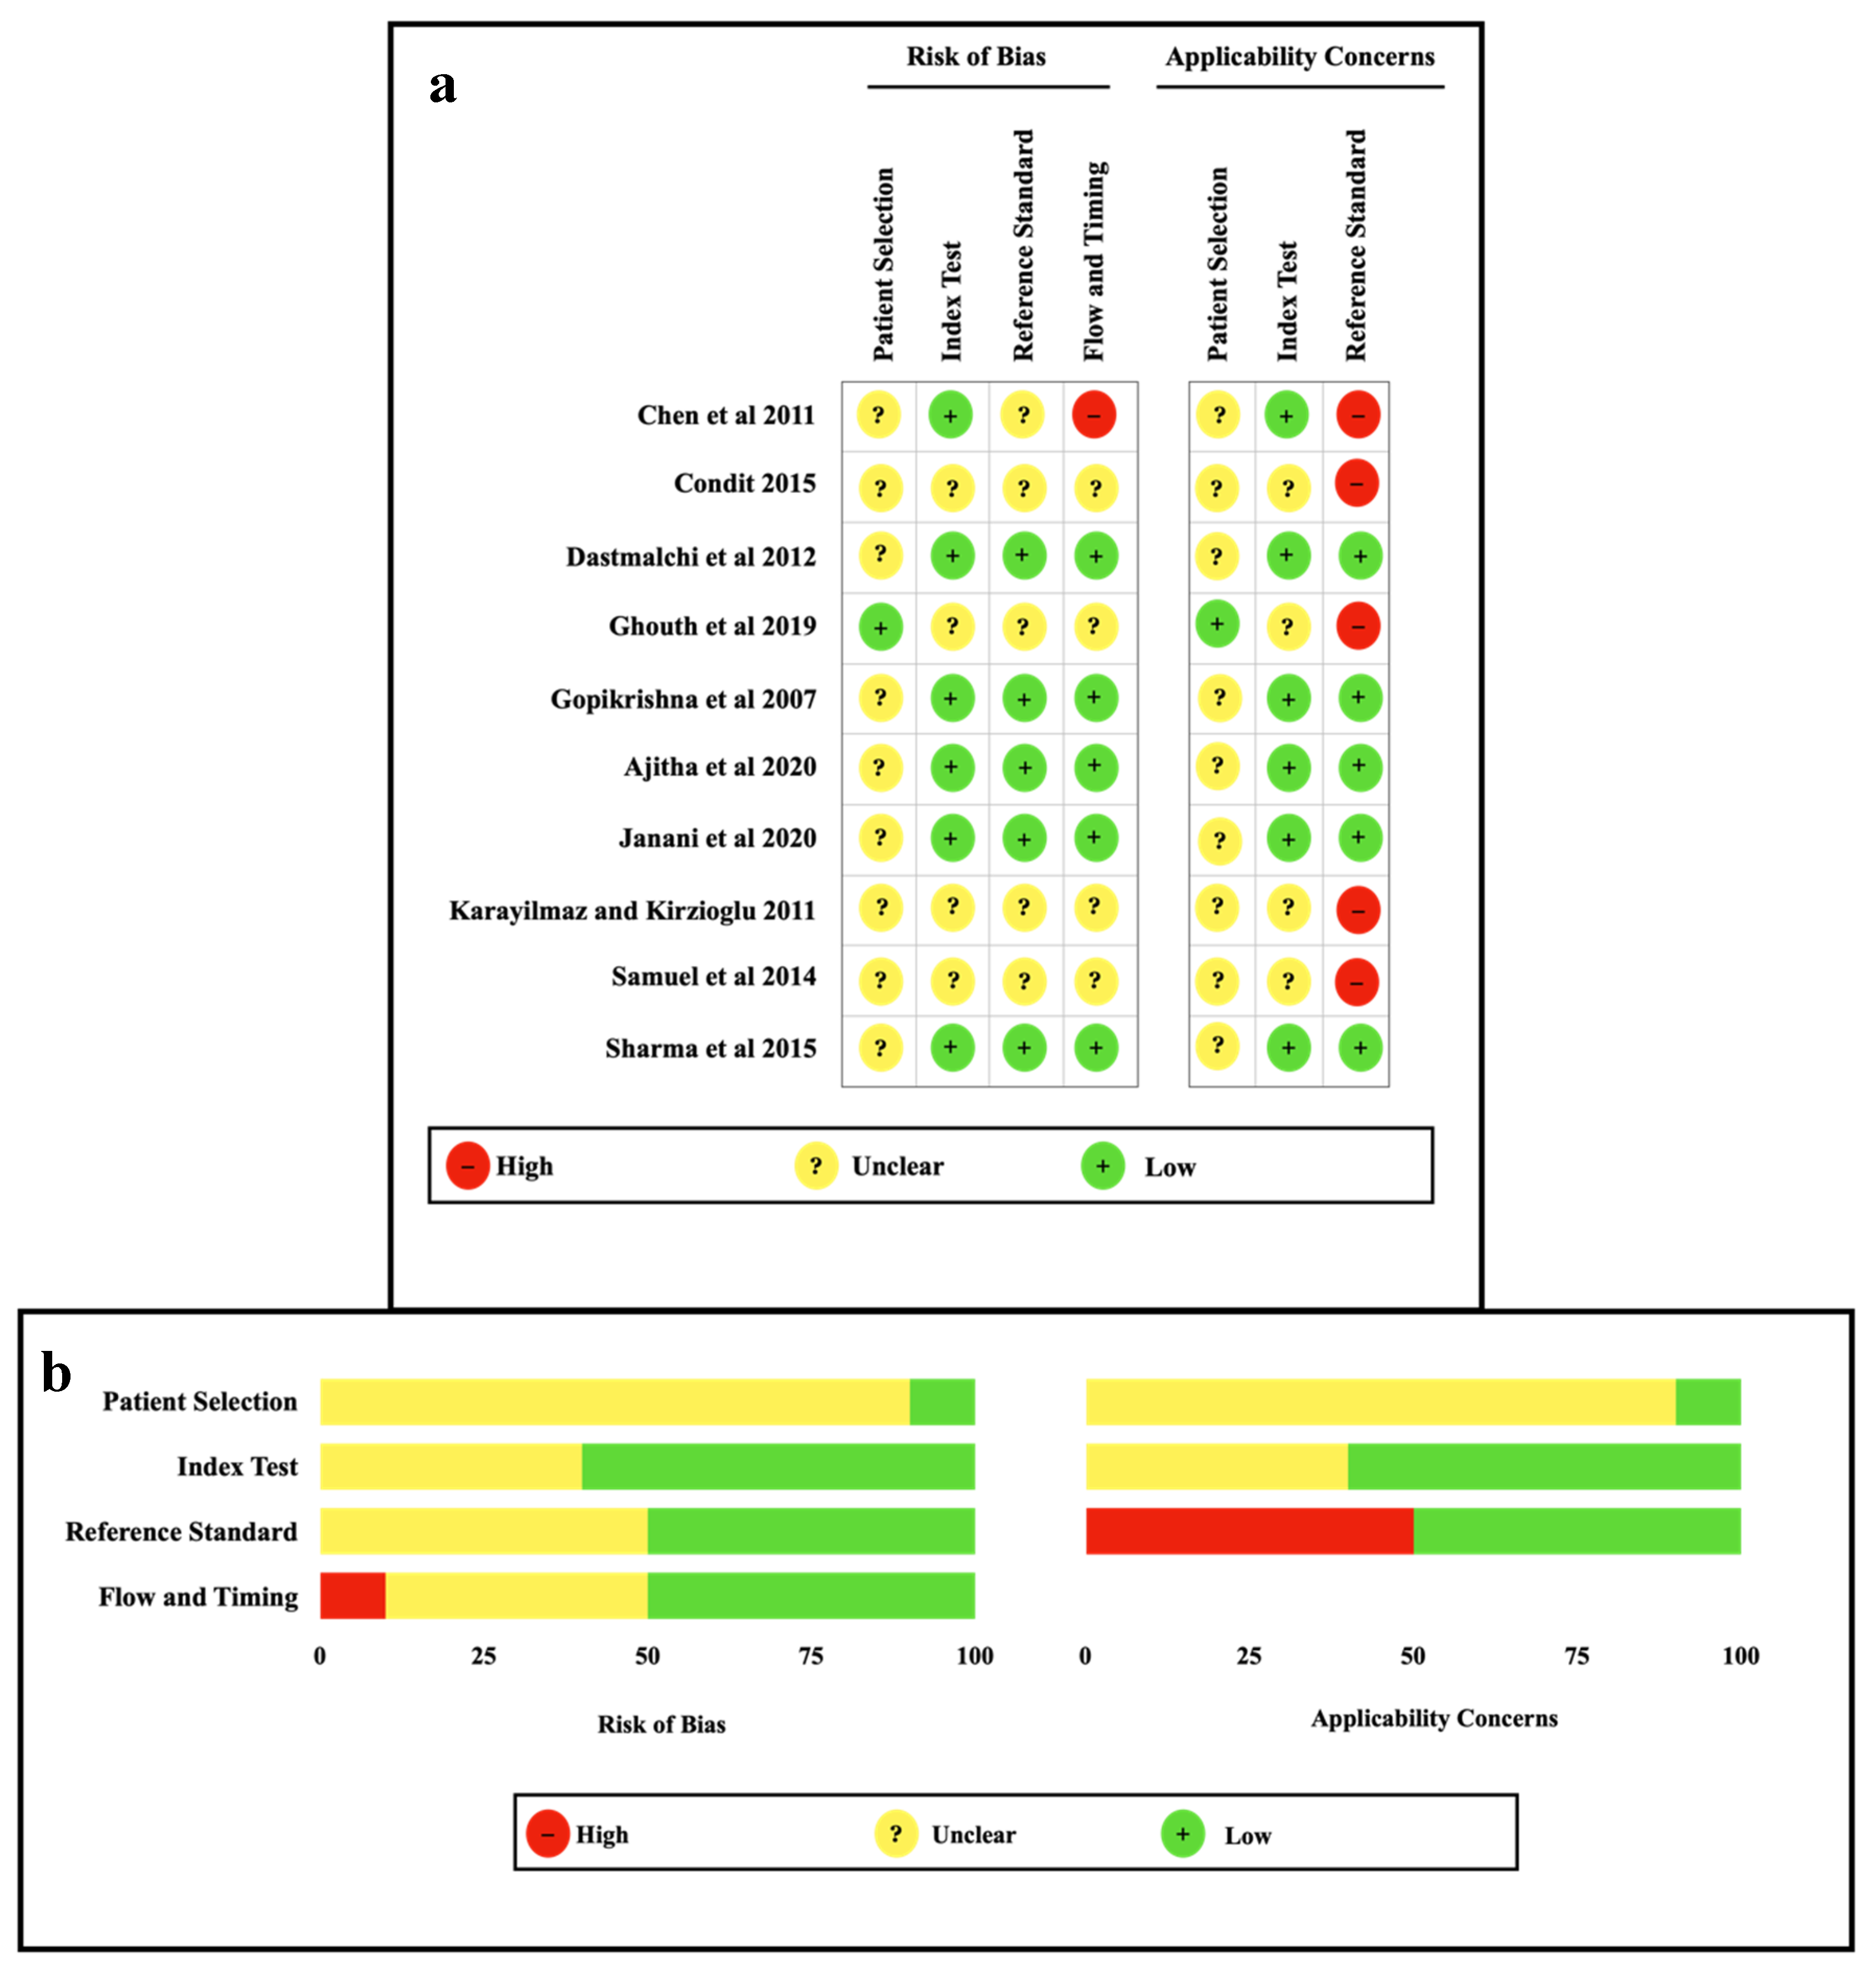
2.7. Assessments of the Risk of Bias and Quality
2.8. Quantitative Analysis and Synthesis of the Meta-Analysis
3. Results
3.1. Literature Search
3.2. Quality Assessment of the Included Studies
3.3. Quantitative Analysis and Synthesis of Results
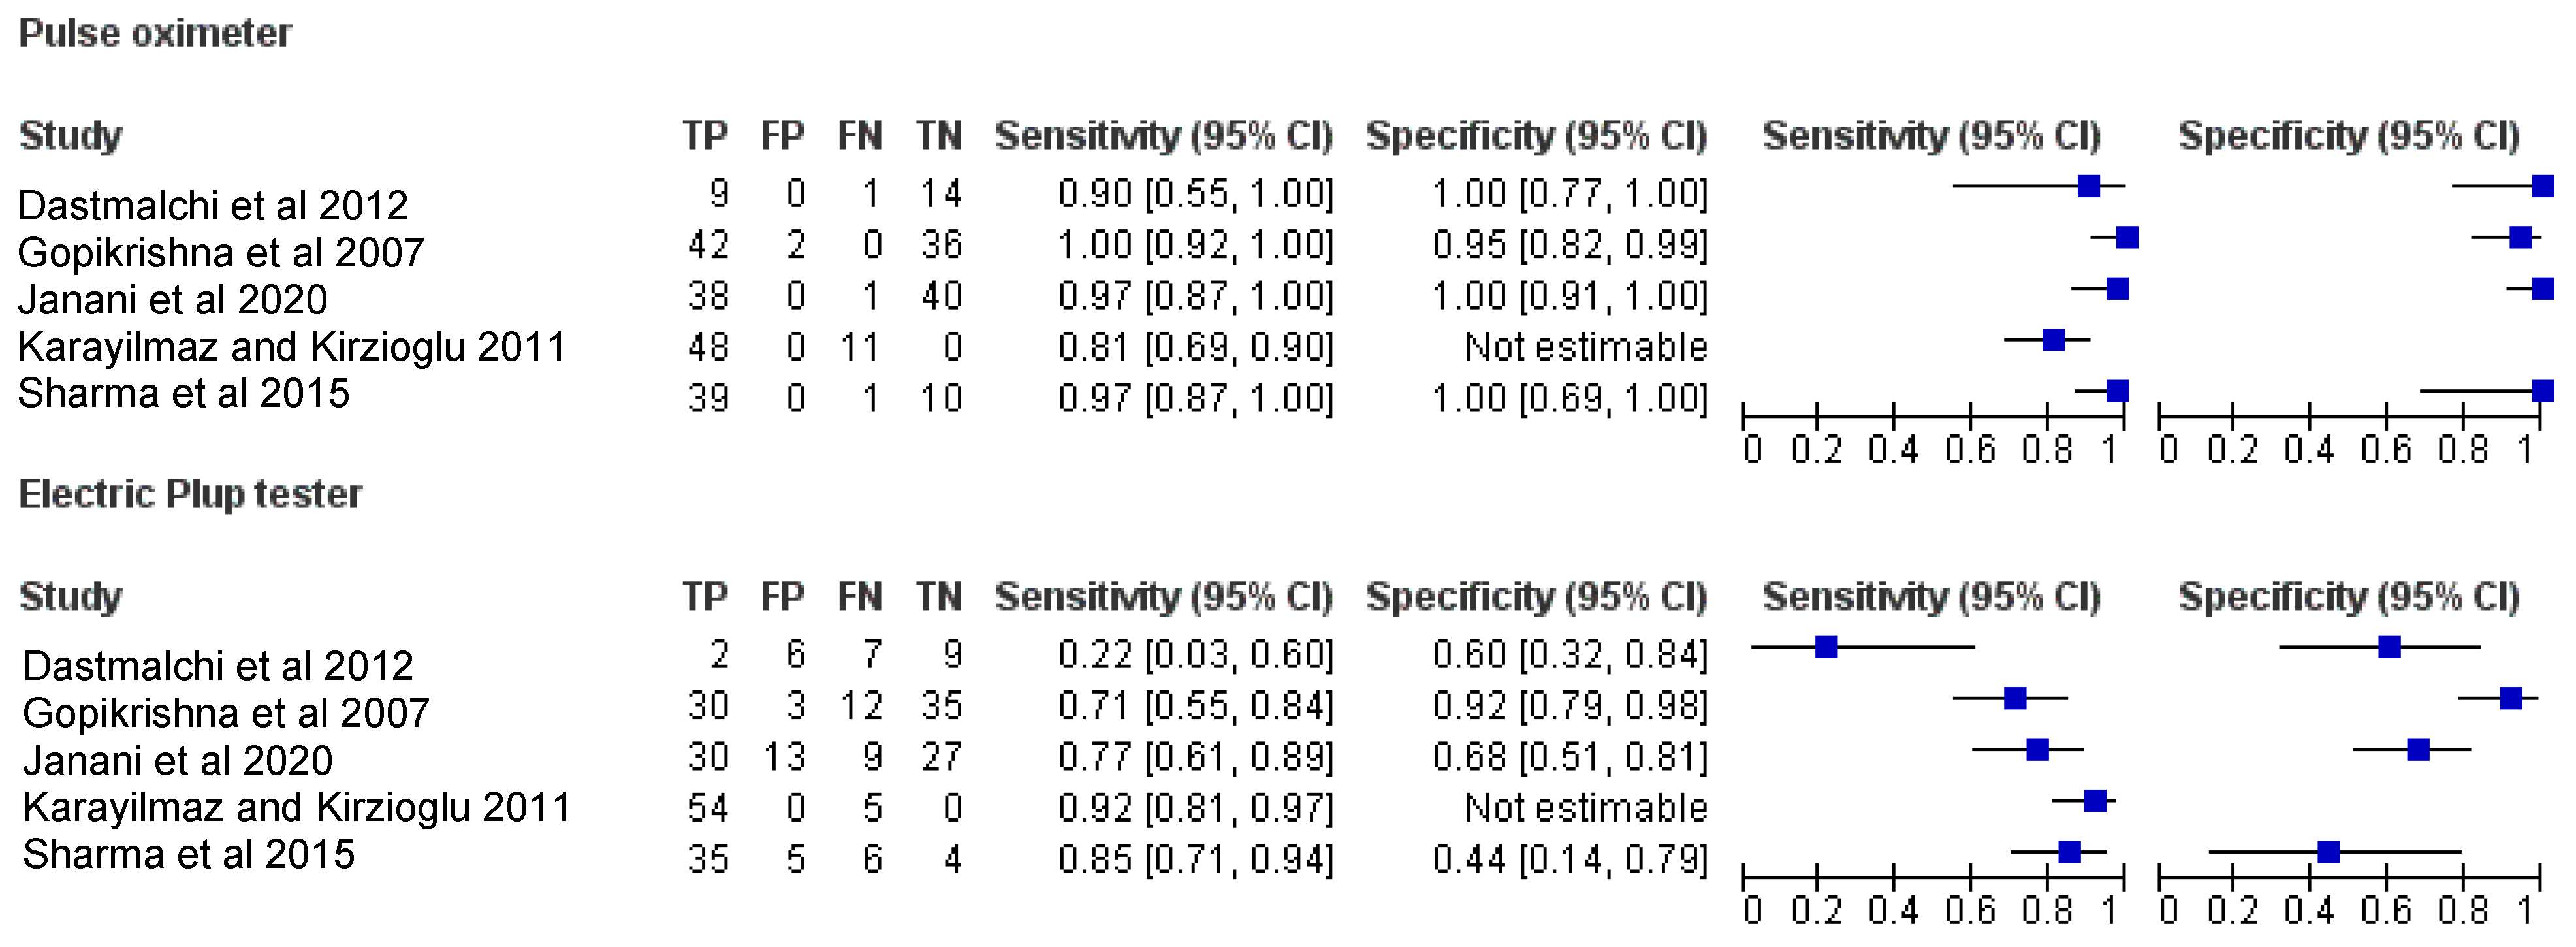
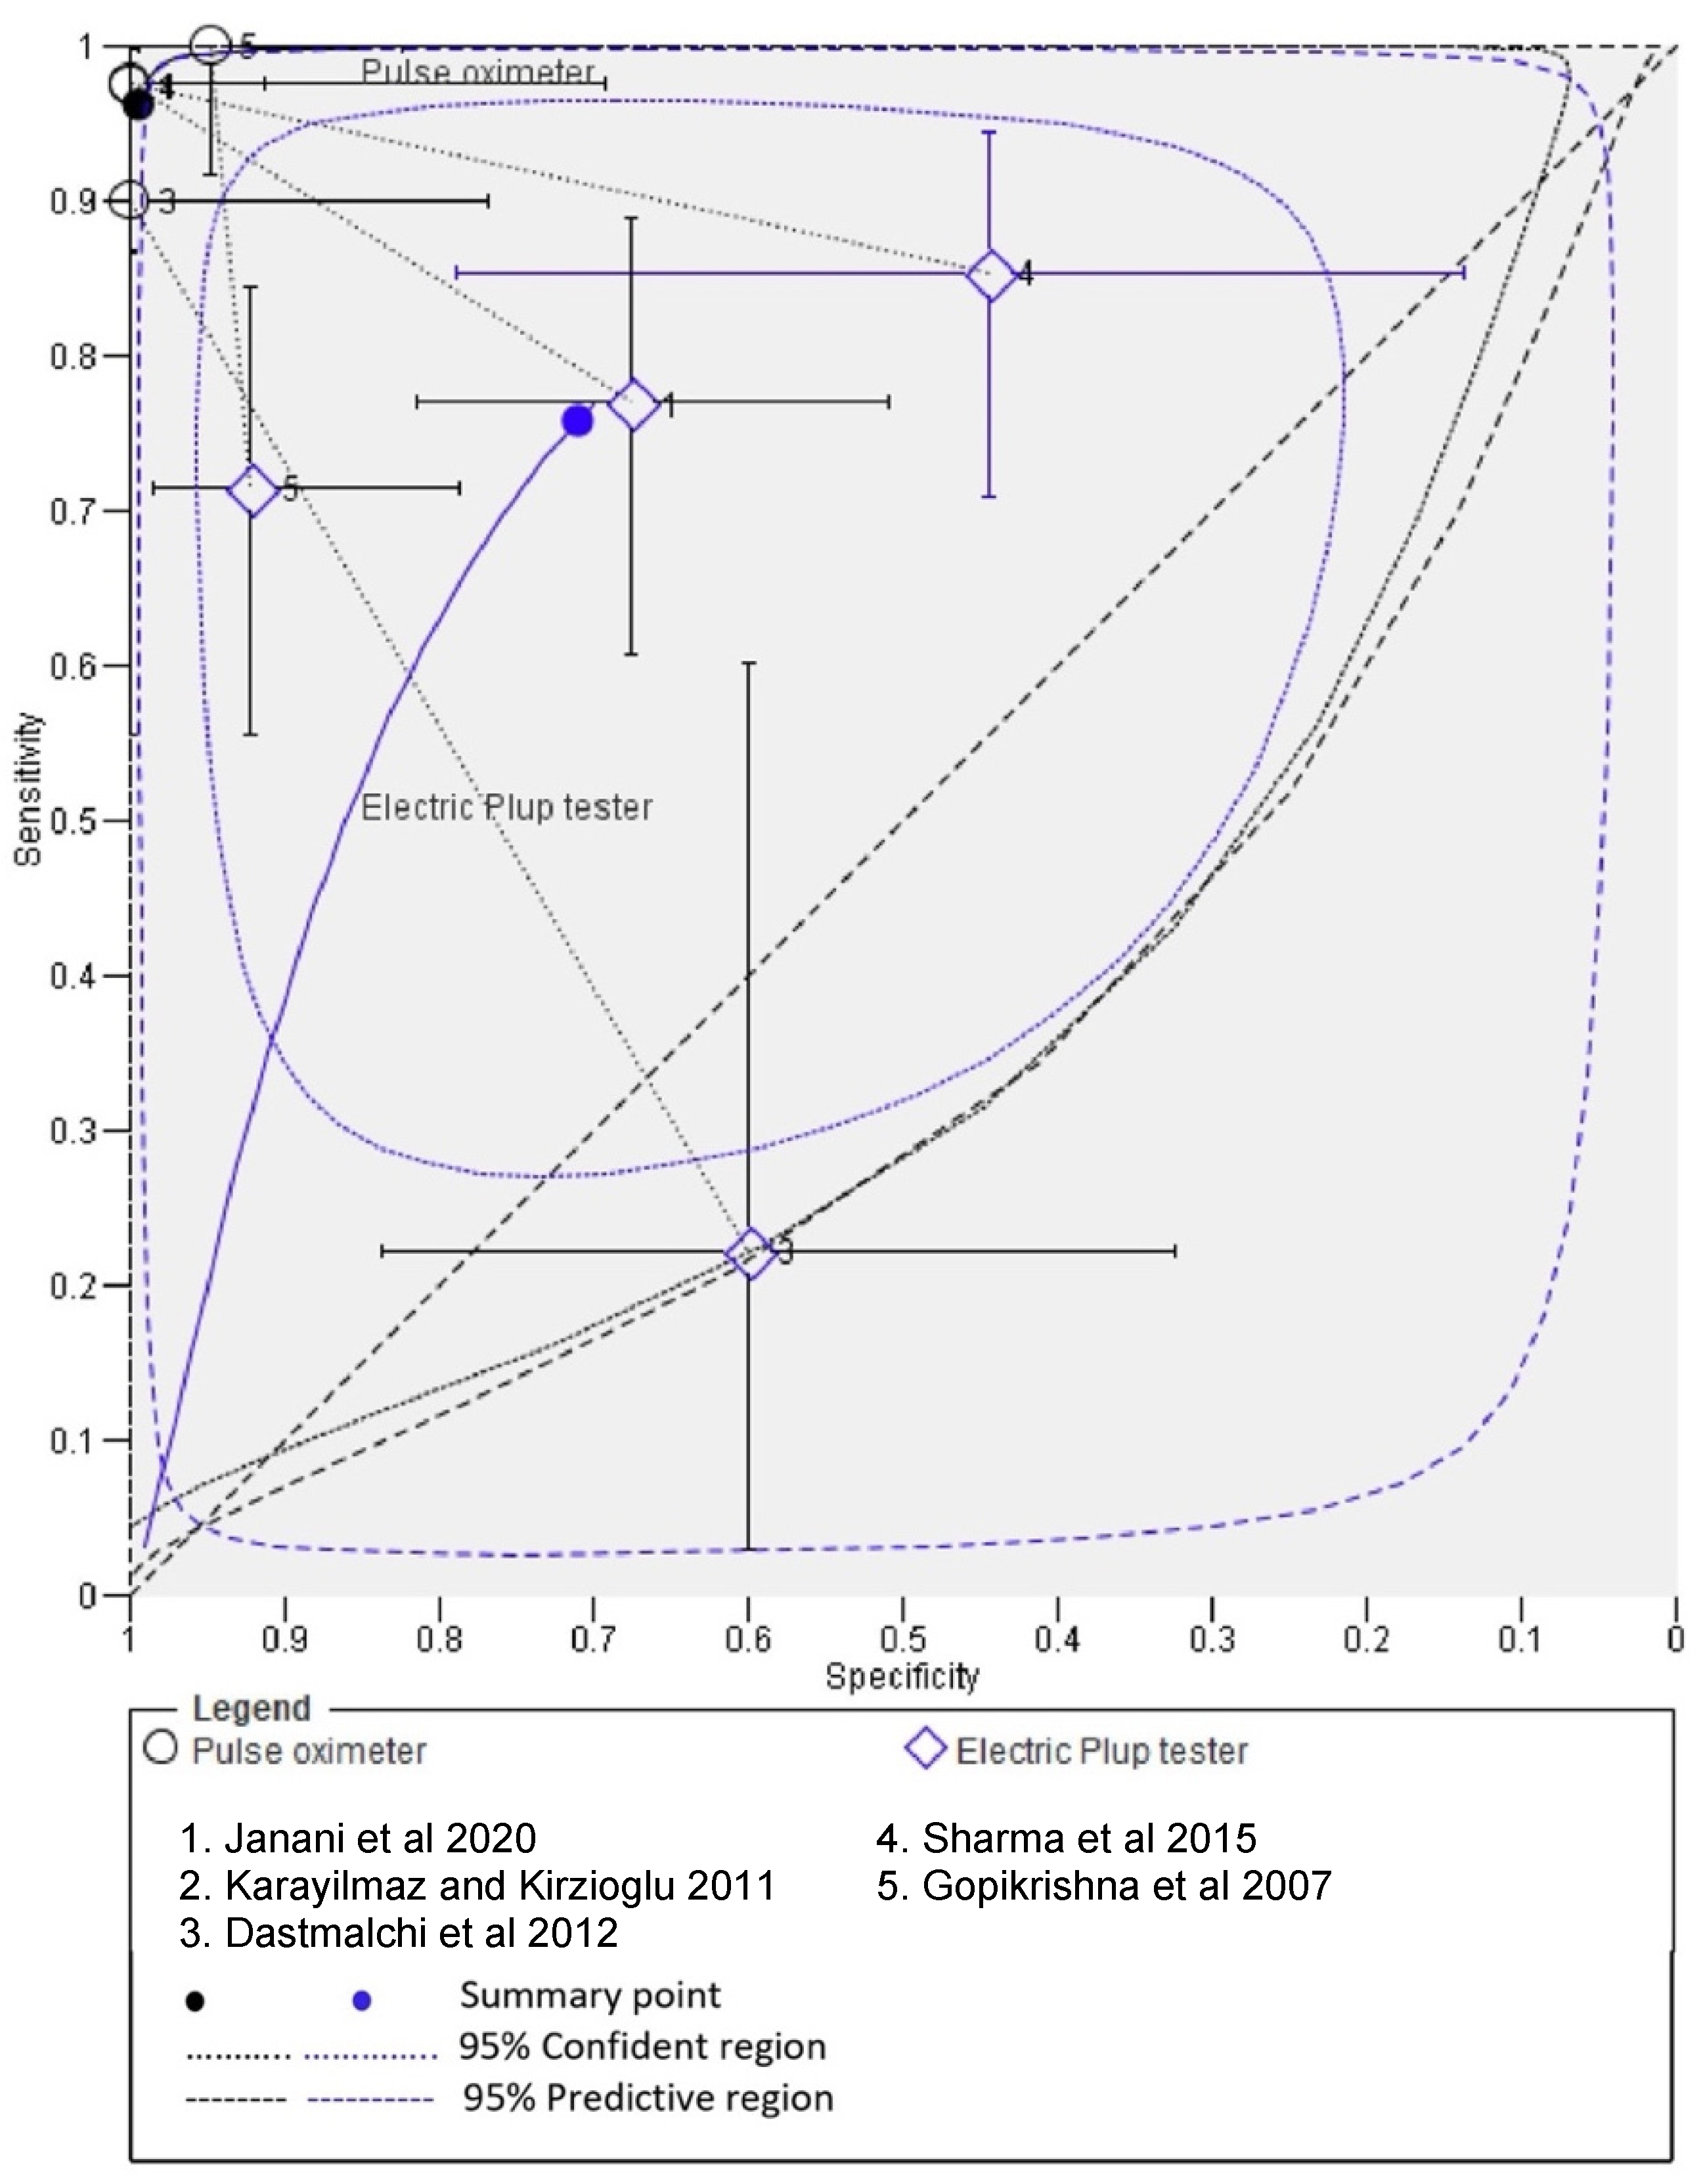
3.4. Diagnostic Accuracy of PO and EPT
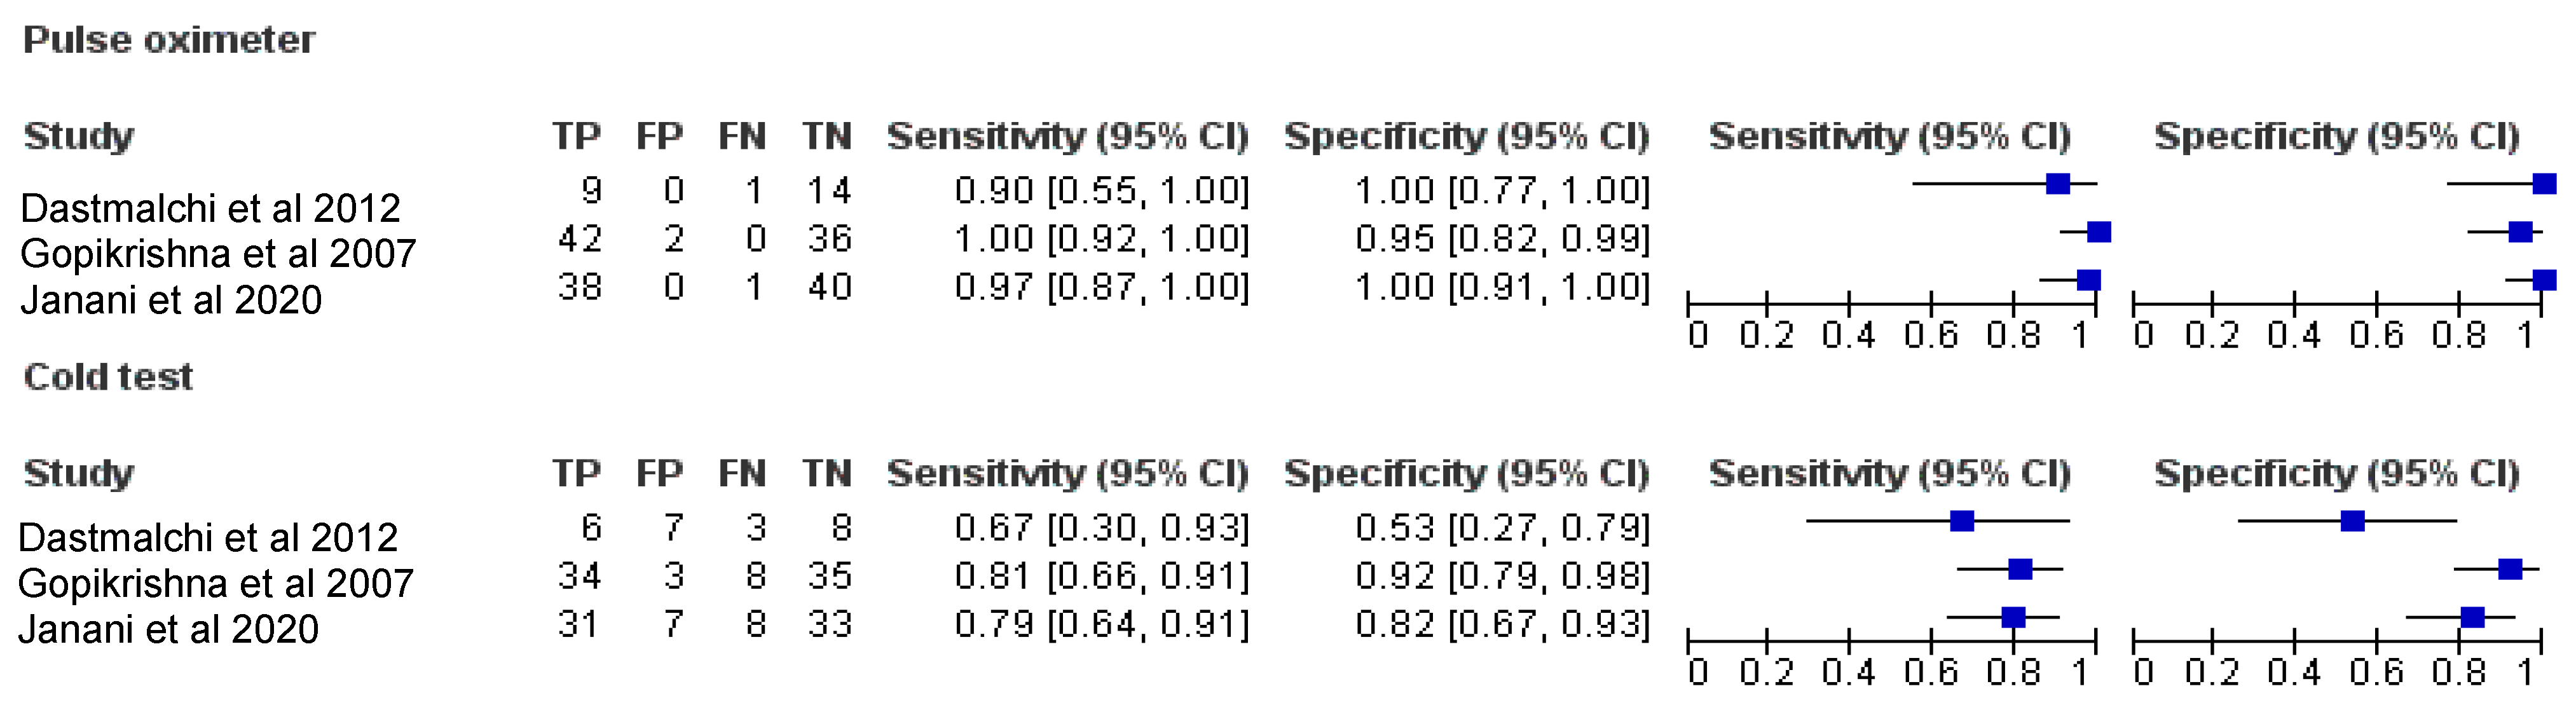
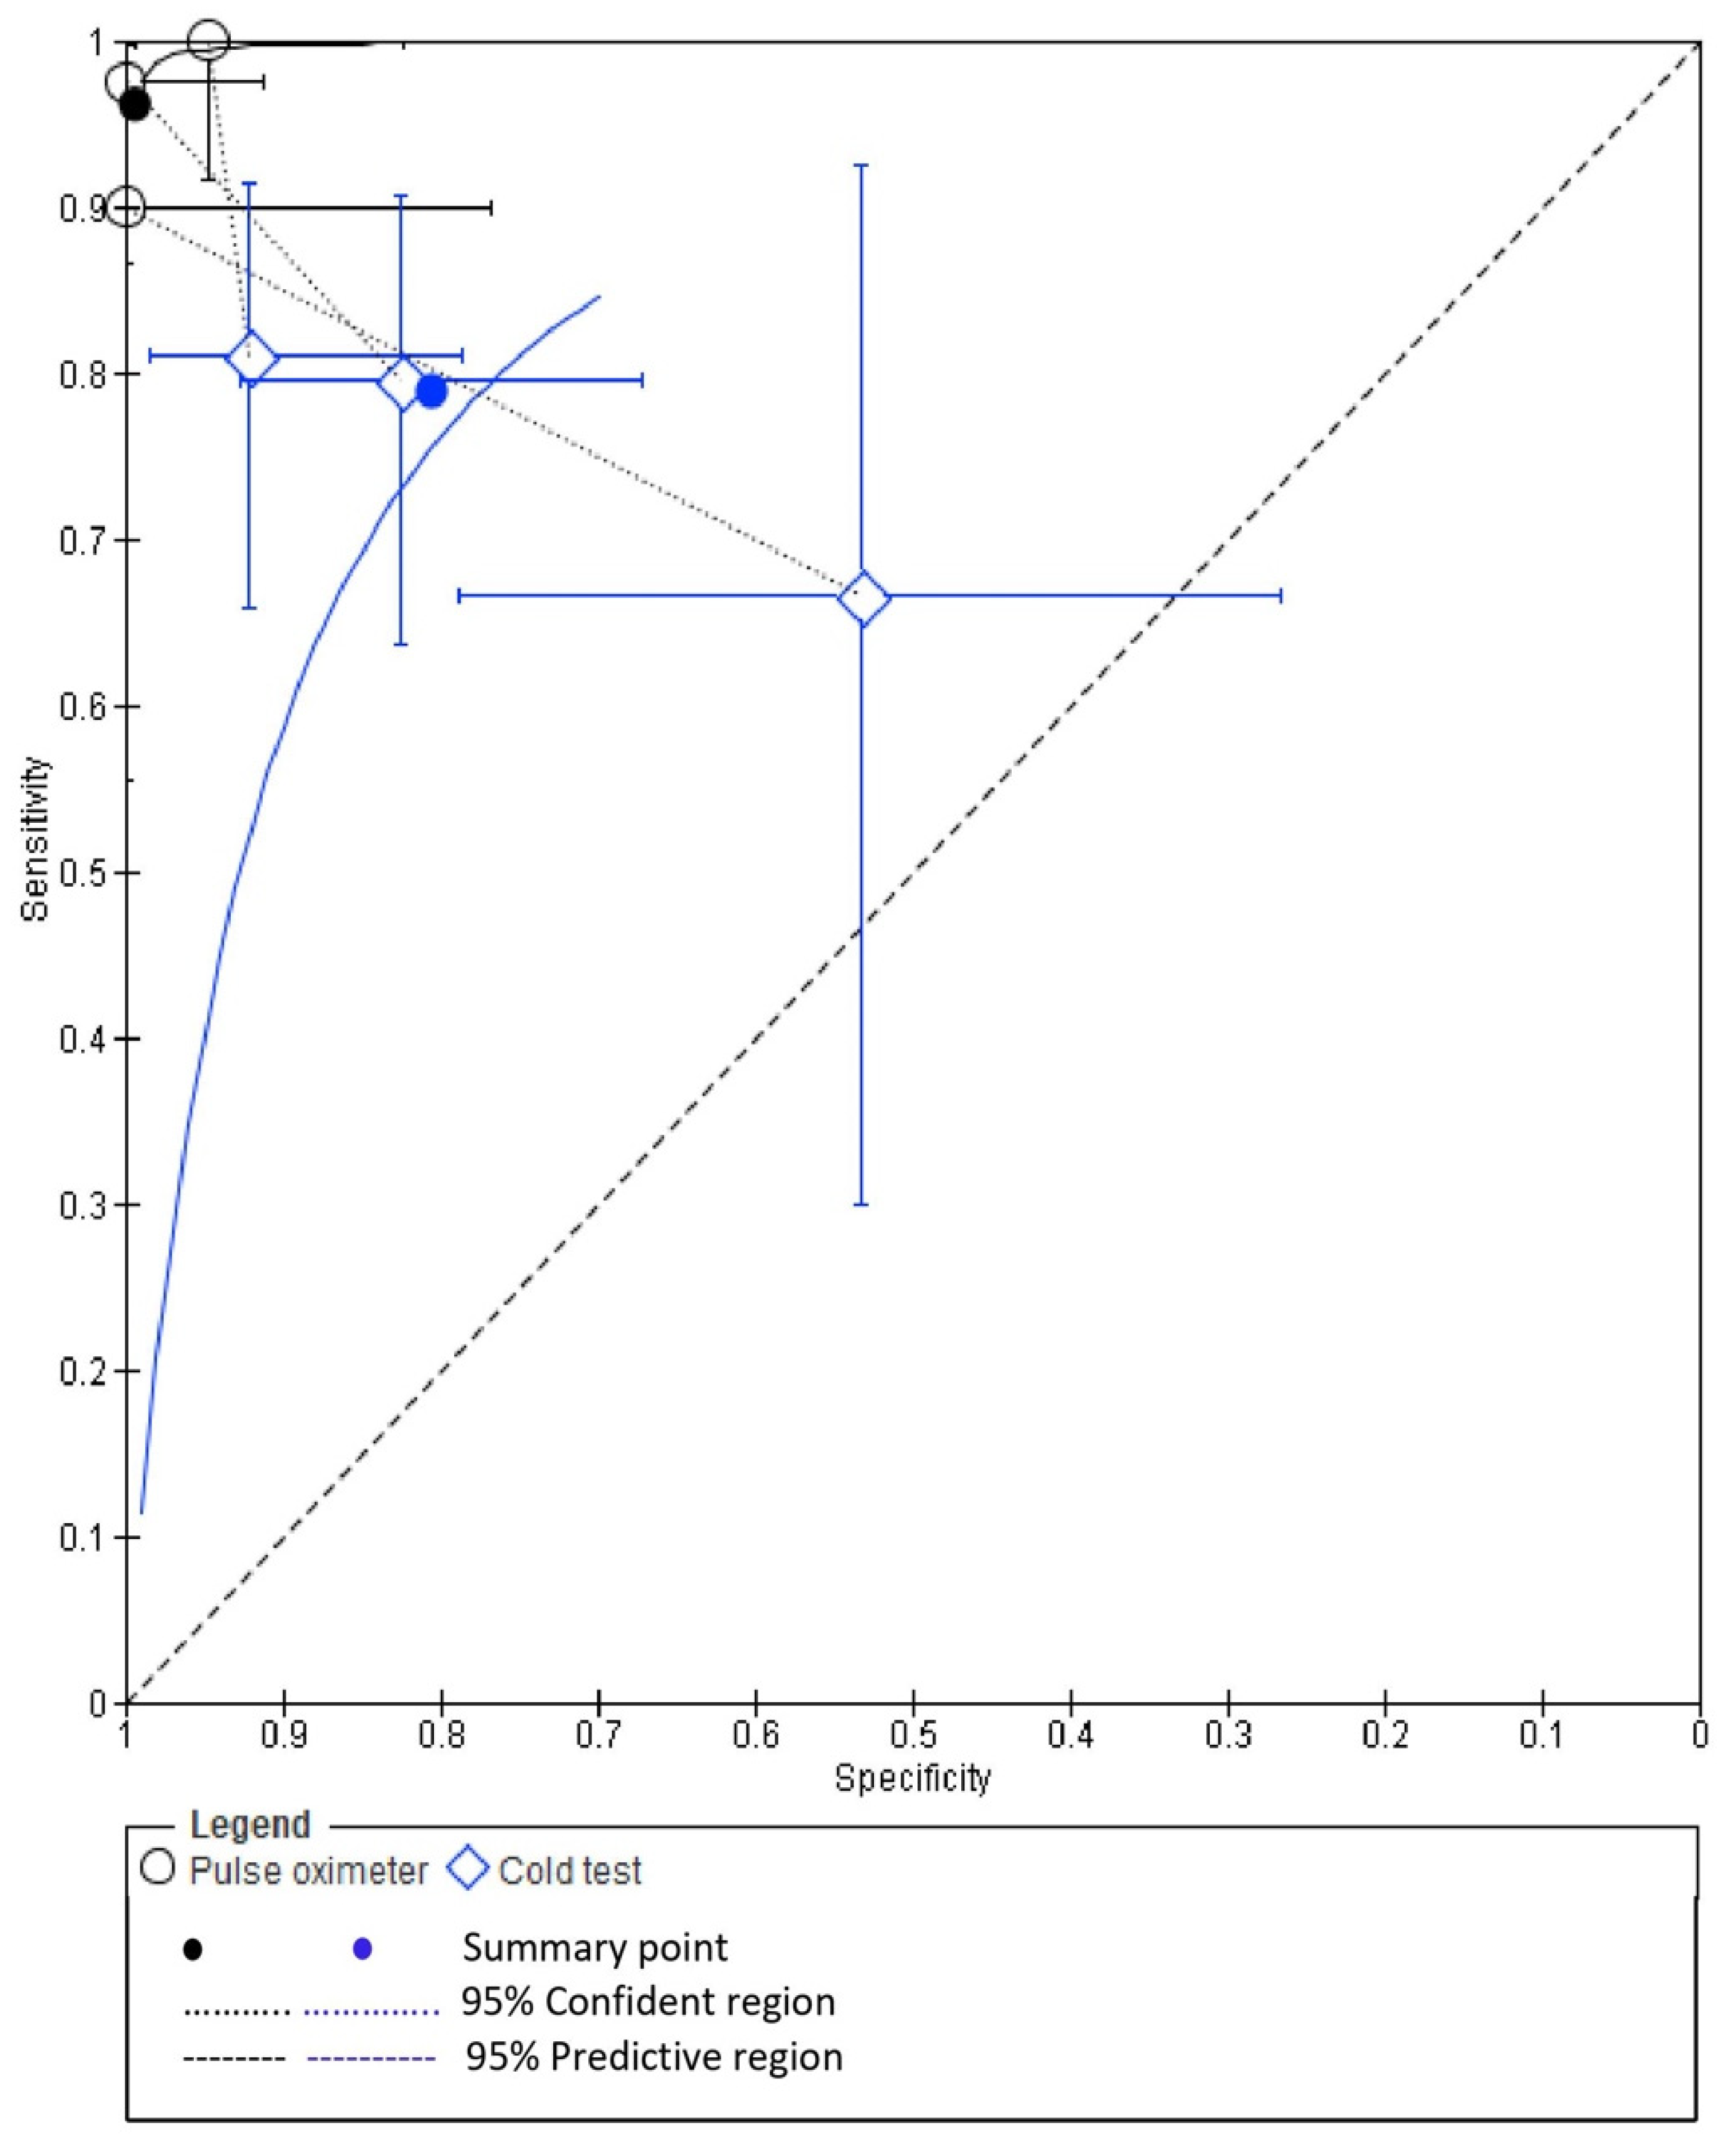
3.5. Diagnostic Accuracy of PO and CT
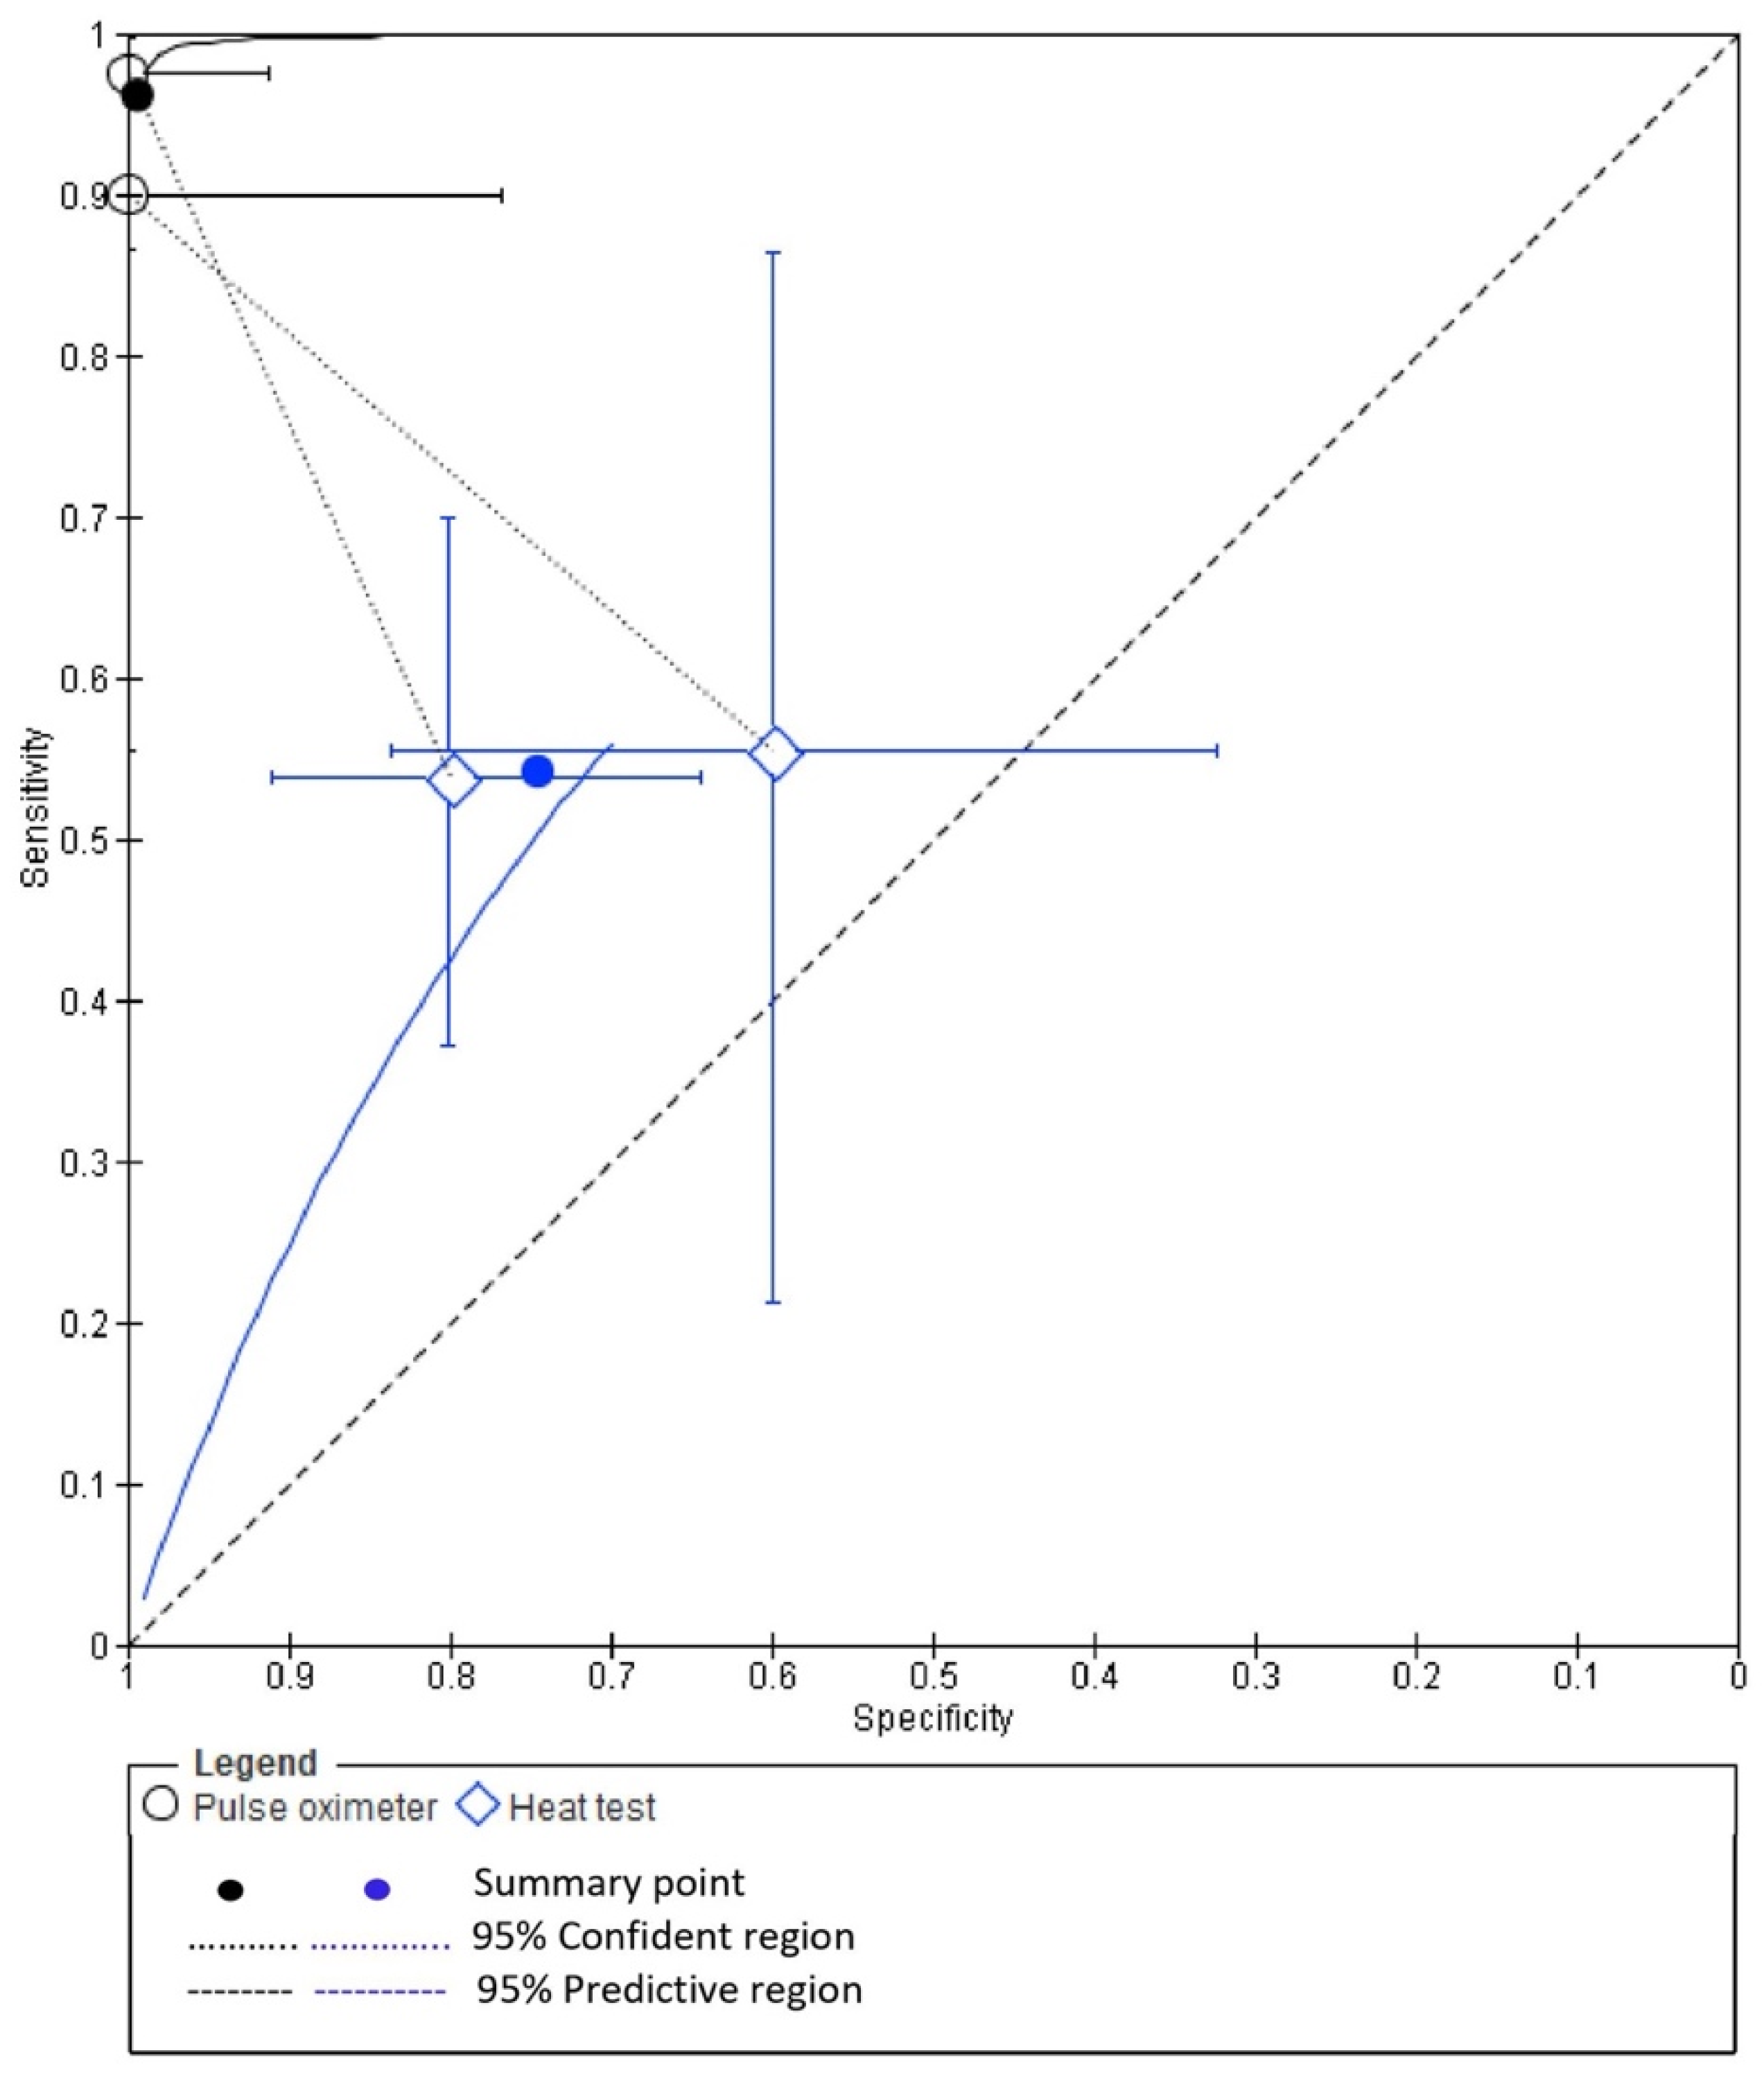
3.6. Diagnostic Accuracy of PO and EPT
4. Discussion
5. Conclusions
Author Contributions
Funding
Institutional Review Board Statement
Informed Consent Statement
Data Availability Statement
Conflicts of Interest
References
- Chen, E.; Abbott, P. Dental Pulp Testing: A Review. Int. J. Dent. 2009, 2009, 365785. [Google Scholar] [CrossRef] [PubMed]
- Weisleder, R.; Yamauchi, S.; Caplan, D.; Trope, M.; Teixeira, F. The Validity of Pulp Testing. J. Am. Dent. Assoc. 2009, 140, 1013–1017. [Google Scholar] [CrossRef] [PubMed]
- Chieruzzi, M.; Pagano, S.; De Carolis, C.; Eramo, S.; Kenny, J.M. Scanning Electron Microscopy Evaluation of Dental Root Resorption Associated with Granuloma. Microsc. Microanal. 2015, 21, 1264–1270. [Google Scholar] [CrossRef] [PubMed]
- Peterson, K.; Söderström, C.; Kiani-Anaraki, M.; Lévy, G. Evaluation of the ability of thermal and electrical tests to register pulp vitality. Dent. Traumatol. 1999, 15, 127–131. [Google Scholar] [CrossRef] [PubMed]
- Alghaithy, R.; Qualtrough, A. Pulp sensibility and vitality tests for diagnosing pulpal health in permanent teeth: A critical review. Int. Endod. J. 2016, 50, 135–142. [Google Scholar] [CrossRef] [PubMed] [Green Version]
- Khoshbin, E.; Soheilifar, S.; Donyavi, Z.; Shahsavand, N. Evaluation of Sensibility Threshold of Dental Pulp to Electric Pulp Test (EPT) in the Teeth under Fixed Orthodontic Treatment with 0.014 and 0.012 Initial NiTi Archwire. J. Clin. Diagn. Res. 2019, 13, 16–19. [Google Scholar] [CrossRef]
- Gopikrishna, V.; Tinagupta, K.; Kandaswamy, D. Evaluation of Efficacy of a New Custom-Made Pulse Oximeter Dental Probe in Comparison with the Electrical and Thermal Tests for Assessing Pulp Vitality. J. Endod. 2007, 33, 411–414. [Google Scholar] [CrossRef]
- Bander, A.; Madhusudhana, K.; Chinni, S.; Paramesh, Y. Assessment of Pulp Oxygen Saturation Levels by Pulse Oximetry for Pulpal Diseases—A Diagnostic Study. J. Clin. Diagn. Res. 2017, 11, 36–39. [Google Scholar]
- Alanazi, M.; Barnawi, N.; Almohaimel, S.; Almutairi, M.; Alanezi, O.; Qureshi, L.; Sangoura, S.; Alkholeef, F.; Shahadah, R. Evaluation of Dental Pulp Testing: Simple Literature Review. Arch. Pharm. Pract. 2019, 10, 37–40. [Google Scholar]
- Karayilmaz, H.; Kirzioğlu, Z. Comparison of the reliability of laser Doppler flowmetry, pulse oximetry and electric pulp tester in assessing the pulp vitality of human teeth. J. Oral Rehabil. 2010, 38, 340–347. [Google Scholar] [CrossRef]
- Dastmalchi, N.; Jafarzadeh, H.; Moradi, S. Comparison of the Efficacy of a Custom-made Pulse Oximeter Probe with Digital Electric Pulp Tester, Cold Spray, and Rubber Cup for Assessing Pulp Vitality. J. Endod. 2012, 38, 1182–1186. [Google Scholar] [CrossRef]
- Janani, K.; Palanivelu, A.; Sandhya, R. Diagnostic accuracy of dental pulse oximeter with customized sensor holder, thermal test and electric pulp test for the evaluation of pulp vitality: An in vivo study. Braz. Dent. Sci. 2020, 23, 1–8. [Google Scholar] [CrossRef] [Green Version]
- Bargrizan, M.; Ashari, M.; Ahmadi, M.; Ramezani, J. The use of pulse oximetry in evaluation of pulp vitality in immature permanent teeth. Dent. Traumatol. 2015, 32, 43–47. [Google Scholar] [CrossRef]
- Ghouth, N.; Duggal, M.; BaniHani, A.; Nazzal, H. The diagnostic accuracy of laser Doppler flowmetry in assessing pulp blood flow in permanent teeth: A systematic review. Dent. Traumatol. 2018, 34, 311–319. [Google Scholar] [CrossRef] [Green Version]
- Lima, T.; dos Santos, S.; da Silva Fidalgo, T.; Silva, E. Vitality Tests for Pulp Diagnosis of Traumatized Teeth: A Systematic Review. J. Endod. 2019, 45, 490–499. [Google Scholar] [CrossRef]
- Chen, E.; Abbott, P. Evaluation of Accuracy, Reliability, and Repeatability of Five Dental Pulp Tests. J. Endod. 2011, 37, 1619–1623. [Google Scholar] [CrossRef]
- Siddheswaran, V.; Adyanthaya, R. Pulse Oximetry: A Diagnostic Instrument in Pulpal Vitality Testing—An in vivo Study. World J. Dent. 2011, 2, 225–230. [Google Scholar] [CrossRef]
- Bedoya, M.; Park, J. A Review of the Diagnosis and Management of Impacted Maxillary Canines. J. Am. Dent. Assoc. 2009, 140, 1485–1493. [Google Scholar] [CrossRef] [Green Version]
- Mainkar, A.; Kim, S. Diagnostic Accuracy of 5 Dental Pulp Tests: A Systematic Review and Meta-analysis. J. Endod. 2018, 44, 694–702. [Google Scholar] [CrossRef]
- Moher, D.; Liberati, A.; Tetzlaff, J.; Altman, D. Preferred reporting items for systematic reviews and meta-analyses: The PRISMA statement. Int. J. Surg. 2010, 8, 336–341. [Google Scholar] [CrossRef] [Green Version]
- Whiting, P. QUADAS-2: A Revised Tool for the Quality Assessment of Diagnostic Accuracy Studies. Ann. Intern. Med. 2011, 155, 529. [Google Scholar] [CrossRef] [PubMed]
- Macaskill, P.; Gatsonis, C.; Deeks, J.J.; Harbord, R.M.; Takwoingi, Y. Analysing and Presenting Results. In Cochrane Handbook for Systematic Reviews of Diagnostic Test Accuracy; Deeks, J.J., Bossuyt, P.M., Gatsonis, C., Eds.; The Cochrane Collaboration: London, UK, 2010; Version 1.0, Chapter 10; Available online: http://srdta.cochrane.org/ (accessed on 12 September 2020).
- Freeman, S.; Kerby, C.; Patel, A.; Cooper, N.; Quinn, T.; Sutton, A. Development of an interactive web-based tool to conduct and interrogate meta-analysis of diagnostic test accuracy studies: MetaDTA. BMC Med. Res. Methodol. 2019, 19, 81. [Google Scholar] [CrossRef] [PubMed]
- Parker, M.; Iskandar, A.; Limone, B.; Perugini, A.; Kim, H.; Jones, C.; Calamari, B.; Coleman, C.; Heller, G. Diagnostic Accuracy of Cardiac Positron Emission Tomography Versus Single Photon Emission Computed Tomography for Coronary Artery Disease. Circ. Cardiovas. Imaging 2012, 5, 700–707. [Google Scholar] [CrossRef] [PubMed] [Green Version]
- Samuel, S.; Thomas, A.; Singh, N. A comparative study of pulse oximetry with the conventional pulp testing methods to assess vitality in immature and mature permanent maxillary incisors. CHRISMED J. Health Res. 2014, 1, 235–240. [Google Scholar] [CrossRef]
- Condit, M.D. Can Laser Doppler Flowmetry Evaluate Pulpal Vitality in Traumatized Teeth? Ph.D. Thesis, The Ohio State University, Columbus, OH, USA, 2015. [Google Scholar]
- Sharma, A.; Madan, M.; Shahi, P.; Sood, P.; Shahi, N. Comparative Study of Pulp Vitality in Primary and Young Permanent Molars in Human Children with Pulse Oximeter and Electric Pulp Tester. Int. J. Clin. Pediatr. Dent. 2015, 8, 94–98. [Google Scholar] [CrossRef]
- Ghouth, N.; Duggal, M.; Kang, J.; Nazzal, H. A Diagnostic Accuracy Study of Laser Doppler Flowmetry for the Assessment of Pulpal Status in Children’s Permanent Incisor Teeth. J. Endod. 2019, 45, 543–548. [Google Scholar] [CrossRef]
- Ajitha, P.; Janani, K.; Sandhya, R.; Subbaiyan, H.; Jose, J. Efficiency of new custom-made pulse oximeter sensor holder in assessment of actual pulp status. J. Fam. Med. Prim. Care 2020, 9, 3333–3337. [Google Scholar] [CrossRef]
- Naaktgeboren, C.; Bertens, L.; Smeden, M.; Groot, J.; Moons, K.; Reitsma, J. Value of composite reference standards in diagnostic research. BMJ 2013, 347, f5605. [Google Scholar] [CrossRef] [Green Version]
- Mejàre, I.; Axelsson, S.; Davidson, T.; Frisk, F.; Hakeberg, M.; Kvist, T.; Norlund, A.; Petersson, A.; Portenier, I.; Sandberg, H.; et al. Diagnosis of the condition of the dental pulp: A systematic review. Int. Endod. J. 2012, 45, 597–613. [Google Scholar] [CrossRef]
- Peters, D.; Baumgartner, J.; Lorton, L. Adult pulpal diagnosis. I. Evaluation of the positive and negative responses to cold and electrical pulp tests. J. Endod. 1994, 20, 506–511. [Google Scholar] [CrossRef]
- Pantera, E.; Anderson, R.; Pantera, C. Reliability of electric pulp testing after pulpal testing with dichlorodifluoromethane. J. Endod. 1993, 19, 312–314. [Google Scholar] [CrossRef]
- Takwoingi, Y.; Riley, R.; Deeks, J. Meta-analysis of diagnostic accuracy studies in mental health. Evid. Based Ment. Health 2015, 18, 103–109. [Google Scholar] [CrossRef]
- Hyman, J.; Cohen, M. The predictive value of endodontic diagnostic tests. Oral Surg. Oral Med. Oral Pathol. 1984, 58, 343–346. [Google Scholar] [CrossRef]
- Deeks, J.; Altman, D. Diagnostic tests 4: Likelihood ratios. BMJ 2004, 329, 168–169. [Google Scholar] [CrossRef] [Green Version]
- Qeli, E.; Toti, Ç.; Odorici, A.; Blasi, E.; Tragaj, E.; Tepedino, M.; Masedu, F.; Kaçani, G.; Hysi, D.; Meto, A.; et al. Effectiveness of Two Different Fluoride-Based Agents in the Treatment of Dentin Hypersensitivity: A Prospective Clinical Trial. Materials 2022, 15, 1266. [Google Scholar] [CrossRef]
- Reitsma, J.; Glas, A.; Rutjes, A.; Scholten, R.; Bossuyt, P.; Zwinderman, A. Bivariate analysis of sensitivity and specificity produces informative summary measures in diagnostic reviews. J. Clin. Epidemiol. 2005, 58, 982–990. [Google Scholar] [CrossRef]
- Lardani, L.; Derchi, G.; Marchio, V.; Carli, E. One-Year Clinical Performance of Activa™ Bioactive-Restorative Composite in Primary Molars. Children 2022, 19, 433. [Google Scholar] [CrossRef]


| Search strategy | |
| Focused Question | Is there a difference in the diagnostic accuracy of pulp vitality and pulp sensibility tests in assessing pulpal health in permanent teeth? |
| Search strategy | |
| Population (#1) | (Human teeth [Text Word]) OR “tooth”[MeSH Terms] OR teeth [Text Word]) OR lower teeth [Text Word] OR upper teeth [Text Word] OR “molar”[MeSH Terms] OR molar [Text Word] OR posterior teeth [Text Word] OR anterior teeth [Text Word] OR premolar [Text Word] OR “incisor”[MeSH Terms] OR incisor [Text Word] OR canine [MeSH] OR Root canal [Text Word]) OR permanent teeth [Text Word]) |
| Intervention (#2) | (‘Pulp vitality test’ [Text Word] OR Laser-Doppler flowmetry [MeSH Terms] OR Doppler-Laser Flowmetry [Text Word] OR Laser Doppler Velocimetry [Text Word] OR ultrasound Doppler flowmetry [Text Word] OR pulse oximetry [Text Word] OR thermometry [Text Word]) |
| Comparisons (#3) | (Pulp vitality tests [Text Word] OR Thermal test [Text Word] OR Hot test [Text Word] OR Cold test [Text Word] OR electric pulp tester [Text Word]) |
| Outcomes (#4) | (Diagnostic accuracy [Text Word] OR Sensitivity [Text Word] OR Accuracy [Text Word] OR Specificity [Text Word] OR Pulpal health [Text Word] OR Pulp vitality [Text Word]) |
| Study design (#5) | (Clinical study [Text Word] OR Clinical trial [MeSH] OR randomized controlled studies [Text Word] OR randomized control trials [MeSH] OR randomized control clinical trial MeSH OR non-randomized control trials [Text Word] OR Quasi experimental studies [Text Word] OR before and after study design [Text Word] OR cohort studies [Text Word] OR in vivo study [Text Word] OR Cross-sectional study [Text Word]) |
| Search Combination | #1 AND #2 AND #3 AND #4 AND #5 |
| Database search | |
| Language | No restriction (Articles in English language or other language where English translation is possible.) |
| Electronic Databases | PubMed/MEDLINE, Cochrane Central Register of Controlled Trials, Web of Science, Open grey, Google scholar |
| Journals | Journal of Endodontics, International Endodontic Journal, Australian Endodontic Journal, Clinical Oral Investigations, Journal of Conservative Dentistry, Journal of American Dental Association |
| Period of Publication | Studies published between 1 January 2007 to 31 December 2020. |
| Study ID | Place of Study | Sample Size Teeth/Patient | Age Range (Years) | Pathology of Teeth | Type of Teeth | Pulp Vitality Tests | Pulp Sensibility Tests | Authors’ Conclusions |
|---|---|---|---|---|---|---|---|---|
| Gopikrishna et al., 2007 [7] | India | 80/80 | Not reported | Requiring endodontic therapy for prosthodontic considerations or for irreversible pulpitis | Single-rooted incisors, canines and premolars | PO | CT EPT | Custom-built pulse oximeter dental probe is an effective, accurate and objective method of determining the vitality of permanent teeth. |
| Karayilmaz and Kirzioğlu, 2011 [10] | Turkey | 59/51 | 12–18 | Root canal treated | Maxillary anterior teeth | LDF PO | EPT | LDF was found to be a more reliable and effective method than PO and EPT for assessing the pulpal status of human teeth. |
| Dastmalchi et al., 2012 [11] | Iran | 24/24 | 18–50 | Requiring endodontic treatment for prosthodontic reasons | Single-canal mandibular premolars | PO | CT HT EPT | PO is a reliable method in determining the actual status of the pulp in endodontics; however, CT, HT and EPT are not suitable methods for pulp testing. |
| Janani et al., 2020 [12] | India | 79 | 18–56 | Requiring endodontic therapy | Single-rooted teeth | PO | CT HT EPT | Customized pulse oximeter sensor holder proves to be accurate, reliable and objective in assessing the actual condition of the tooth. |
| Chen and Abbott, 2011 [16] | Australia | 121/20 | 18–74 | Suspected or known to have pulp pathosis; previously received or currently undergoing endodontic treatment; or provisionally diagnosed as having a healthy pulp | Not reported | LDF | CT EPT | Carbon dioxide (CO2) crystals, EPT and LDF were reliable and the most accurate tests, but CO2 and EPT were less repeatable yet less time consuming than LDF. |
| Samuel et al., 2014 [25] | India | 120/30 | 7–18 | Free of any dental pathology | Permanent maxillary central and lateral incisors | PO | CT EPT | In young children, PO method was found to be as accurate as cold test but large variations were seen in electric pulp test. |
| Condit, 2015 [26] | Columbus, US | 85 | 6–16 | Traumatized teeth | Maxillary central and lateral incisors | LDF | CT EPT | LDF could not distinguish between healthy and necrotic pulp tissue among traumatized teeth. |
| Sharma et al., 2015 [27] | India | Not reported | 4–15 | Requiring endodontic therapy | Not reported | PO | EPT | PO is an objective, very sensitive and noninvasive method that can be used as a routine method for assessing the pulp vitality in primary, young permanent and mature permanent teeth. |
| Ghouth et al., 2019 [28] | UK | 37 | 8–16 | Root canal treated | Permanent anterior teeth | LDF | CT EPT | LDF was unable to differentiate between teeth with vital and nonvital pulps in children between the ages of 8 and 16 years, with an acceptable level of confidence. |
| Ajitha et al., 2020 [29] | India | 30 | 18–50 | Requiring endodontic therapy indicative of irreversible pulpitis | Single-canal incisors, canine and mandibular premolar teeth | PO | CT HT EPT | The use of custom-made holder is effective in placement of sensor probe onto the tooth surface. It aided in evaluating the actual pulp status by producing accurate interpretation of results. |
| Index Test | Study Id | TP | FP | FN | TN | Sensitivity | Specificity | PPV | NPV | LR+ | LR− | Prevalence | Diagnostic Odds Ratio |
|---|---|---|---|---|---|---|---|---|---|---|---|---|---|
| PO | Gopikrishna et al., 2007 [7] | 42 | 2 | 0 | 36 | 1.00 [0.92, 1.00] | 0.95 [0.82, 0.99] | 0.9545 | 1.0000 | 19.0000 | 0.0000 | 0.5250 | 0 |
| Karayilmaz and Kirzioğlu, 2011 [10] | 48 | 0 | 11 | 0 | 0.81 [0.69, 0.90] | Not estimable | 1.0000 | 0.0000 | - | - | 1.0000 | - | |
| Dastmalchi et al., 2012 [11] | 9 | 0 | 1 | 14 | 0.90 [0.55, 1.00] | 1.00 [0.77, 1.00] | 1.0000 | 0.9333 | - | 0.1000 | 0.4167 | - | |
| Sharma et al., 2015 [27] | 39 | 0 | 1 | 10 | 0.97 [0.87, 1.00] | 1.00 [0.69, 1.00] | 1.0000 | 0.9091 | - | 0.0250 | 0.8000 | - | |
| Ajitha et al., 2020 [29] | 38 | 0 | 1 | 40 | 0.97 [0.87, 1.00] | 1.00 [0.91, 1.00] | 1.0000 | 0.9756 | - | 0.0256 | 0.4937 | - | |
| Total pooled estimates | 176 | 2 | 14 | 100 | 0.93 [0.88, 0.96] | 0.98 [0.93, 1.00] | 0.98 | 0.87 | 47.24 | 0.075 | 0.65 | 628.5 | |
| For comparison with EPT * | 176 | 2 | 14 | 100 | 0.93 [0.88, 0.96] | 0.98 [0.93, 1.00] | 0.98 | 0.87 | 47.24 | 0.075 | 0.65 | 628.5 | |
| For comparison with CT * | 89 | 2 | 2 | 90 | 0.98 [0.92, 1.00] | 0.98 [0.92, 1.00] | 0.97 | 0.97 | 44.98 | 0.02 | 0.49 | 2249 | |
| For comparison with HT * | 47 | 0 | 1 | 54 | 0.98 [0.89, 1.00] | 1.00 [0.93, 1.00] | 1.00 | 0.98 | - | 0.02 | 0.47 | - | |
| EPT | Gopikrishna et al., 2007 [7] | 30 | 3 | 12 | 35 | 0.71 [0.55, 0.84] | 0.92 [0.79, 0.98] | 0.9091 | 0.7447 | 9.0476 | 0.3102 | 0.5250 | 29.16 |
| Karayilmaz and Kirzioğlu, 2011 [10] | 54 | 0 | 5 | 0 | 0.92 [0.81, 0.97] | Not estimable | 1.0000 | 0.0000 | - | - | 1.0000 | - | |
| Dastmalchi et al., 2012 [11] | 2 | 6 | 7 | 9 | 0.22 [0.03, 0.60] | 0.60 [0.32, 0.84] | 0.2500 | 0.5625 | 0.5556 | 1.2963 | 0.3750 | 0.43 | |
| Sharma et al., 2015 [27] | 35 | 5 | 6 | 4 | 0.85 [0.71, 0.94] | 0.44 [0.14, 0.79] | 0.8750 | 0.4000 | 1.5366 | 0.3293 | 0.8200 | 4.66 | |
| Ajitha et al., 2020 [29] | 30 | 13 | 9 | 27 | 0.77 [0.61, 0.89] | 0.68 [0.51, 0.81] | 0.6977 | 0.7500 | 2.3669 | 0.3419 | 0.4937 | 6.92 | |
| Total pooled estimates | 151 | 27 | 39 | 75 | 0.79 [0.73, 0.85] | 0.74 [0.64, 0.82] | 0.8483 | 0.6579 | 3.0023 | 0.2792 | 0.650 | 10.75 | |
| CT | Gopikrishna et al., 2007 [7] | 34 | 3 | 8 | 35 | 0.81 [0.66, 0.91] | 0.92 [0.79, 0.98] | 0.9189 | 0.8140 | 10.2540 | 0.2068 | 0.5250 | 49.58 |
| Dastmalchi et al., 2012 [11] | 6 | 7 | 3 | 8 | 0.67 [0.30, 0.93] | 0.53 [0.27, 0.79] | 0.4615 | 0.7273 | 1.4286 | 0.6250 | 0.3750 | 2.28 | |
| Ajitha et al., 2020 [29] | 31 | 7 | 8 | 33 | 0.79 [0.64, 0.91] | 0.82 [0.67, 0.93] | 0.8158 | 0.8049 | 4.5421 | 0.2486 | 0.4937 | 18.27 | |
| Total pooled estimates | 71 | 17 | 19 | 76 | 0.79 [0.69, 0.87] | 0.82 [0.72, 0.89] | 0.81 | 0.80 | 4.31 | 0.25 | 0.49 | 17.24 | |
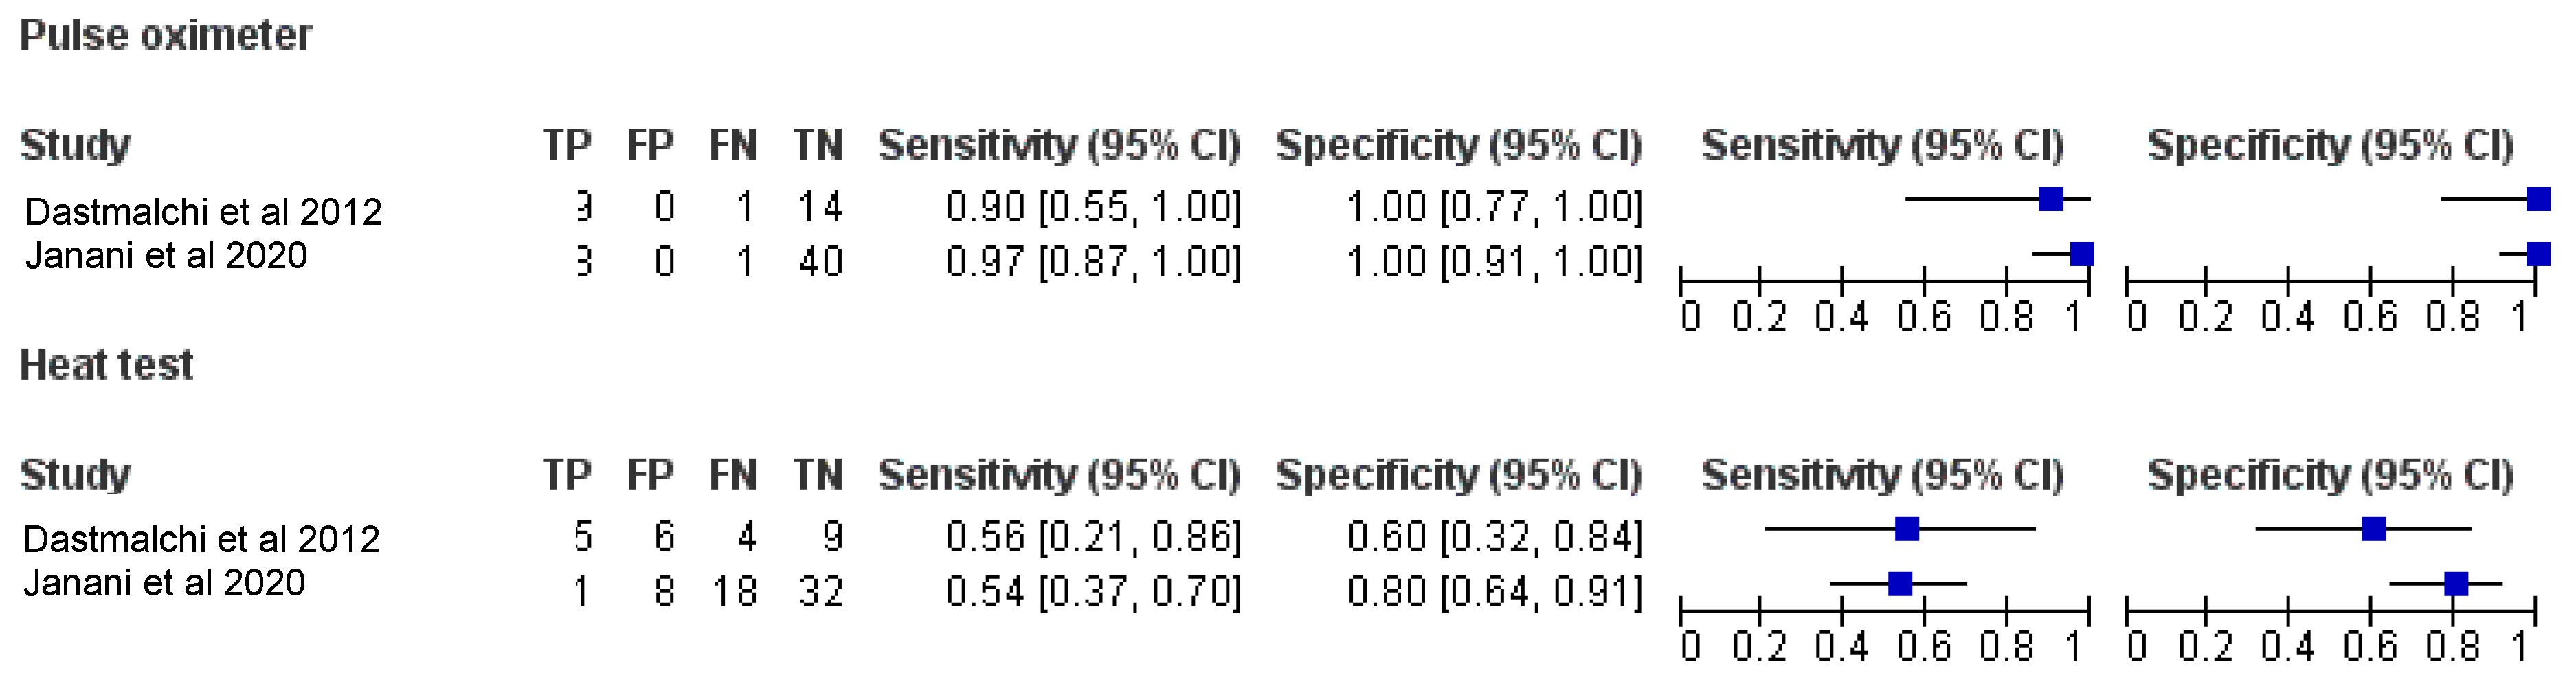
| HT | Dastmalchi et al., 2012 [11] | 5 | 6 | 4 | 9 | 0.56 [0.21, 0.86] | 0.60 [0.32, 0.84] | 0.4545 | 0.6923 | 1.3889 | 0.7407 | 0.3750 | 1.87 |
| Ajitha et al., 2020 [29] | 21 | 8 | 18 | 32 | 0.54 [0.37, 0.70] | 0.80 [0.64, 0.91] | 0.7241 | 0.6400 | 2.6923 | 0.5769 | 0.4937 | 4.66 | |
| Total pooled estimates | 26 | 14 | 22 | 41 | 0.54 [0.39, 0.69] | 0.75 [0.61, 0.85] | 0.65 | 0.65 | 2.12 | 0.61 | 0.46 | 3.47 |
Publisher’s Note: MDPI stays neutral with regard to jurisdictional claims in published maps and institutional affiliations. |
© 2022 by the authors. Licensee MDPI, Basel, Switzerland. This article is an open access article distributed under the terms and conditions of the Creative Commons Attribution (CC BY) license (https://creativecommons.org/licenses/by/4.0/).
Share and Cite
Patro, S.; Meto, A.; Mohanty, A.; Chopra, V.; Miglani, S.; Das, A.; Luke, A.M.; Hadi, D.A.; Meto, A.; Fiorillo, L.; et al. Diagnostic Accuracy of Pulp Vitality Tests and Pulp Sensibility Tests for Assessing Pulpal Health in Permanent Teeth: A Systematic Review and Meta-Analysis. Int. J. Environ. Res. Public Health 2022, 19, 9599. https://doi.org/10.3390/ijerph19159599
Patro S, Meto A, Mohanty A, Chopra V, Miglani S, Das A, Luke AM, Hadi DA, Meto A, Fiorillo L, et al. Diagnostic Accuracy of Pulp Vitality Tests and Pulp Sensibility Tests for Assessing Pulpal Health in Permanent Teeth: A Systematic Review and Meta-Analysis. International Journal of Environmental Research and Public Health. 2022; 19(15):9599. https://doi.org/10.3390/ijerph19159599
Chicago/Turabian StylePatro, Swadheena, Agron Meto, Ankita Mohanty, Viresh Chopra, Sanjay Miglani, Antarikshya Das, Alexander Maniangat Luke, Dunia Al Hadi, Aida Meto, Luca Fiorillo, and et al. 2022. "Diagnostic Accuracy of Pulp Vitality Tests and Pulp Sensibility Tests for Assessing Pulpal Health in Permanent Teeth: A Systematic Review and Meta-Analysis" International Journal of Environmental Research and Public Health 19, no. 15: 9599. https://doi.org/10.3390/ijerph19159599
APA StylePatro, S., Meto, A., Mohanty, A., Chopra, V., Miglani, S., Das, A., Luke, A. M., Hadi, D. A., Meto, A., Fiorillo, L., Karobari, M. I., Wahjuningrum, D. A., & Pawar, A. M. (2022). Diagnostic Accuracy of Pulp Vitality Tests and Pulp Sensibility Tests for Assessing Pulpal Health in Permanent Teeth: A Systematic Review and Meta-Analysis. International Journal of Environmental Research and Public Health, 19(15), 9599. https://doi.org/10.3390/ijerph19159599