
The Real-World Effects of Route Familiarity on Drivers’ Eye Fixations at Urban Intersections in Changsha, China


Abstract
:1. Introduction
- (a)
- A summary of the effect of drivers’ familiarity on their visual attention at urban intersections in Changsha, China;
- (b)
- Analysis of the mechanism of traffic accidents at intersections;
- (c)
- The conclusion that, by taking drivers’ route familiarity into account on roads where intelligent vehicles and ordinary vehicles are mixed, intelligent vehicles’ control decisions can contribute to road traffic safety and enable the anthropomorphic pace of intelligent vehicles to increase.
2. Methods
2.1. Design
2.2. Participants
2.3. Apparatus
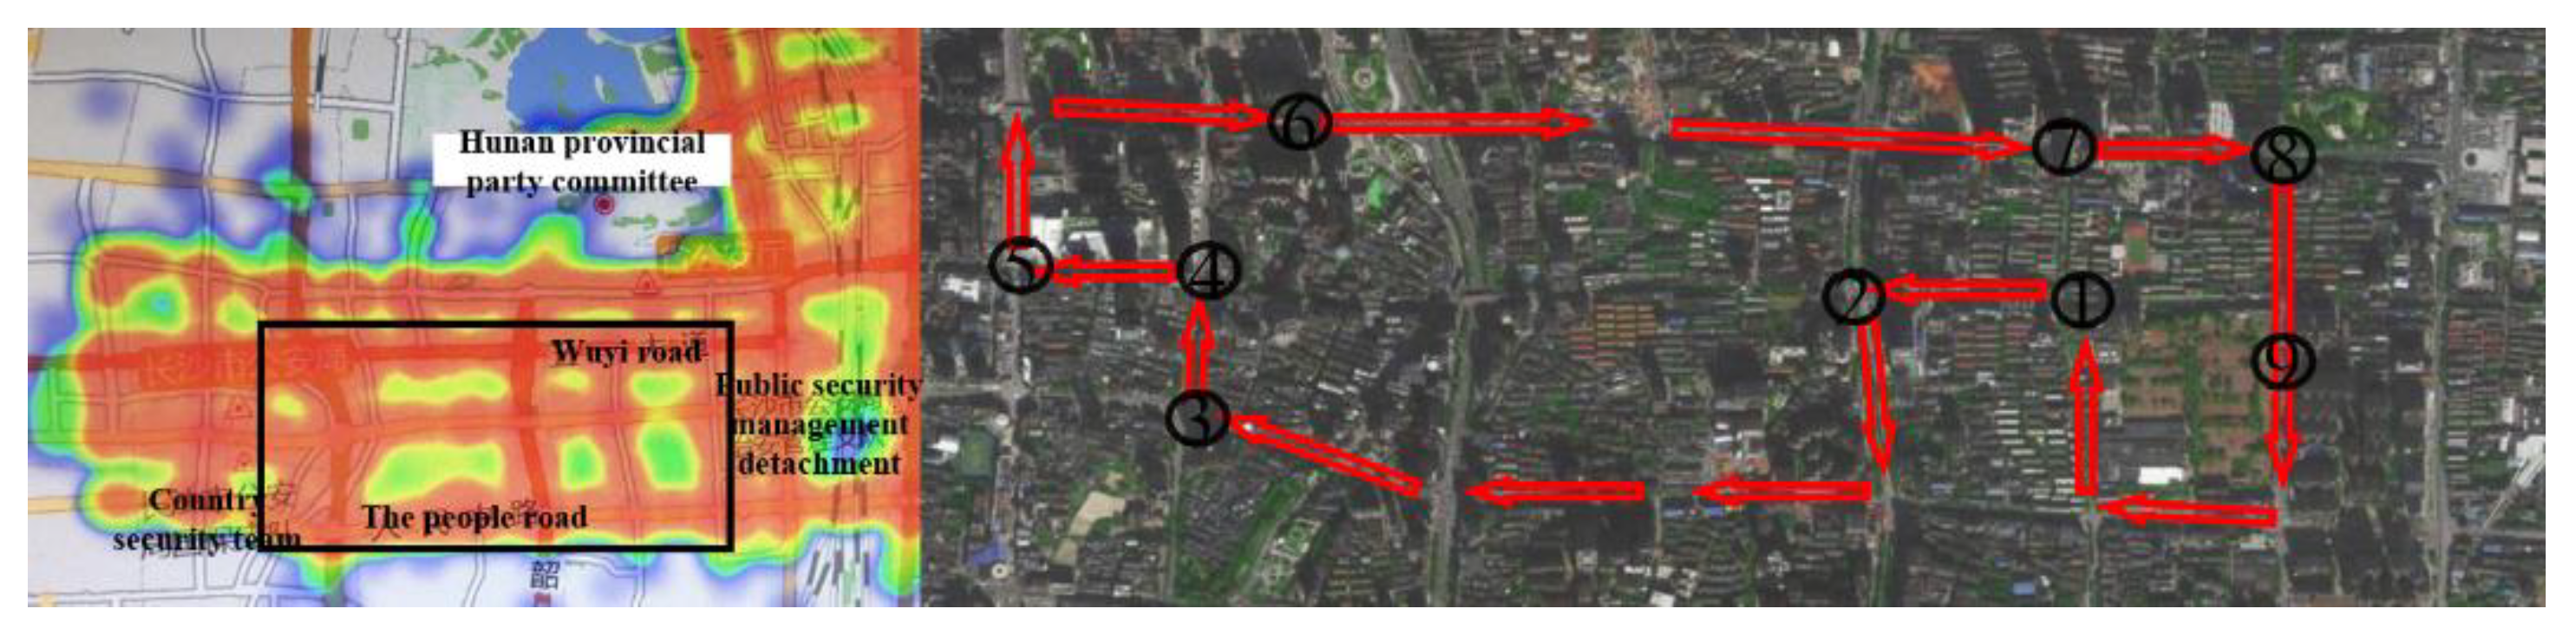
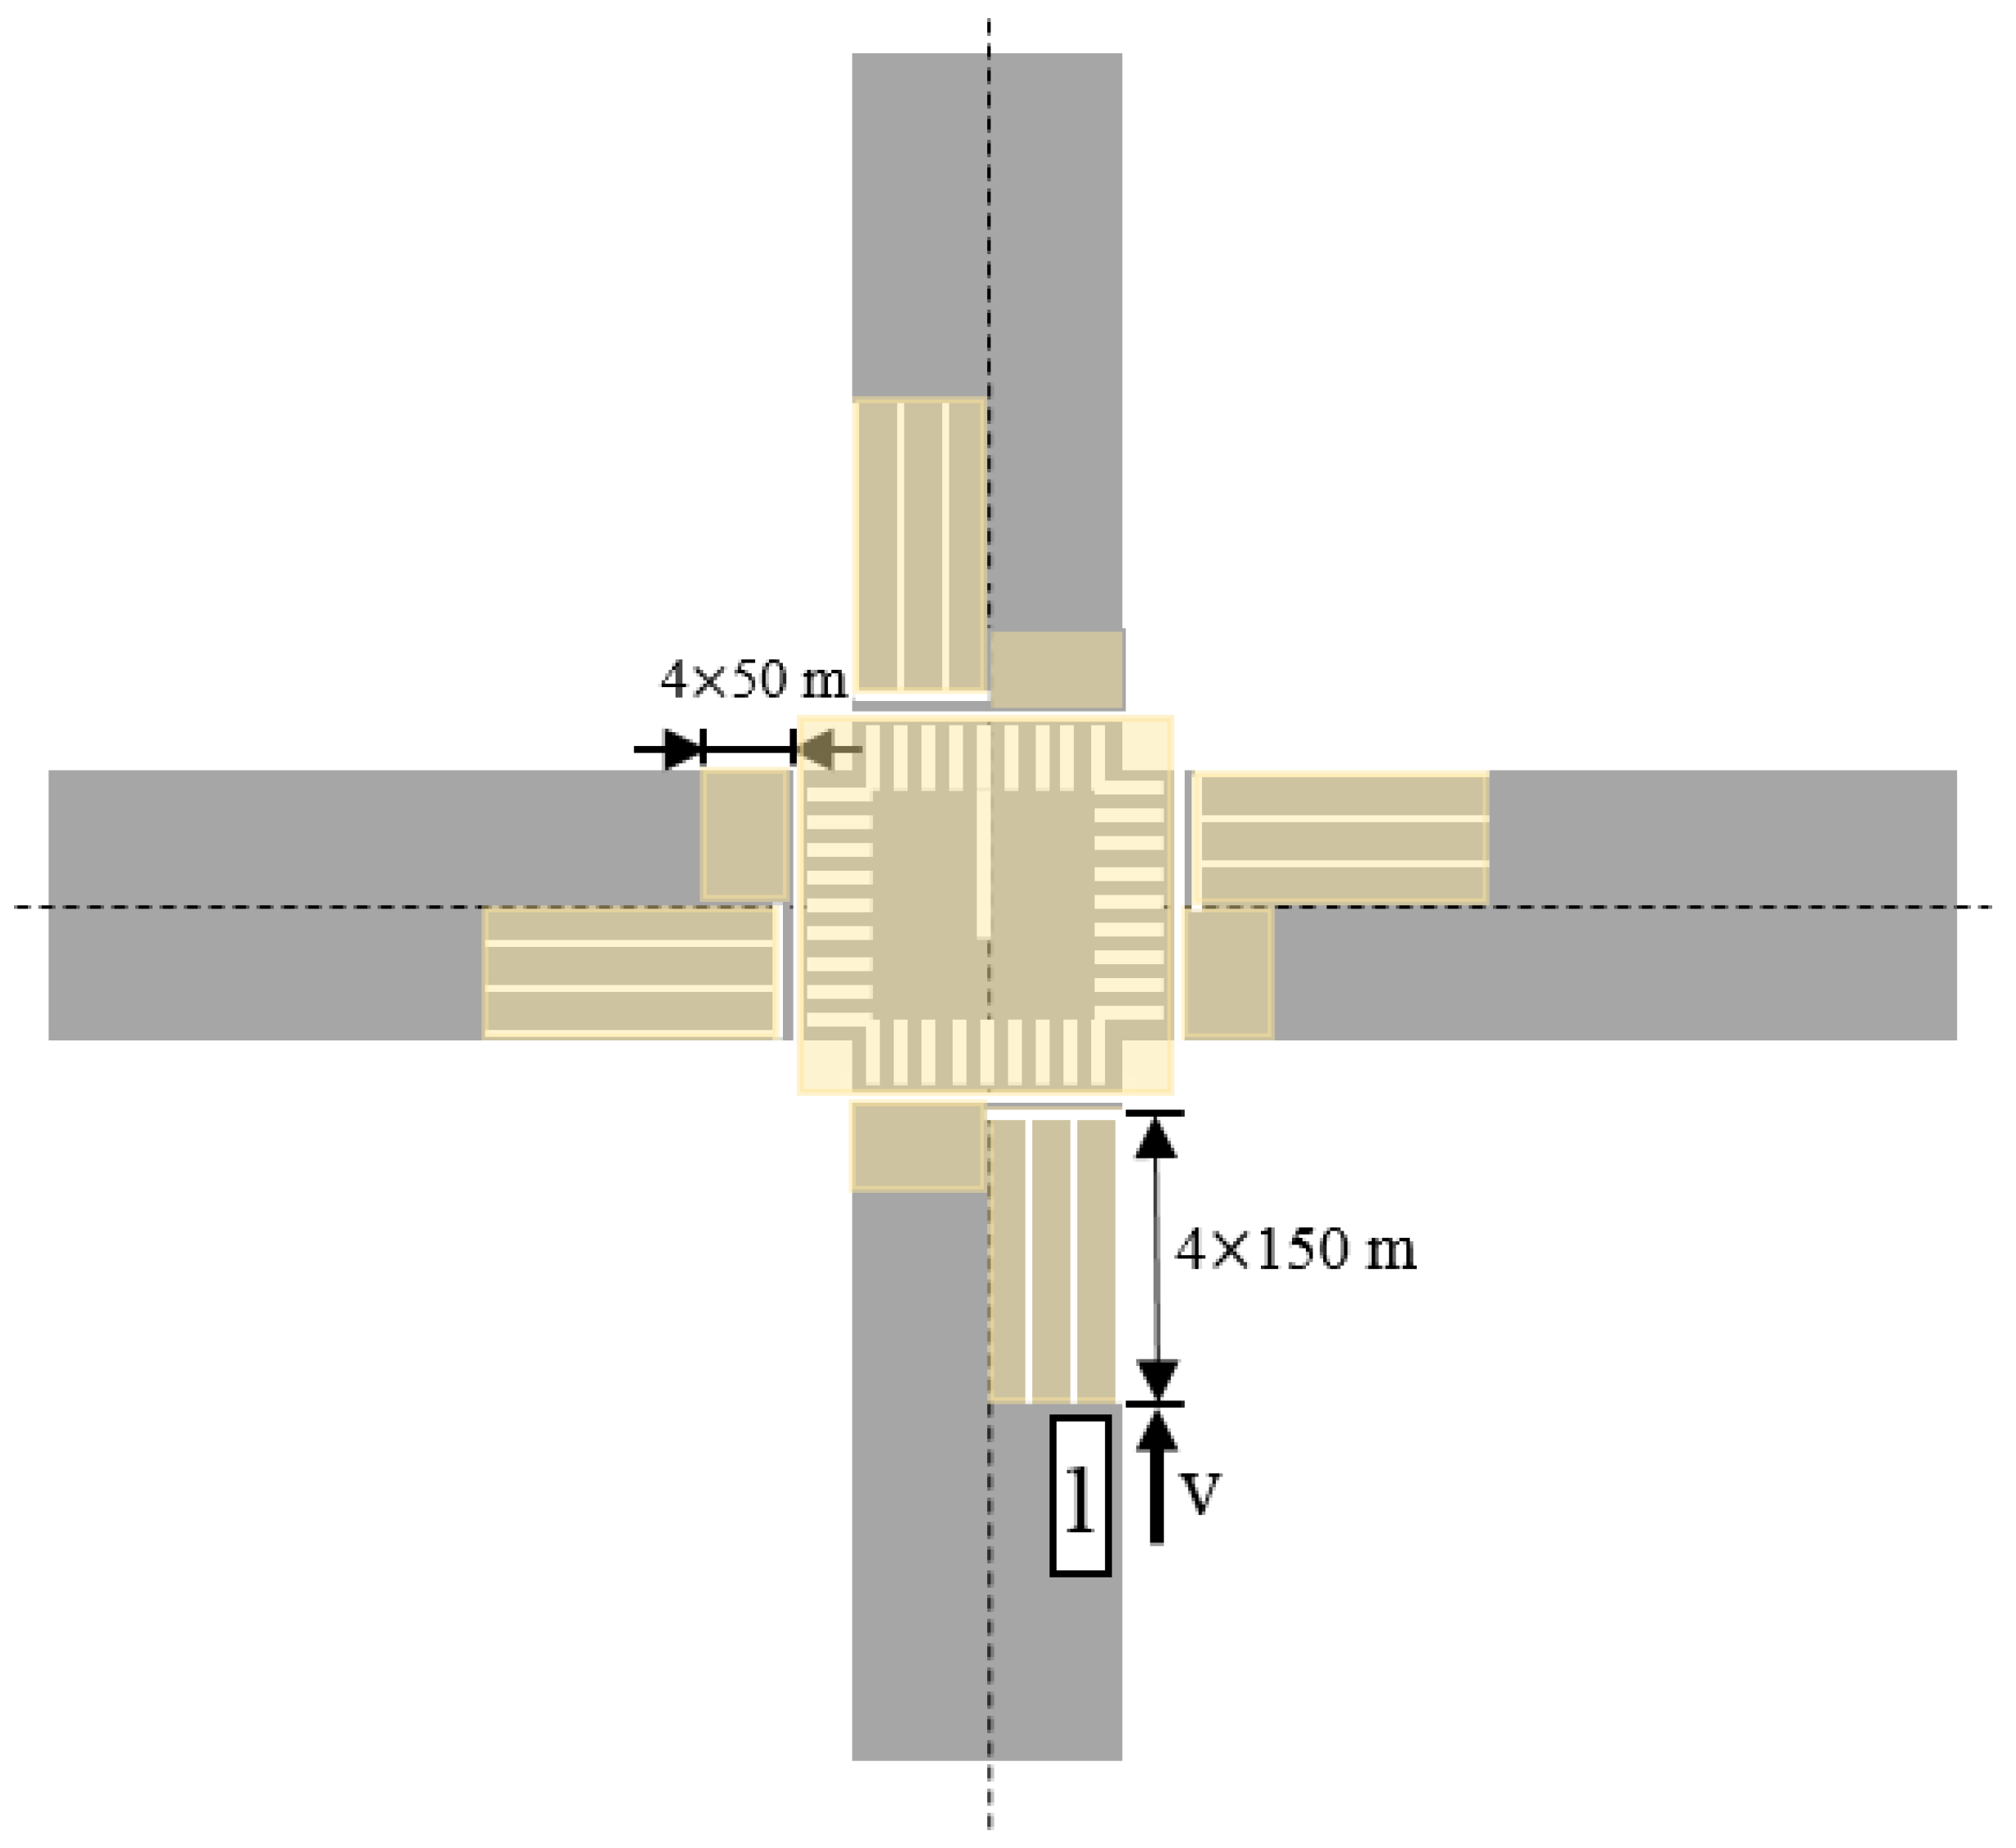
2.4. Experimental Route
2.5. Procedure
2.6. Data Collection and Reduction
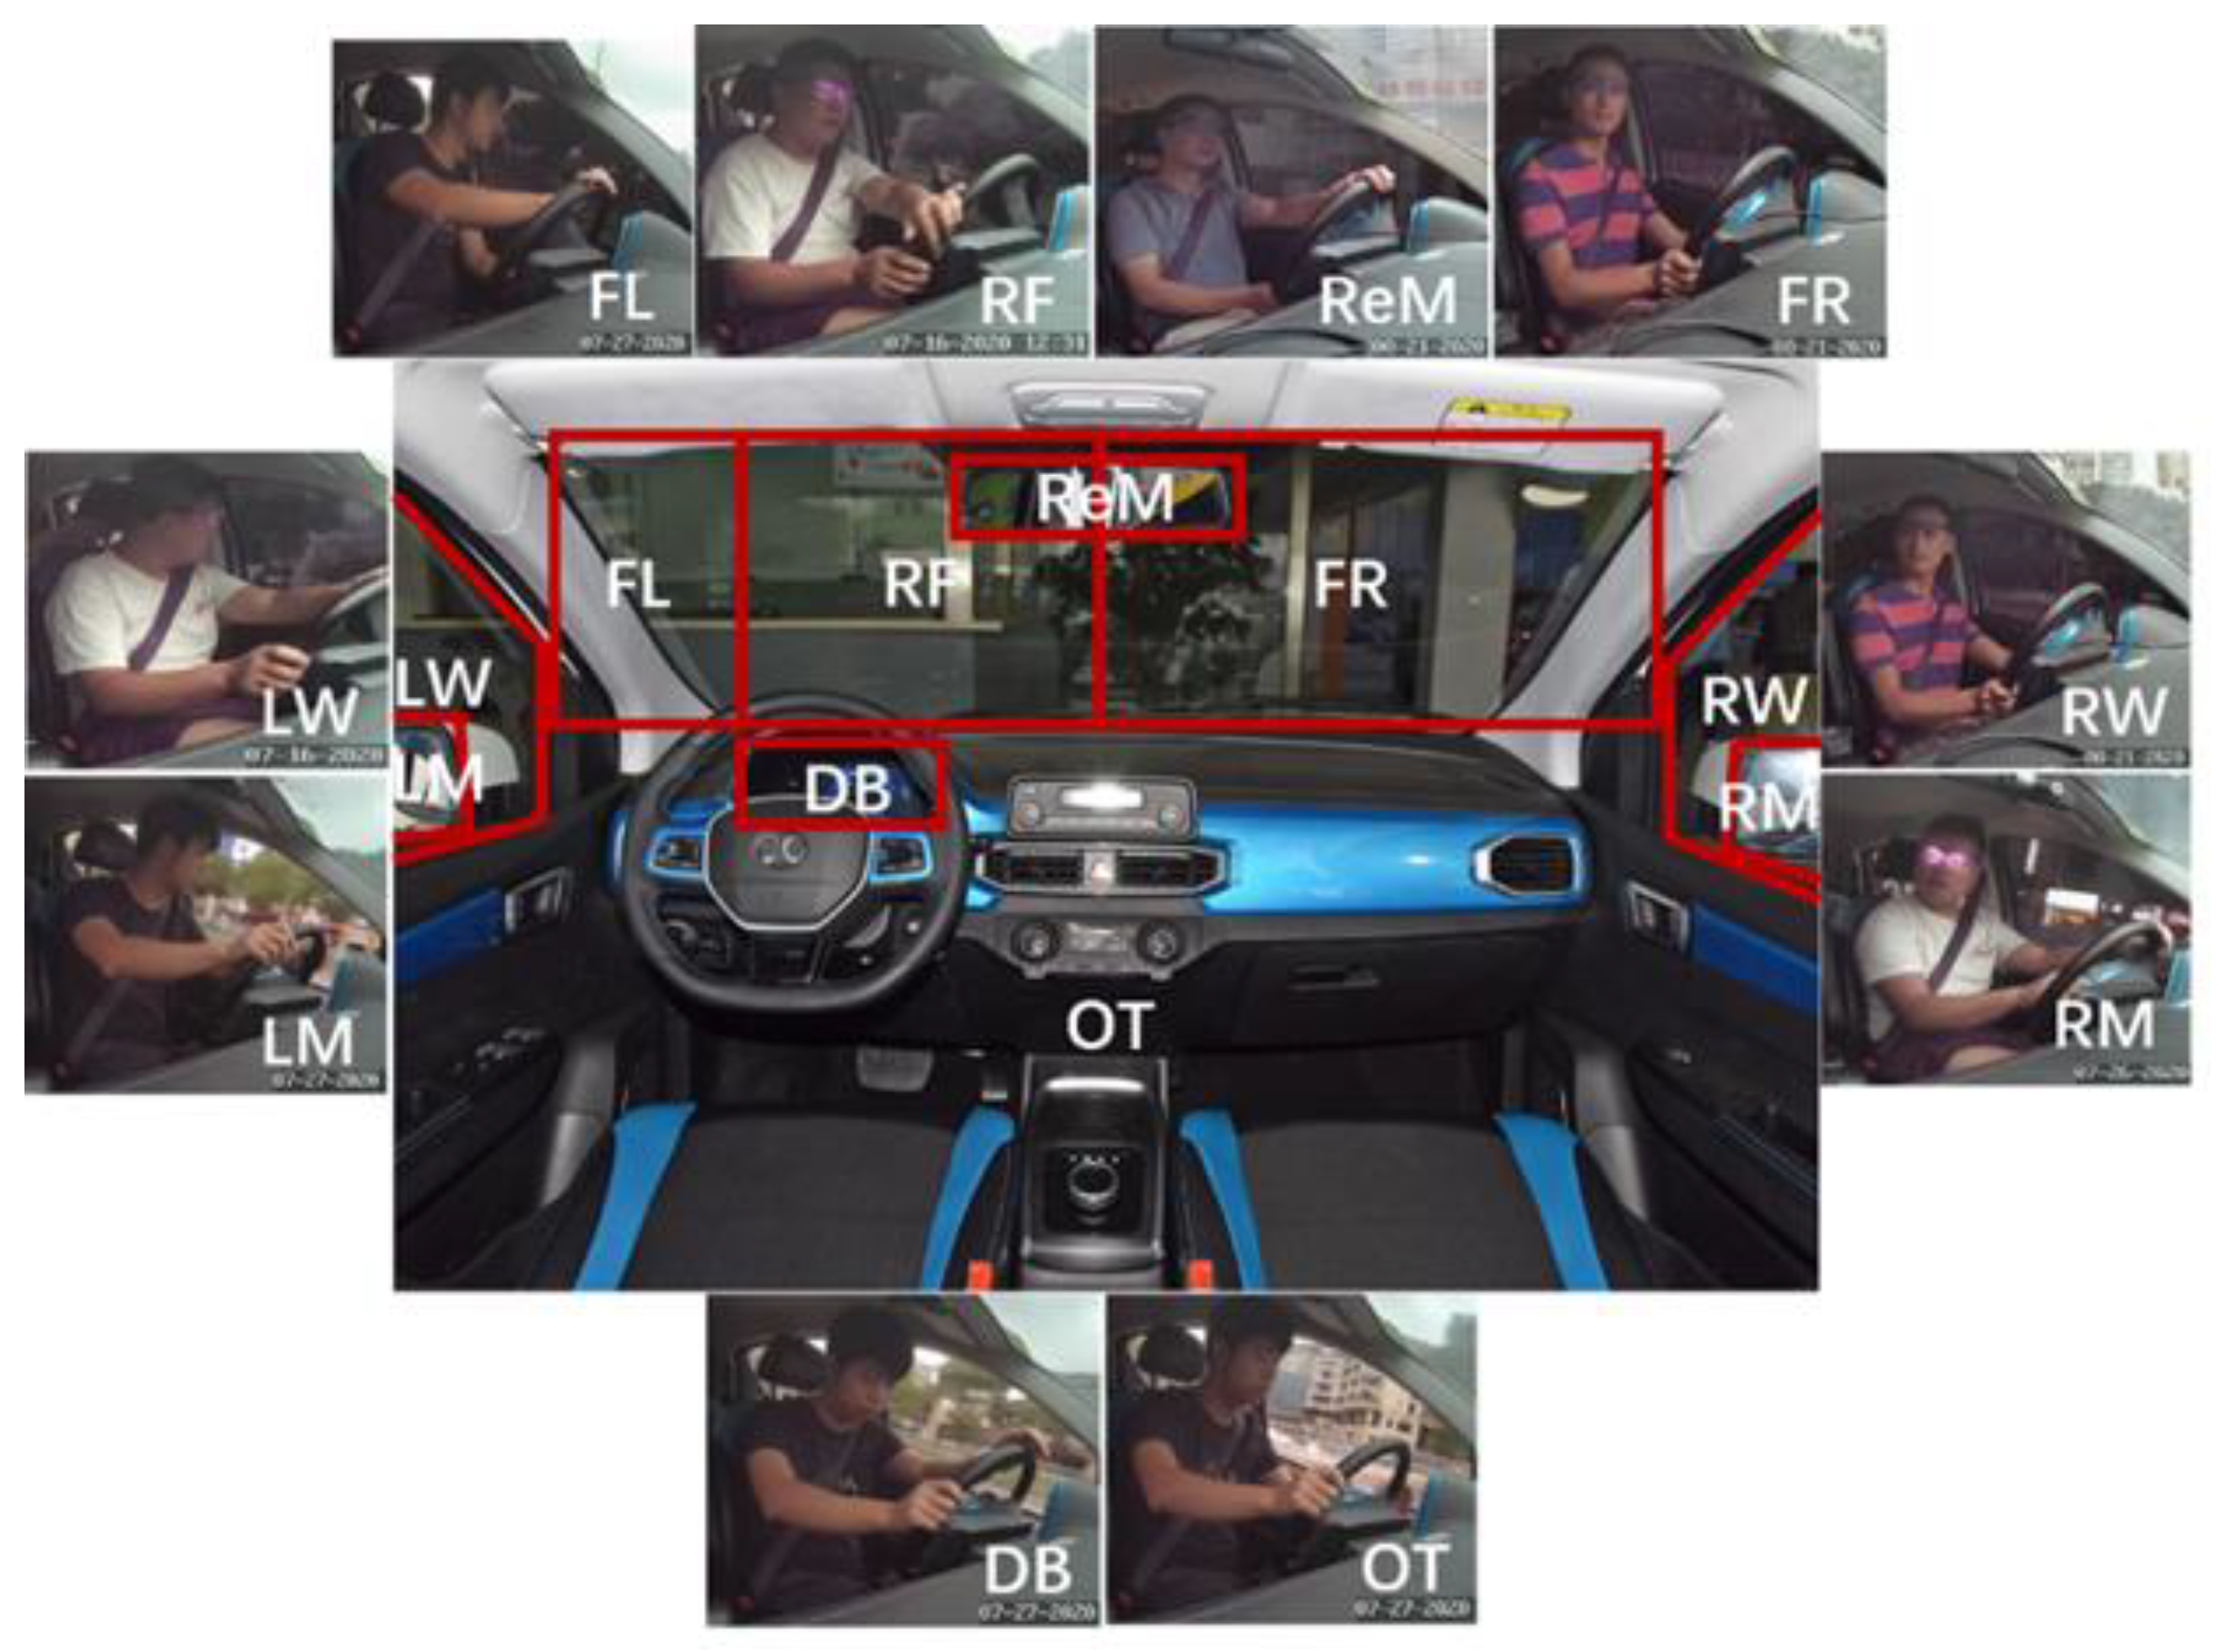
2.7. Visual Fixation Measures
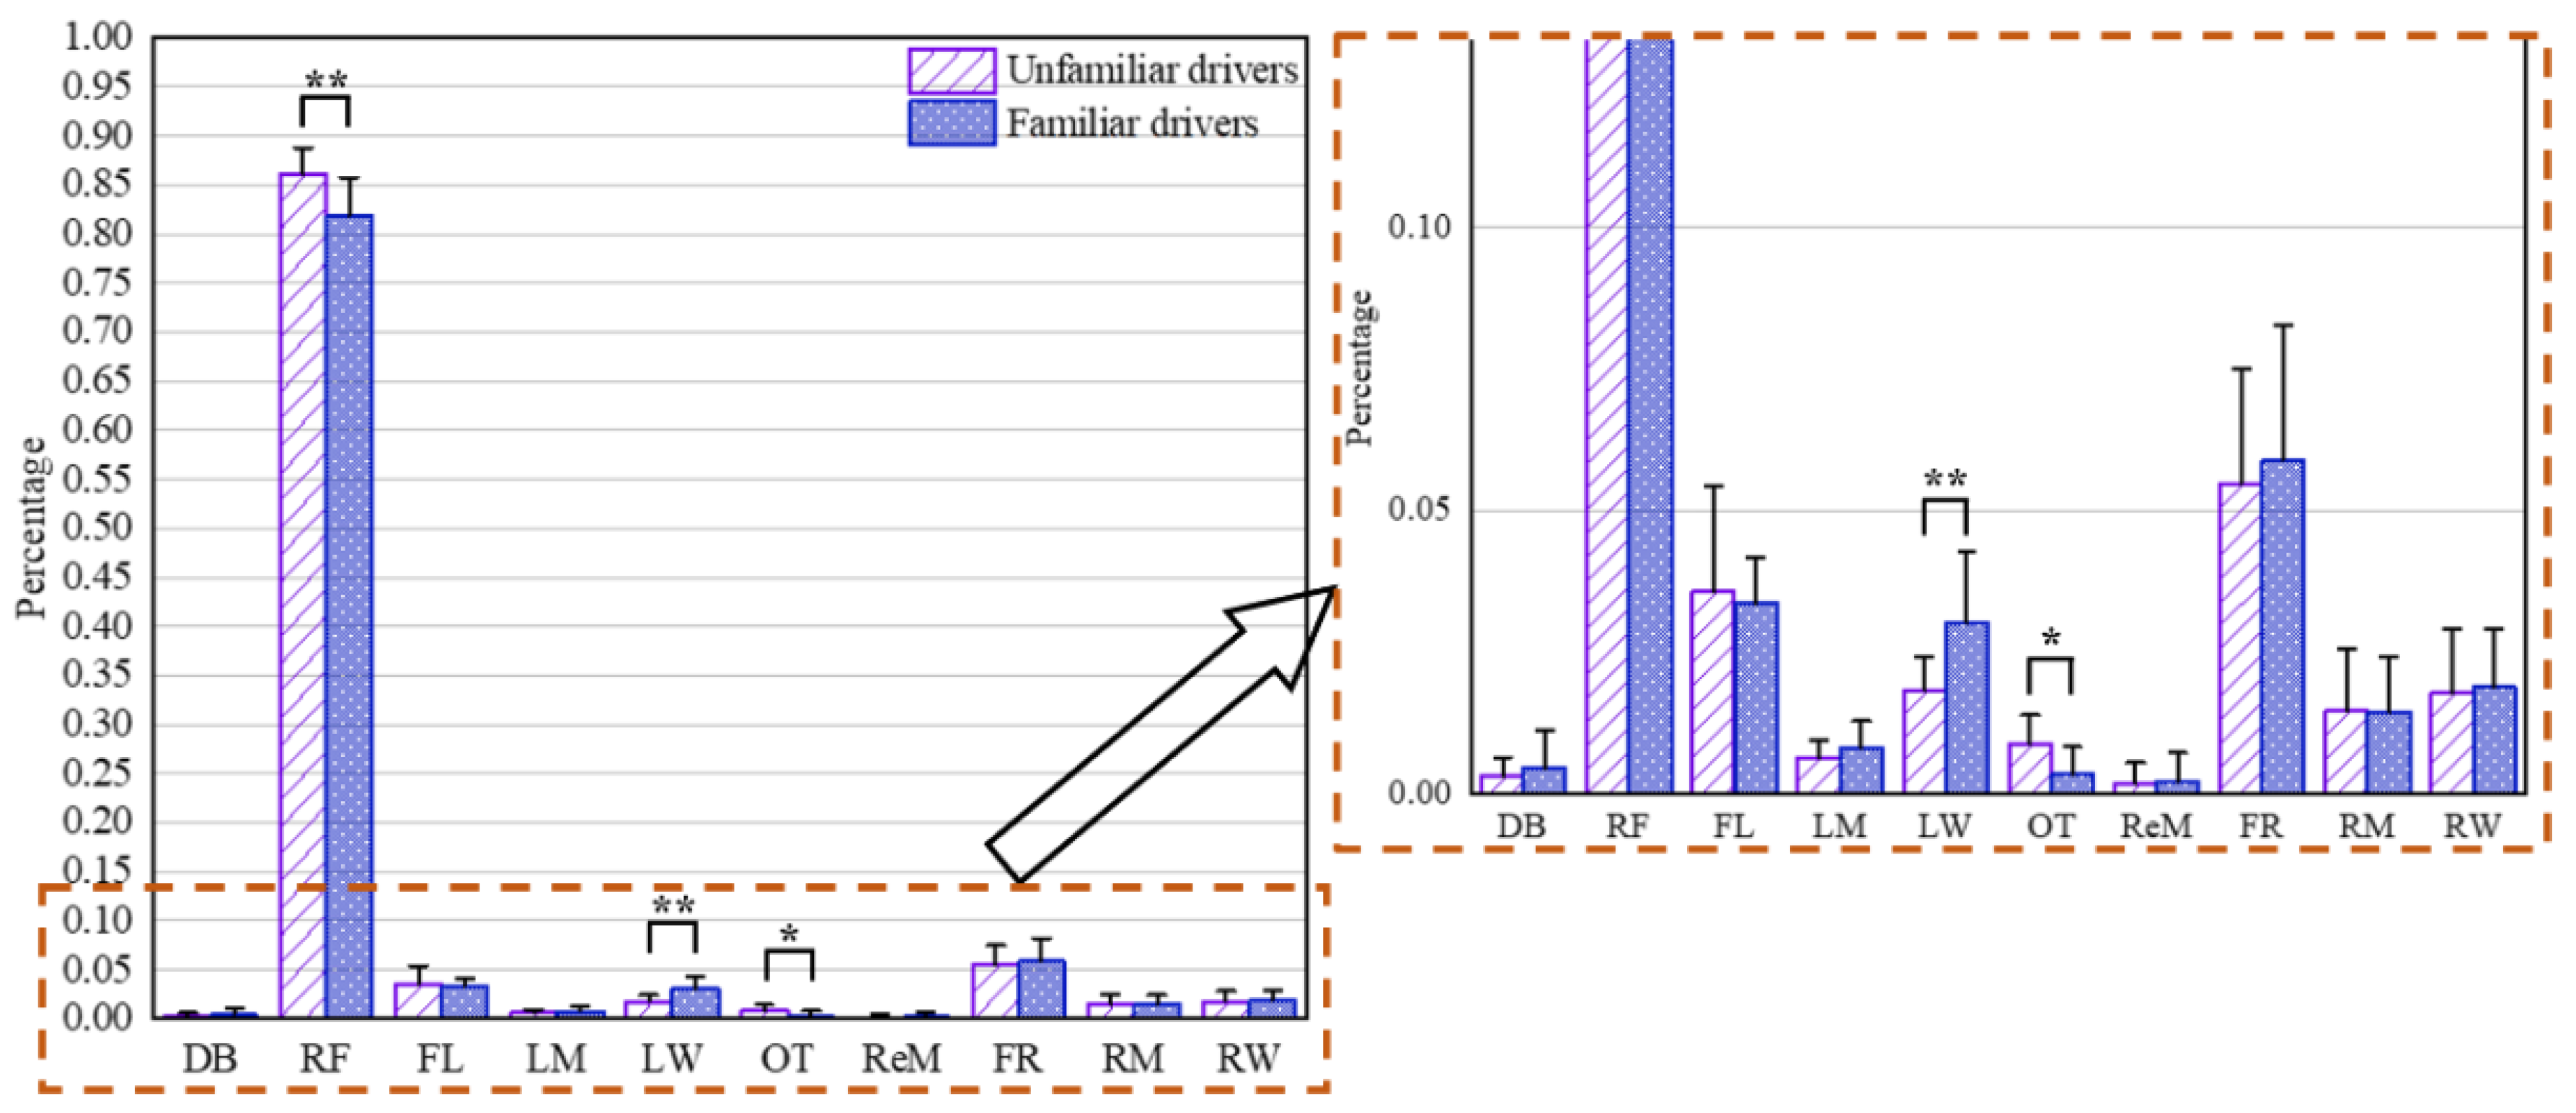
3. Results
4. Discussion
5. Conclusions
Author Contributions
Funding
Institutional Review Board Statement
Informed Consent Statement
Data Availability Statement
Acknowledgments
Conflicts of Interest
References
- Harms, I.M.; Burdett, B.R.D.; Charlton, S.G. The role of route familiarity in traffic participants’ behavior and transport psychology research: A systematic review. Transp. Res. Interdiscip. Perspect. 2021, 9, 100331. [Google Scholar]
- Kocatepe, A.; Ulak, M.B.; Ozguven, E.E.; Horner, M.W.; Arghandeh, R. Socioeconomic Characteristics and Crash Injury Exposure: A Case Study in Florida Using Two-step Floating Catchment Area Method. Appl. Geogr. 2017, 87, 207–221. [Google Scholar] [CrossRef]
- Lee, J.; Abdel-Aty, M.; Choi, K. Analysis of Residence Characteristics of At-fault Drivers in traffic crashes. Saf. Sci. 2014, 68, 6–13. [Google Scholar] [CrossRef]
- Thompson, C.; Sabik, M. Allocation of Attention in Familiar and Unfamiliar Traffic Scenarios. Transp. Res. F Traffic Psychol. Behav. 2018, 55, 188–198. [Google Scholar] [CrossRef]
- Young, A.H.; Mackenzie, A.K.; Davies, R.L.; Crundall, D. Familiarity Breeds Contempt for the Road Ahead: The Real-world Effects of Route Repetition on Visual Attention in an Expert Driver. Transp. Res. F Traffic Psychol. Behav. 2018, 57, 4–9. [Google Scholar] [CrossRef] [Green Version]
- Colonna, P.; Intini, P.; Berloco, N.; Perruccio, A.; Ranieri, V. Repeated Measurements of Lateral Position and Speed at Horizontal Curves on Very-Low Volume Rural Road. In Proceedings of the Transportation Research Board 2016 Annual Meeting, Washington, DC, USA, 10–14 January 2016. [Google Scholar]
- Intini, P.; Berloco, N.; Colonna, P.; Ottersland Granås, S.; Olaussen Ryeng, E. Influence of Road Geometric Design Consistency on Familiar and Unfamiliar Drivers’ Performances: Crash-Based Analysis. Transp. Res. Rec. 2019, 2673, 489–500. [Google Scholar] [CrossRef]
- Colonna, P.; Berloco, N.; Intini, P.; Ranieri, V. Route Familiarity in Road Safety: Speed Choice and Risk Perception Based on an On-Road Study. In Proceedings of the Transportation Research Board 94th Annual Meeting, Washington, DC, USA, 11–15 January 2015. [Google Scholar]
- Wen, H.Y.; Xue, G. Exploring the relationships between single-vehicle traffic accident and driver’s route familiarity on the mountainous highways. Cogn. Technol. Work 2020, 22, 815–824. [Google Scholar] [CrossRef]
- Harms, I.M.; Brookhuis, K.A. Dynamic traffic management on a familiar road: Failing to detect changes in variable speed limits. Transp. Res. F Traffic Psychol. Behav. 2016, 38, 37–46. [Google Scholar] [CrossRef] [Green Version]
- Martens, M.H. The failure to respond to changes in the road environment: Does route familiarity play a role? Transp. Res. F Traffic Psychol. Behav. 2018, 57, 23–35. [Google Scholar] [CrossRef]
- Seeherman, J.; Skabardonis, A. Rethinking the Driver Population Factor. Transp. Res. Rec. J. Transp. Res. Board 2013, 2395, 103–110. [Google Scholar] [CrossRef]
- Yanko, M.R.; Spalek, T.M. Route familiarity breeds inattention: A driving simulator study. Accid. Anal. Prev. 2013, 57, 80–86. [Google Scholar] [CrossRef] [PubMed]
- Intini, P.; Berloco, N.; Colonna, P.; Ranieri, V.; Ryeng, E. Exploring the relationships between drivers’ familiarity and two-lane rural road accidents. A multi-level study. Accid. Anal. Prev. 2018, 111, 280–296. [Google Scholar] [CrossRef]
- Intini, P.; Colonna, P.; Berloco, N.; Ranieri, V. Measuring trade-offs between risk and travel time based on experimental speed data. In Advances in Human Aspects of Transportation; Advances in Intelligent Systems and Computing; Springer: Cham, Switzerland, 2017; Volume 484, pp. 1103–1116. [Google Scholar]
- Noland, R.B. From theory to practice in road safety policy: Understanding risk versus mobility. Res. Transp. Econ. 2013, 43, 71–84. [Google Scholar] [CrossRef]
- Moors, A.; Houwer, D.J. Automaticity: A conceptual and theoretical analysis. Psychol. Bull. 2006, 132, 297–326. [Google Scholar] [CrossRef] [PubMed] [Green Version]
- Rosenbloom, T.; Perlman, A.; Shahar, A. Women drivers’ behavior in well-known versus less familiar locations. J. Saf. Res. 2007, 38, 283–288. [Google Scholar] [CrossRef] [PubMed]
- Hurtado, S.; Chiasson, S. An Eye-tracking Evaluation of Driver Distraction and Unfamiliar Road Signs. In Proceedings of the 8th International Conference on Automotive User Interfaces and Interactive Vehicular Applications, Ann Arbor, MI, USA, 24–26 October 2016. [Google Scholar]
- Babic, D.; Babic, D.; Šcukanec, A. The Impact of Route familiarity on the Perception of Traffic Signs–Eye Tracking Case Study. In Proceedings of the Environmental Engineering 10th International Conference, Vilnius, Lithuania, 27–28 April 2017. [Google Scholar]
- Martens, M.H.; Fox, M. Does route familiarity change eye fixations? A comparison between watching a video and real driving. Transp. Res. F Traffic Psychol. Behav. 2007, 10, 33–47. [Google Scholar] [CrossRef]
- Hu, Y.Q.; Liu, H.X.; Zhu, T. Influence of spatial visual conditions in tunnel on driver behavior: Considering the route familiarity of drivers. Traffic Saf. Intell. Transp. Syst. 2019, 11, 1687814019853661. [Google Scholar] [CrossRef] [Green Version]
- Hu, L.; Ou, J.; Huang, J.; Wang, F.; Wang, Y.X.; Ren, B.; Peng, H.; Zhou, L. Safety Evaluation of Pedestrian-Vehicle Interaction at Signalized Intersections in Changsha, China. J. Transp. Saf. Secur. 2021, 1–26. [Google Scholar] [CrossRef]
- Li, G.; Wang, Y.; Zhu, F.; Sui, X.; Wang, N.; Qu, X.; Green, P. Drivers’ visual scanning behavior at signalized and unsignalized intersections: A naturalistic driving study in China. J. Saf. Res. 2019, 71, 219–229. [Google Scholar] [CrossRef]
- Gao, K.; Huang, S.; Han, F.; Li, S.; Wu, W.; Du, R. An Integrated Algorithm for Intersection Queue Length Estimation Based on IoT in a Mixed Traffic Scenario. Appl. Sci. 2020, 10, 2078. [Google Scholar] [CrossRef] [Green Version]
- Romoser, M.R.E.; Pollatsek, A.; Fisher, D.L.; Williams, C.C. Comparing the glance patterns of older versus younger experienced drivers: Scanning for hazards while approaching and entering the intersection. Transp. Rescanning F Traffic Psychol. Behav. 2013, 16, 104–116. [Google Scholar] [CrossRef] [PubMed] [Green Version]
- Xue, Z.C.; Gong, W.H.; Yang, B.; Xu, Q.P.; Zhang, L.P.; Shi, L.; Fan, Y.Y.; Ren, Y.Y. Attention allocation features of drivers under common driving behaviors. J. Univ. Jinan (Sci. Technol.) 2018, 32, 469–475. [Google Scholar]
- Huang, H.; Yin, Q.; Schwebel, D.C.; Ning, P.; Hu, G. Availability and consistency of health and non-health data for road traffic fatality: Analysis of data from 195 countries, 1985–2013. Accid. Anal. Prev. 2017, 108, 220–226. [Google Scholar] [CrossRef] [PubMed]
- Hu, L.; Bao, X.Q.; Lin, M.; Yu, C.; Wang, F. Research on risky driving behavior evaluation model based on CIDAS real data. Proc. Inst. Mech. Eng. D J. Automob. Eng. 2021, 235, 2176–2187. [Google Scholar] [CrossRef]
- Yokoya, Y.; Soma, H. Visual information of vehicle velocity acquired by pedestrians involved in road crossing accidents. Accid. Anal. Prev. 2021, 151, 105912. [Google Scholar] [CrossRef]
- Hu, L.; Wu, X.; Huang, J.; Peng, Y.; Liu, W. Investigation of clusters and injuries in pedestrian crashes using GIS in Changsha, China. Saf. Sci. 2020, 127, 104710. [Google Scholar] [CrossRef]
- Chen, Q.; Xie, Y.; Guo, S.; Bai, J.; Shu, Q. Sensing system of environmental perception technologies for driverless vehicle: A review of state of the art and challenges. Sens. Actuators A Phys. 2021, 319, 112566. [Google Scholar] [CrossRef]
- Scott, H.; Hall, L.; Litchfield, D.; Westwood, D. Visual information search in simulated junction negotiation: Gaze transitions of young novice, young experienced and older experienced drivers. J. Saf. Res. 2013, 45, 111–116. [Google Scholar] [CrossRef] [PubMed] [Green Version]
- Roge, J.; Pébayle, T.; Lambilliotte, E.; Spitzenstetter, F.; Giselbrecht, D.; Muzet, A. Influence of age, speed and duration of monotonous driving task in traffic on the driver’s useful visual field. Vis. Res. 2004, 23, 2737–2744. [Google Scholar] [CrossRef] [Green Version]
- Wood, J.; Chaparro, A.; Hickson, L. Interaction between visual status, driver age and distracters on daytime driving performance. Vis. Res. 2009, 17, 2225–2231. [Google Scholar] [CrossRef] [PubMed] [Green Version]
- Anstey, K.J.; Wood, J.; Lord, S.; Walker, J.G. Cognitive, sensory and physical factors enabling driving safety in older adults. Clin. Psychol. Rev. 2005, 25, 45–65. [Google Scholar] [CrossRef] [PubMed]
- Hanson, T.R.; Hildebrand, E. Are rural older drivers subject to low-mileage bias? Accid. Anal. Prev. 2021, 43, 1872–1877. [Google Scholar] [CrossRef]
- Mohammed, H.A.; Hurwitz, D.S.; Macuga, K.L. Drivers’ visual attention during the onset of the circular yellow indication at high-speed signalized intersections. Traffic Inj. Prev. 2020, 21, 259–264. [Google Scholar] [CrossRef] [PubMed]
- Hobbs, F.D.; Richardson, B.D. Traffic Engineering; Scholar’s Press: Beau Bassin, Mauritius, 1971; pp. 1–7. [Google Scholar]
- Babkov, V.F. Road Conditions and Traffic Safety; Mir Publishers: Warsaw, Poland, 1975; pp. 128–145. [Google Scholar]
- Jianqing, W.; Hao, X. The influence of road familiarity on distracted driving activities and driving operation using naturalistic driving study data. Transp. Res. F Traffic Psychol. Behav. 2019, 52, 75–85. [Google Scholar]
- Hu, L.; Hu, X.; Wang, J.; Kuang, A.; Hao, W.; Lin, M. Casualty risk of e-bike rider struck by passenger vehicle using China in-depth accident data. Traffic Inj. Prev. 2020, 21, 283–287. [Google Scholar] [CrossRef]
- Dukic, T.; Broberg, T. Older drivers’ visual search behavior at intersections. Transp. Res. F Traffic Psychol. Behav. 2012, 15, 462–470. [Google Scholar] [CrossRef]
- Martens, M.H.; Fox, M.R.J. Do familiarity and expectations change perception? Drivers’ glances and response to changes. Transp. Res. F Traffic Psychol. Behav. 2007, 10, 476–492. [Google Scholar] [CrossRef]
- Konstantopoulos, P.; Chapman, P.; Crundall, D. Drivers’ visual attention as a function of driving experience and visibility. Using a driving simulator to explore drivers’ eye movements in day, night and rain driving. Accid. Anal. Prev. 2010, 42, 827–834. [Google Scholar] [CrossRef]
- Young, M.; Stanton, N. Malleable attentional resources theory: A new explanation for the effects of mental underload on performance. Hum. Factors 2002, 44, 365–375. [Google Scholar] [CrossRef] [PubMed]
- Burdett, B.R.D.; Starkey, N.J.; Charlton, S.G. The close to home effect in road crashes. Saf. Sci. 2017, 98, 1–8. [Google Scholar] [CrossRef]
- Burdett, B.R.D.; Starkey, N.J.; Charlton, S.G. Characteristics of the Close to Home Crash. Saf. Sci. 2018, 105, 222–227. [Google Scholar] [CrossRef]
- Lian, Y.; Zhang, G.; Lee, J.; Huang, H. Review on big data applications in safety research of intelligent transportation systems and connected/automated vehicles. Accid. Anal. Prev. 2020, 146, 105711. [Google Scholar] [CrossRef] [PubMed]
- Lemonnier, S.; Desire, L.; Bremond, R.; Baccino, T. Drivers’ visual attention: A field study at intersections. Transp. Res. F Traffic Psychol. Behav. 2020, 69, 206–221. [Google Scholar] [CrossRef]
- Xie, K.; Wang, X.; Huang, H.; Chen, X. Corridor-level signalized intersection safety analysis in Shanghai, China using Bayesian hierarchical models. Accid. Anal. Prev. 2013, 50, 25–33. [Google Scholar] [CrossRef]
- Wang, F.; Yin, J.J.; Hu, L.; Wang, M.L.; Liu, X.; Miller, K.; Wittek, A. Should anthropometric differences between the commonly used pedestrian computational biomechanics models and Chinese population be taken into account when predicting pedestrian head kinematics and injury in vehicle collisions in China? Accid. Anal. Prev. 2022, 173, 106718. [Google Scholar] [CrossRef]
- Yu, C.; Wang, F.; Wang, B.Y.; Li, G.B.; Li, F. A Computational Biomechanics Human Body Model Coupling Finite Element and Multi-body Segments for Assessment of Head/Brain Injuries in Car-to-Pedestrian Collisions. Int. J. Environ. Res. Public Health 2020, 17, 492. [Google Scholar] [CrossRef] [PubMed] [Green Version]
- Wang, F.; Wu, J.; Hu, L.; Yu, C.; Wang, B.; Huang, X.; Miller, K.; Wittek, A. Evaluation of the head protection effectiveness of cyclist helmets using full-scale computational biomechanics modelling of cycling accidents. J. Saf. Res. 2022, 80, 109–134. [Google Scholar] [CrossRef] [PubMed]
- Hu, L.; Tian, Q.T.; Zou, C.F.; Huang, J.; Ye, Y.; Wu, X.H. A study on energy distribution strategy of electric vehicle hybrid energy storage system considering driving style based on real urban driving data. Renew. Sustain. Energy Rev. 2022, 162, 112416. [Google Scholar] [CrossRef]


| Type of Drivers | Age (Mean ± SD) | Driving Experience (Mean ± SD) | Number | Driving License | Preliminary Road Familiarity |
|---|---|---|---|---|---|
| Experimental group | 31.12 ± 7.60 | 5.52 ± 2.80 | 12 (9, 3) | √ | at least once a month |
| Control group | 12 (9, 3) | √ | once a year at most |
| Passing Maneuvers | Intersections | Selected Intersections |
|---|---|---|
| Left turn | 3 | 3 |
| Right turn | 7 | 3 |
| Straight across | 11 | 3 |
| Type of Drivers | Preliminary Road Familiarity | Number of Experiments | Data Selected |
|---|---|---|---|
| experimental group | at least once a month | 12 | 12th experiment data |
| control group | once a year at most | 1 | 1st experiment data |
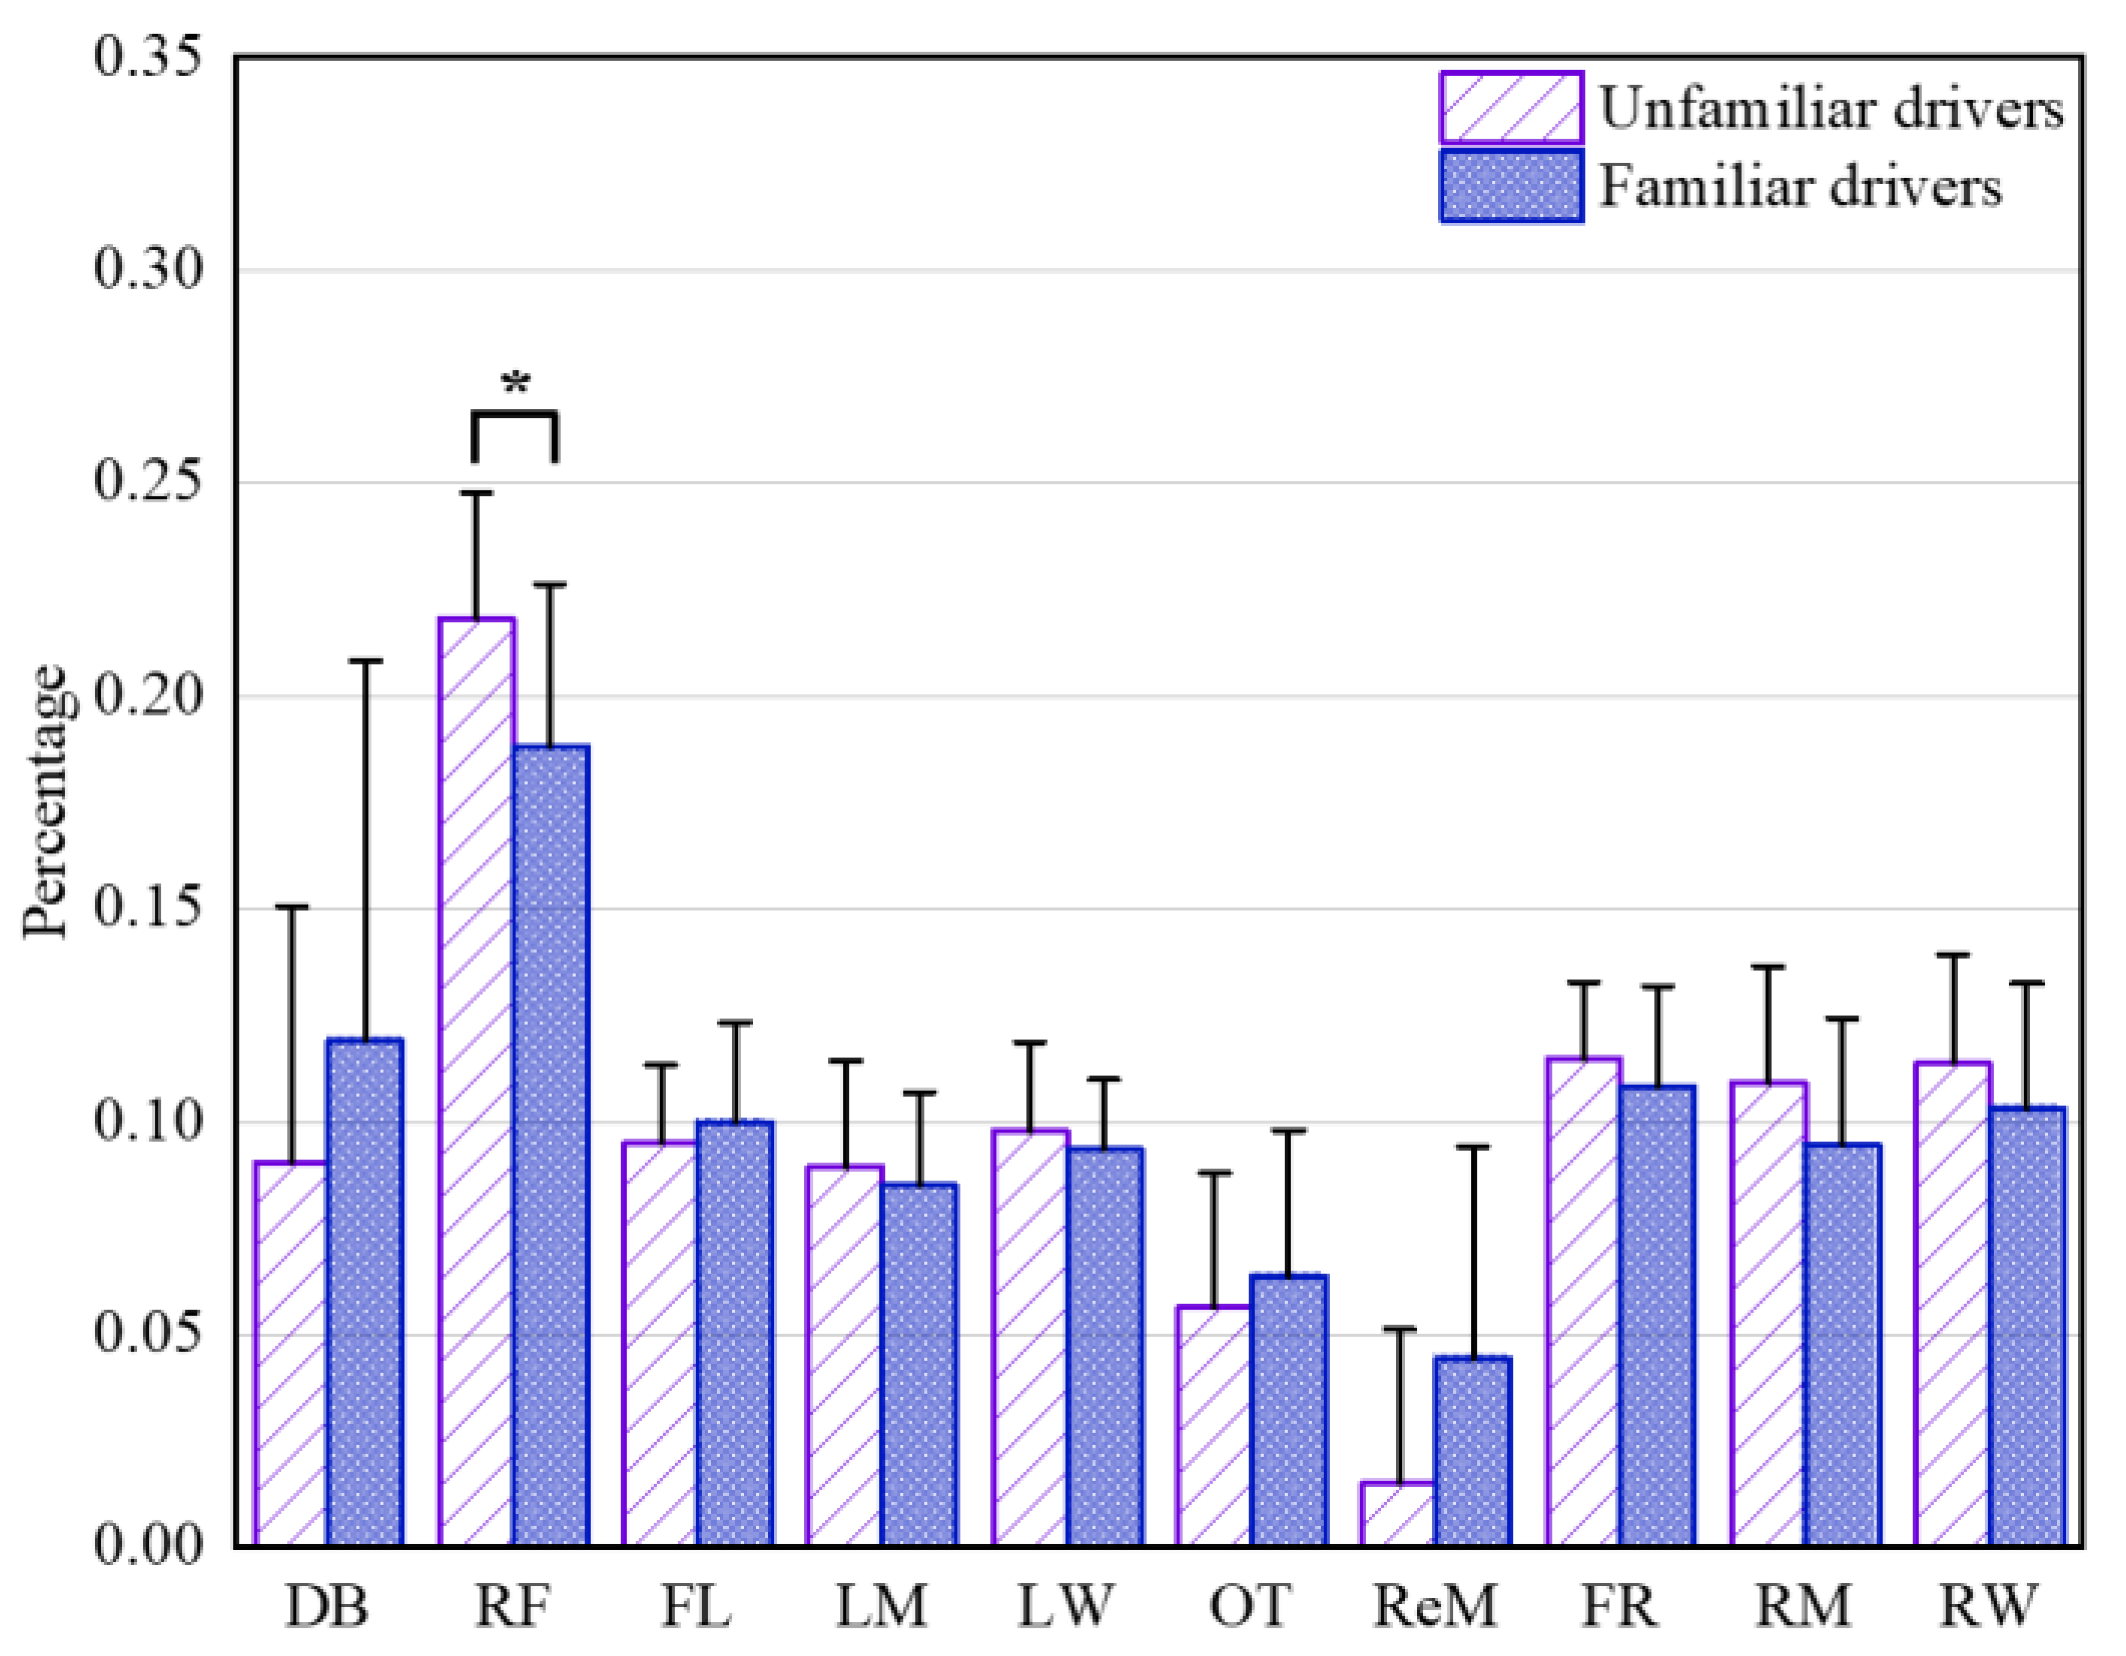
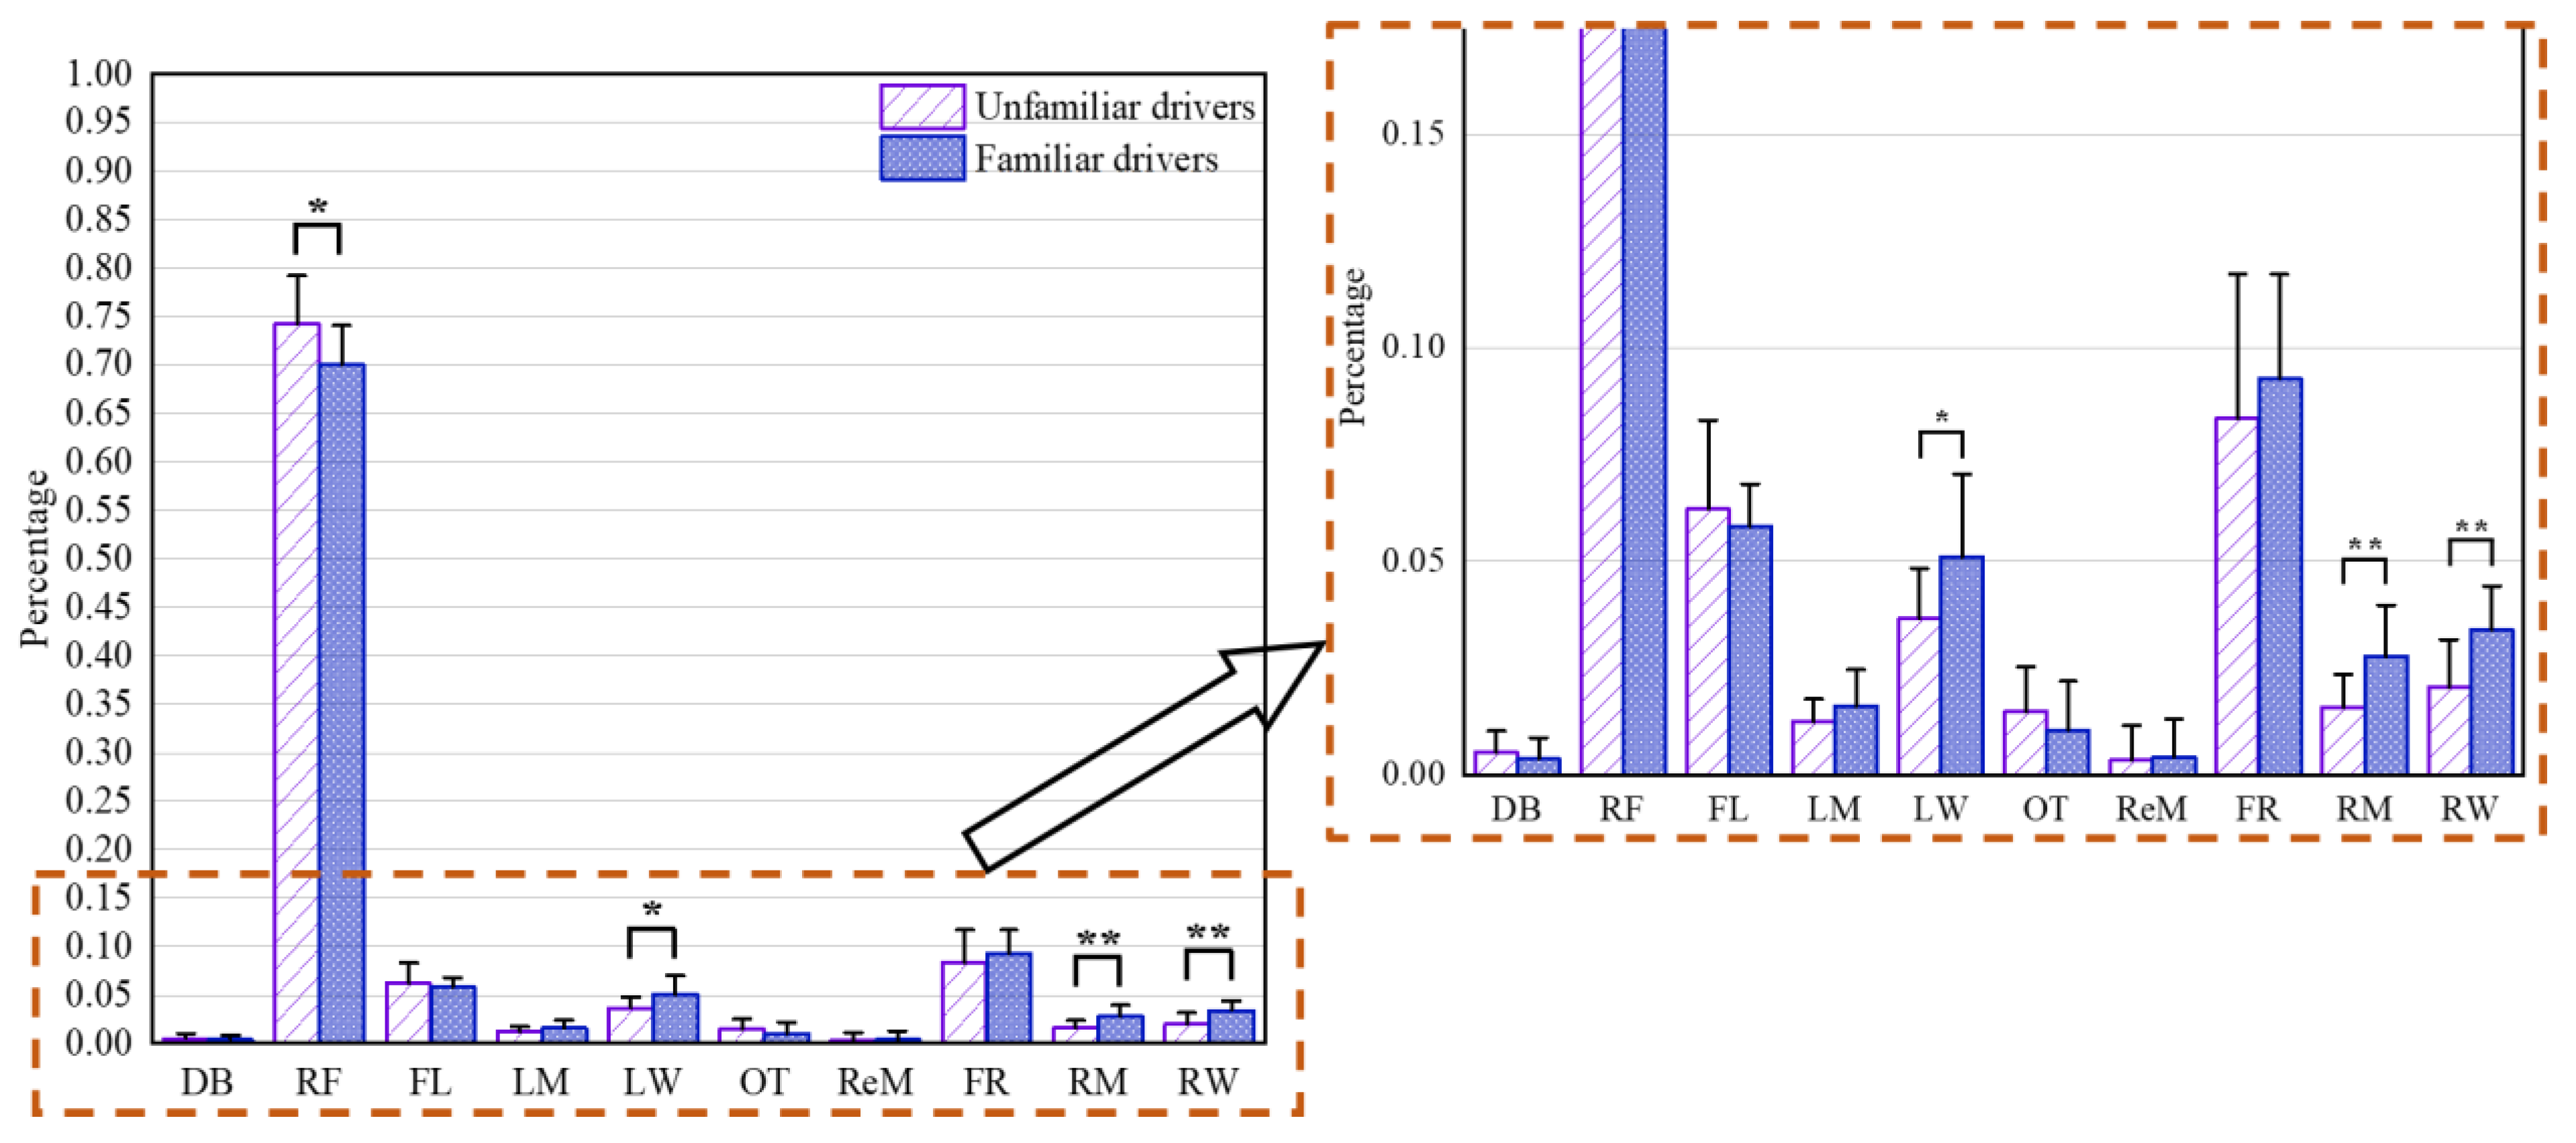
| Area Classification of Driving Scenario | AOIs | TDF | ADF | NF |
|---|---|---|---|---|
| The vehicle’s configurations | DB | - | - | - |
| OT | ||||
| The vehicle’s front | RF | F < U ** | - | F < U ** |
| FL | ||||
| FR | ||||
| The driver’s sides | LW | F > U * | - | F > U ** |
| RW | ||||
| The driver’s rear | LM | - | - | F > U ** |
| RM | ||||
| ReM |
Publisher’s Note: MDPI stays neutral with regard to jurisdictional claims in published maps and institutional affiliations. |
© 2022 by the authors. Licensee MDPI, Basel, Switzerland. This article is an open access article distributed under the terms and conditions of the Creative Commons Attribution (CC BY) license (https://creativecommons.org/licenses/by/4.0/).
Share and Cite
Hu, L.; Guo, G.; Huang, J.; Wu, X.; Chen, K. The Real-World Effects of Route Familiarity on Drivers’ Eye Fixations at Urban Intersections in Changsha, China. Int. J. Environ. Res. Public Health 2022, 19, 9529. https://doi.org/10.3390/ijerph19159529
Hu L, Guo G, Huang J, Wu X, Chen K. The Real-World Effects of Route Familiarity on Drivers’ Eye Fixations at Urban Intersections in Changsha, China. International Journal of Environmental Research and Public Health. 2022; 19(15):9529. https://doi.org/10.3390/ijerph19159529
Chicago/Turabian StyleHu, Lin, Guangtao Guo, Jing Huang, Xianhui Wu, and Kai Chen. 2022. "The Real-World Effects of Route Familiarity on Drivers’ Eye Fixations at Urban Intersections in Changsha, China" International Journal of Environmental Research and Public Health 19, no. 15: 9529. https://doi.org/10.3390/ijerph19159529
APA StyleHu, L., Guo, G., Huang, J., Wu, X., & Chen, K. (2022). The Real-World Effects of Route Familiarity on Drivers’ Eye Fixations at Urban Intersections in Changsha, China. International Journal of Environmental Research and Public Health, 19(15), 9529. https://doi.org/10.3390/ijerph19159529