Abstract
(1) Background: Leaded petrol became a worldwide vehicle fuel during the 20th century. While leaded petrol was totally banned on 30 August 2021, its lead (Pb) dust legacy remains in the environment as soil Pb. The health impacts of Pb are well known and risks occur when exposures are above zero. The inextricable links between air Pb, soil Pb, and blood Pb are not widely A. Exposure risks continue even after banning leaded petrol and must be explored. (2) Methods: This article evaluates selected examples of temporal measurements of atmospheric Pb and human Pb exposure and the effect of soil Pb on blood Pb. Several search engines were used to find articles on temporal changes in air Pb and human Pb exposures. New Orleans studies provided empirical data on the association between soil Pb and blood Pb. (3) Results: Vehicle Pb emission trends are closely associated with air Pb and blood Pb. Air Pb deposited in soil becomes a reservoir of Pb dust that is known to be remobilized into the atmosphere. (4) Conclusions: The dust from leaded petrol continues to pose major exposure risks to humans. Exogenous sources of Pb in soil and its remobilization into air along with endogenous bone Pb establish the baseline exposure of children and adults. Reducing human exposure to Pb requires novel policies to decrease exogenous contact from the reservoir of Pb in soil and curtailing remobilization of soil Pb into the atmosphere. Mitigating exposure to soil Pb must therefore play a central role in advancing primary prevention.
1. Introduction
“Now I feel fairly sure of what I am going to say, and that is this: … If the case involved ingested lead and if [the physician] had a good medical education and if he knew the man had a stomachache and certain other symptoms of lead poisoning, he would size it up as lead poisoning. But if the material is inhaled—and its symptomology is altered when it is inhaled, because of its wider distribution in the body—it is extremely likely that nine hundred and ninety-nine ordinary physicians out of a thousand would fail to recognize the condition as lead poisoning.” Yandel Henderson, 1925 [1].
This study addresses integrating atmospheric lead (Pb), soil Pb, and blood Pb for understanding spatiotemporal dynamics of Pb poisoning, especially in urban settings. The 1925 Yandell Henderson warning about the effects of inhaled air Pb on physiology and human organ systems suggested that Pb aerosols are especially important and underrecognized [1]. Current studies relating air Pb and blood Pb support Professor Henderson’s early concerns.
A major issue for the research community was the inability to measure clinically, environmentally, and appropriately small quantities of Pb. This capability only became widely available in the late 1960s and early 1970s [2]. A major application was the measurement of blood Pb and conducting clinical studies. The combination of blood Pb and human clinical studies revealed that Pb exposure was excessive, and the public health response was to lower the blood Pb guidelines [2].
The use of leaded petrol was approved despite Henderson’s concerns about inhalation. The lead industry promoted leaded petrol and within a few decades, Pb contamination became an international public health disaster [3]. The blood Pb of children and adults fluctuates depending on the culture and regulations in each country regarding the use of leaded petrol. Children are the most susceptible group to Pb exposure. The consequences of children’s Pb exposure includes damaging effects on intelligence and behavior and negative effects on personality traits of the adult population [4,5]. By 30 August 2021, nearly a century after Henderson’s statements, leaded petrol for highway use was banned throughout the world [6].
Lead-based paints, with high Pb content, have often been assumed to be the major source of lead poisoning. The Lead Industry Association (LIA) actively dissuaded any notion that sources of Pb beyond lead-based paint have been involved in lead poisoning. On 14 April 1969, the board of directors of the LIA stated, “It should be a primary objective of any LIA program, or LIA participation in other programs, aimed at resolving the childhood lead poisoning problem to keep attention focused on old, leaded paint as its primary source and to make clear that other sources of lead are not significantly involved [7].” The critical issue is the failure to include Pb aerosols from Pb additives in petrol as a major source of Pb exposure, a bias that continues [8]. As Figure 1 illustrates, the amount of Pb used in the U.S. as Pb additives in petrol (gasoline) was about equal to the amount of Pb in lead-based paint [9].
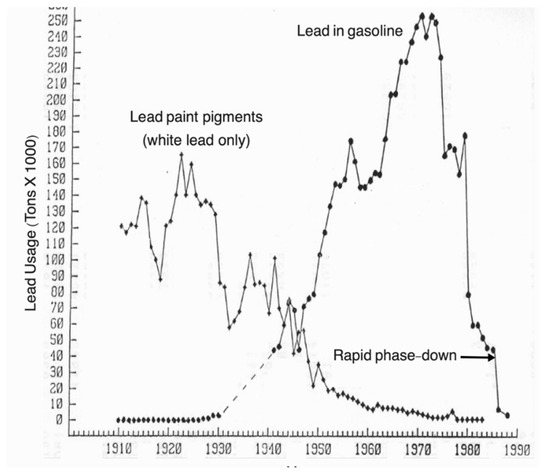
Figure 1.
Graph comparing the U.S. annual quantities of Pb in paint and gasoline. In the late 1960s and early 1970s, appropriately sensitive analytical instruments became available to measure lead. Failure to include either one or another of the major sources is a disservice to public health. For example, Dr. Henderson’s concern about inhalation is not addressed when lead aerosols from the combustion of leaded petrol are ignored as a major source of lead.
The focus on measuring blood Pb and ascribing the exposure to lead-based paint missed obvious environmental signals such as atmospheric Pb and settled Pb dust concentrations [10]. Eventually, the same analytical instruments were adopted to measure air Pb and soil Pb [11], but the findings were often ignored [12]. The purpose of this article is to conduct an integrative review to (1) demonstrate the links between air Pb, soil Pb, and blood Pb, and (2) identify mitigation strategies that limit multiple Pb dust sources and decrease human Pb exposure.
2. Materials and Methods
Several search engines, including Google Scholar, Scopus, and Web of Science, were used to obtain articles and open literature on temporal changes of air Pb, soil Pb, and human Pb exposures [13]. We conducted an integrative review to provide an overview of the knowledge base and re-conceptualize the links between air Pb, soil Pb, and blood Pb [14]. Google Scholar was of particular importance for identifying journal titles and authors connected with subjects, obtaining literature such as conference proceedings and articles that would not ordinarily be included in other indexing services, locating obscure references that are difficult to find in conventional databases, and locating information on incomplete citations [13]. We applied the following key words and Boolean terms: blood Pb OR blood lead; air Pb OR atmospheric Pb; leaded gas OR petrol Pb; and we joined each of these in searches with AND. Applying these key words to each search engine uncovered a selection of relevant articles listed in Table 1.

Table 1.
Search results of selected countries obtained for air Pb and blood Pb.
3. Results
Temporal changes recorded in air Pb and blood Pb are highlighted in selected Figure 2, Figure 3, Figure 4 and Figure 5 in Section 3.1. In addition, Table 1 lists studies from the United Kingdom, New Zealand, Mexico, and Durban, South Africa [20,21,22,23], which show similar responses between atmospheric Pb and blood Pb as observed in Figure 2, Figure 3, Figure 4 and Figure 5. Finally, two reviews on declines in air Pb and blood Pb demonstrate the links between exogenous (outside the body) and endogenous (inside the body) declines. One review is from Korea [24] and the second review is from northwestern Europe [25]. In Section 3.2, data-dependent studies for London [26] and New Orleans [27] provide insight into spatiotemporal changes in blood Pb and soil Pb. These studies demonstrate that air Pb from leaded petrol plays a key role in exogenous interactions between air Pb, soil Pb, and human Pb poisoning.
3.1. Blood Pb Results from Sweden, China, Germany, and Australia
3.1.1. Sweden, Yearly Measurements of Blood Pb in Swedish Children
- From 1978 to 1994, in small Swedish cities there was a gradual reduction of blood Pb coinciding with a gradual reduction in leaded petrol [15].
- Sweden’s petrol became Pb-free in 1995.
- In 1995–2007, children’s blood Pb declined and stabilized at ~2 µg/d (Figure 2).

Figure 2.
Blood Pb decreases in two small Swedish cities, Landskrona and Trelleborg. This graph was modified from the published data using WebPlotDigitizer Version 4.5 (Pacifica, CA, USA) and Microsoft Excel Version 16.54 (Microsoft Corporation Redmond, Washington, DC, USA).

3.1.2. China, Asir Pb and Blood Pb of Urban and Rural Children
- This study noted three phases in blood Pb change [16].
- In 1997–2000, before the phasedown of leaded petrol, blood Pb increased rapidly.
- After the phasedown, in 2001–2013, blood Pb decreased rapidly.
- According to the raw data, in 2014–2015, blood Pb stabilized.
- The raw data blood Pb are from urban surveys, while air Pb is from multiple industrial surveys. As a result, the two surveys are not necessarily associated.

Figure 3.
Based on the raw data provided in atmospheric Pb and blood Pb in urban and rural communities appear to be out of sync. The main interest is 2000 when China banned leaded petrol. Air Pb dropped precipitously followed by a sharp, although not as steep, decline in blood Pb, a subsequent more gradual decrease, and a flattened response after 2014.

3.1.3. Germany, Pb Exposure >35 Years of 20–29-Year-Old Compared with the Same Aged US young Adults
- Data from the early 1980s to 2019 reveal a blood Pb decrease of about 87% [17].
- The US 20–29-year-old young adults represent rural, suburban, and urban areas.
- The trends in human exposure closely correlate with air Pb levels.
- Since 2010, blood Pb in German young adults have flattened to ~1 µg/dL.

Figure 4.
Blood Pb data for 20–29-year-old urban German population compared to the US NHANES (nationally represented data) for the same age group. Compiled from Table 3 in ref. [17] and from NHANES data [18]. The graph was created using Microsoft Excel Version 16.54 (Redmond, WA, USA).

3.1.4. Australia, the Rise, Fall, and Remobilization of Industrial Lead
- Australian environmental Pb emissions began in the 1880s.
- Environmental archives contain multiple natural Pb isotopic values.
- The decline in leaded petrol coincides with urban blood Pb.
- Leaded petrol continued to decline but urban blood Pb stabilized at <2 µg/dL
- Around mines and smelters, blood, air, and soil Pb remain elevated.

Figure 5.
Blood Pb increases and decreases from 1973 to 2005 correspond with increases and decreases in leaded petrol emission ending during 2002 in Australia. Although the leaded petrol emissions continued to decrease, blood Pb stabilized at around 2 µg/dL. Revised and redrawn from [19].

3.2. Air Pb, Soil Pb, and Blood Pb
3.2.1. London, UK, Evidence for 20th Century Pb Deposition being Remobilized into the Atmosphere
- Britain banned leaded petrol at the end of the 20th century [26].
- Prior to the ban, Pb from exhaust particles were deposited in soils.
- Leaded petrol was the main source of Pb during the 20th century.
- Pb isotopes of air particles collected in London (2014–2018) were measured [26].
- Pb isotopic composition of air particles matched road dust and topsoil Pb.
- Persistence of Pb indicates that London reached an air Pb baseline.
- The policy measures in London are insufficient to decrease the Pb baseline [26].
3.2.2. New Orleans, LA, USA, the Concurrent Decrease of Soil Pb and Blood Pb
- A 19-year study evaluated changes in soil Pb and blood Pb after the 1986 rapid phasedown of leaded gasoline [27].
- Reservoirs of soil Pb persist in topsoil from fuel emissions and other Pb sources, which can become Pb dust.
- Over ~15 years, the median soil Pb decreased from 99 to 54 mg/kg as mapped in Figure 6. The spatiotemporal declines in soil Pb and blood Pb are presented in Figure 7.
 Figure 6. Spatiotemporal declines of soil Pb in New Orleans. The maps of New Orleans were created from a citywide survey of the metropolitan communities (n~5400 soil samples systematically collected across 274 census tracts) [27].
 Figure 7. Graph of the median blood Pb (µg/dL) on the y-axis and median soil Pb (mg/kg) on the x-axis. Two surveys of New Orleans over an interval of ~15 years illustrate the concurrent decrease in both blood Pb and soil Pb. The high blood Pb census tracts correspond with high soil Pb. The Fisher’s Exact p-values are <10−36. As illustrated in Figure 5, the most contaminated areas are clustered in the inner-city where the highest children’s blood lead values are found. Combination of two different figures and redrawn [27].
 - Over ~12 years, median blood Pb declined from 3.6 µg/dL to 1.2 µg/dL.
- Fisher’s exact test result is <10−36 and the null hypothesis is rejected.
- Similar declines are hypothesized in other major cities. The results of a follow-up study in the Detroit Tri County Area of Michigan helps validate the hypothesis [28].


4. Discussion
4.1. Ongoing Pb Exposure: Exogenous Soil Pb, Air Pb, and Endogenous Sources
Overall, these studies from around the world show that leaded gasoline emissions created high levels of air Pb, which resulted in high levels of children’s blood Pb, as well as high levels of soil Pb. Results from the UK, New Zealand, Mexico, Durban SA, Korea, NW Europe, and the US show that the decline in leaded petrol air emissions was also a driver of reductions in blood Pb levels. US agencies generally focused on lead-based paint and associated Pb dust as the primary source of lead poisoning and followed a “soil Pb is due to old leaded paint” mantra promoted by the lead industry [7]. Most European countries agreed to ban the use of lead-based paint for household use in the 1920s; the US did not agree to the ban until 1978. Pb in household paint was then regulated to 600 µg/g, still a significant amount of Pb [29]. While leaded paint is undeniably a local exposure source, we call attention to the rapid decline in blood Pb following the cessation of leaded petrol as shown by Figure 2, Figure 3, Figure 4 and Figure 5 and backed by U.S. blood Pb reports [30,31], demonstrating the importance of atmospheric Pb from leaded petrol as a major source of exposure. However, despite the sharp decreases in air Pb, the blood Pb responses were not as steep. Furthermore, as illustrated globally by Figure 2, Figure 3, Figure 4 and Figure 5, population blood Pb stabilizes at concentrations above zero, levels which clinicians regard as unsafe [5,29].
Studies conducted in Korea and NW Europe provide insights into the causes of the continued above zero µg/dL Pb exposure of the population. Korea observed that further regulation of other sources of Pb such as industrial, food, and baby products are required to reduce exposure [24]. Studies in NW Europe and the discrepancy between air Pb and blood Pb suggests alternative Pb sources continue to present exposure. These include exogenous (outside the body) and endogenous (inside the body) Pb sources [25].
Exogenous sources of Pb include inhaled air Pb [1]. Even though air Pb has declined, it persists as a legacy source of Pb. As described in Section 3.2.1, the findings in London show that current atmospheric Pb isotopes match the soil and dust Pb, originally emitted to the environment from vehicles using leaded petrol [26]. Studies from New Orleans, described in Section 3.2.2, illustrate that Pb contaminated soil is strongly associated with blood Pb [27]. The atmospheric Pb becomes settled Pb dust in the environment. Lead dust in soil is a reservoir of Pb and consequently, a source for further Pb exposure via inhalation and dust ingestion. As demonstrated in London, air Pb, driven by remobilization from the past accumulation of soil Pb, appears to have become an important contributor to the Pb baseline in urban environments. The amount of soil Pb depends on the size of an urban area; the larger the city, the more highly contaminated the soils will be [32]. Here, we place the research from London into global context, connecting the available data on air Pb, soil Pb, and blood Pb, to show how ubiquitous and harmful these legacy Pb sources are.
Endogenous sources include Pb in human tissues and particularly the stores in bones. Calcium (along with Pb) stored in the bones is released to maintain homeostasis of metabolic Ca and is part of the turnover of bone tissue [33]. Diet impacts blood Pb and urine in adult women with consequences on the mobilization of Pb from bone stores [34]. Children are especially vulnerable to Pb exposure because of their Ca requirements. Adult cognitive functions are more strongly associated with biomarkers of cumulative dose (mainly lead in tibia) than with blood lead levels [35]. The exogenous Pb pathway results in the transfer of Pb to the blood stream and then to the bones where Pb is endogenously stored. If contact with Pb is curtailed, then the amount of endogenous Pb in bone will also decline.
These data demonstrate that endogenous sources of Pb arise from prior and ongoing exogenous Pb exposure. As other research has shown, the most effective way to reduce blood Pb is to limit further exogenous Pb exposure. As Clair C. Patterson asserted to the National Academy of Sciences in 1980, “Sometime in the near future it probably will be shown that the older urban areas of the United States have been rendered more or less uninhabitable by the millions of tons of poisonous industrial lead residues that have accumulated in cities during the past century” [36]. Reducing leaded gasoline worldwide was a tremendous step towards maintaining the habitability of cities, but further efforts are needed to reduce exposure to the reservoir of soil Pb that can be remobilized to the atmosphere.
4.2. New Approaches for Primary Prevention
Here, we show data from around the world indicating that soil Pb plays a critical role in human Pb exposure. Collectively, these data demonstrate the urgent need to prevent remobilization of environmental Pb to the atmosphere [26]. Reducing human Pb exposure and advancing primary prevention thus requires novel polices to decrease exogenous contact to the reservoir of Pb in soil and curtailing remobilization of soil Pb into the atmosphere [26]. A major precedence for primary prevention of children’s contact with polluted soil was taken by Norway with a national action plan for mapping and remediating soils at childcare centers and playgrounds [37]. Numerous case studies and evidence-based approaches for addressing Pb-contaminated urban soil have been shown to be effective, namely by removing or simply covering contaminated soils with new clean soils [38]. Addressing soil contamination and changing vacant land into green spaces has also resulted in improvements in community mental health in Philadelphia [39]. New York City has created a Clean Soil Bank, which transports excavated subsoils from construction projects for beneficial use to reduce soil Pb exposure and promote community gardening and urban agriculture using low Pb soils [40].
Towards the goal of addressing the soil contamination issue, soil Pb must be measured and mapped to identify priority areas for primary prevention. Foundational work has been carried out towards this end: Markus and McBratney (2001) summarized spatial Pb distribution in soils from countries and cities around the world [41], and Datko-Williams et al. (2014) reviewed soil Pb concentrations across 62 cities in 29 US states between 1970 and 2012 [42]. Soil Pb mapping has occurred in Baltimore, MD [43], New Orleans, LA [25], Minneapolis, MN [44], Oakland, CA [45], New York City, NY, [46], Los Angeles, CA [47], Syracuse, NY [48], Greensboro, NC [49], Torino, Italy [50], London, UK [51], and nationwide in China [52]. Walls et al., (2022) analyzed a network of community-engaged researchers working to mitigate exposure to soil Pb [53]. Numerous engaged-scientists have co-created research with impacted communities to address soil Pb in Indianapolis, IN [54], Dewey-Humboldt, AZ [55], Milwaukee, WI [56], and several Australian cities [57].
While mapping and community-centered research is foundational, primary prevention must be achieved by removing or covering contaminated soils with clean soils. As described above, there is precedence for establishing a national clean soil program in Norway that involves mapping and renovating areas of soil contamination to protect children where they play [37]. Municipalities throughout the world must undertake similar measures to decrease baseline Pb exposure. As illustrated in Figure 6 for New Orleans, cities generally have low Pb soils in their outlying areas. The combined efforts of citywide soil Pb mapping, soil construction, and soil emplacement can reduce the urban environmental Pb baseline. In turn, this can limit the remobilization of Pb dust and reduce the baseline of air Pb and blood Pb levels of populations living in contaminated communities.
5. Conclusions
The toxic and potentially lethal health impacts of Pb are well-known, and while great advances in primary prevention have been made, we reviewed available data from around the world that show that baseline population-level exposures are plateauing above 0 ug/dL and are still too high. Available data demonstrate that air Pb, largely from leaded petrol, has been a major exposure source over time. While leaded petrol has been banned worldwide, it has left a legacy of lead in soil, which can be remobilized to the atmosphere. We review these data together, which strongly indicate that remobilized soil Pb and dust are contributing to the elevated blood Pb of urban populations worldwide. Exogenous soil and air Pb can be stored in bones and serve as endogenous sources of exposure. Despite the attempts of industries to deny the implications of leaded petrol on health, this globally pervasive source of toxicity can no longer be ignored. Simple steps can be taken to address this issue: primary prevention can occur from removing or covering contaminated soils with clean soils. Norway has a viable example of a national action plan to map and mitigate exposure to soils at public play areas, such as parks, elementary schools, and day care centers, and New York City has created a Clean Soil Bank to provide a source of clean materials for such purposes. New policies are feasible, and needed, to facilitate mapping and mitigation of exposure to Pb contaminated and unhealthy soils. Healthy soils are essential for ensuring urban health and sustainability.
Author Contributions
Conceptualization, H.W.M. and C.R.G.; methodology, C.R.G. and H.W.M.; software, C.R.G.; validation, H.W.M., C.R.G. and E.T.P.; New Orleans soil Pb collections, E.T.P.; data analysis, C.R.G. and E.T.P.; writing—original draft preparation, H.W.M. and S.P.E.; writing—review and editing, H.W.M., C.R.G. and S.P.E.; visualization, C.R.G. All authors have read and agreed to the published version of the manuscript.
Funding
This research received no external grant funding. Contributors include The Ling and Ronald Cheng Fund, Al French, Mary An Godshall, Allen and Laura Carmen, Jack Eichenbaum, H.M. and the Department of Pharmacology.
Institutional Review Board Statement
Not applicable.
Informed Consent Statement
Not applicable.
Data Availability Statement
Most of the articles listed include extra resources in the references for further study.
Acknowledgments
Trina Williams and Ngoc Huynh, LHHCLPPP, provided the blood lead data for metropolitan New Orleans. Survey 2001 was funded by Agency for Toxic Substances and Disease Registry (ATSDR) and US Department of Housing and Urban Development (HUD). Survey 2017 was funded by The Ling and Ronald Cheng Fund, Al French, Mary An Godshall, Allen and Laura Carmen, the late Paul W. Mielke and Roberta R. Mielke, Thomas Beller, Jack Eichenbaum, Gabriel Filippelli, Community Church Unitarian Universalist members, and the Department of Pharmacology.
Conflicts of Interest
H.M. is the unremunerated President of Lead Lab, Inc. a non-profit organization established to conduct research and education on lead. Except for H.M., the funders had no role, outside of encouragement, in the design of the study, the collection, analyses, interpretation of data, or in the writing of the manuscript and decision to publish the results.
References
- Henderson, Y. Proceedings of a Conference to Determine Whether or Not There is a Public Health Question in the Manufacture, Distribution, or Use of Tetraethyl Lead Gasoline; United State Public Health Service, Washington, D.C. Surgeon General H.S. Cumming, Presiding. Public Health Bulletin No. 158, August 1925; Government Printing Office: Washington, DC, USA, 1925. [Google Scholar]
- Parsons, P.J.; McIntosh, K.G. Human exposure to lead and new evidence of adverse health effects: Implications for analytical measurements. Powder Diffr. 2010, 25, 175–181. [Google Scholar] [CrossRef]
- Kovarik, W. Ethyl-leaded Gasoline: How a Classic Occupational Disease Became an International Public Health Disaster. Int. J. Occup. Environ. Health 2005, 11, 384–397. [Google Scholar] [CrossRef] [PubMed]
- Schwaba, T.; Bleidorn, W.; Hopwood, C.J.; Gebauer, J.E.; Rentfrow, P.J.; Potter, J.; Gosling, S.D. The impact of childhood lead exposure on adult personality: Evidence from the United States, Europe, and a large-scale natural experiment. Proc. Natl. Acad. Sci. USA 2021, 118, 29. [Google Scholar] [CrossRef] [PubMed]
- Paulson, J.A.; Brown, M.J. The CDC blood lead reference value for children: Time for a change. Environ. Health 2019, 18, 16. [Google Scholar] [CrossRef] [PubMed]
- Cabrera, Y. Leaded Gasoline is Finally Gone-But its Toxic Legacy Lingers. Available online: https://grist.org/regulation/leaded-gasoline-lead-poisoning-united-nations/ (accessed on 31 August 2021).
- Markowitz, G.; Rosner, D. Deceit and Denial: The Deadly Politics of Industrial Pollution; University of California Press: Berkeley, CA, USA; Los Angeles, CA, USA, 2002; pp. 408, quote on p. 117. [Google Scholar]
- Wilson, J.; Dixon, S.L.; Wisinski, C.; Speidel, C.; Breysse, J.; Jacobson, M.; Crisci, S.; Jacobs, D.E. Pathways and Sources of Lead Exposure: Michigan Children’s Lead Determination (the Mi Child Study). Available online: https://ssrn.com/abstract=4150372 (accessed on 25 May 2022).
- Mielke, H.W.; Reagan, P.L. Soil Is an Important Pathway of Human Lead Exposure Environ. Health Perspect. 1998, 106 (Suppl. S1), 217–229. [Google Scholar]
- Mielke, H.W.; Gonzales, C.; Powell, E.; Mielke, P.W. Evolving from Reactive to Proactive Medicine: Community Lead (Pb) and Clinical Disparities in Pre- and Post-Katrina New Orleans. Int. J. Environ. Res. Public Health 2014, 11, 7482–7491. [Google Scholar] [CrossRef] [PubMed]
- Gonzales, C.R.; Paltseva, A.A.; Bell, T.; Powell, E.T.; Mielke, H.W. Agreement of Four Analytical Methods Applied to Pb in Soils from the Small City of St. John’s, NL, Canada. Int. J. Environ. Res. Public Health 2021, 18, 9863. [Google Scholar] [CrossRef] [PubMed]
- Sayre, J.W.; Charney, E.; Vostal, J.; Pless, I.B. House and Hand Dust As a Potential Source of Childhood Lead Exposure. Am. J. Dis. Child. 1974, 127, 167–170. [Google Scholar] [CrossRef]
- Google Scholar Search Engine. Available online: https://scholar.google.com/ (accessed on 10 October 2021).
- Snyder, H. Literature review as a research methodology: An overview and guidelines. J. Bus. Res. 2019, 104, 333–339. [Google Scholar] [CrossRef]
- Strömberg, U.; Lundh, T.; Skerfving, S. Yearly measurements of blood lead in Swedish children since 1978: The declining trend continues in the petrol-lead-free period 1995–2007. Environ. Res. 2008, 107, 332–335. [Google Scholar] [CrossRef]
- Han, Z.; Guo, X.; Zhang, B.; Liao, J.; Nie, L. Blood lead levels of children in urban and suburban areas in China (1997–2015): Temporal and spatial variations and influencing factors. Sci. Total Environ. 2018, 625, 1659–1666. Available online: https://www.sciencedirect.com/science/article/pii/S0048969717337488 (accessed on 21 October 2021). [CrossRef] [PubMed]
- Lermen, D.; Weber, T.; Göen, T.; Bartel-Steinbach, M.; Gwinner, F.; Mueller, S.C.; Conrad, A.; Rüther, M.; von Briesen, H.; Kolossa-Gehring, M. Long-term time trend of lead exposure in young German adults—Evaluation of more than 35 Years of data of the German Environmental Specimen Bank. Int. J. Hyg. Environ. Health 2020, 231, 113665. Available online: https://www.sciencedirect.com/science/article/pii/S1438463920306118 (accessed on 20 October 2021). [CrossRef] [PubMed]
- US Centers for Disease Control and Prevention (CDC); National Center for Health Statistics (NCHS). National Health and Nutrition Examination Survey Data; Department of Health and Human Services, Centers for Disease Control and Prevention: Hyattsville, MD, USA, 2020. Available online: https://wwwn.cdc.gov/nchs/nhanes/Default.aspx (accessed on 25 October 2021).
- Kristensen, L.J.; Taylor, M.P.; Flegal, A.R. An odyssey of environmental pollution: The rise, fall and remobilisation of industrial lead in Australia. Appl. Geochem. 2017, 83, 3–13. [Google Scholar] [CrossRef]
- Chamberlain, A. Effect of airborne lead on blood lead. Atmos. Environ. 1983, 17, 677–692. [Google Scholar] [CrossRef]
- Fergusson, J.E. Lead: Petrol lead in the environment and its contribution to human blood lead levels. Sci. Total Environ. 1986, 50, 1–54. [Google Scholar] [CrossRef]
- Pantic, I.; Tamayo-Ortiz, M.; Rosa-Parra, A.; Bautista-Arredondo, L.; Wright, R.O.; Peterson, K.E.; Schnaas, L.; Rothenberg, S.J.; Hu, H.; Téllez-Rojo, M.M. Children’s Blood Lead Concentrations from 1988 to 2015 in Mexico City: The Contribution of Lead in Air and Traditional Lead-Glazed Ceramics. Int. J. Environ. Res. Public Health 2018, 15, 2153. [Google Scholar] [CrossRef] [PubMed]
- Batterman, S.; Su, F.-C.; Jia, C.; Naidoo, R.N.; Robins, T.; Naik, I. Manganese and lead in children’s blood and airborne particulate matter in Durban, South Africa. Sci. Total Environ. 2011, 409, 1058–1068. [Google Scholar] [CrossRef] [PubMed]
- Oh, S.-E.; Kim, G.B.; Hwang, S.H.; Ha, M.; Lee, K.-M. Longitudinal trends of blood lead levels before and after leaded gasoline regulation in Korea. Environ. Health Toxicol. 2017, 32, e2017019. [Google Scholar] [CrossRef]
- Petit, D.; Véron, A.; Flament, P.; Deboudt, K.; Poirier, A. Review of pollutant lead decline in urban air and human blood: A case study from northwestern Europe. Comptes Rendus Geosci. 2015, 347, 247–256. [Google Scholar] [CrossRef]
- Resongles, E.; Dietze, V.; Green, D.C.; Harrison, R.M.; Ochoa-Gonzalez, R.; Tremper, A.H.; Weiss, D.J. Strong evidence for the continued contribution of lead deposited during the 20th century to the atmospheric environment in London of today. Proc. Natl. Acad. Sci. USA 2021, 118, e2102791118. [Google Scholar] [CrossRef]
- Mielke, H.W.; Gonzales, C.R.; Powell, E.T.; Laidlaw, M.A.S.; Berry, K.J.; Mielke, P.W.; Egendorf, S.P. The concurrent decline of soil lead and children’s blood lead in New Orleans. Proc. Natl. Acad. Sci. USA 2019, 116, 22058–22064, Correction in: Proc. Natl. Acad. Sci. USA 2021, 118, e2119517118. [Google Scholar] [CrossRef] [PubMed]
- Mielke, H.W.; Gonzales, C.R.; Powell, E.T.; Shah, A.; Berry, K.J.; Richter, D.D. Spatial-temporal association of soil Pb and children’s blood Pb in the Detroit Tri-County Area of Michigan (USA). Environ. Res. 2020, 191, 110112. [Google Scholar] [CrossRef]
- Annest, J.L.; Pirkle, J.L.; Makuc, D.; Neese, J.W.; Bayse, D.D.; Kovar, M.G. Chronological Trend in Blood Lead Levels between 1976 and 1980. N. Engl. J. Med. 1983, 308, 1373–1377. [Google Scholar] [CrossRef] [PubMed]
- Pirkle, J.L.; Brody, D.J.; Gunter, E.W.; Kramer, R.A.; Paschal, D.C.; Flegal, K.M.; Matte, T.D. The decline in blood lead levels in the United States: The National Health and Nutrition Examination Surveys (NHANES). JAMA 1994, 272, 284–291. [Google Scholar] [CrossRef]
- Mielke, H.W.; Laidlaw, M.A.; Gonzales, C.R. Estimation of leaded (Pb) gasoline’s continuing material and health impacts on 90 US urbanized areas. Environ. Int. 2011, 37, 248–257. [Google Scholar] [CrossRef] [PubMed]
- Upadhyay, K.; Viramgami, A.; Bagepally, B.S.; Balachandar, R. Association between blood lead levels and markers of calcium homeostasis: A systematic review and meta-analysis. Sci. Rep. 2022, 12, 1850. [Google Scholar] [CrossRef]
- Gulson, B.L.; Mahaffey, K.R.; Jameson, C.W.; Patison, N.; Law, A.J.; Mizon, K.J.; Korsch, M.J.; Pederson, D. Impact of diet on lead in blood and urine in female adults and relevance to mobilization of lead from bone stores. Environ. Health Perspect. 1999, 107, 257–263. Available online: http://refhub.elsevier.com/S1631-0713(15)00035-8/sbref0210 (accessed on 31 August 2021).
- Shih, R.A.; Hu, H.; Weisskopf, M.G.; Schwartz, B.S. Cumulative lead dose and cognitive function in adults: A review of studies the measured both blood lead and bone lead. Environ. Health Perspect. 2007, 115, 483–492. [Google Scholar] [CrossRef]
- Patterson, C.C. An Alternative Perspective—Lead Pollution in the Human Environment: Origin, Extent, and Significance; National Academy of Sciences: Washington, DC, USA, 1980. [Google Scholar]
- Ottesen, R.T.; Alexander, J.; Langedal, M.; Haugland, T.; Høygaard, E. Soil pollution in day-care centers and playgrounds in Norway: National action plan for mapping and remediation. Environ. Geochem. Health 2008, 30, 623–637. [Google Scholar] [CrossRef]
- Laidlaw, M.A.; Filippelli, G.M.; Brown, S.; Paz-Ferreiro, J.; Reichman, S.M.; Netherway, P.; Truskewycz, A.; Ball, A.S.; Mielke, H.W. Case studies and evidence-based approaches to addressing urban soil lead contamination. Appl. Geochem. 2017, 83, 14–30. [Google Scholar] [CrossRef]
- South, E.C.; Hohl, B.C.; Kondo, M.C.; MacDonald, J.M.; Branas, C.C. Effect of Greening Vacant Land on Mental Health of Community-Dwelling Adults. JAMA Netw. Open 2018, 1, e180298. [Google Scholar] [CrossRef] [PubMed]
- Egendorf, S.P.; Cheng, Z.; Deeb, M.; Flores, V.; Paltseva, A.; Walsh, D.; Groffman, P.; Mielke, H.W. Constructed soils for mitigating lead (Pb) exposure and promoting urban community gardening: The New York City Clean Soil Bank pilot study. Landsc. Urban Plan. 2018, 175, 184–194. [Google Scholar] [CrossRef]
- Markus, J.; McBratney, A.B. A review of the contamination of soil with lead: II. Spatial distribution and risk assessment of soil lead. Environ. Int. 2001, 27, 399–411. [Google Scholar] [CrossRef]
- Datko-Williams, L.; Wilkie, A.; Richmond-Bryant, J. Analysis of U.S. soil lead (Pb) studies from 1970 to 2012. Sci. Total Environ. 2014, 468–469, 854–863. [Google Scholar] [CrossRef] [PubMed]
- Mielke, H.W.; Anderson, J.C.; Berry, K.J.; Mielke, P.W.; Chaney, R.L.; Leech, M. Lead concentrations in inner-city soils as a factor in the child lead problem. Am. J. Public Health 1983, 73, 1366–1369. [Google Scholar] [CrossRef]
- Mielke, H.W.; Blake, B.; Burroughs, S.; Hassinger, N. Urban lead levels in Minneapolis: The case of the Hmong children. Environ. Res. 1984, 34, 64–76. [Google Scholar] [CrossRef]
- McClintock, N. Assessing soil lead contamination at multiple scales in Oakland, California: Implications for urban agriculture and environmental justice. Appl. Geogr. 2012, 35, 460–473. [Google Scholar] [CrossRef]
- Cheng, Z.; Paltseva, A.; Li, I.; Morin, T.; Huot, H.; Egendorf, S.; Su, Z.; Yolanda, R.; Singh, K.; Lee, L.; et al. Trace Metal Contamination in New York City Garden Soils. Soil Sci. 2015, 180, 167–174. [Google Scholar] [CrossRef]
- Wu, J.; Edwards, R.; He, X.; Liu, Z.; Kleinman, M. Spatial analysis of bioavailable soil lead concentrations in Los Angeles, California. Environ. Res. 2010, 110, 309–317. [Google Scholar] [CrossRef] [PubMed]
- Hunt, A.; Johnson, D.; Griffith, D.; Zitoon, S. Citywide distribution of lead and other element in soils and indoor dusts in Syracuse, NY. Appl. Geochem. Recent Prog. Environ. Geochem.-A Tribut. Iain Thornton 2012, 27, 985–994. [Google Scholar] [CrossRef]
- Obeng-Gyasi, E.; Roostaei, J.; Gibson, J.M. Lead Distribution in Urban Soil in a Medium-Sized City: Household-Scale Analysis. Environ. Sci. Technol. 2021, 55, 3696–3705. [Google Scholar] [CrossRef] [PubMed]
- Biasioli, M.; Barberis, R.; Ajmone-Marsan, F. The influence of a large city on some soil properties and metals content. Sci. Total Environ. 2006, 356, 154–164. [Google Scholar] [CrossRef] [PubMed]
- Lark, R.; Scheib, C. Land use and lead content in the soils of London. Geoderma 2013, 209–210, 65–74. [Google Scholar] [CrossRef][Green Version]
- Zhao, F.-J.; Ma, Y.; Zhu, Y.-G.; Tang, Z.; McGrath, S.P. Soil Contamination in China: Current Status and Mitigation Strategies. Environ. Sci. Technol. 2015, 49, 750–759. [Google Scholar] [CrossRef] [PubMed]
- Walls, D.; Kinchy, A.; Margalit, T.; Ramírez-Andreotta, M.D.; Mauro, S.E.-D. Confronting legacy lead in soils in the United States: Community-engaged researchers doing undone science. Environ. Sci. Policy 2021, 128, 165–174. [Google Scholar] [CrossRef]
- Filippelli, G.M.; Adamic, J.; Nichols, D.; Shukle, J.; Frix, E. Mapping the Urban Lead Exposome: A Detailed Analysis of Soil Metal Concentrations at the Household Scale Using Citizen Science. Int. J. Environ. Res. Public Health 2018, 15, 1531. [Google Scholar] [CrossRef] [PubMed]
- Ramirez-Andreotta, M.D.; Brusseau, M.L.; Artiola, J.; Maier, R.M.; Gandolfi, A.J. Building a co-created citizen science program with gardeners neighboring a superfund site: The Gardenroots case study. Int. Public Health J. 2015, 7, 17. [Google Scholar]
- Johnson, S.; Cardona, D.; Davis, J.; Gramling, B.; Hamilton, C.; Hoffmann, R.; Ruis, S.; Soldat, D.; Ventura, S.; Yan, K. Using Community-Based Participatory Research to Explore Backyard Gardening Practices and Soil Lead Concentrations in Urban Neighborhoods. Prog. Community Health Partnersh. Res. Educ. Action 2016, 10, 9–17. [Google Scholar] [CrossRef]
- Rouillon, M.; Harvey, P.J.; Kristensen, L.J.; George, S.G.; Taylor, M.P. VegeSafe: A community science program measuring soil-metal contamination, evaluating risk and providing advice for safe gardening. Environ. Pollut. 2017, 222, 557–566. [Google Scholar] [CrossRef]
- Taylor, M.P.; Isley, C.F.; Fry, K.L.; Liu, X.; Gillings, M.M.; Rouillon, M.S.; Neda, S.; Gore, D.B.; Filippelli, G.M. A citizen science approach to identifying trace metal contamination risks in urban gardens. Environ. Int. 2021, 155, 106582. [Google Scholar] [CrossRef]

Publisher’s Note: MDPI stays neutral with regard to jurisdictional claims in published maps and institutional affiliations. |
© 2022 by the authors. Licensee MDPI, Basel, Switzerland. This article is an open access article distributed under the terms and conditions of the Creative Commons Attribution (CC BY) license (https://creativecommons.org/licenses/by/4.0/).