
Exploration of Spatio-Temporal Characteristics of Carbon Emissions from Energy Consumption and Their Driving Factors: A Case Analysis of the Yangtze River Delta, China


Abstract
:1. Introduction
2. Literature Review
2.1. Empirical Study on Energy Carbon Emissions in the YRD Region
2.2. Methods for Identifying Drivers of Carbon Emissions
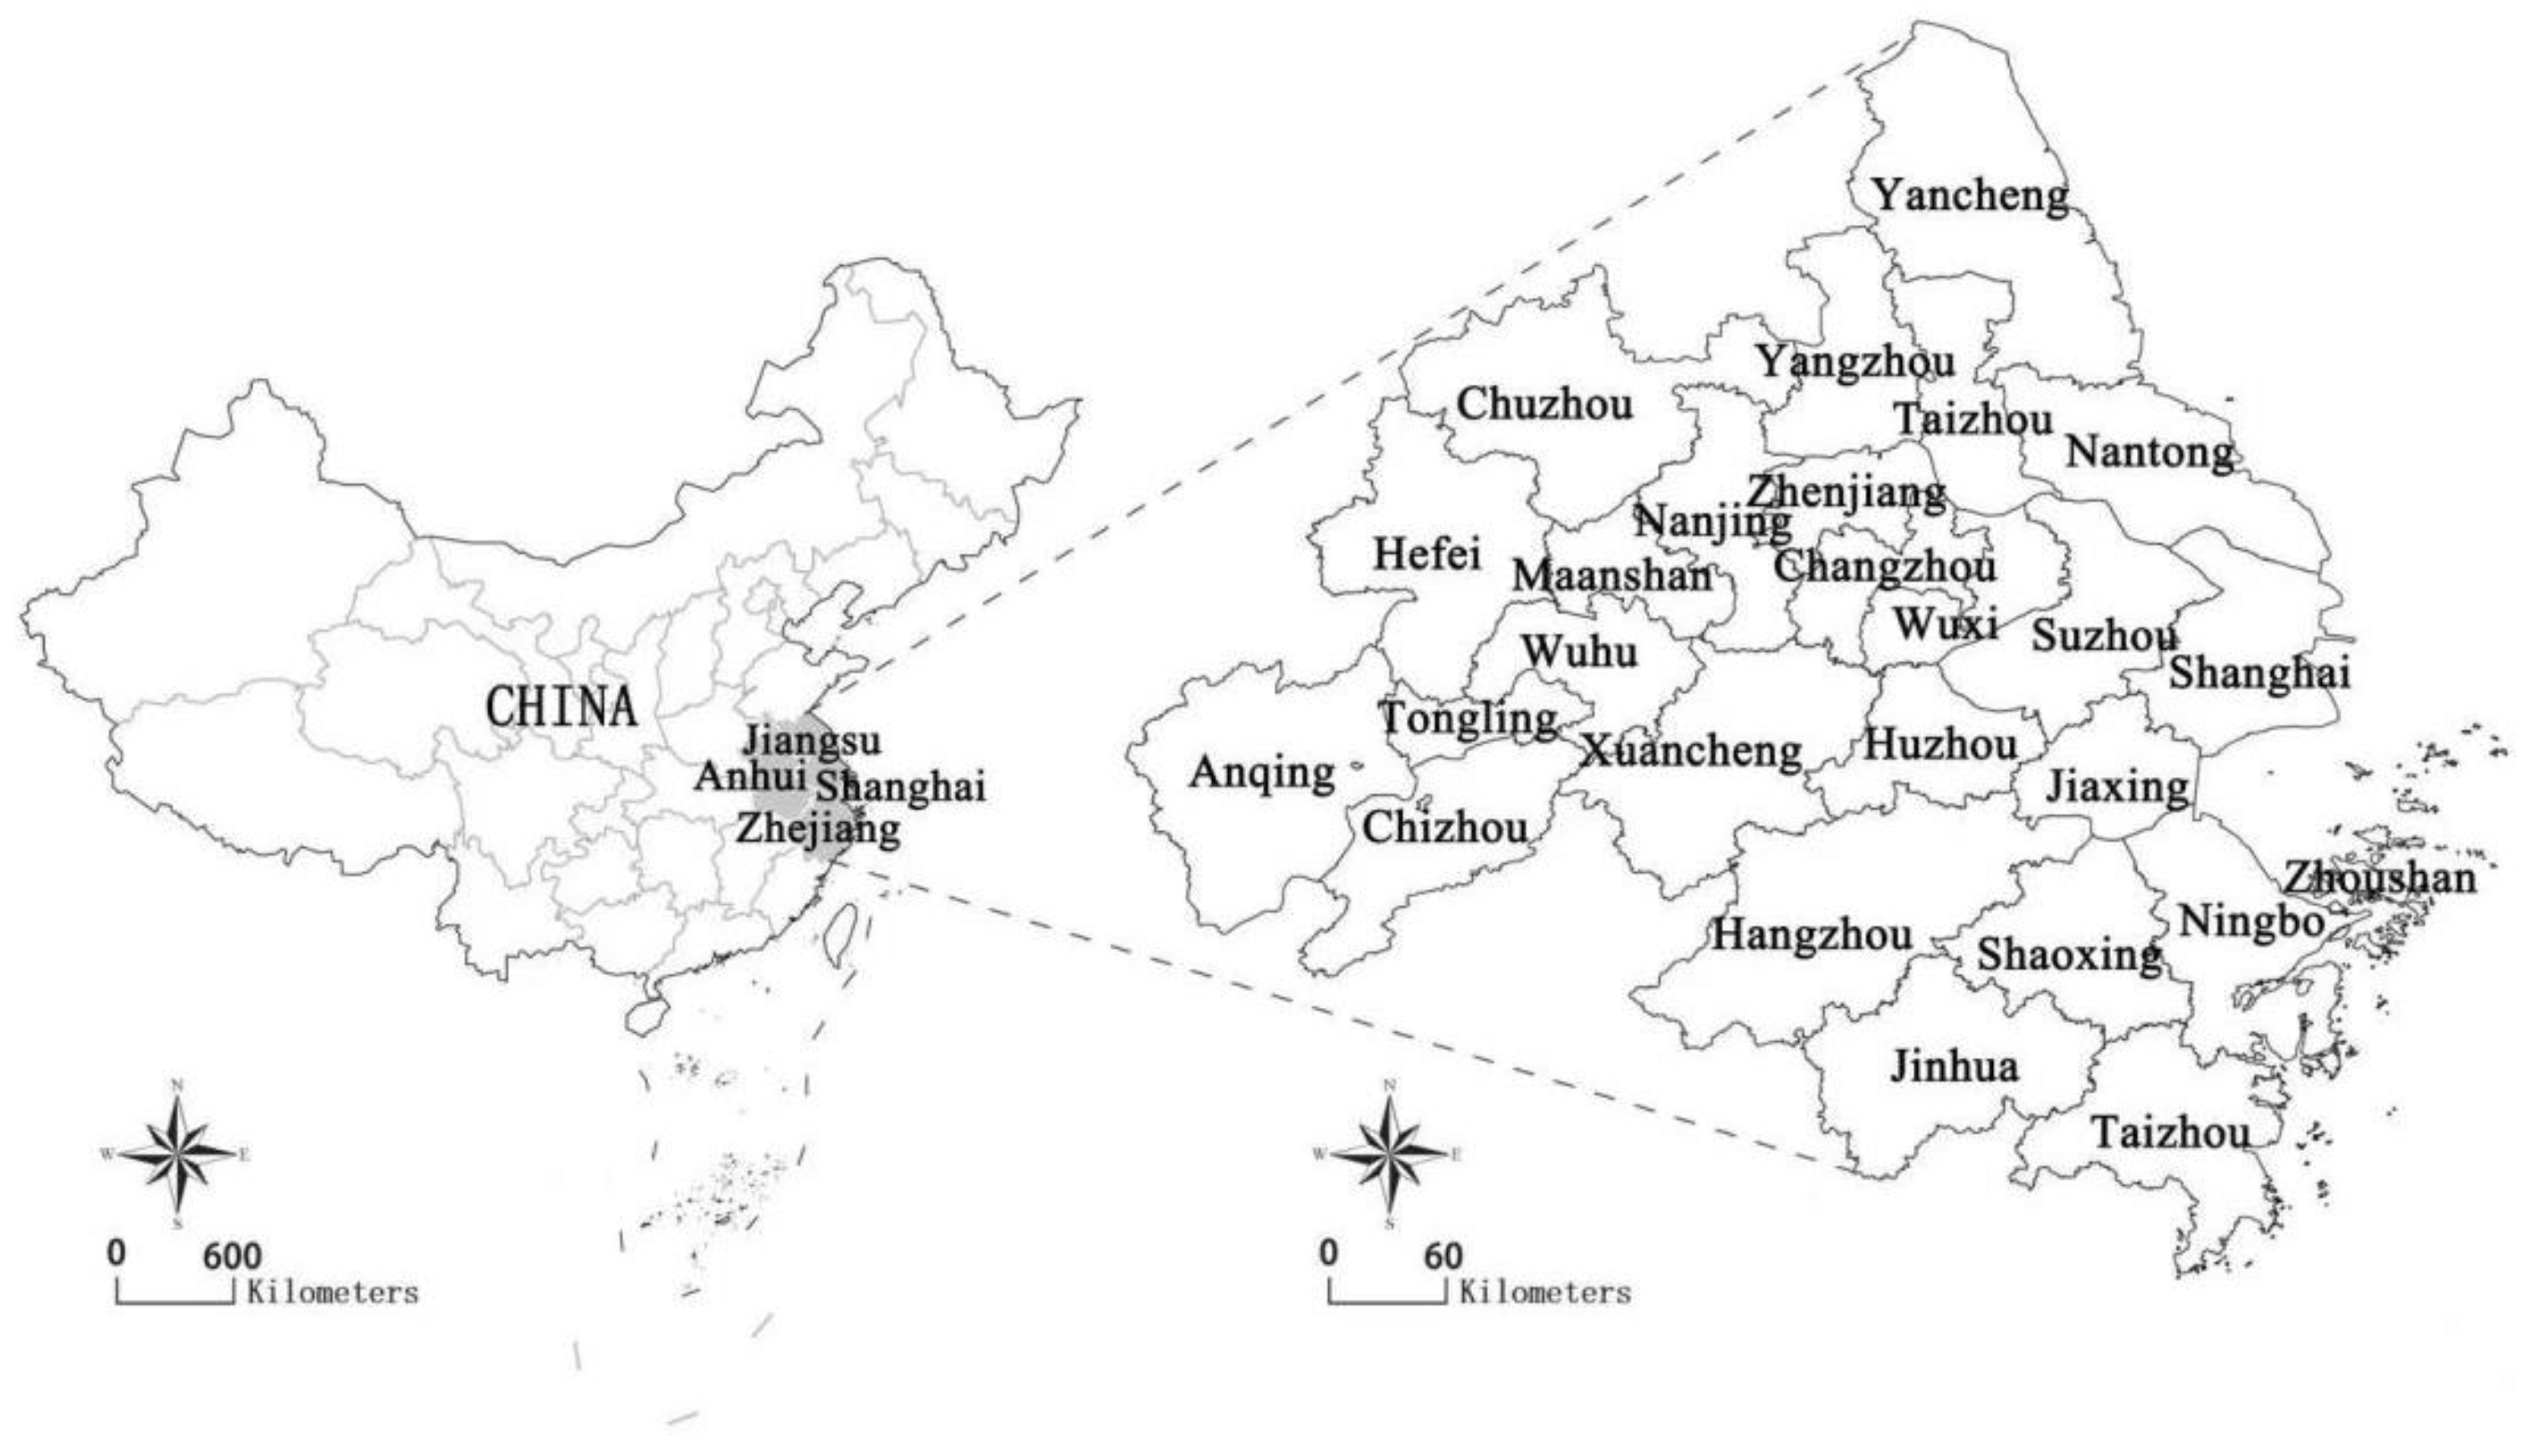
3. Study Area
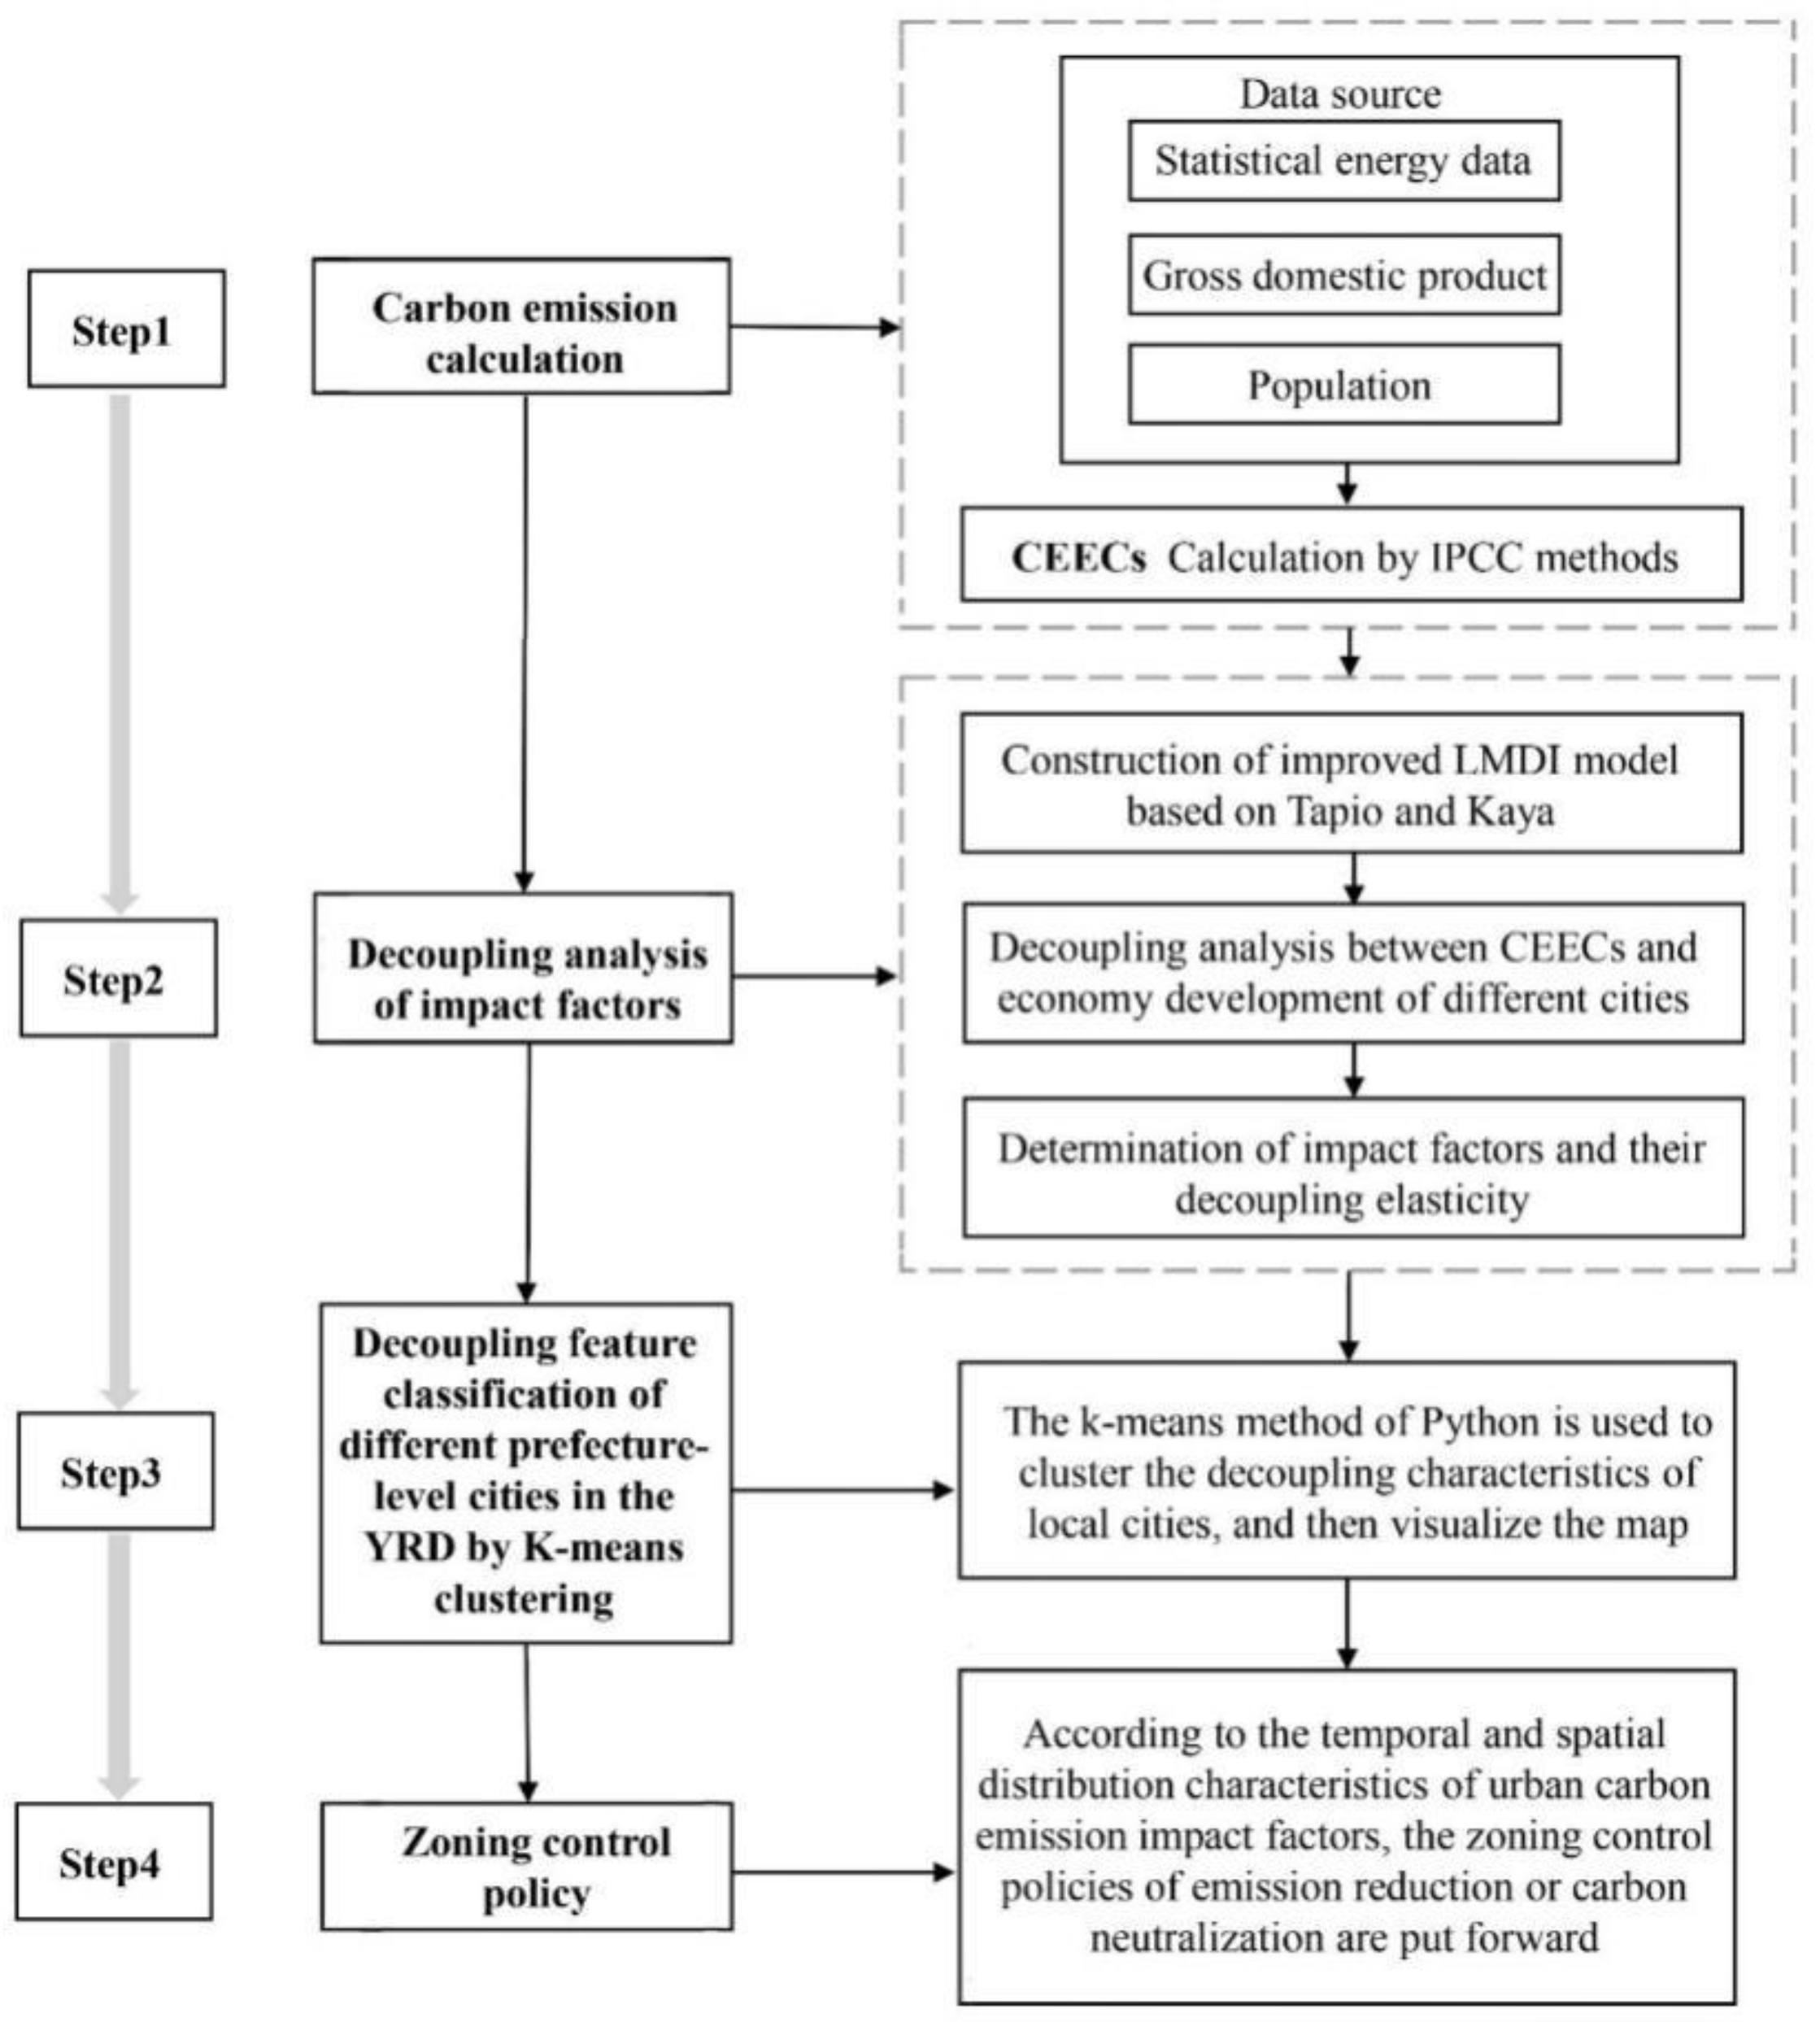
4. Methods
4.1. Data Sources
4.2. Methodology
4.2.1. CEEC Model
4.2.2. The Improved LMDI Model Based on Kaya Equation and Tapio
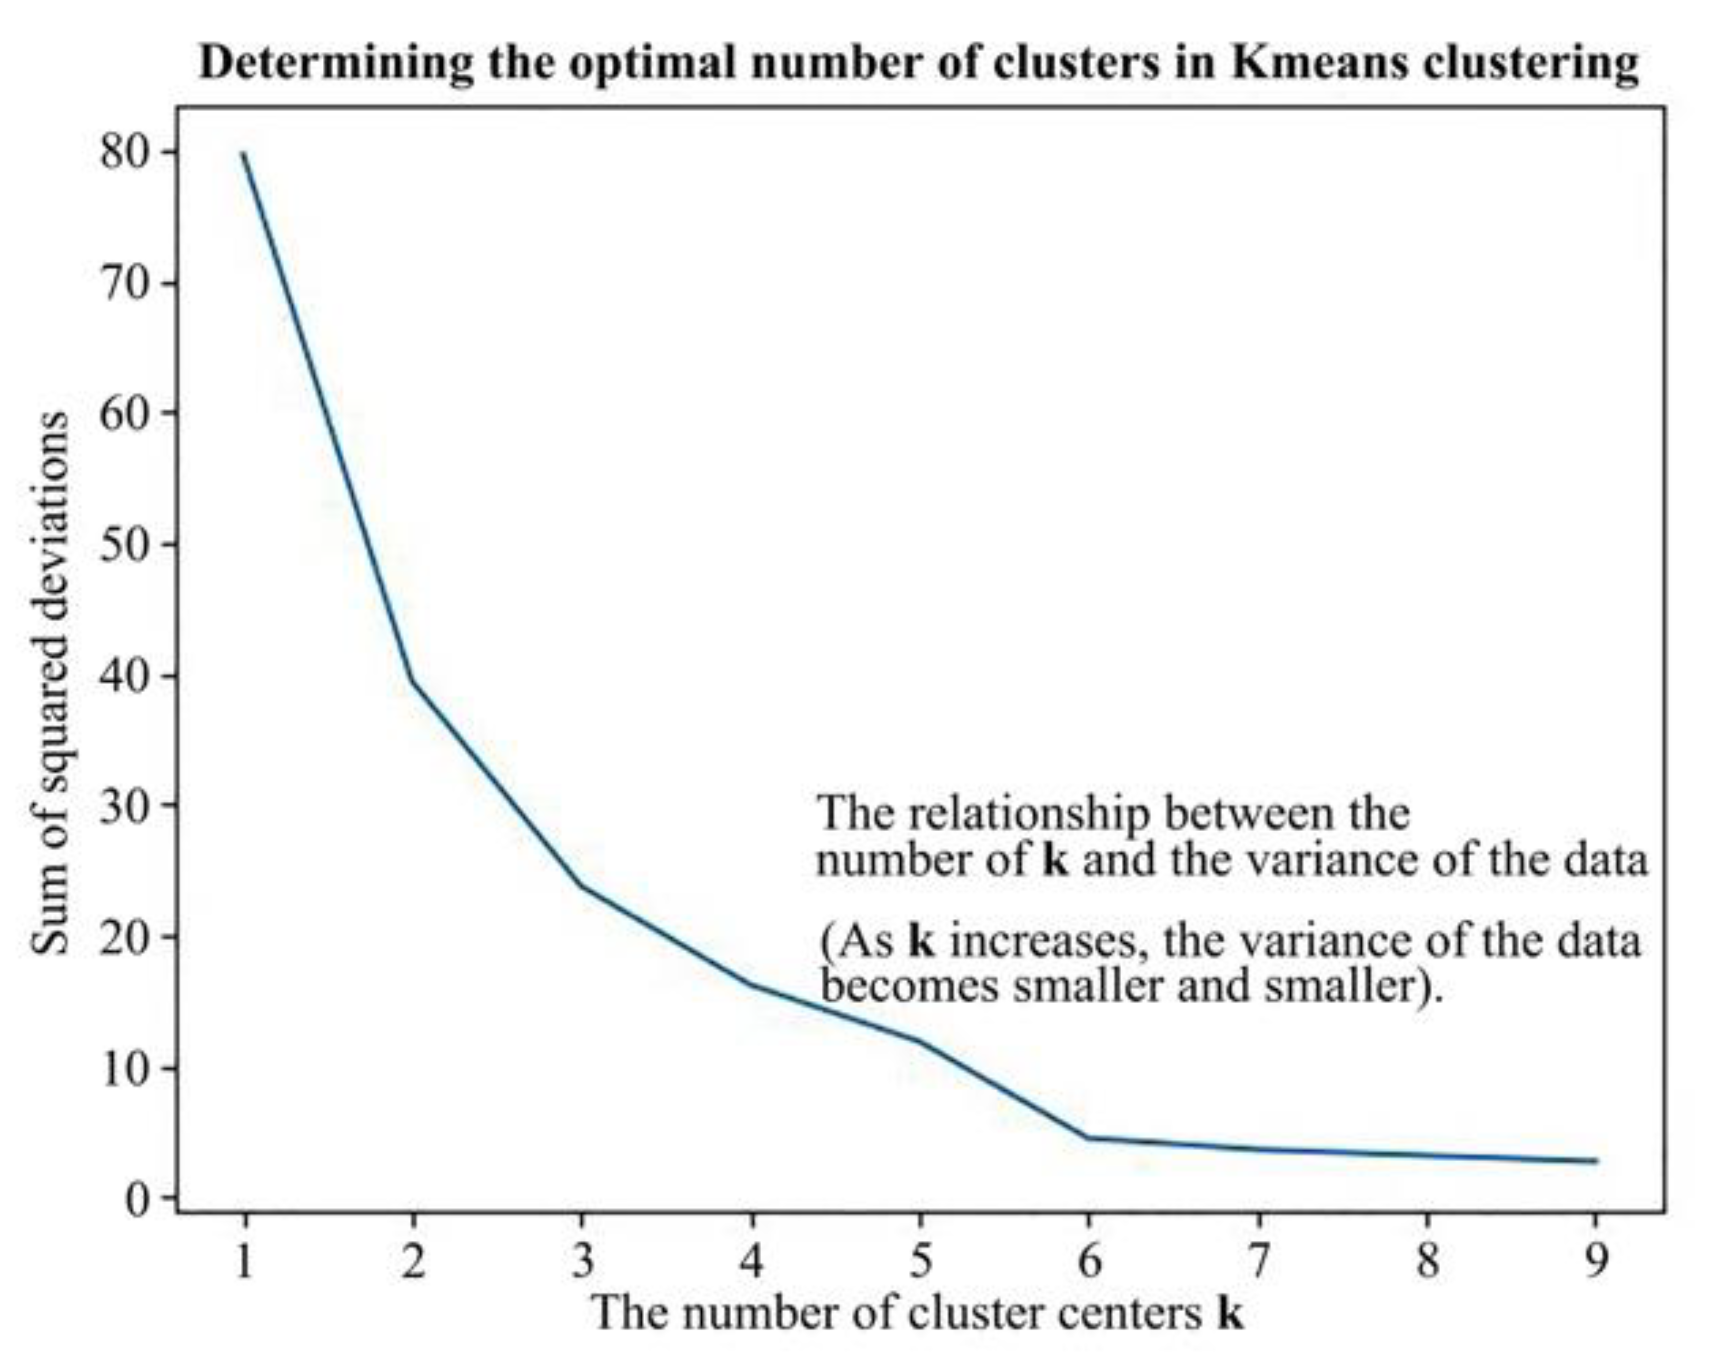
4.2.3. K-Means Method
5. Results and Analysis
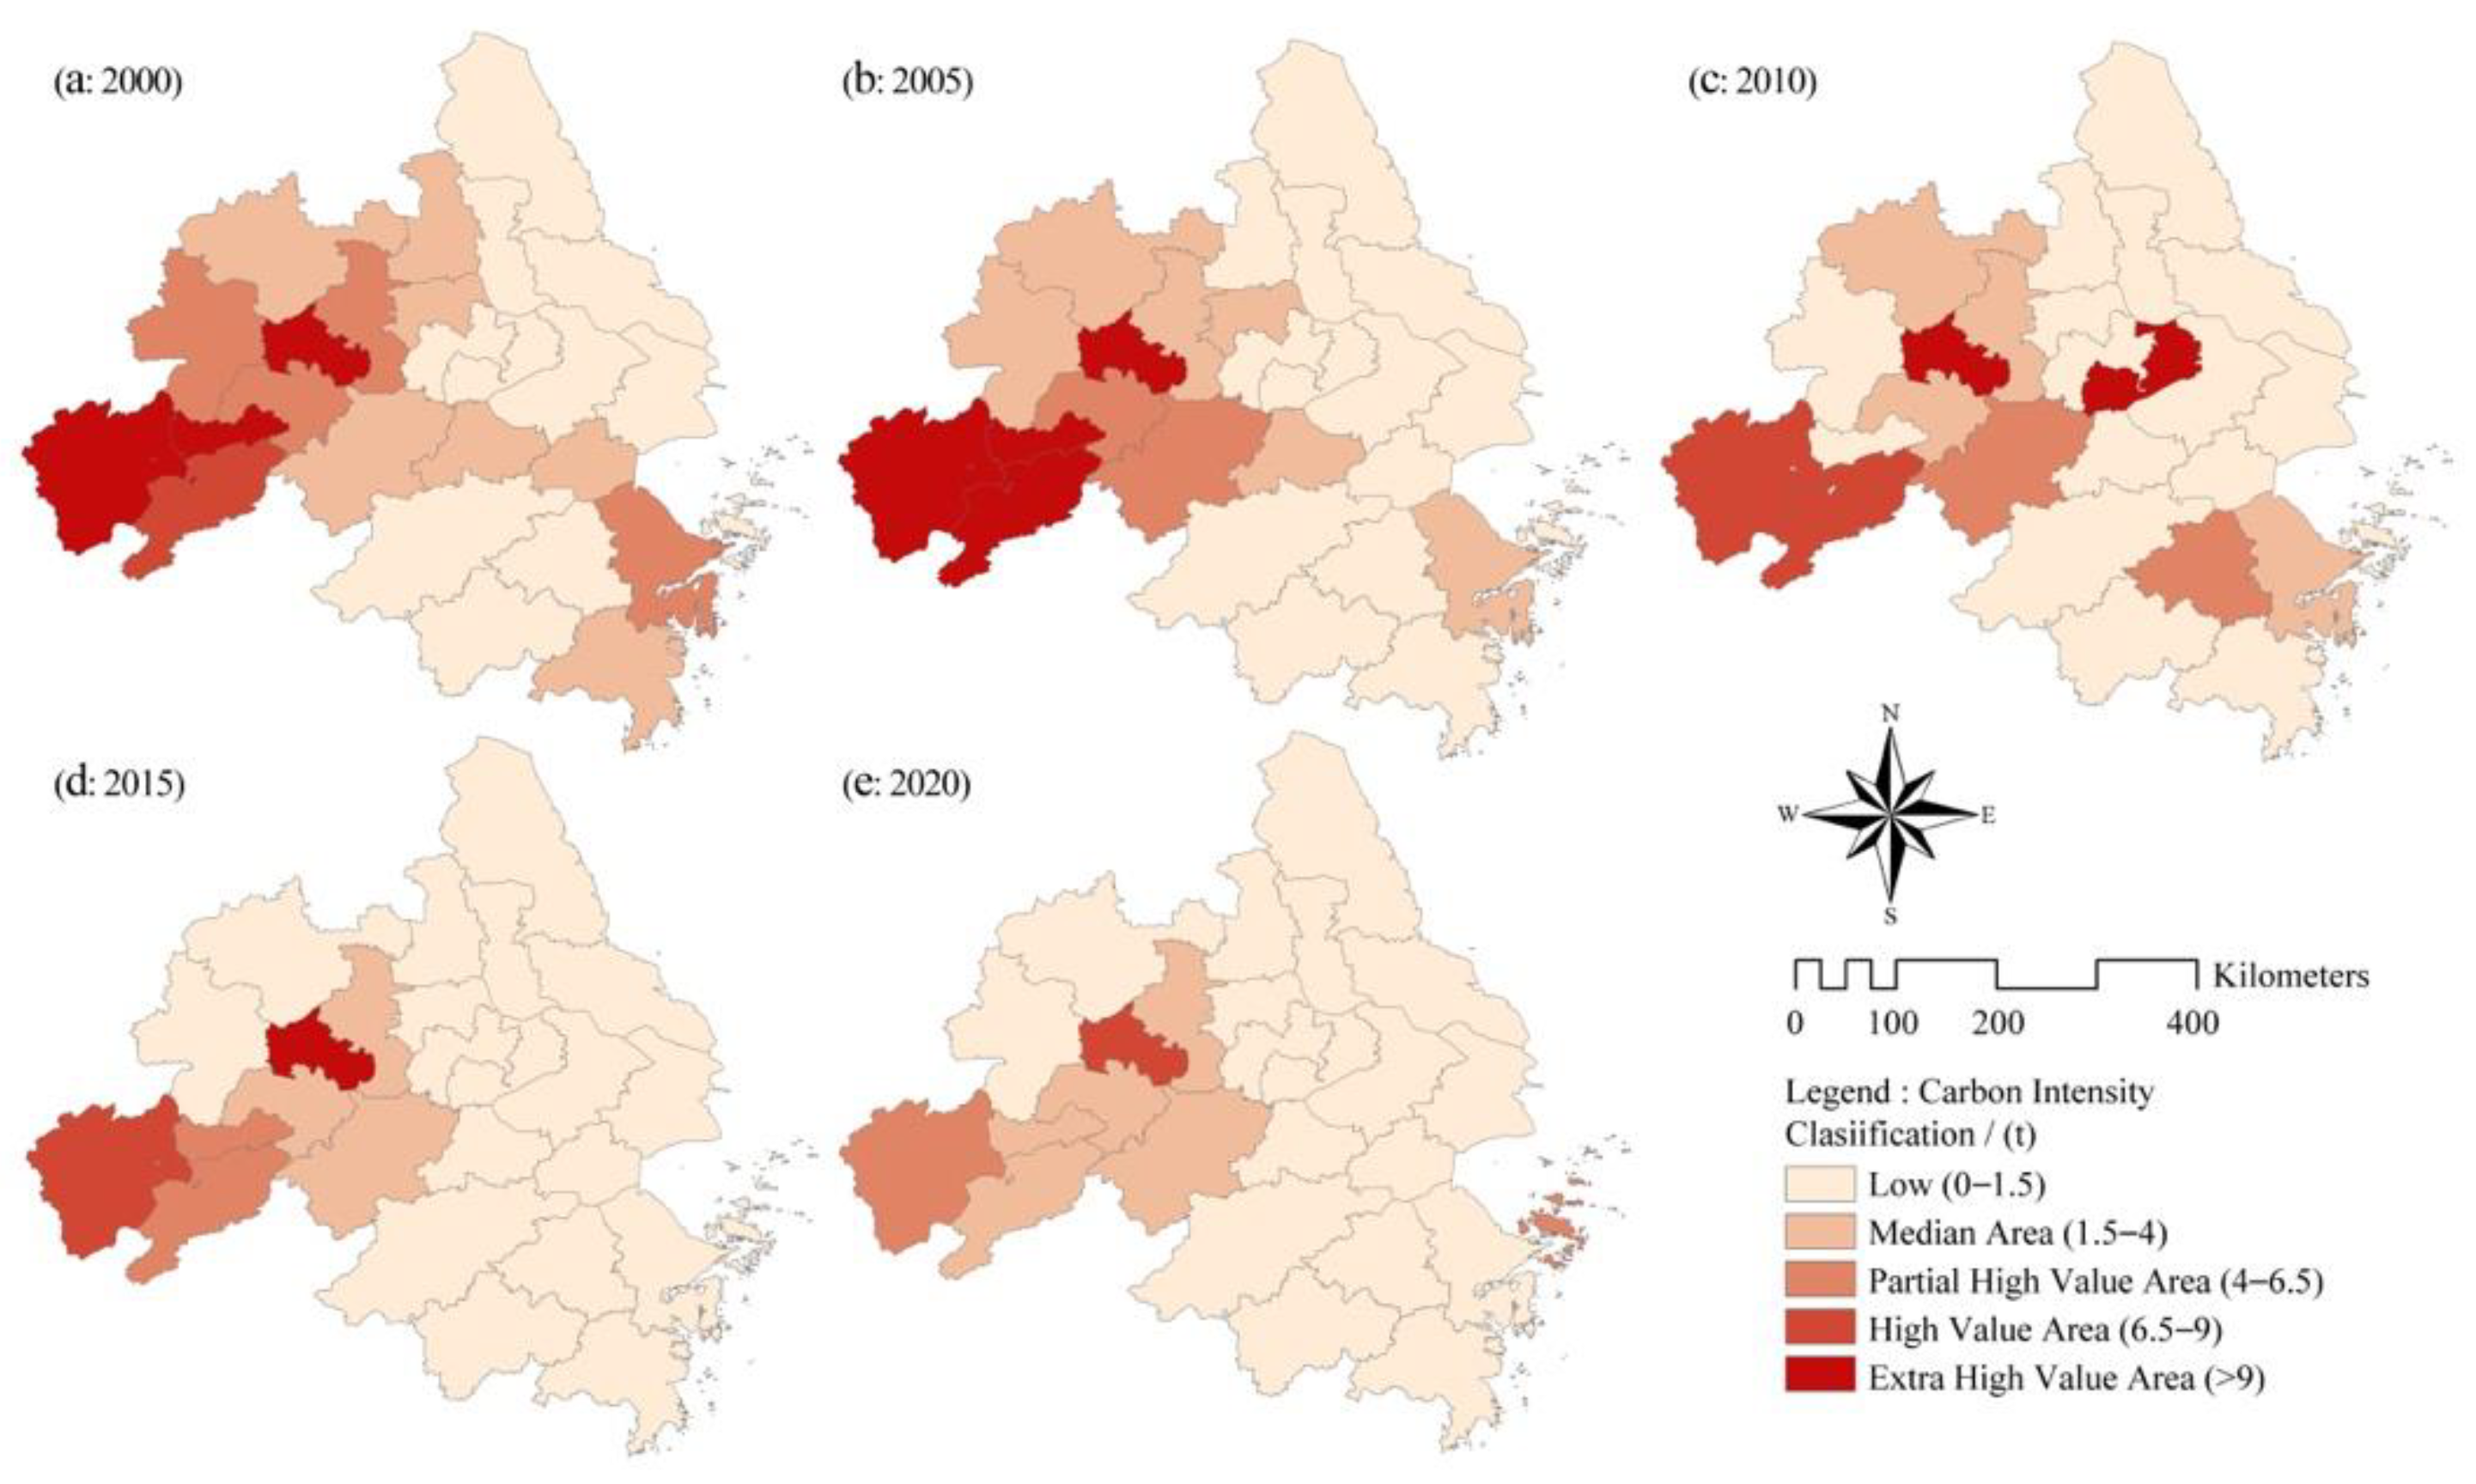
5.1. Variation Analysis of Total CEECs and CEEC Intensity in the YRD
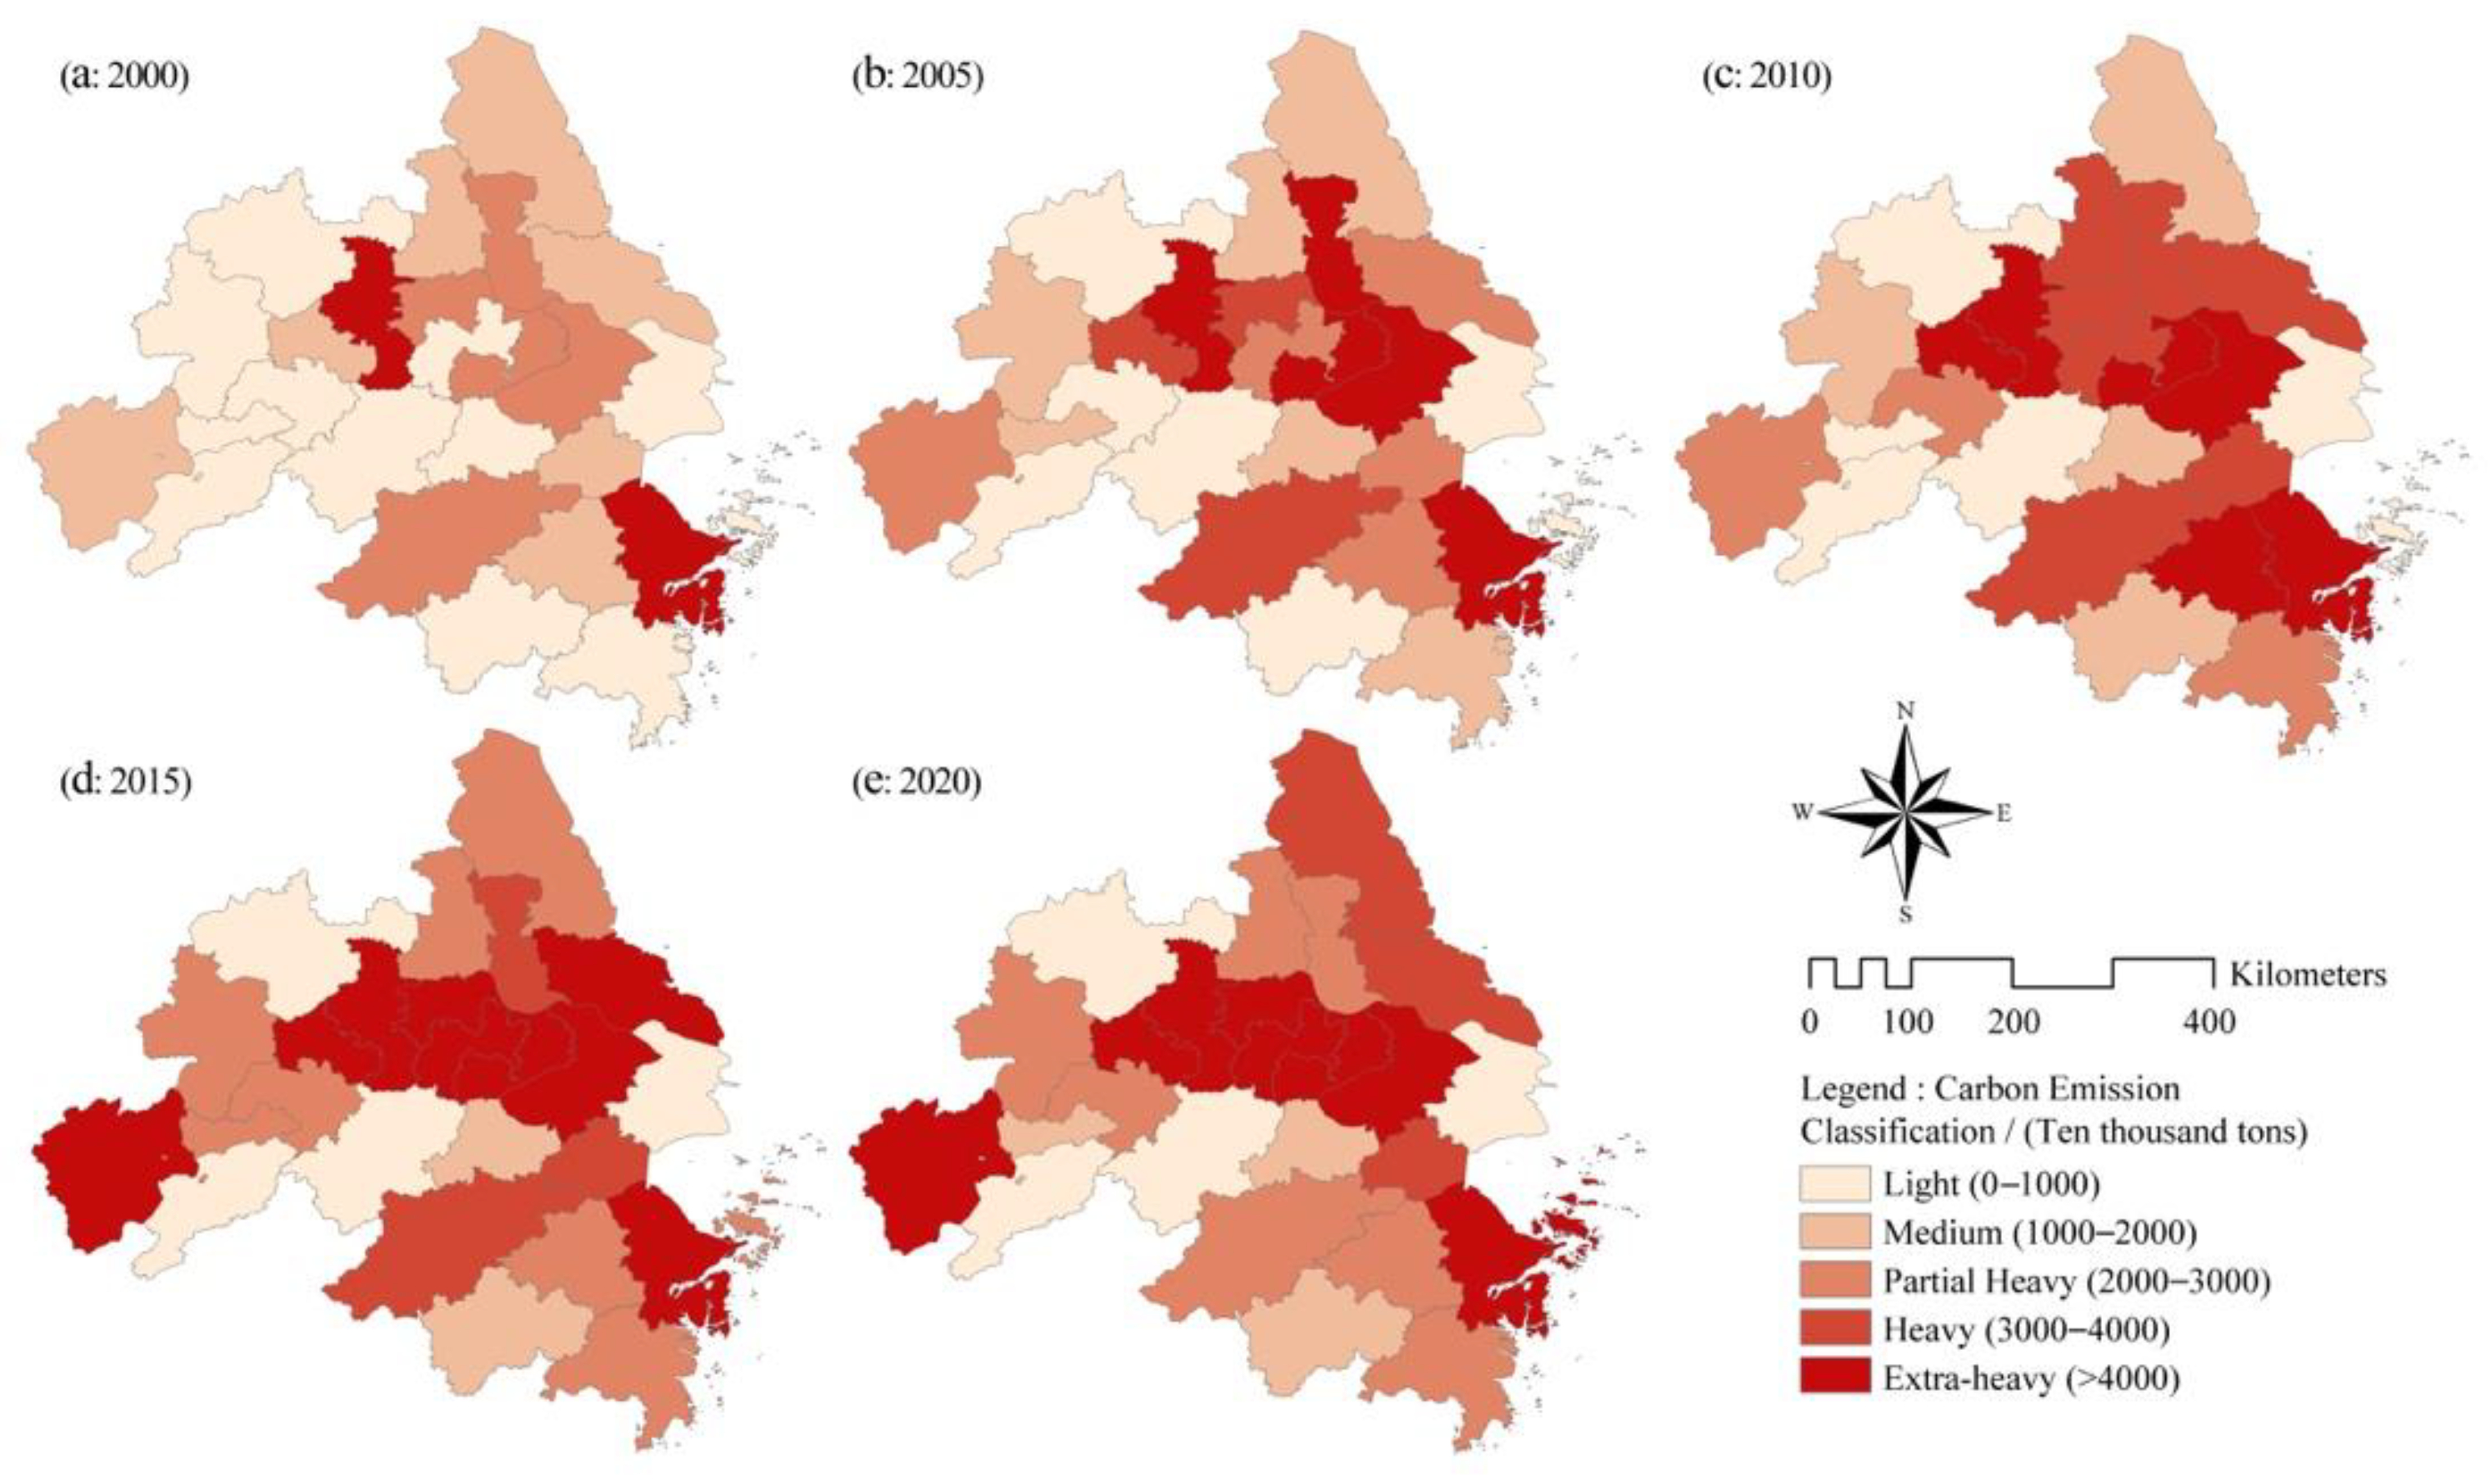
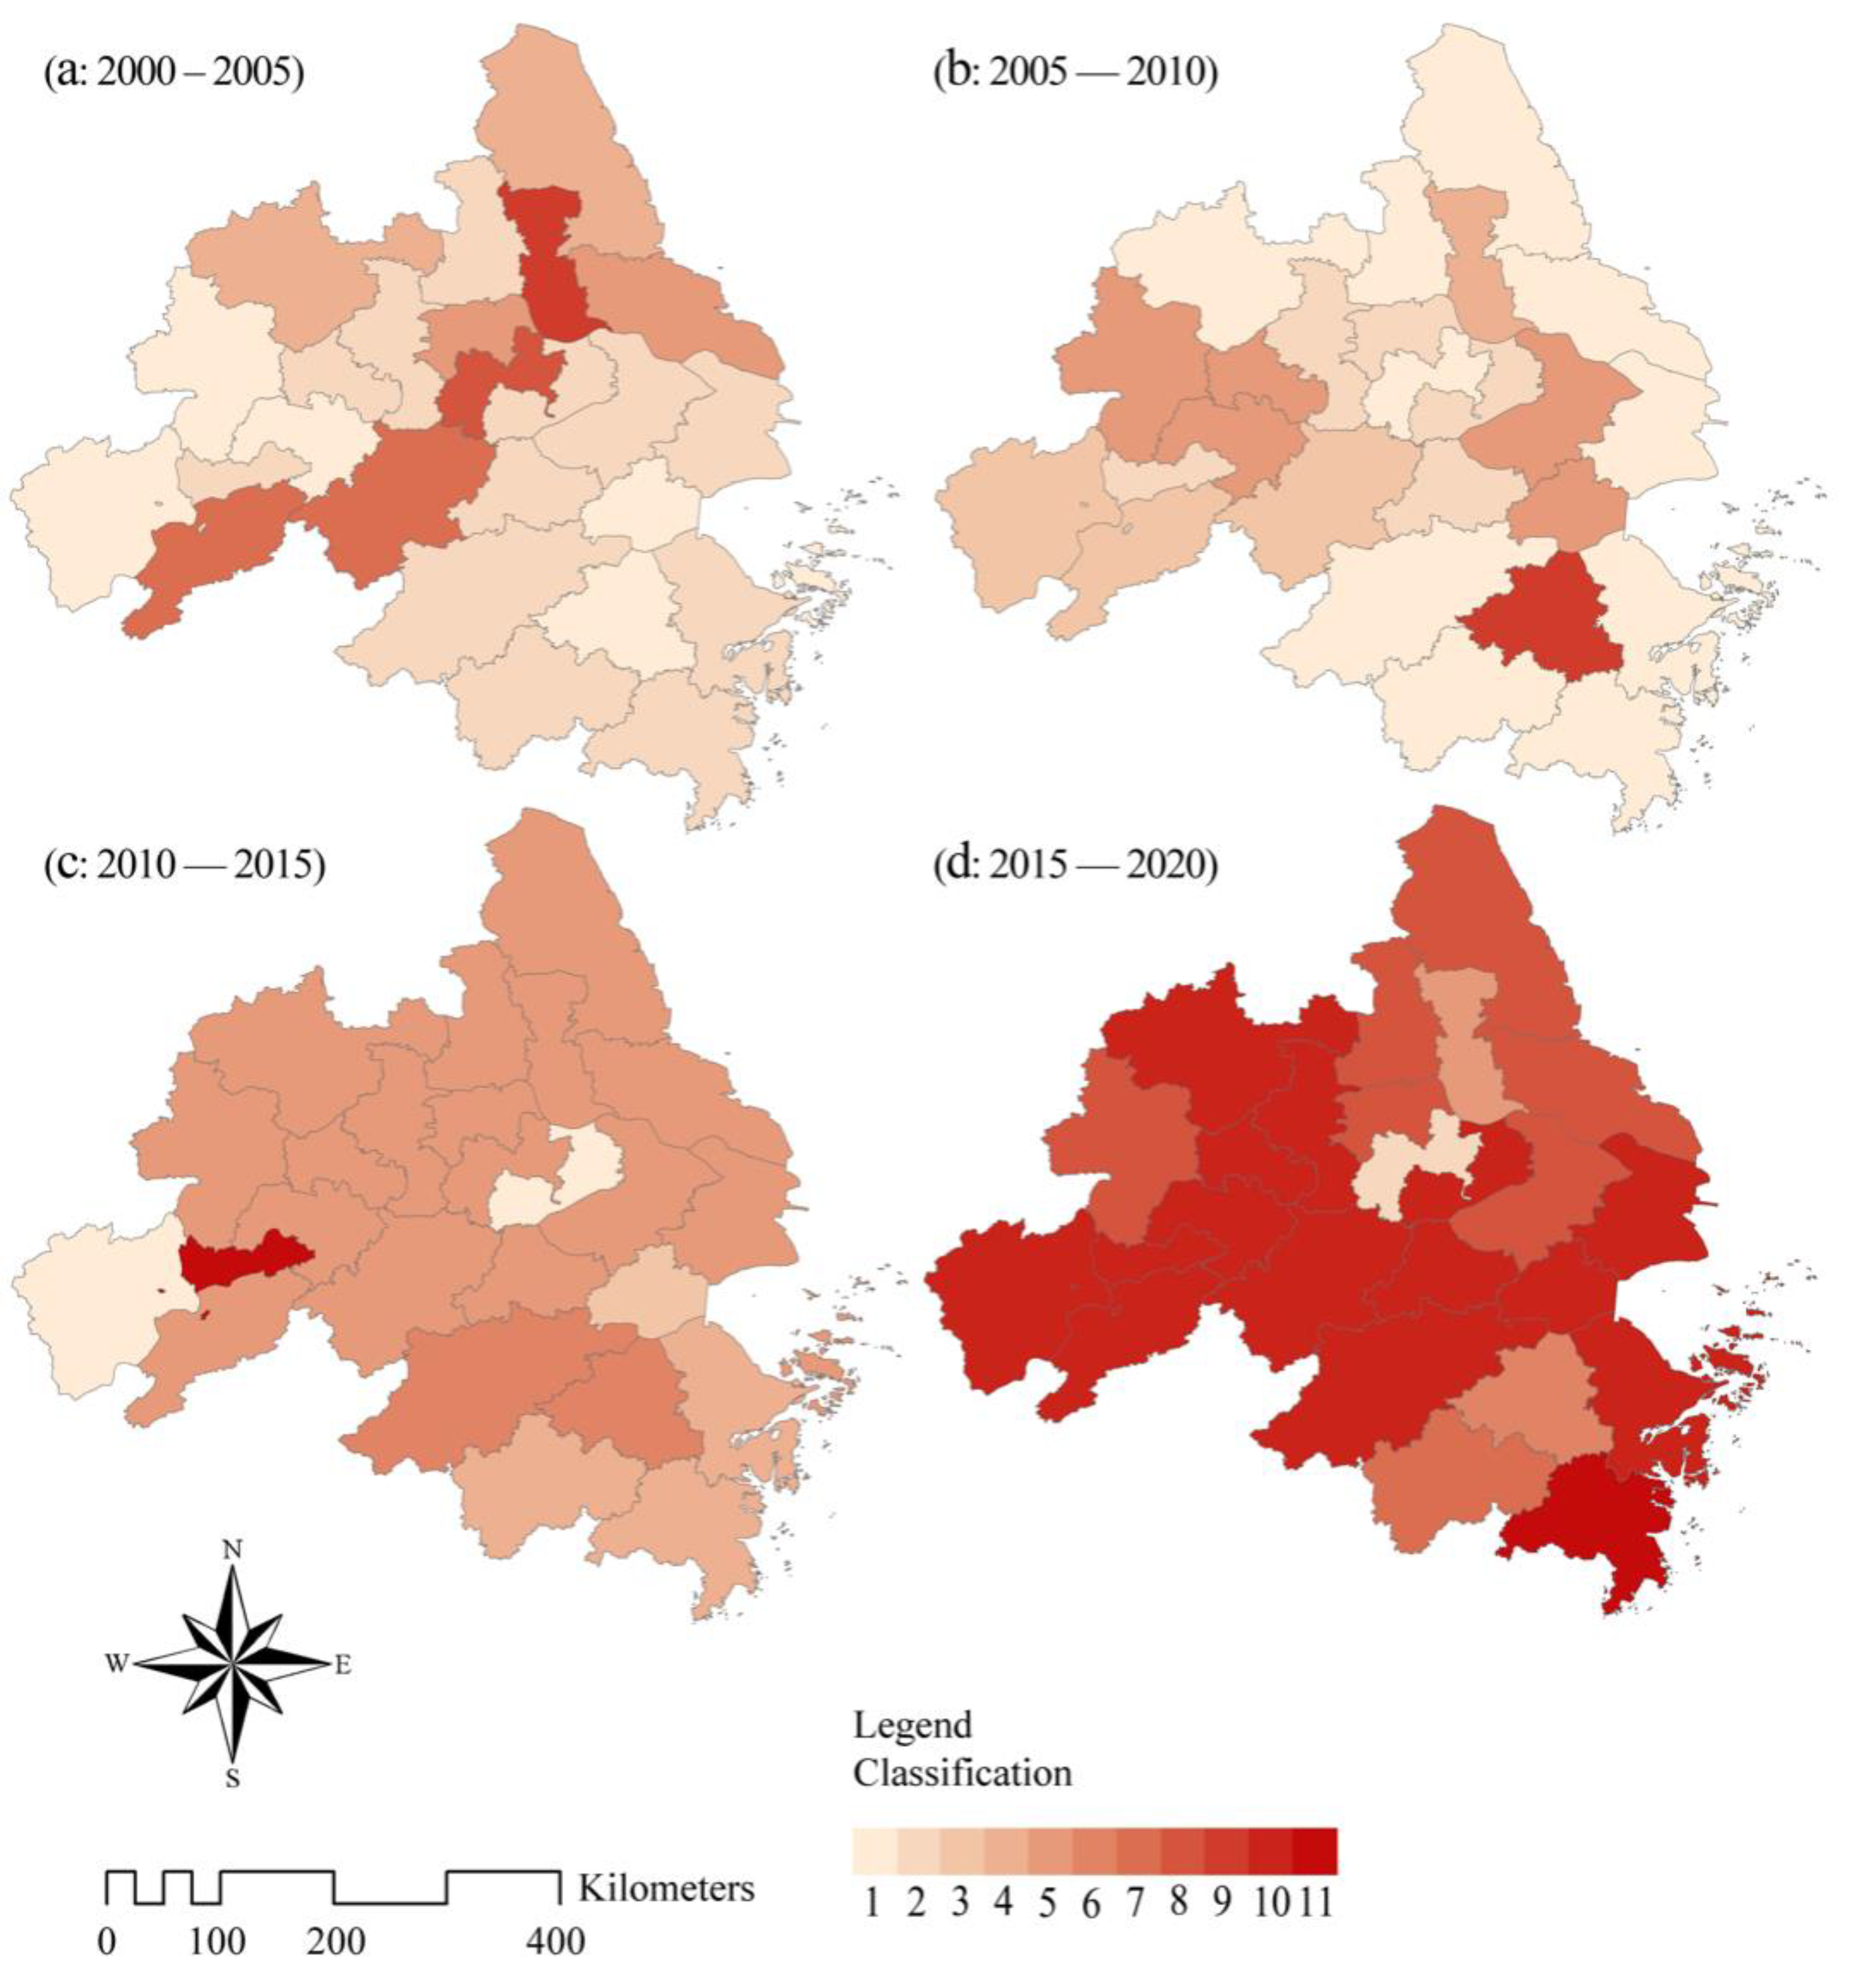
5.2. Spatial and Temporal Distribution Characteristics of Total CEECs
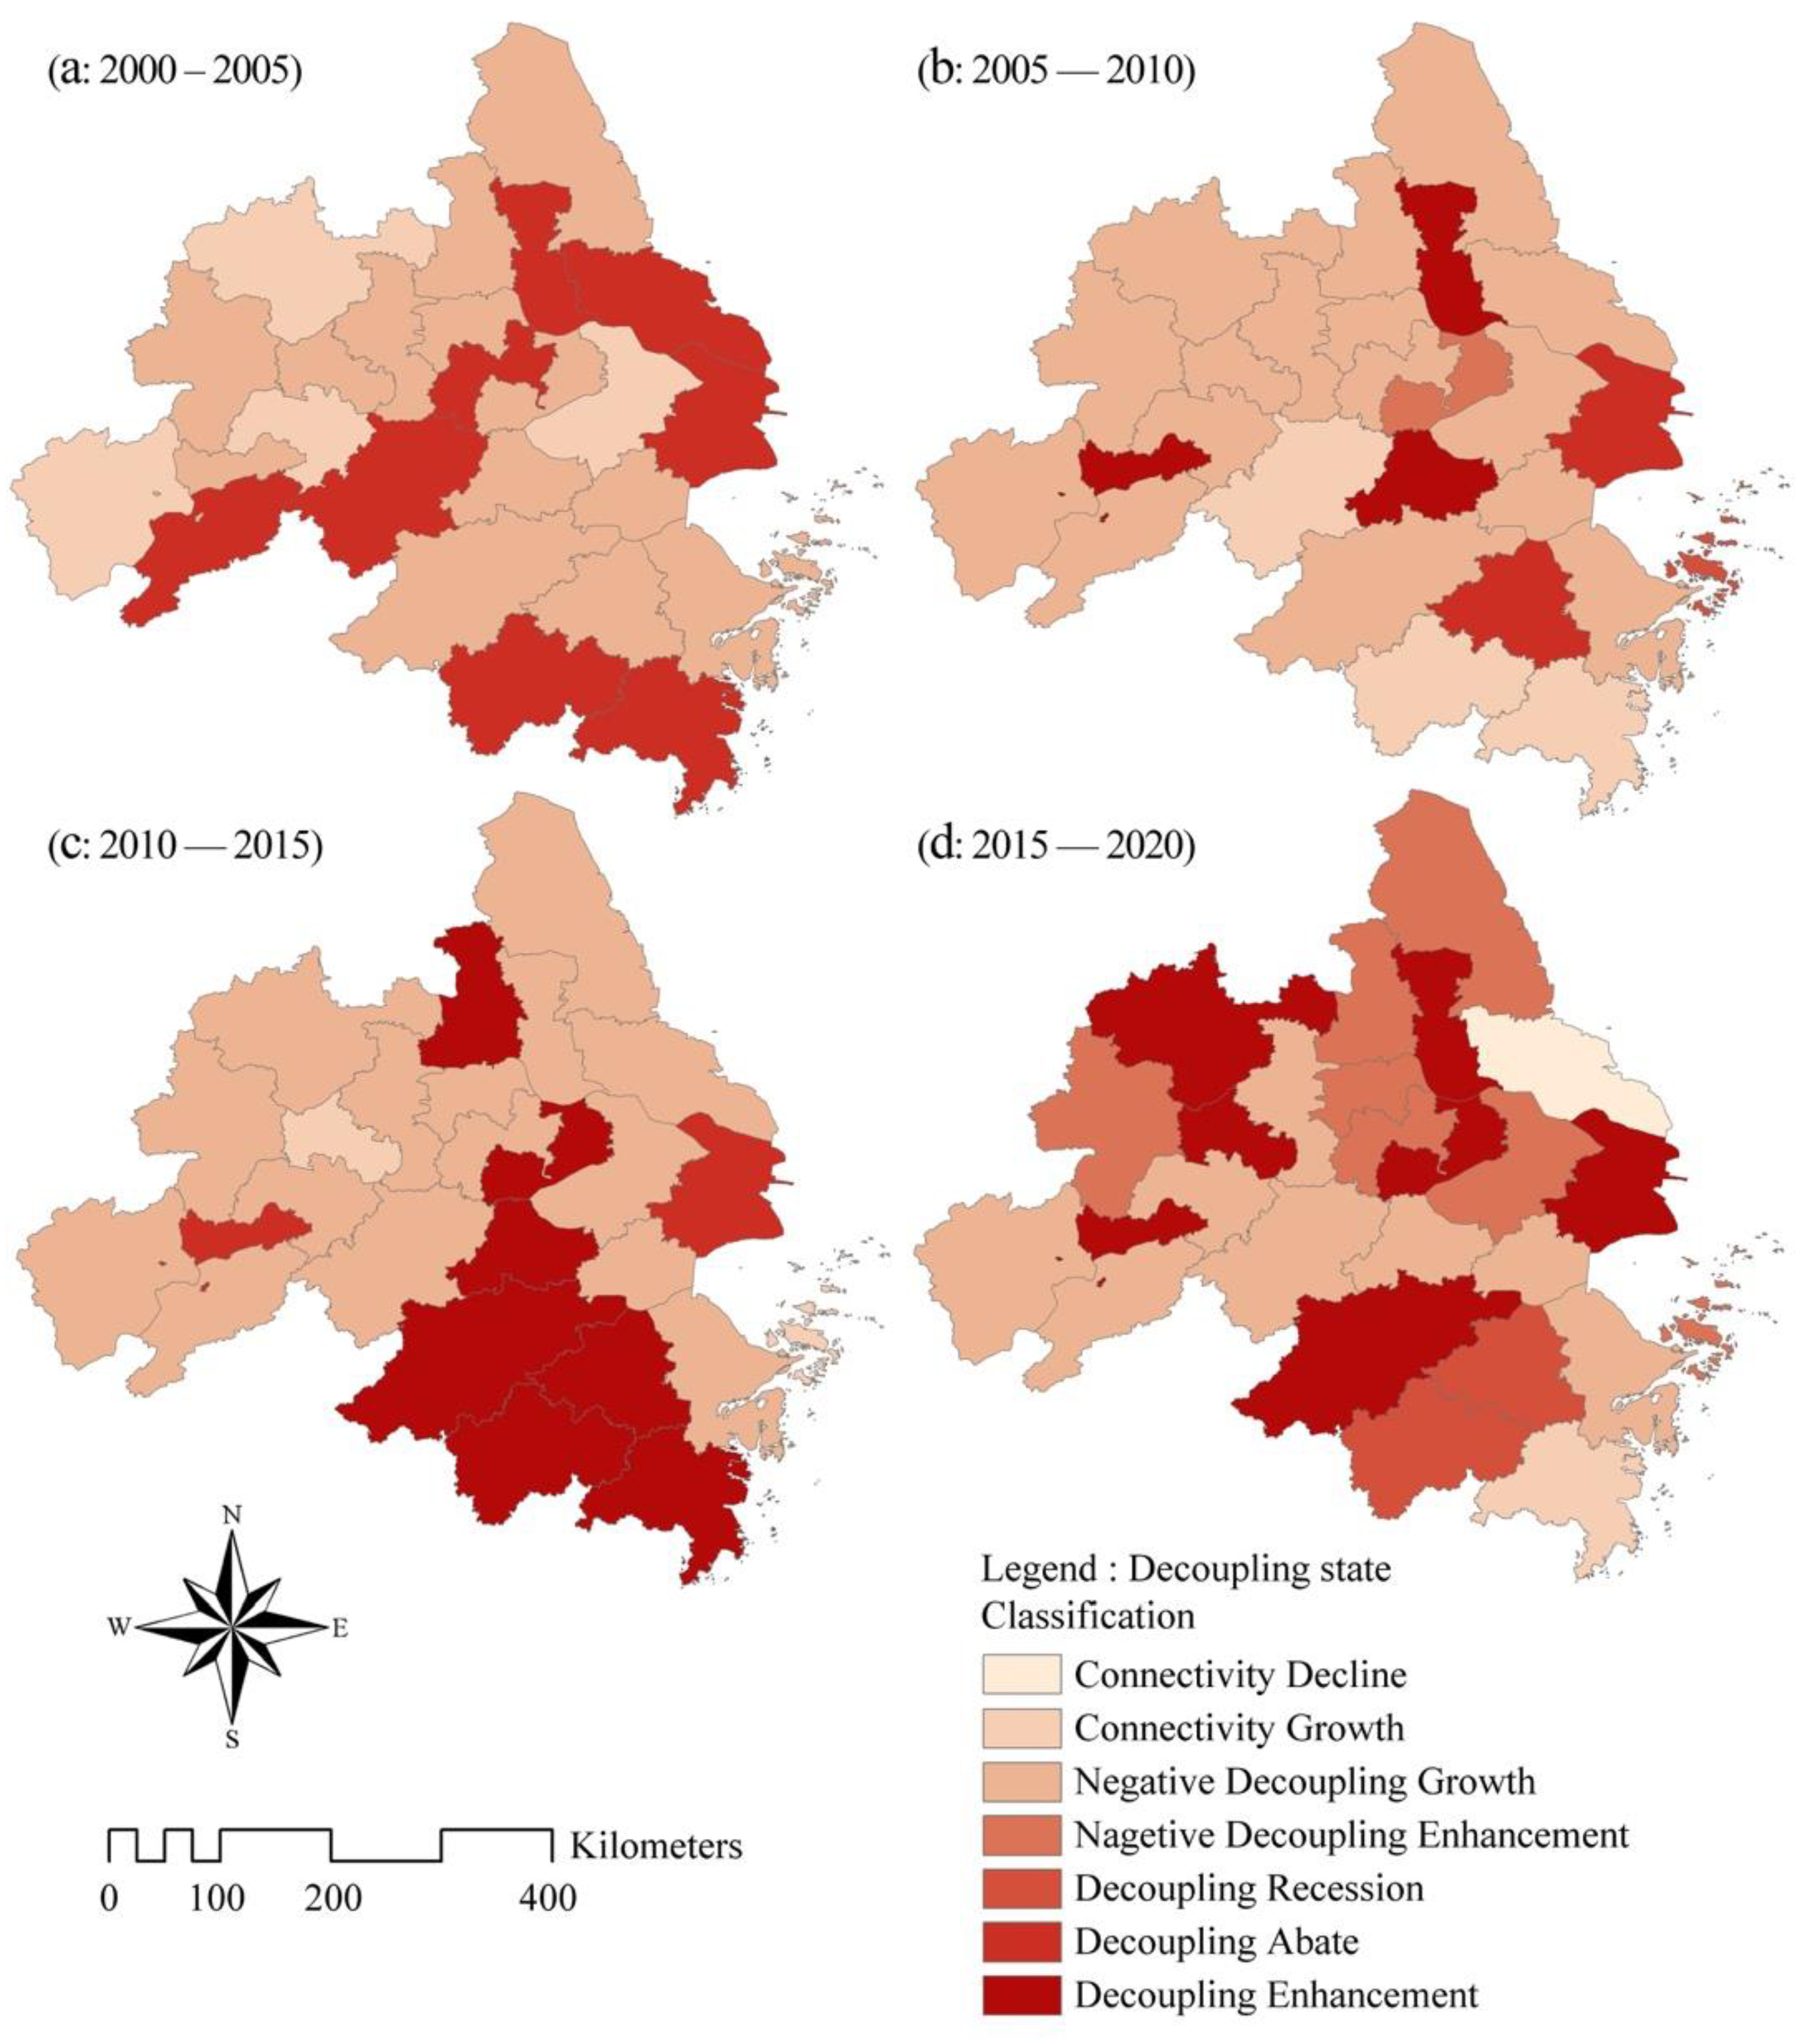
5.3. The Decoupling between CEECs and Economic Growth
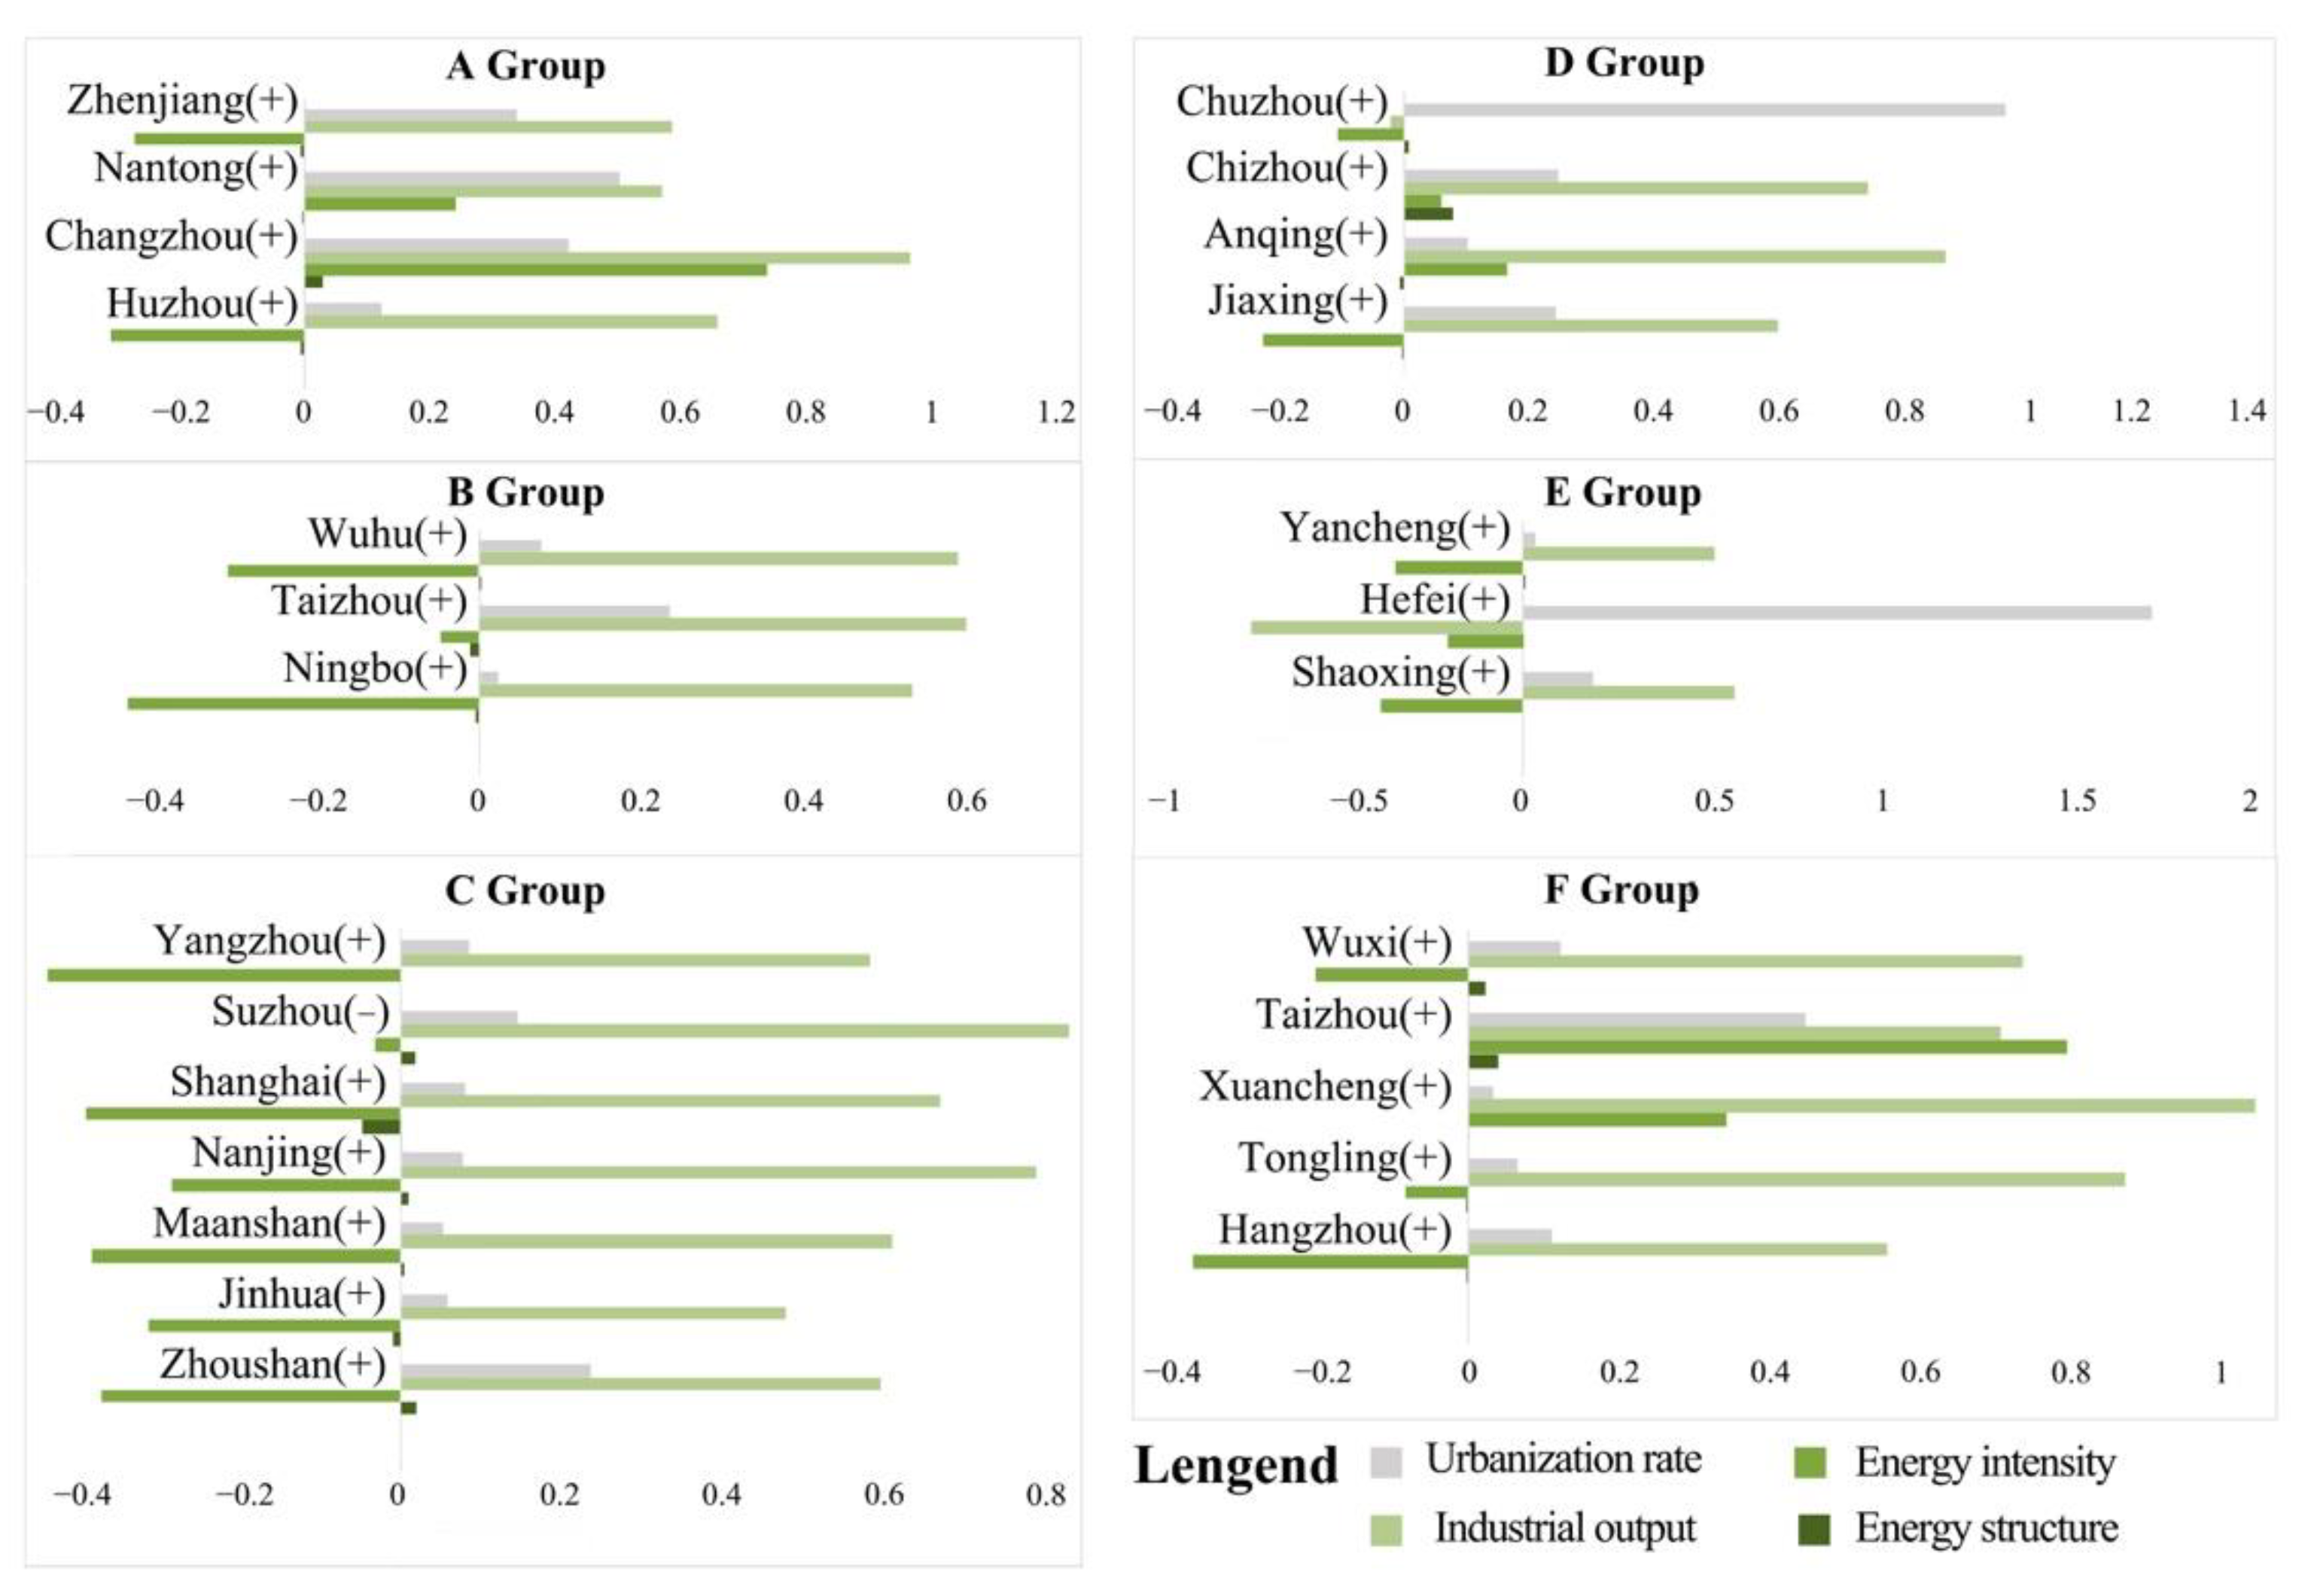
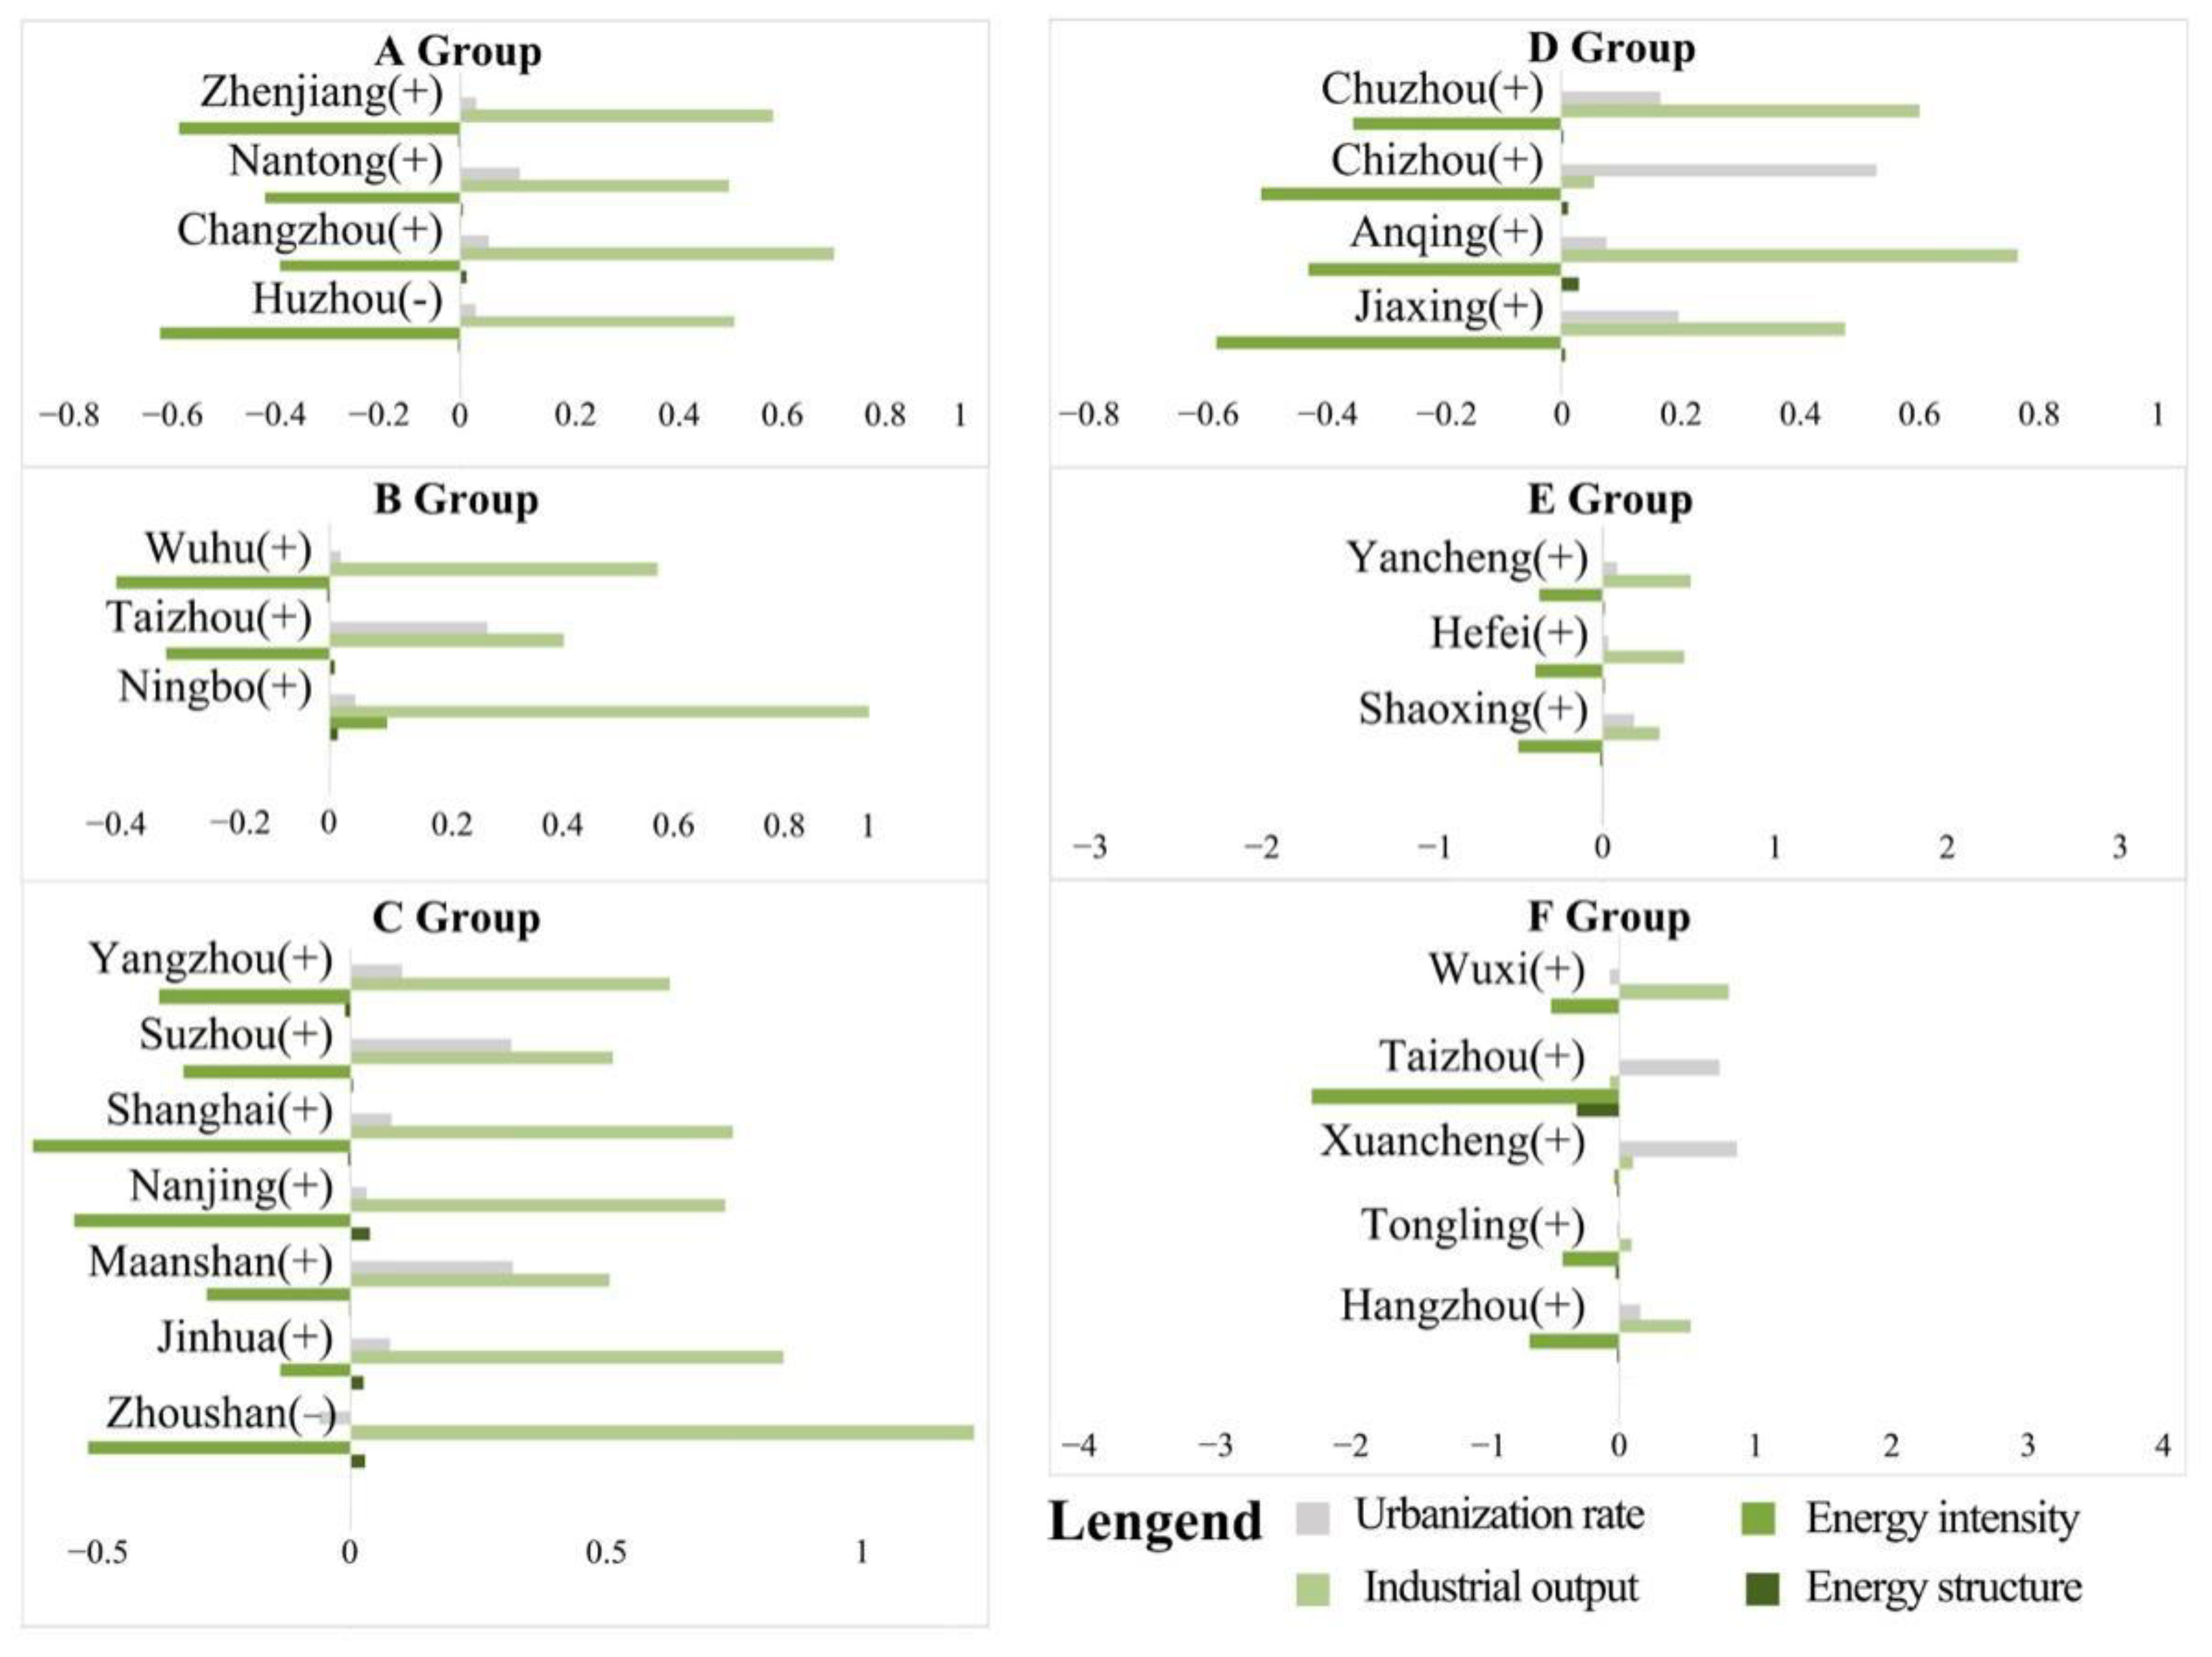
5.4. Decomposition Analysis of Influencing Factors of CEEC Decoupling
5.4.1. The Impact of DES on Decoupling of CEECs
5.4.2. The Impact of DEI on Decoupling of CEECs
5.4.3. The Impact of DEL Value on CEEC Decoupling
5.4.4. The Impact of DP on CEEC Decoupling
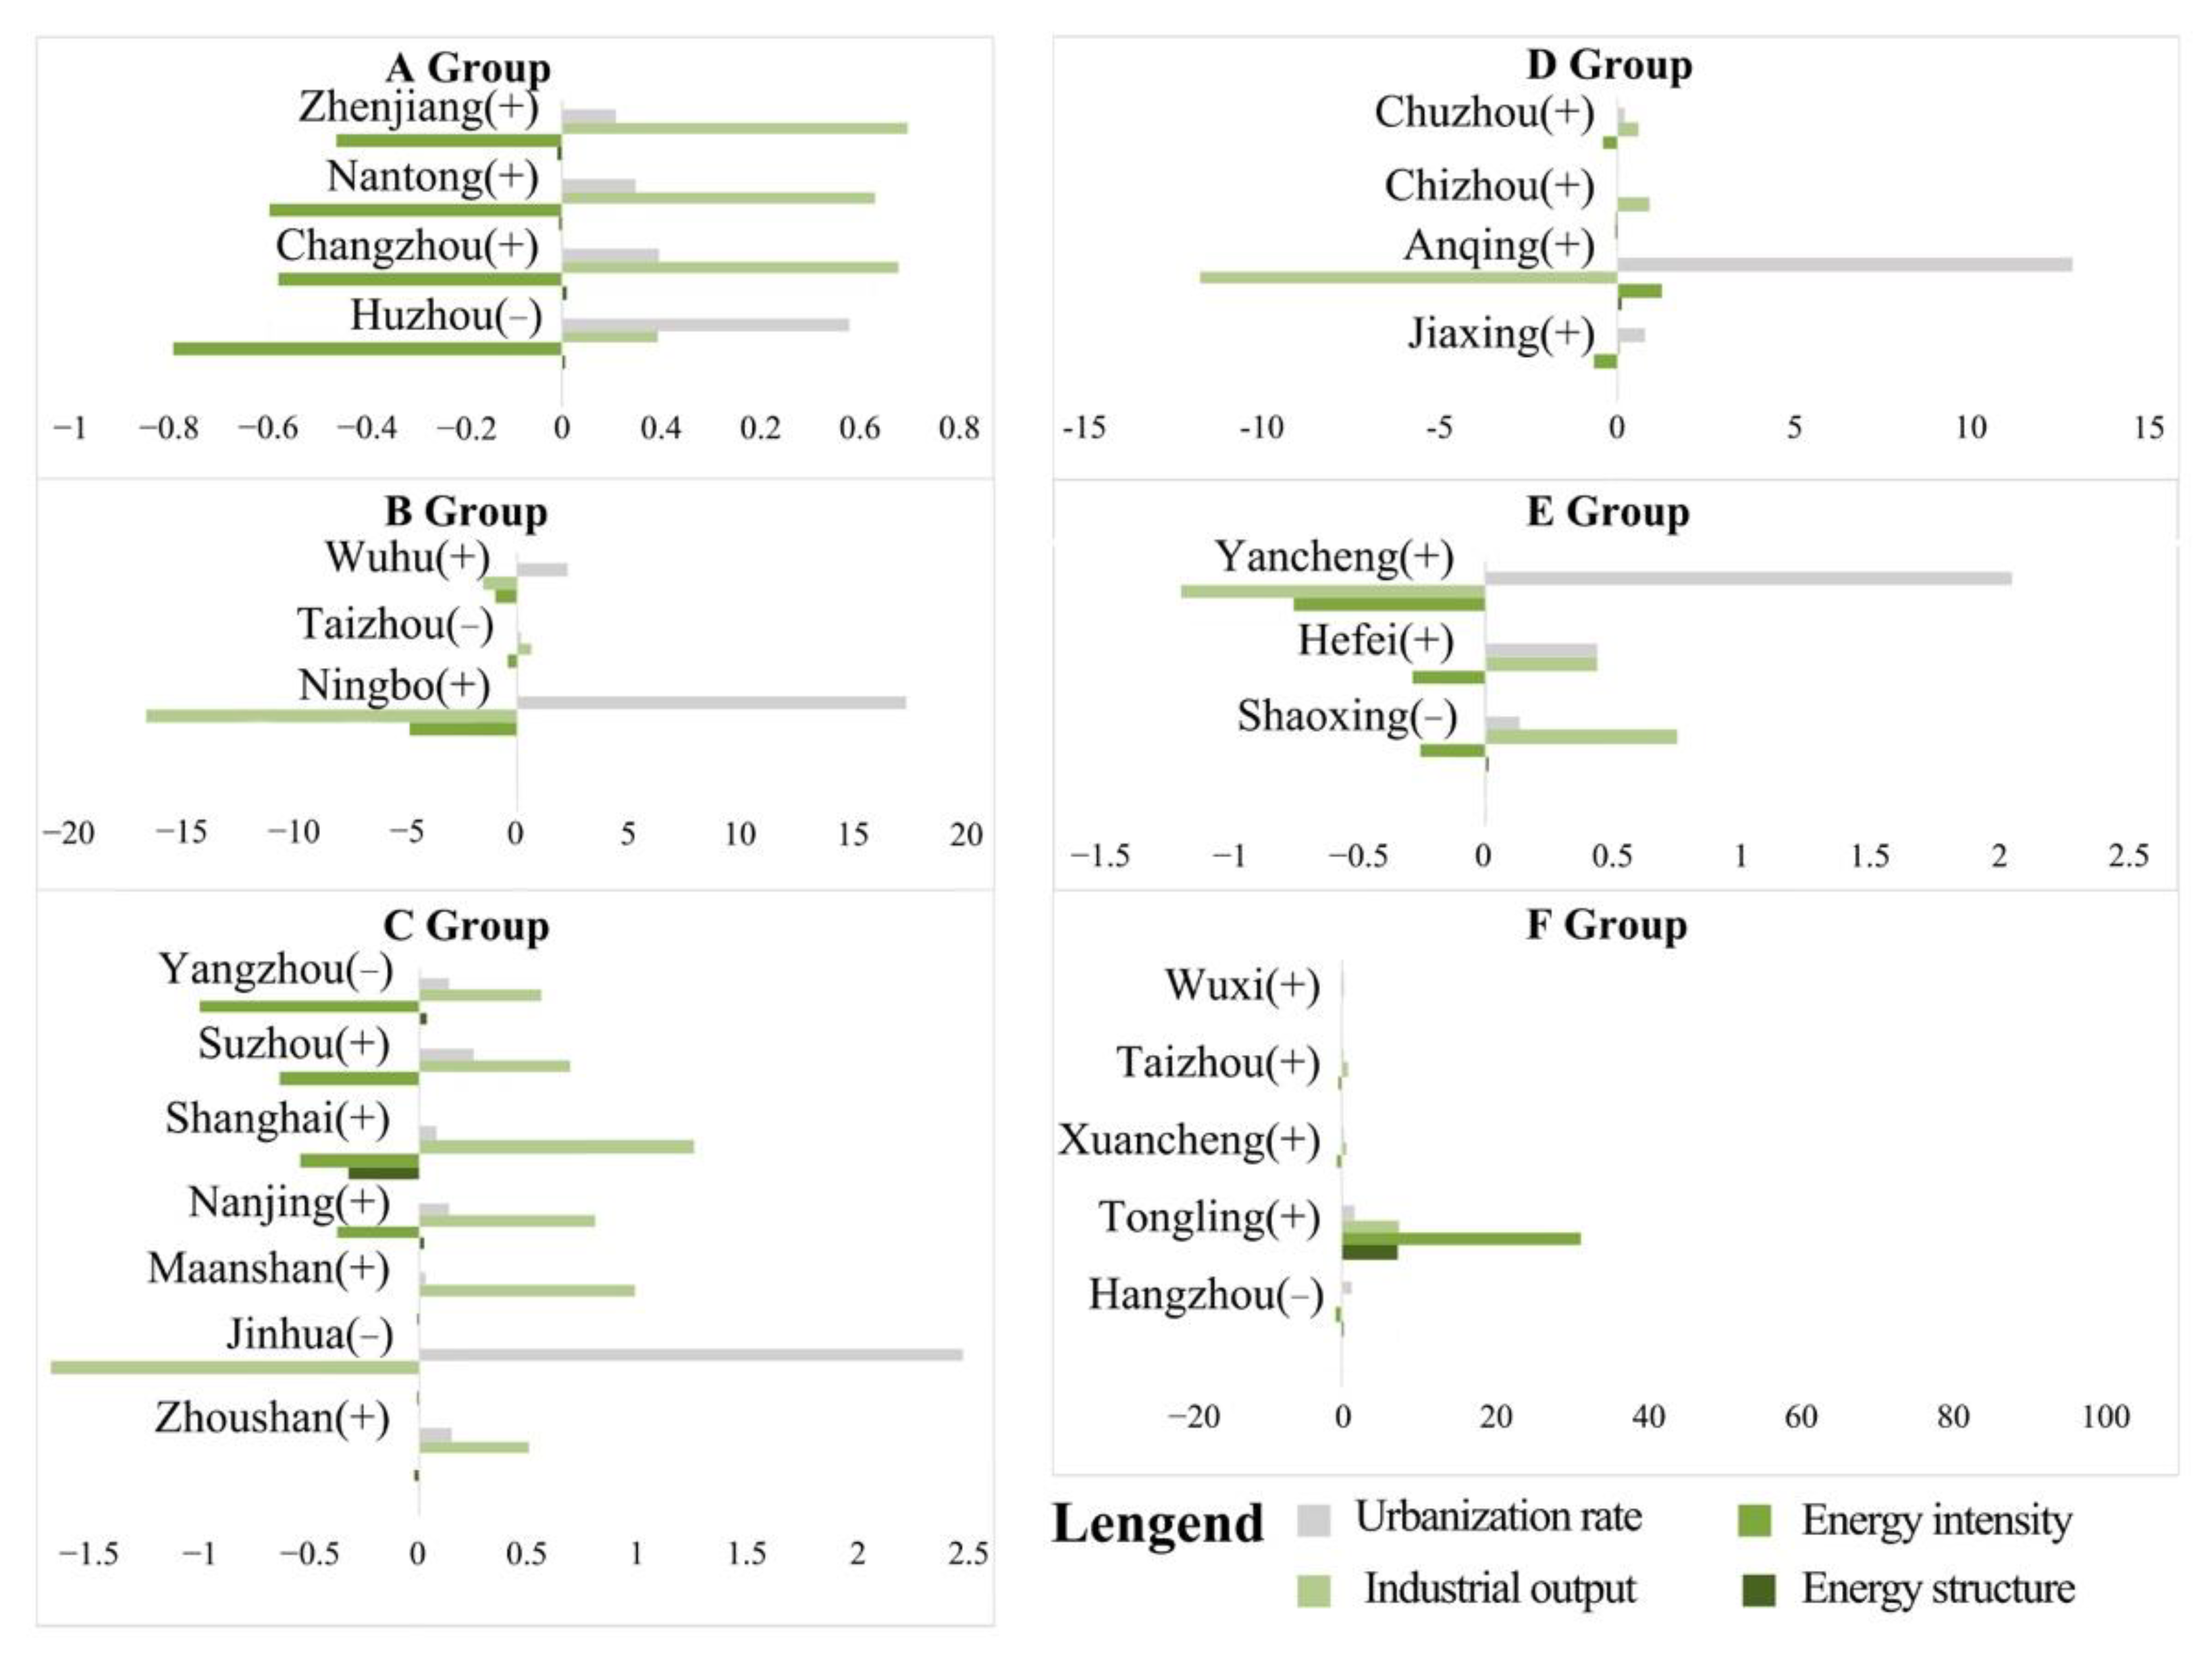
5.4.5. Drivers of CEECs by Stage
5.4.6. A Staged Analysis of the Composite Effects of CEEC Drivers
6. Conclusions and Policy Implications
Author Contributions
Funding
Institutional Review Board Statement
Informed Consent Statement
Data Availability Statement
Conflicts of Interest
References
- Li, L.C.; Chen, W.; Guo, K.M.; Yue, F.; Tang, Y. Policy analysis of carbon neutrality strategic actions in developed countries from the perspective of policy tools and its enlightenment to my country. J. Intell. 2021, 40, 63–71. [Google Scholar]
- Yu, A.; Lin, X.; Zhang, Y.; Peng, L.H. Analysis of driving factors and allocation of carbon emission allowance in China. Sci. Total Environ. 2019, 673, 74–82. [Google Scholar] [CrossRef] [PubMed]
- Yang, S.D.; Yang, X.; Wu, X.L.; Wu, Y.F.; Zhou, J. The impact of environmental regulation on the spatial and temporal differences of regional carbon emissions: An empirical analysis based on 32 prefecture-level cities in the three northeastern provinces. J. Environ. Sci. 2021, 41, 2029–2038. [Google Scholar]
- Liu, Z.B.; Chen, L. Demonstration Value and Motivation Mechanism of Regional Integration Development in the Yangtze River Delta Region. Reform 2018, 12, 65–71. [Google Scholar]
- Zhang, W.S.; Xu, Y.; Wang, C.; Streets, G. Assessment of the driving factors of CO2 mitigation costs of household biogas systems in China: A LMDI decomposition with cost analysis model. Renew. Energy 2022, 181, 978–989. [Google Scholar] [CrossRef]
- Zhu, X.H.; Zou, J.W.; Chao, F. Analysis of industrial energy-related CO2 emissions and the reduction potential of cities in the Yangtze River Delta region. J. Clean Prod. 2017, 168, 791–802. [Google Scholar] [CrossRef]
- Meng, H.; Huang, X.J.; Yang, H.; Chen, Z.G.; Yang, J.; Zhou, Y.; Li, J.B. The influence of local officials’ promotion incentives on carbon emission in Yangtze River Delta, China. J. Clean Prod. 2019, 213, 1337–1345. [Google Scholar] [CrossRef]
- Fan, F.Y.; Lei, Y.L. Responsive relationship between energy-related carbon dioxide emissions from the transportation sector and economic growth in Beijing Based on decoupling theory. Int. J. Sustain. Transp. 2017, 11, 764–775. [Google Scholar] [CrossRef]
- Wang, L.L.; Li, Y.; He, W.W. The energy footprint of China’s textile industry: Perspectives from de-coupling and decomposition analysis. Energies 2017, 10, 1461. [Google Scholar] [CrossRef] [Green Version]
- Park, S.H.; Dissmann, B.; Nam, K.Y. A cross-country decomposition analysis of manufacturing energy-consumption. Energy 1993, 18, 843–858. [Google Scholar] [CrossRef]
- Wang, J.; Hu, M.; Rodrigues, J.F.D. The evolution and driving forces of industrial aggregate energy intensity in China: An extended decomposition analysis. Appl. Energy 2018, 228, 2195–2206. [Google Scholar] [CrossRef]
- Huo, T.F.; Ma, Y.L.; Yu, T.; Cai, W.G.; Liu, B.S.; Ren, H. Decoupling and decomposition analysis of residential building carbon emissions from residential income: Evidence from the provincial level in China. Environ. Impact Assess. Rev. 2021, 86, 106487. [Google Scholar] [CrossRef]
- Ma, X.; Wang, C.; Dong, B.; Gu, G.; Chen, R.; Li, Y.; Zou, H.; Zhang, W.; Li, Q. Carbon emissions from energy consumption in China: Its measurement and driving factors. Sci. Total Environ. 2018, 648, 1411–1420. [Google Scholar] [CrossRef]
- Xu, S.C.; He, Z.X.; Long, R.Y.; Chen, H. Factors that influence carbon emissions due to energy consumption based on different stages and sectors in China. J. Clean. Prod. 2016, 115, 139–148. [Google Scholar] [CrossRef]
- Yang, J.; Cai, W.; Ma, M.; Li, L.; Liu, C.; Ma, X.; Li, L.; Chen, X. Driving forces of China’s CO2 emissions from energy consumption based on Kaya-LMDI methods. Sci. Total Environ. 2019, 711, 134569. [Google Scholar] [CrossRef]
- Liu, D.; Cheng, R.; Li, X.; Zhao, M.M. On the driving factors of China’s provincial carbon emission from the view of periods and groups. Environ. Sci. Pollut. Res. 2021, 28, 51971–51988. [Google Scholar] [CrossRef]
- Grossman, G.M.; Krueger, A.B. Environmental Impacts of a North American Free Trade Agreement (No. w3914); National Bureau of Economic Research: Cambridge, MA, USA, 1991. [Google Scholar]
- OECD. Indicators to Measure Decoupling of Environmental Pressures from Economic Growth; OECD: Paris, France, 2002. [Google Scholar]
- Zhang, Z.X. Decoupling China’s carbon emissions increase from economic growth: An economic analysis and policy implications. World Dev. 2000, 28, 739–752. [Google Scholar] [CrossRef]
- De Freitas, L.C.; Kaneko, S. Decomposing the decoupling of CO2 emissions and economic growth in Brazil. Ecol. Econ. 2011, 70, 1459–1469. [Google Scholar] [CrossRef]
- Tapio, P. Towards a theory of decoupling: Degrees of decoupling in the EU and the case of road traffic in Finland between 1970 and 2001. Transp. Policy 2005, 12, 137–151. [Google Scholar] [CrossRef] [Green Version]
- Zhang, M.; Song, Y.; Su, B.; Sun, X.M. Decomposing the decoupling indicator between the economic growth and energy consumption in China. Energy Effic. 2015, 8, 1231–1239. [Google Scholar] [CrossRef]
- Chang, K.L.; Du, Z.F.; Chen, G.J.; Zhang, Y.X.; Sui, L.L. Panel estimation for the impact factors on carbon dioxide emissions: A new regional classification perspective in China. J. Clean Prod. 2021, 279, 12363. [Google Scholar] [CrossRef]
- Song, M.L.; Guo, X.; Wu, K.Y.; Wang, G.X. Driving effect analysis of energy-consumption carbon emissions in the Yangtze River Delta region. J. Clean. Prod. 2015, 103, 620–628. [Google Scholar] [CrossRef]
- Gong, L.; Tu, H.Z.; Gong, C. Research on the influencing factors of energy consumption carbon emissions based on STIRPAT model: Taking the Yangtze River Delta as an example. Ind. Technol. Econ. 2018, 37, 95–102. [Google Scholar]
- Ma, N.; Gao, X.; Tian, M.; Wang, C.; Zhang, Y.; Gao, P.P. Decoupling the Relationships between Carbon Footprint and Economic Growth within an Urban Agglomeration-A Case Study of the Yangtze River Delta in China. Land 2021, 10, 923. [Google Scholar] [CrossRef]
- Shen, W.; Liang, H.; Dong, L.; Ren, J.; Wang, G. Synergistic CO2 reduction effects in Chinese urban agglomerations: Perspectives from social network analysis. Sci. Total Environ. 2021, 798, 149352. [Google Scholar] [CrossRef]
- Quan, C.G.; Cheng, X.J.; Yu, S.S.; Ye, X. Analysis on the influencing factors of carbon emission in China’s logistics industry based on LMDI method. Sci. Total Environ. 2020, 734, 138473. [Google Scholar] [CrossRef]
- Wang, M.; Feng, X.Z.; An, Q.; Zhuo, Y.; Zhao, M.X.; Du, X.L.; Wang, P. Research on Green and Low-Carbon Development Strategy of Qinghai Province Based on Decoupling Index and LMDI. Prog. Clim. Change Res. 2021, 17, 598–607. [Google Scholar]
- Zhang, C.J.; Zhao, Y.; Shi, C.F.; Chiu, Y.H. Can China achieve its water use peaking in 2030? A scenario analysis based on LMDI and Monte Carlo method. J. Clean. Prod. 2021, 278, 123214. [Google Scholar] [CrossRef]
- Gu, S.; Fu, B.T.; Thriveni, T.; Fujita, T.; Ahn, J. Coupled LMDI and system dynamics model for estimating urban CO2 emission mitigation potential in Shanghai, China. J. Clean. Prod. 2019, 240, 118034. [Google Scholar] [CrossRef]
- Guo, Y.; Cao, X.Z.; Wei, W.D.; Zeng, G. The impact of regional integration in the Yangtze River Delta on urban carbon emissions. Geogr. Res. 2022, 41, 181–192. [Google Scholar]
- Ang, B.W. The LMDI Approach to Decomposition Analysis: A Practice Guide. Energy Policy 2005, 33, 867–871. [Google Scholar] [CrossRef]
- Kaya, Y. Impact of Carbon Dioxide Emission on GNP Growth: Interpretation of Proposed Scenarios. Paris: Presentation to the Energy and Industry Subgroup, Response Strategies Working Group, IPCC. 1990. X’Pert Stress PW3208, Software for Residual Stress Analysis, PANalytical, The Netherlands. Available online: www.panalytical.com (accessed on 31 March 2022).


| Energy Types | Standard Coal Coefficient/(kgce/kg) | Carbon Emission Coefficient/(kg/kgce) |
|---|---|---|
| Raw coal (tons) | 0.7143 | 0.7559 |
| Washed coal (tons) | 0.9 | 0.7559 |
| Other washed coal (tons) | 0.2857 | 0.7559 |
| Coal products (tons) | 0.2857 | 0.7559 |
| Coke (tons) | 0.9714 | 0.855 |
| Other coking products (tons) | 0.9714 | 0.855 |
| Coke oven gas (10,000 cubic meters) | 0.6 | 0.3548 |
| Blast furnace gas (10,000 cubic meters) | 0.1286 | 0.3548 |
| Converter gas (10,000 cubic meters) | 0.2571 | 0.3548 |
| Producer gas (10,000 cubic meters) | 0.1786 | 0.3548 |
| Natural gas (10,000 cubic meters) | 1.2 | 0.4483 |
| LNG (tons) | 1.7572 | 0.4483 |
| Crude oil (tons) | 1.429 | 0.5857 |
| Gasoline (tons) | 1.4714 | 0.5538 |
| Kerosene (tons) | 1.4714 | 0.5714 |
| Diesel (tons) | 1.4571 | 0.5921 |
| Fuel oil (tons) | 1.4286 | 0.6185 |
| LPG (tons) | 1.7143 | 0.5042 |
| Refinery dry gas (10,000 cubic meters) | 1.5714 | 0.4602 |
| Other petroleum products (tons) | 1.7 | 0.5857 |
| Other fuels (tons) | 1 | 0.7561 |
| Condition | ΔCO2/CO2 | ΔGIO/GIO | Elasticity (D) | Significance | |
|---|---|---|---|---|---|
| Decoupling entry | Enhance | <0 | >0 | D < 0 | In the most ideal state, the carbon emission growth index shows an inverse relationship with economic growth. |
| Weaken | >0 | >0 | 0 < D < 0.8 | The growth rate of carbon emissions is lower than that of economic growth. | |
| Decline | <0 | <0 | D > 1.2 | Carbon emissions decay faster than economic recession. | |
| Negative decoupling | Enhance | >0 | <0 | D < 0 | In the most unsatisfactory state, economic growth is negative, and carbon emissions still tend to rise. |
| Weaken | <0 | <0 | 0 < D < 0.8 | Carbon emissions decay faster than economic recession. | |
| Increase | >0 | >0 | D > 1.2 | Carbon emissions are growing faster than economic growth. | |
| Connect | Increase | >0 | >0 | 0.8 < D < 1.2 | Carbon emissions grow at the same time as the economy, at the same rate and in a linear relationship. |
| Decline | <0 | <0 | 0.8 < D < 1.2 | Carbon emissions and the economy decline at the same time, at the same speed and in a linear relationship. |
| Period | ||||||||
|---|---|---|---|---|---|---|---|---|
| 2000–2005 | 2005–2010 | 2010–2015 | 2015–2020 | |||||
| Groups | Main Factor | Average Uncoupling Elasticity | Main Factor | Average Uncoupling Elasticity | Main Factor | Average Uncoupling Elasticity | Main Factor | Average Uncoupling Elasticity |
| Group A | DEL | 0.698 | DEL | 0.614 | DEI | −0.601 | DEL | 2.289 |
| Group B | DEL | 0.576 | DEL | 0.718 | DP | 6.532 | DEL | 0.697 |
| Group C | DEL | 0.647 | DEL | 0.741 | DEI | −0.521 | DEI | −1.398 |
| Group D | DEL | 0.667 | DEI | −0.442 | DEL | 0.56 | DEI | −0.719 |
| Group E | DP | 2.243 | DEI | 4.115 | DEI | −1.687 | DEI | −4.542 |
| Group F | DEL | 3.933 | DEI | −3.824 | DEI | 23.485 | DEI | −7.164 |
| Number | Carbon Emission Characteristics |
|---|---|
| 1 | DEL is the main influencing factor, and the DP is outstanding |
| 2 | DEL is the main influencing factor, and other factors have little influence |
| 3 | DP is the main influencing factor, and the DEL is outstanding |
| 4 | DP is the main influencing factors, and other factors have little influence |
| 5 | DEL and DP are the main influencing factors, and other factors have little influence |
| 6 | DP and DES are the main influencing factors, and the DEL is outstanding |
| 7 | DEL and DEI are the main influencing factors, and other factors have little influence |
| 8 | DEL and DES are the main influencing factors, and the DP is outstanding |
| 9 | DEL, DP and DEI are the main influencing factors |
| 10 | DEL, DP and DES are the main influencing factors |
| 11 | DEL, DP, DEI and DES are the main influencing factors |
Publisher’s Note: MDPI stays neutral with regard to jurisdictional claims in published maps and institutional affiliations. |
© 2022 by the authors. Licensee MDPI, Basel, Switzerland. This article is an open access article distributed under the terms and conditions of the Creative Commons Attribution (CC BY) license (https://creativecommons.org/licenses/by/4.0/).
Share and Cite
Wang, W.; Chen, H.; Wang, L.; Li, X.; Mao, D.; Wang, S. Exploration of Spatio-Temporal Characteristics of Carbon Emissions from Energy Consumption and Their Driving Factors: A Case Analysis of the Yangtze River Delta, China. Int. J. Environ. Res. Public Health 2022, 19, 9483. https://doi.org/10.3390/ijerph19159483
Wang W, Chen H, Wang L, Li X, Mao D, Wang S. Exploration of Spatio-Temporal Characteristics of Carbon Emissions from Energy Consumption and Their Driving Factors: A Case Analysis of the Yangtze River Delta, China. International Journal of Environmental Research and Public Health. 2022; 19(15):9483. https://doi.org/10.3390/ijerph19159483
Chicago/Turabian StyleWang, Weiwu, Huan Chen, Lizhong Wang, Xinyu Li, Danyi Mao, and Shan Wang. 2022. "Exploration of Spatio-Temporal Characteristics of Carbon Emissions from Energy Consumption and Their Driving Factors: A Case Analysis of the Yangtze River Delta, China" International Journal of Environmental Research and Public Health 19, no. 15: 9483. https://doi.org/10.3390/ijerph19159483
APA StyleWang, W., Chen, H., Wang, L., Li, X., Mao, D., & Wang, S. (2022). Exploration of Spatio-Temporal Characteristics of Carbon Emissions from Energy Consumption and Their Driving Factors: A Case Analysis of the Yangtze River Delta, China. International Journal of Environmental Research and Public Health, 19(15), 9483. https://doi.org/10.3390/ijerph19159483