Abstract
Objectives: The aim of this study was to examine the association of per- and polyfluoroalkyl (PFAS) concentrations and allostatic load (AL) by the county of birth and the length of time in the United States of America (U.S.), in a representative sample of U.S. adults. Methods: Data from the 2007–2014 National Health and Nutrition Examination Survey (NHANES) were used in this cross-sectional study on the U.S. adults aged 20 and older. The analysis was stratified by the length of time in the U.S. and by the county of birth. In all, the sample contained those who were US-born (n = 10,264), Mexico-born (n = 4018), other Spanish speaking country-born (n = 2989), and other not–Hispanic speaking country-born (n = 3911). Poisson models were used to assess the differences in AL and PFAS levels depending on country of birth and length of time in the U.S. Results: Estimates indicated that those born in Other non–Spanish speaking counties had the highest PFAS levels among the country of birth category in the database. Regarding length of time in the U.S., those born in Mexico had low PFAS levels when their length of time in the U.S. was short. The Mexico-born category presented the most at-risk high serum PFAS levels, with AL levels increasing by length of time in the U.S. (p-value < 0.001). Conclusion: This study found that PFAS concentrations increased by the length of time residing in the U.S. Those born in other non–Hispanic counties had the highest PFAS levels among all the categories. In general, AL and PFAS levels are mostly associated with the length of time in the U.S., with foreign-born individuals having increased levels of both the longer they stay.
1. Introduction
For more than 50 years, PFAS have been produced and used for consumer products, such as leather and fabric coatings, paper coatings, firefighting foams, and stain repellents [1,2]. Many of the long-chain PFAS bioaccumulate (as opposed to biomagnify) in the human body but not enough of the short-chain PFAS have been studied to rule out their bioaccumulation potential. It is thought that they are less likely to bioaccumulate, but this has not been empirically demonstrated for all that can be classified as short-chain PFAS [3]. Before 2002, most studies of PFAS in the United States of America (U.S.) focused on Perfluorooctanoic acid (PFOA) and perfluorooctane sulfonic acid (PFOS), leading to discontinued production. Nevertheless, these legacy chemical compounds continue in the environment and are still produced and manufactured, utilized (i.e., put PFAS into service for profit), and used (i.e., benefit from PFAS, such as paper packaging, stain resistant coatings, furniture, cosmetics, household cleaners, etc.) worldwide [4,5].
Human exposure to PFAS can occur in occupational settings [6] via cutaneous contact and inhalation. Non–occupational sources such as contaminated drinking water, and seafood (especially fish), are additional sources of exposure. The vast majority of PFAS are highly persistent and have long half-lives in the environment and humans. For instance, two of the most well-studied PFAS, PFOS and PFOA, have half-lives in human blood of roughly between two and five years [2,7,8]. In all, PFAS exposure comes from various sources, with demographic factors and lifestyle sometimes predicting the exposure risk [9,10].
PFAS are usually detected in wildlife, the environment, and humans, making them substances of global concern. The Stockholm Convention on Persistent Organic Pollutants (POPs), governed by the United Nations Environment Program (UNEP), is an international agreement to protect human health and the environment from unfavorable impacts caused by POPs. The convention listed PFOS and its salts and PFOA and its salts. This was so because they have effects on human wellbeing, with scientific evidence suggesting significant impacts on human health. Owing to these health effects and public worry of these chemical compounds, policies have been proposed to mitigate the manufacture and use of PFAS [11,12]. A global approach to PFAS is critical since people move freely worldwide.
Immigration to the U.S. has significantly increased in the last few decades compared to any other time in history. Many of these immigrants may be from countries where they may be at greater risk of exposure to contaminants from the environment [13,14]. In general, immigrants in the U.S. encounter various challenges, which can result in exposure to various toxic chemicals in a community. In addition, the effects of immigration and assimilation can contribute to stress and subsequent adverse health outcomes [15,16,17,18].
Allostasis is how individuals maintain physiological balance by altering parameters within the body and matching them to environmental demands. Allostasis is similar to homeostasis but is different in that homeostasis defines health as a state in which all physiological parameters operate within non-changing setpoints [19,20]. With allostasis, individuals can appropriately respond to challenges, but if the challenges are continuous and do not turn off, then the body, rather than going to a lower set point, adapts at the higher set point. When the setpoint changes, it is called allostatic load. Allostatic load (AL), an index of chronic physiological stress, is the biological penalty of stress. AL is based on the assumption that repetitive activation of the hypothalamus, pituitary gland, and adrenal (HPA axis) affects multiple organ systems, such as the cardiovascular system [15,19,20,21,22]. In a database such as NHANES, AL can be measured by combining markers from the cardiovascular, metabolic and inflammatory system.
This study aimed to examine the associations between AL and select PFAS by country of birth and length of time in the U.S. We hypothesized that country of birth and length of time in the U.S. would be significant factors in exposure to PFAS and AL levels. We examined variations by county of birth, demographic groups, income, and education to further explore these relationships.
2. Materials and Methods
2.1. Cohort and Study Design
This study used data from National Health and Nutrition Examination Survey (NHANES) 2007–2014 among adults aged 20 and over. The NHANES is a representative sample of noninstitutionalized individuals living in the 50 states of the U.S. and the district of Columbia. The data, collected by the U.S. Centers for Disease Control and Prevention (CDC), contains multi-year, stratified, multistage, and clustered samples, with data available in two-year cycles. The data for this analysis represent the U.S population for four cycles 2007–2008, 2009–2010, 2011–2012, and 2013–2014. NHANES interviewed selected participants, and they also completed a physical examination. Blood samples were drawn from participants and were sent to a laboratory for analysis. More descriptions and details on the study and procedures and processes involved are found on the CDC’s NHANES website [23].
Weighted (i.e., weighted data in NHANES is used to make the sample estimates reflect how many people in the U.S. population one individual represents among civilian noninstitutionalized residents) [24] and pooled (i.e., the combination of NHANES data form 2007 to 2014) data were used for this analysis to assess the association between the different PFAS concentrations and AL levels. This was assessed by county of birth and the length of time in the U.S.
2.2. Allostatic Load Levels Determination
In determining the AL levels, the cut-off points for selected biomarkers were determined based on the distribution of the variables within the database [15]. We explored cardiovascular, metabolic, and inflammatory markers, including systolic blood pressure (SBP), diastolic blood pressure (DBP), total cholesterol (TC), high–density lipoprotein (HDL) cholesterol, triglyceride (TG), glycosylated hemoglobin (HbA1c), Body mass index (BMI), albumin (Alb), creatinine clearance (CRCL), and C–reactive protein (CRP). Individual biomarkers were assigned to a binary value of 1 if the biomarker was among the high–risk category, that is, the top 25% in the database, and a value of 0 if not for all markers apart from albumin, creatinine clearance, and HDL cholesterol for which the bottom 25% were the high risk. A total AL score was calculated out of 10, with an AL greater than or equal to 3 considered a high AL.
2.3. Study Variables and Measures
We used these variables as predictors: Length of time in the U.S. which had nine categories (1) Less than 1 year, (2) 1 year, less than 5 years or 1–4, (3) 5 years, less than 10 years or 5–9, (4) 10 years, less than 15 years or 10–14, (5) 15 year., less than 20 years or 15–19, (6) 20 years, less than 30 years or 20–29, (7) 30 years, less than 40 years or 30–39, (8) 40 years, less than 50 years or 40–49, and (9) 50 years or more. Education level, specifically for adults 20 years and older, had five categories: (1) Less than 9th grade, (2) 9th to 11th grade (Includes 12th grade with no diploma), (3) High school graduate/GED or equivalent, (4) Some college or Associate of Arts (AA) degree, and (5) College graduate or above. Country of birth in this database four categories: (A) Born in 50 US States or Washington, DC, (B) Born in Mexico, (C) Born in Other Spanish Speaking County, and finally, (D) Born in other Non-Spanish Speaking Country. Health behavior variables, including smoking. alcohol consumption behaviors, and physical activity were also explored as covariate variables that could influence the outcomes.
PFAS concentrations were measured from participants’ samples at the medical examination center with a lower limit of detection (LLOD) of 0.07 μg/L. In the lab analysis, serum concentrations below the LLOD were replaced with the LLOD divided by the square root of 2.
2.4. Statistical Analysis
Descriptive statistical analysis was used to generate the mean, and standard deviation with graphs (boxplots) was used to present the variabilities between groups. In our analysis, a p-value ≤ 0.05 was considered significant. Poisson models and Pearson correlation coefficient tests were used to assess the associations between variables on interest in the study. A programming language for statistical computing and graphics named R in RStudio (R Foundation for Statistical Computing, Vienna, Austria) was used for these analyses. Confounding variables were identified based on proportion of selected variables and primary assessment of the variables’ association with length of time in the U.S., country of birth, PFAS and AL. Then, adjusted models for age, education, and gender were performed.
3. Results
In all, the sample contained those who were US-born (n = 10,264), Mexico-born (n = 4018), other Spanish speaking country-born (n = 2989), and other not-Hispanic speaking country-born (n = 3911). The sample mean and standard deviation of AL scores are presented in Table 1 by the length of time in the U.S. and country of birth. Among the immigrants to the U.S. The AL means for participants born in Mexico who had been in the U.S. for less than one year to over 50 years ranged between 2.5 to 3.6, with standard deviations (SD) ranging between 1.2 to 1.6. For the immigrants born in other non-Spanish speaking counties whose time in the U.S went from less than one year to greater than fifty years, the mean AL values were between 2.2 and 3.3. Those who identified their country of birth as ‘other Spanish speaking country’ had mean AL levels, which ranged between 2.5 and 3.6. Finally, among the non-immigrants (those who indicated they were born in the U.S.), participants had means AL levels between 2.7 to 3.5. Overall, the trends suggest that AL tends to increase by the length of time in the U.S.

Table 1.
AL level by country of birth and length of time in U.S.
Table 1 shows SD and means for the participants according to country of birth and the length of time the U.S. In general, as length of time in the U.S. increased, AL levels increased as well. The participants’ who had been in the U.S for more than 50 years had the highest AL levels.
Poisson model analysis was used to examine the statistical relationship between selected variables (Table 2). The participants’ who had been in the U.S for more than 50 years had statistically significantly (p-value < 0.001) higher AL for all countries of birth categories.
Table 2.
Poisson modes for selected variables with AL.
We explored AL level by the length of time in the U.S. Figure 1 reveals that AL had similar levels for the participants throughout the time they had been in the U.S., but those who had been in the U.S. for less than 1 year (<1 year), between 10 years and 15 years (10–14), between 15 years and 20 years (15–19), and between 20 and 30 years (20–29) had AL levels which evenly spanned the distribution of the boxplot around the median.
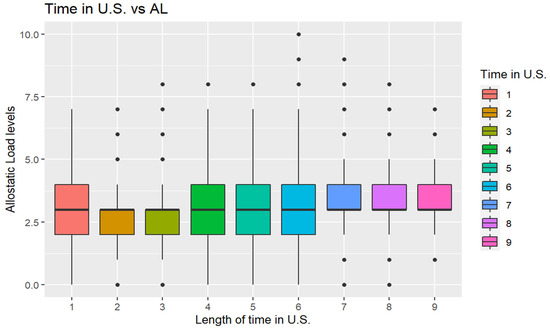
Figure 1.
Boxplot (box and whisker plot) shows AL concentrations by length of time in U.S. Note: The length of time in U.S. (1) Less than 1 year (1 year <), (2) 1 year, less than 5 years (1–4), (3) 5 years, less than 10 years (5–9), (4) 10 years, less than 15 (10–14), (5) 15 years, less than 20 (15–19), (6) 20 years, less than 30 years (20–29), (7) 30 years, less than 40 years (30–39), (8) 40 years, less than 50 years (40–49), and (9) 50 years or more (≥50).
Examining the distribution by length of time, those who had been in the U.S. for less than one year, between one year and five years (1–4), and between five and 10 years (5–9) had AL levels mostly below the median. Those who had been in the U.S. between 30 and 40 years (30–39), between 40 and 50 years (40–49), and for more than 50 years (≥50) had AL levels above the median.
Table 3 presents sample means of PFAS concentrations by country of birth. Notice that PFOS was the highest detected for all groups. The mean concentration of PFOS for other non-Spanish-speaking countries of birth was significantly higher than the other groups, followed by those born in other Spanish speaking countries.
Table 3.
PFAS mean (ng/mL) and standard deviation by the country of birth.
Table 4 reveals that PFAS concentrations were at different levels by the length of time in the U.S. For instance, PFDE tended to increase by the time in the U.S. till the 19th year. From the 20th year on, it stayed steady with slight changes.
Table 4.
PFAS mean (ng/mL) and standard deviation by the length of time in U.S.
Figure 2 shows that PFAS serum levels were similar among the participants with a slight difference in people who were born in Mexico who tended to have lower values.
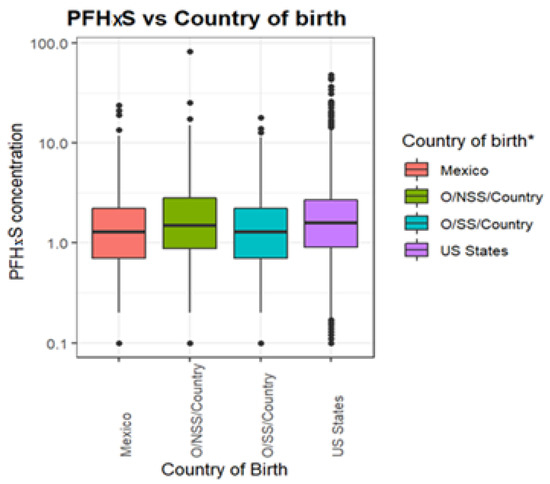
Figure 2.
PFHxS (ng/mL) levels by county of birth. * Note: Mexico is Mexican born, US States is U.S born, Other Spanish Speaking County is O/SS/Country, Other Non-Spanish Speaking Country is O/NSS/Country.
To evaluate if the length of time in the U.S. and county of birth has an association with AL levels and PFAS serum concentrations, we employed Pearson correlation analysis (Table 5). The Pearson correlation analysis is presented in Table 5 below, examining the relationship between selected variables. AL had a very weak negative association with PFOS, country of birth, and education level, with r values of –0.001, –0.081, and –0.070, respectively. It also had a very weak positive correlation with length of time in U.S. with r values of 0.009 and 0.114, correspondingly. We used PFOS to represent PFAS because nearly all participants had considerably high detected levels of it. The association of PFOS with education level had very weak correlations with an r-value of –0.022. PFOS also had a very weak association with country of birth with an r-value of 0.054. Its association with length of time in the U.S. was not strong, with an r-value of 0.
Table 5.
Correlation between AL, PFOS (ng/mL), Country of Birth, Length of Time in the U.S., and Education Level.
Mean levels of PFOS and AL by length of time in the U.S. are explored in Table 6. Results indicated that those who had been in the US for more than 50 years had the highest mean PFOS and AL levels.
Table 6.
Mean PFOS concentration and AL by length of time in the U.S.
In adjusted Poisson models, there was a significant difference in AL levels for those who had been in the U.S. for more than fifty years as compared to newcomers among all groups (Table 7). AL levels increased by the time in the U.S. For instance, those who had been in the U.S. 40–49 years had, on average, a 3.3% higher AL and those who had been in the U.S. more than 50 years had on average 3.4% higher AL levels compared to those who had been in the U.S. less than one year (newcomers).
Table 7.
Exp(β) (95% CI) for the adjusted association of length of time in the U.S. with AL.
4. Discussion
In this study, we investigated the relationships between exposure to PFAS and AL by country of birth and the length of time in the U.S. An increased length of time in the U.S. was associated with the rising AL levels. This finding is consistent with research conducted by Doamekpor and colleagues, which indicated that increasing AL was associated with increased length of residency in the U.S. [17]. Immigrants born in non–Spanish speaking countries had high AL levels, with individuals who were born in Mexico having considerable PFAS exposure and AL.
Our study revealed that those over 50 years old had high levels of AL among all categories of countries of birth in this study. The finding of high AL matched the length of time in the U.S. and indicated that the longer one had been in the U.S., the higher their AL levels became. These results are consistent with a study by Peek and colleagues, which indicated that foreign-born individuals who had recently arrived in the U.S. had relatively better health on arrival, but their health declined over time, with AL increasing concurrently [25]. The stressors associated with immigration, assimilation, and adaptation to a new country and culture may explain this finding.
Our study result indicated that PFAS and AL levels elevated by the length of time in the U.S. potentially indicates that emerging environmental contaminants like PFAS may potentially pose a differential geographic exposure pattern compared to traditional contaminants like Lead. Lead tends to exist in higher concentrations in low- and middle-income countries (LMIC) as compared to high-income countries (HIC) [14].
The individuals who were born in Mexico were the most at risk of elevated AL levels by the length of time in the U.S., which was consistent with a study by Kaestner and colleagues, which indicated that the relationship between AL and the participants born in Mexico was statistically significant (p-value < 0.001). Specifically, Mexico-born participants were healthier upon arrival in the U.S., and their health diminished over time [26]. This is also compatible with the study by Doamekpor and colleagues, which indicated that the people born in countries other than the U.S. had lower AL levels, and their AL increased over time [17].
Limitations: Trends in this study assessed by the length of time have limitations as the study design was cross-sectional. A longitudinal study is necessary to reach definitive conclusions.
5. Conclusions
Our study revealed that there is a significant association between self-reported length of time in the U.S. and PFAS and AL levels. These levels were highest for those reporting living in the U.S. for an extended period. These results, along with prior related studies, suggest newcomer populations are the subject of concern for elevated PFAS and AL.
Author Contributions
Conceptualization, T.B. and E.O.-G.; methodology, T.B. and E.O.-G.; formal analysis, T.B. and E.O.-G.; investigation, T.B. and E.O.-G.; resources, E.O.-G.; data curation, T.B. and E.O.-G.; writing—original draft preparation, T.B.; writing—review and editing, T.B., F.A., K.J.-M. and E.O.-G.; supervision, E.O.-G.; project administration, E.O.-G.; funding acquisition, E.O.-G. All authors have read and agreed to the published version of the manuscript.
Funding
This research was funded in part by the BCSP Foundation-Research-Early Stage Funding.
Institutional Review Board Statement
This study did not require IRB approval because de-identified secondary data were used. In the collection of the data by the Centers for Disease Control and Prevention, the study was conducted according to the guidelines of the Declaration of Helsinki and approved by the Ethics Committee of the Centers for Disease Control and Prevention.
Informed Consent Statement
Informed consent was obtained from all subjects involved in the study.
Data Availability Statement
The NHANES dataset is publicly available online, accessible at cdc.gov/nchs/nhanes/index.htm (accessed on 12 June 2022).
Conflicts of Interest
The authors declare no conflict of interest.
References
- Kovarova, J.; Svobodova, Z. Perfluorinated compounds: Occurrence and risk profile. Neuro Endocrinol. Lett. 2008, 29, 599–608. [Google Scholar] [PubMed]
- Brantsæter, A.; Whitworth, K.; Ydersbond, T.; Haug, L.; Haugen, M.; Knutsen, H.; Thomsen, C.; Meltzer, H.; Becher, G.; Sabaredzovic, A.; et al. Determinants of plasma concentrations of perfluoroalkyl substances in pregnant Norwegian women. Environ. Int. 2013, 54, 74–84. [Google Scholar] [CrossRef] [Green Version]
- Shi, Y.; Vestergren, R.; Nost, T.H.; Zhou, Z.; Cai, Y. Probing the Differential Tissue Distribution and Bioaccumulation Behavior of Per- and Polyfluoroalkyl Substances of Varying Chain-Lengths, Isomeric Structures and Functional Groups in Crucian Carp. Environ. Sci. Technol. 2018, 52, 4592–4600. [Google Scholar] [CrossRef]
- Agency for Toxic Substances and Disease Registry. Toxicological Profile for Perfluoroalkyls; U.S. Department of Health and Human Services: Washington, DC, USA, 2021.
- Obeng-Gyasi, E. Factors associated with elevated Per-and Polyfluoroalkyl substances serum levels in older adults. Aging Health Res. 2022, 2, 3. [Google Scholar] [CrossRef]
- Bashir, T.; Obeng-Gyasi, E. Interaction of Per- and Polyfluoroalkyl Substances and Allostatic Load among Adults in Various Occupations. Diseases 2022, 10, 26. [Google Scholar] [CrossRef]
- Olsen, G.W.; Burris, J.M.; Ehresman, D.J.; Froehlich, J.W.; Seacat, A.M.; Butenhoff, J.L.; Zobel, L.R. Half-Life of Serum Elimination of Perfluorooctanesulfonate, Perfluorohexanesulfonate, and Perfluorooctanoate in Retired Fluorochemical Production Workers. Environ. Health Perspect. 2007, 115, 1298–1305. [Google Scholar] [CrossRef]
- Bartell, S.M.; Calafat, A.M.; Lyu, C.; Kato, K.; Ryan, P.B.; Steenland, K. Rate of Decline in Serum PFOA Concentrations after Granular Activated Carbon Filtration at Two Public Water Systems in Ohio and West Virginia. Environ. Health Perspect. 2010, 118, 222–228. [Google Scholar] [CrossRef]
- Berríos-Torres, S.I.; Umscheid, C.A.; Bratzler, D.W.; Leas, B.; Stone, E.C.; Kelz, R.R.; Reinke, C.E.; Morgan, S.; Solomkin, J.S.; Mazuski, J.E.; et al. Centers for Disease Control and Prevention Guideline for the Prevention of Surgical Site Infection, 2017. JAMA Surg. 2017, 152, 784–791. [Google Scholar] [CrossRef]
- Sunderland, E.M.; Hu, X.C.; Dassuncao, C.; Tokranov, A.; Wagner, C.C.; Allen, J.G. A review of the pathways of human exposure to poly- and perfluoroalkyl substances (PFASs) and present understanding of health effects. J. Expo. Sci. Environ. Epidemiol. 2018, 29, 131–147. [Google Scholar] [CrossRef] [Green Version]
- Baabish, A.; Sobhanei, S.; Fiedler, H. Priority perfluoroalkyl substances in surface waters—A snapshot survey from 22 developing countries. Chemosphere 2021, 273, 129612. [Google Scholar] [CrossRef]
- Obeng-Gyasi, E. Per- and Polyfluoroalkyl Substances: Toxic Chemicals of Concern in North Carolina. N. Carol. Med. J. 2022, 83, 90–93. [Google Scholar] [CrossRef]
- Schantz, S.L.; Gardiner, J.C.; Aguiar, A.; Tang, X.; Gasior, D.M.; Sweeney, A.M.; Peck, J.D.; Gillard, D.; Kostyniak, P.J. Contaminant profiles in Southeast Asian immigrants consuming fish from polluted waters in northeastern Wisconsin. Environ. Res. 2010, 110, 33–39. [Google Scholar] [CrossRef] [Green Version]
- Obeng-Gyasi, E. Sources of lead exposure in various countries. Rev. Environ. Health 2019, 34, 25–34. [Google Scholar] [CrossRef]
- Utumatwishima, J.N.; Baker, R.L.; Bingham, B.A.; Chung, S.T.; Berrigan, D.; Sumner, A.E. Stress Measured by Allostatic Load Score Varies by Reason for Immigration: The Africans in America Study. J. Racial Ethn. Health Disparities 2017, 5, 279–286. [Google Scholar] [CrossRef]
- Grieco, E.; Trevelyan, E.N. Place of Birth of the Foreign-Born Population: 2009. American Community Survey Briefs, 2010; U.S. Census Bureau: Washington, DC, USA, 2012.
- Doamekpor, L.A.; Dinwiddie, G.Y. Allostatic Load in Foreign-Born and US-Born Blacks: Evidence From the 2001–2010 National Health and Nutrition Examination Survey. Am. J. Public Health 2015, 105, 591–597. [Google Scholar] [CrossRef]
- Venters, H.; Gany, F. African Immigrant Health. J. Immigr. Minor. Health 2009, 13, 333–344. [Google Scholar] [CrossRef]
- Bashir, T.; Obeng-Gyasi, E. The Association between Multiple Per- and Polyfluoroalkyl Substances’ Serum Levels and Allostatic Load. Int. J. Environ. Res. Public Health 2022, 19, 5455. [Google Scholar] [CrossRef]
- McEwen, B.S. Protective and Damaging Effects of Stress Mediators. N. Engl. J. Med. 1998, 338, 171–179. [Google Scholar] [CrossRef] [PubMed] [Green Version]
- Juster, R.-P.; McEwen, B.S.; Lupien, S.J. Allostatic load biomarkers of chronic stress and impact on health and cognition. Neurosci. Biobehav. Rev. 2010, 35, 2–16. [Google Scholar] [CrossRef]
- Duong, M.; Bingham, B.A.; Aldana, P.C.; Chung, S.T.; Sumner, A.E. Variation in the Calculation of Allostatic Load Score: 21 Examples from NHANES. J. Racial Ethn. Health Disparities 2016, 4, 455–461. [Google Scholar] [CrossRef]
- Centers for Disease Control and Prevention. NHANES Questionnaires, Datasets, and Related Documentation; National Health and Nutrition Examination Survey: Washington, DC, USA, 2018.
- Centers for Disease Control and Prevention. Available online: https://wwwn.cdc.gov/nchs/nhanes/tutorials/module3.aspx (accessed on 20 July 2022).
- Peek, M.K.; Cutchin, M.P.; Salinas, J.J.; Sheffield, K.M.; Eschbach, K.; Stowe, R.P.; Goodwin, J.S. Allostatic Load Among Non-Hispanic Whites, Non-Hispanic Blacks, and People of Mexican Origin: Effects of Ethnicity, Nativity, and Acculturation. Am. J. Public Health 2010, 100, 940–946. [Google Scholar] [CrossRef] [PubMed]
- Kaestner, R.; Pearson, J.A.; Keene, D.; Geronimus, A.T. Stress, Allostatic Load, and Health of Mexican Immigrants. Soc. Sci. Q. 2009, 90, 1089–1111. [Google Scholar] [CrossRef]
Publisher’s Note: MDPI stays neutral with regard to jurisdictional claims in published maps and institutional affiliations. |
© 2022 by the authors. Licensee MDPI, Basel, Switzerland. This article is an open access article distributed under the terms and conditions of the Creative Commons Attribution (CC BY) license (https://creativecommons.org/licenses/by/4.0/).