
You Are What You Eat and So Is Our Planet: Identifying Dietary Groups Based on Personality and Environmentalism


Abstract
:1. Introduction
1.1. Segmentation Studies of Dietary Choices
1.2. The Nomological Network of Eating Behavior
1.2.1. Big Five
1.2.2. Dark Triad

| Authors | Findings |
|---|---|
| Pfeiler & Egloff, 2018 [52] |
|
| Pfeiler & Egloff, 2018 [53]; Pfeiler & Egloff, 2018 [41] |
|
| Pfeiler & Egloff, 2018 [41] |
|
| Pfeiler & Egloff, 2020 [43] |
|
| Hopwood & Bleidorn, 2019 [42] |
|
1.2.3. Environmentalism
1.2.4. Meat Attachment
1.2.5. Food Neophobia
1.2.6. Food Consumption Orientations
1.3. Aims of the Study
2. Materials and Methods
2.1. Participants and Procedure
2.2. Measures
2.2.1. Demographic Variables
2.2.2. Eating Behavior
2.2.3. Big Five
2.2.4. Dark Triad
2.2.5. Environmentalism
2.2.6. Meat Attachment
2.2.7. Food Neophobia
2.2.8. Food Consumption Orientations
2.2.9. Self-Efficacy
2.2.10. Willingness to Change Eating Habits
2.3. Statistical Analyses
3. Results
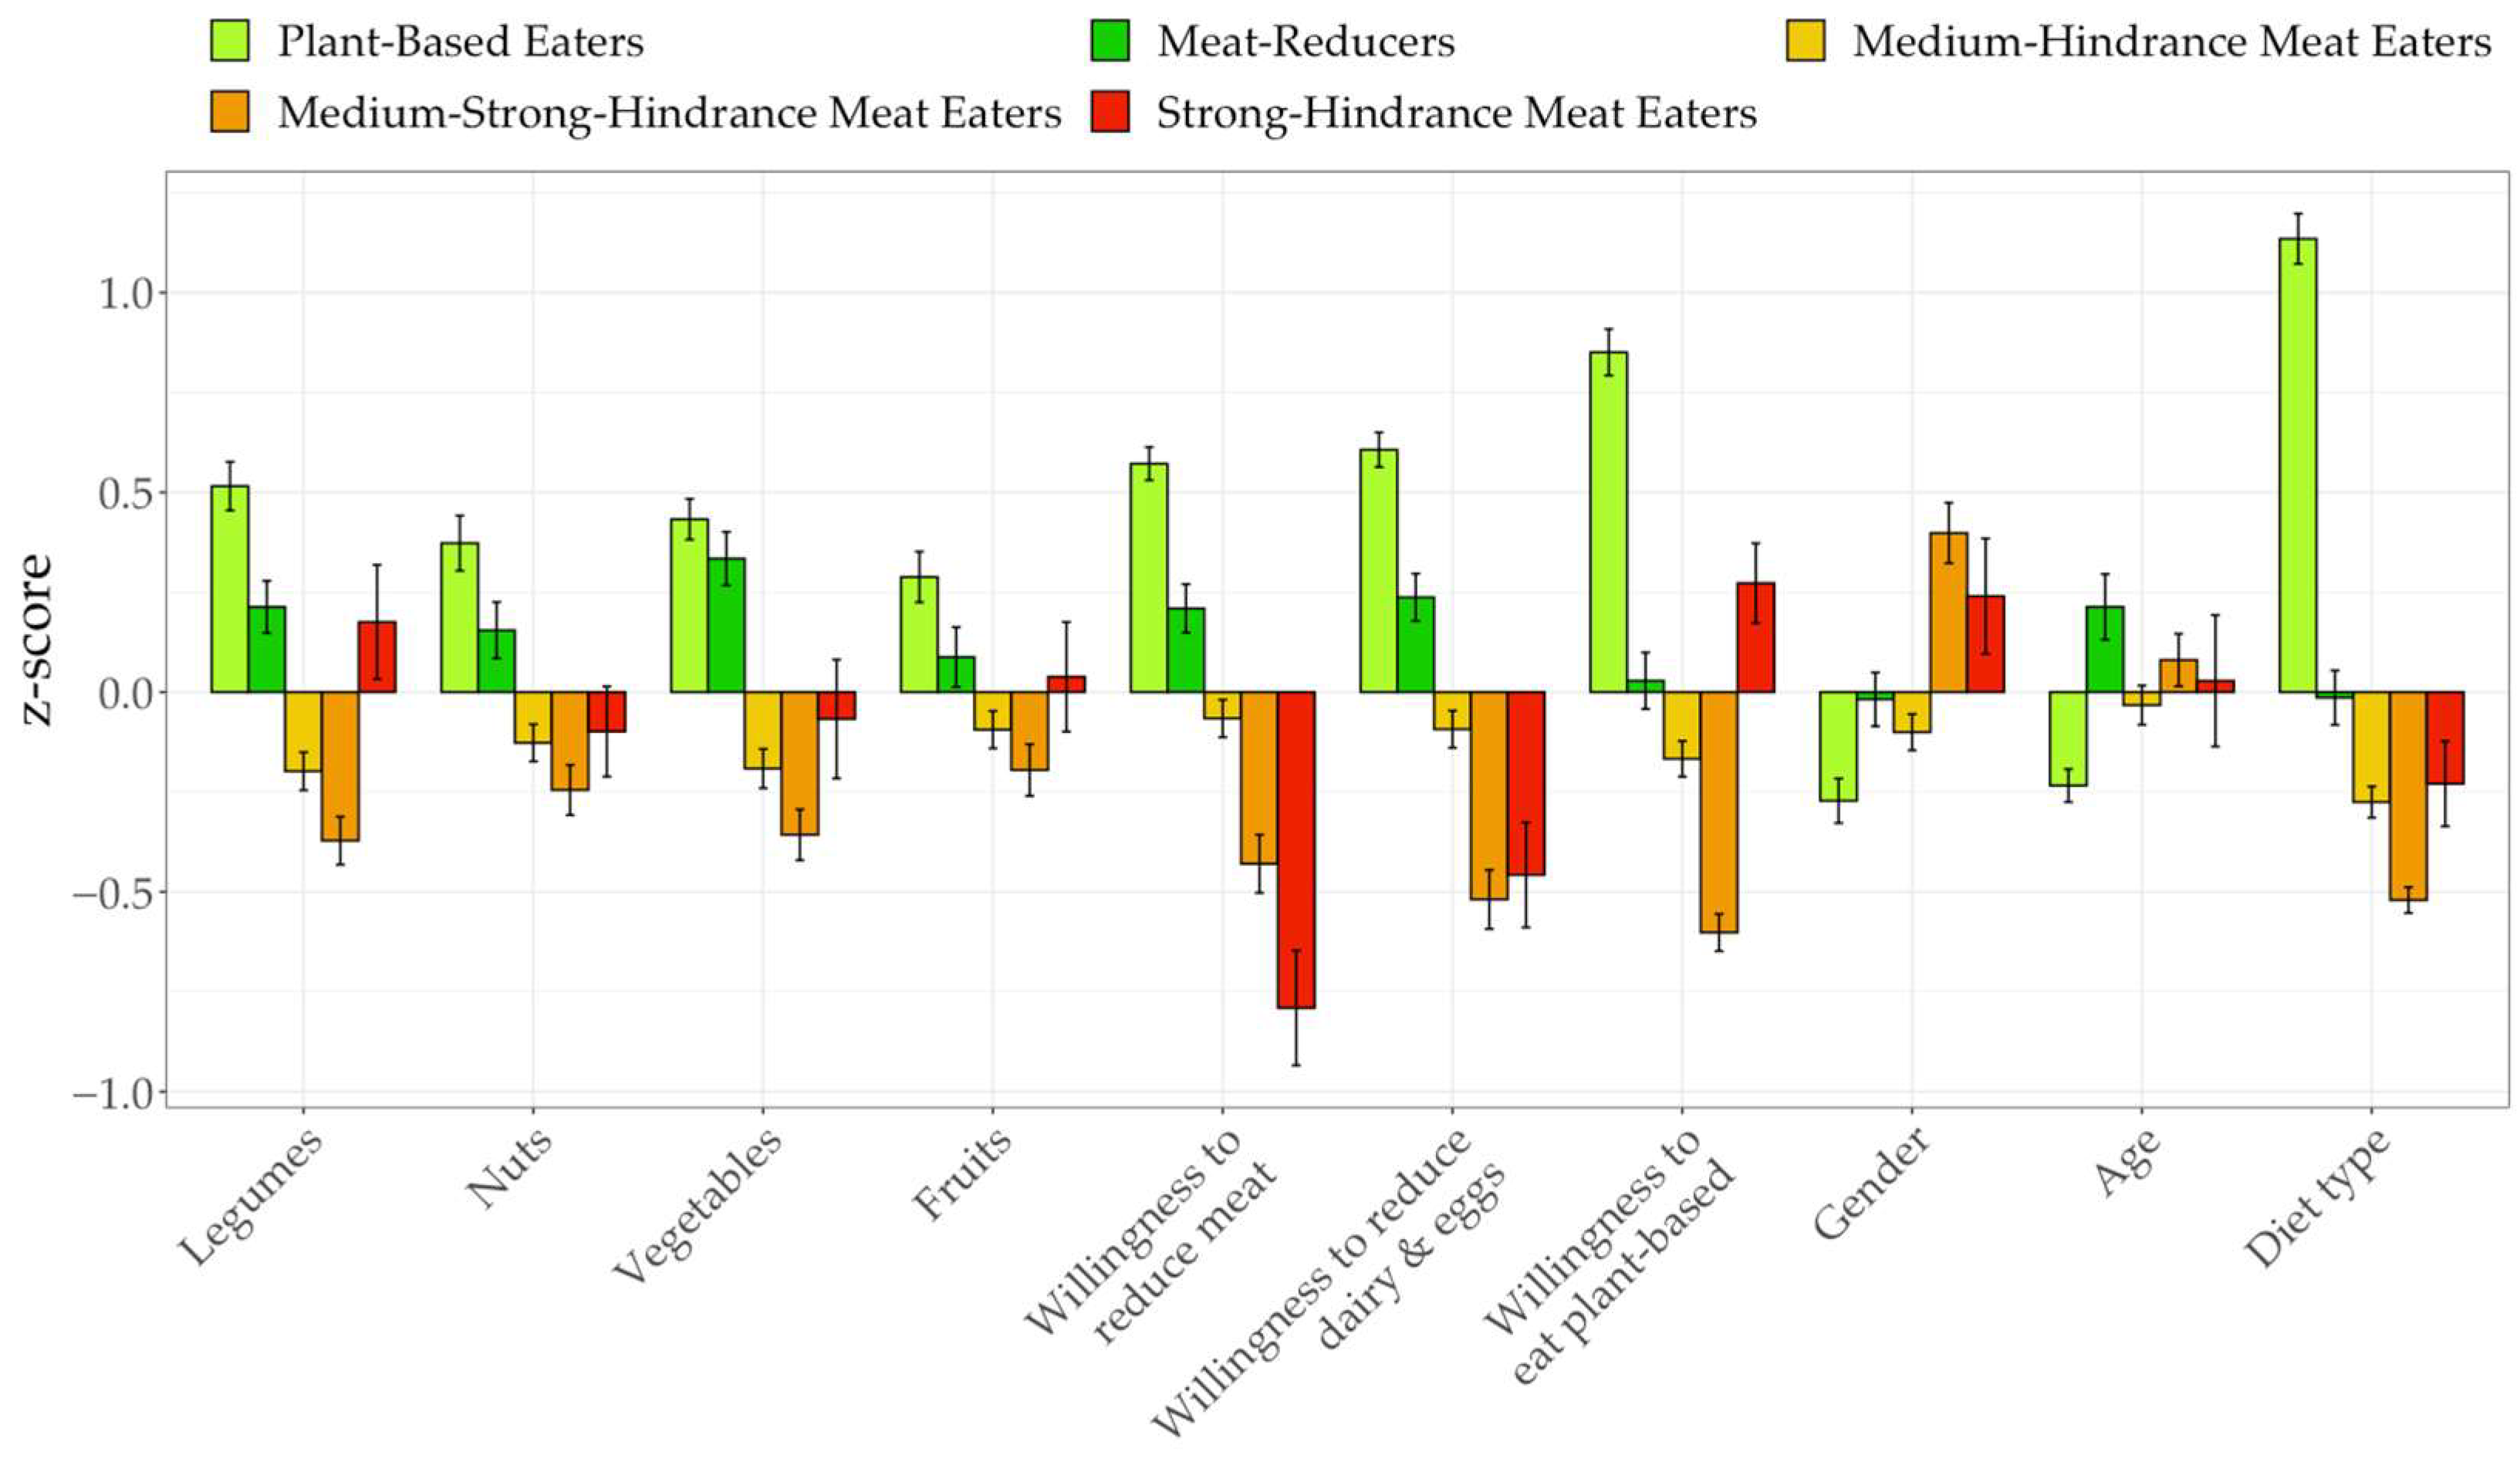
3.1. Latent Profile Analysis
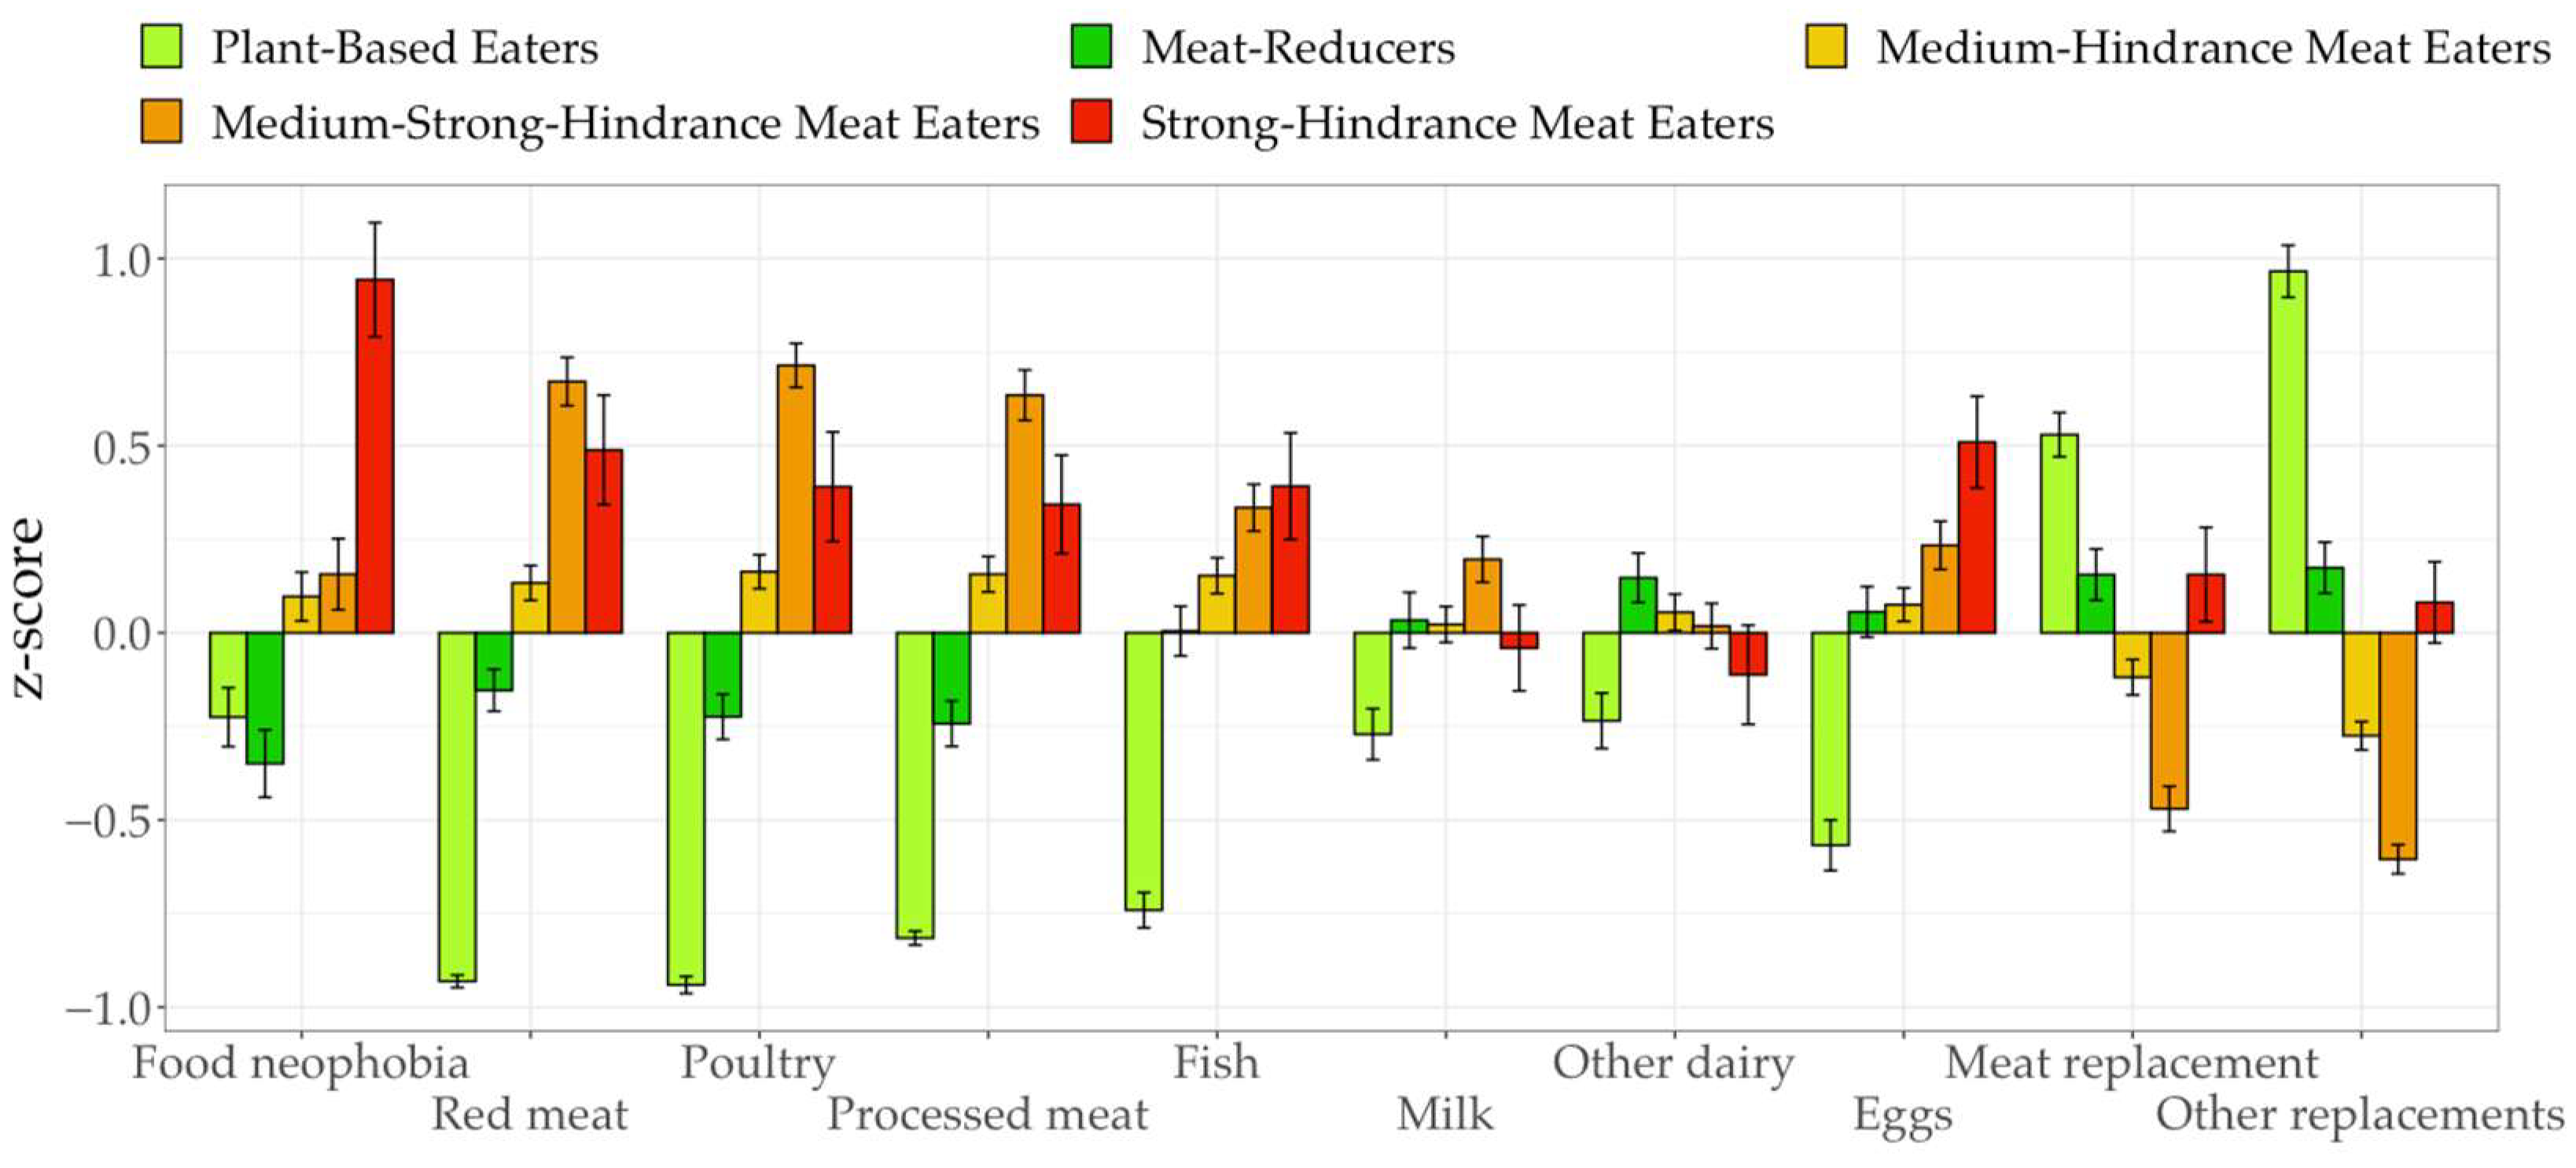
3.2. Inhibitors and Food Consumption Orientations
3.3. Outcomes
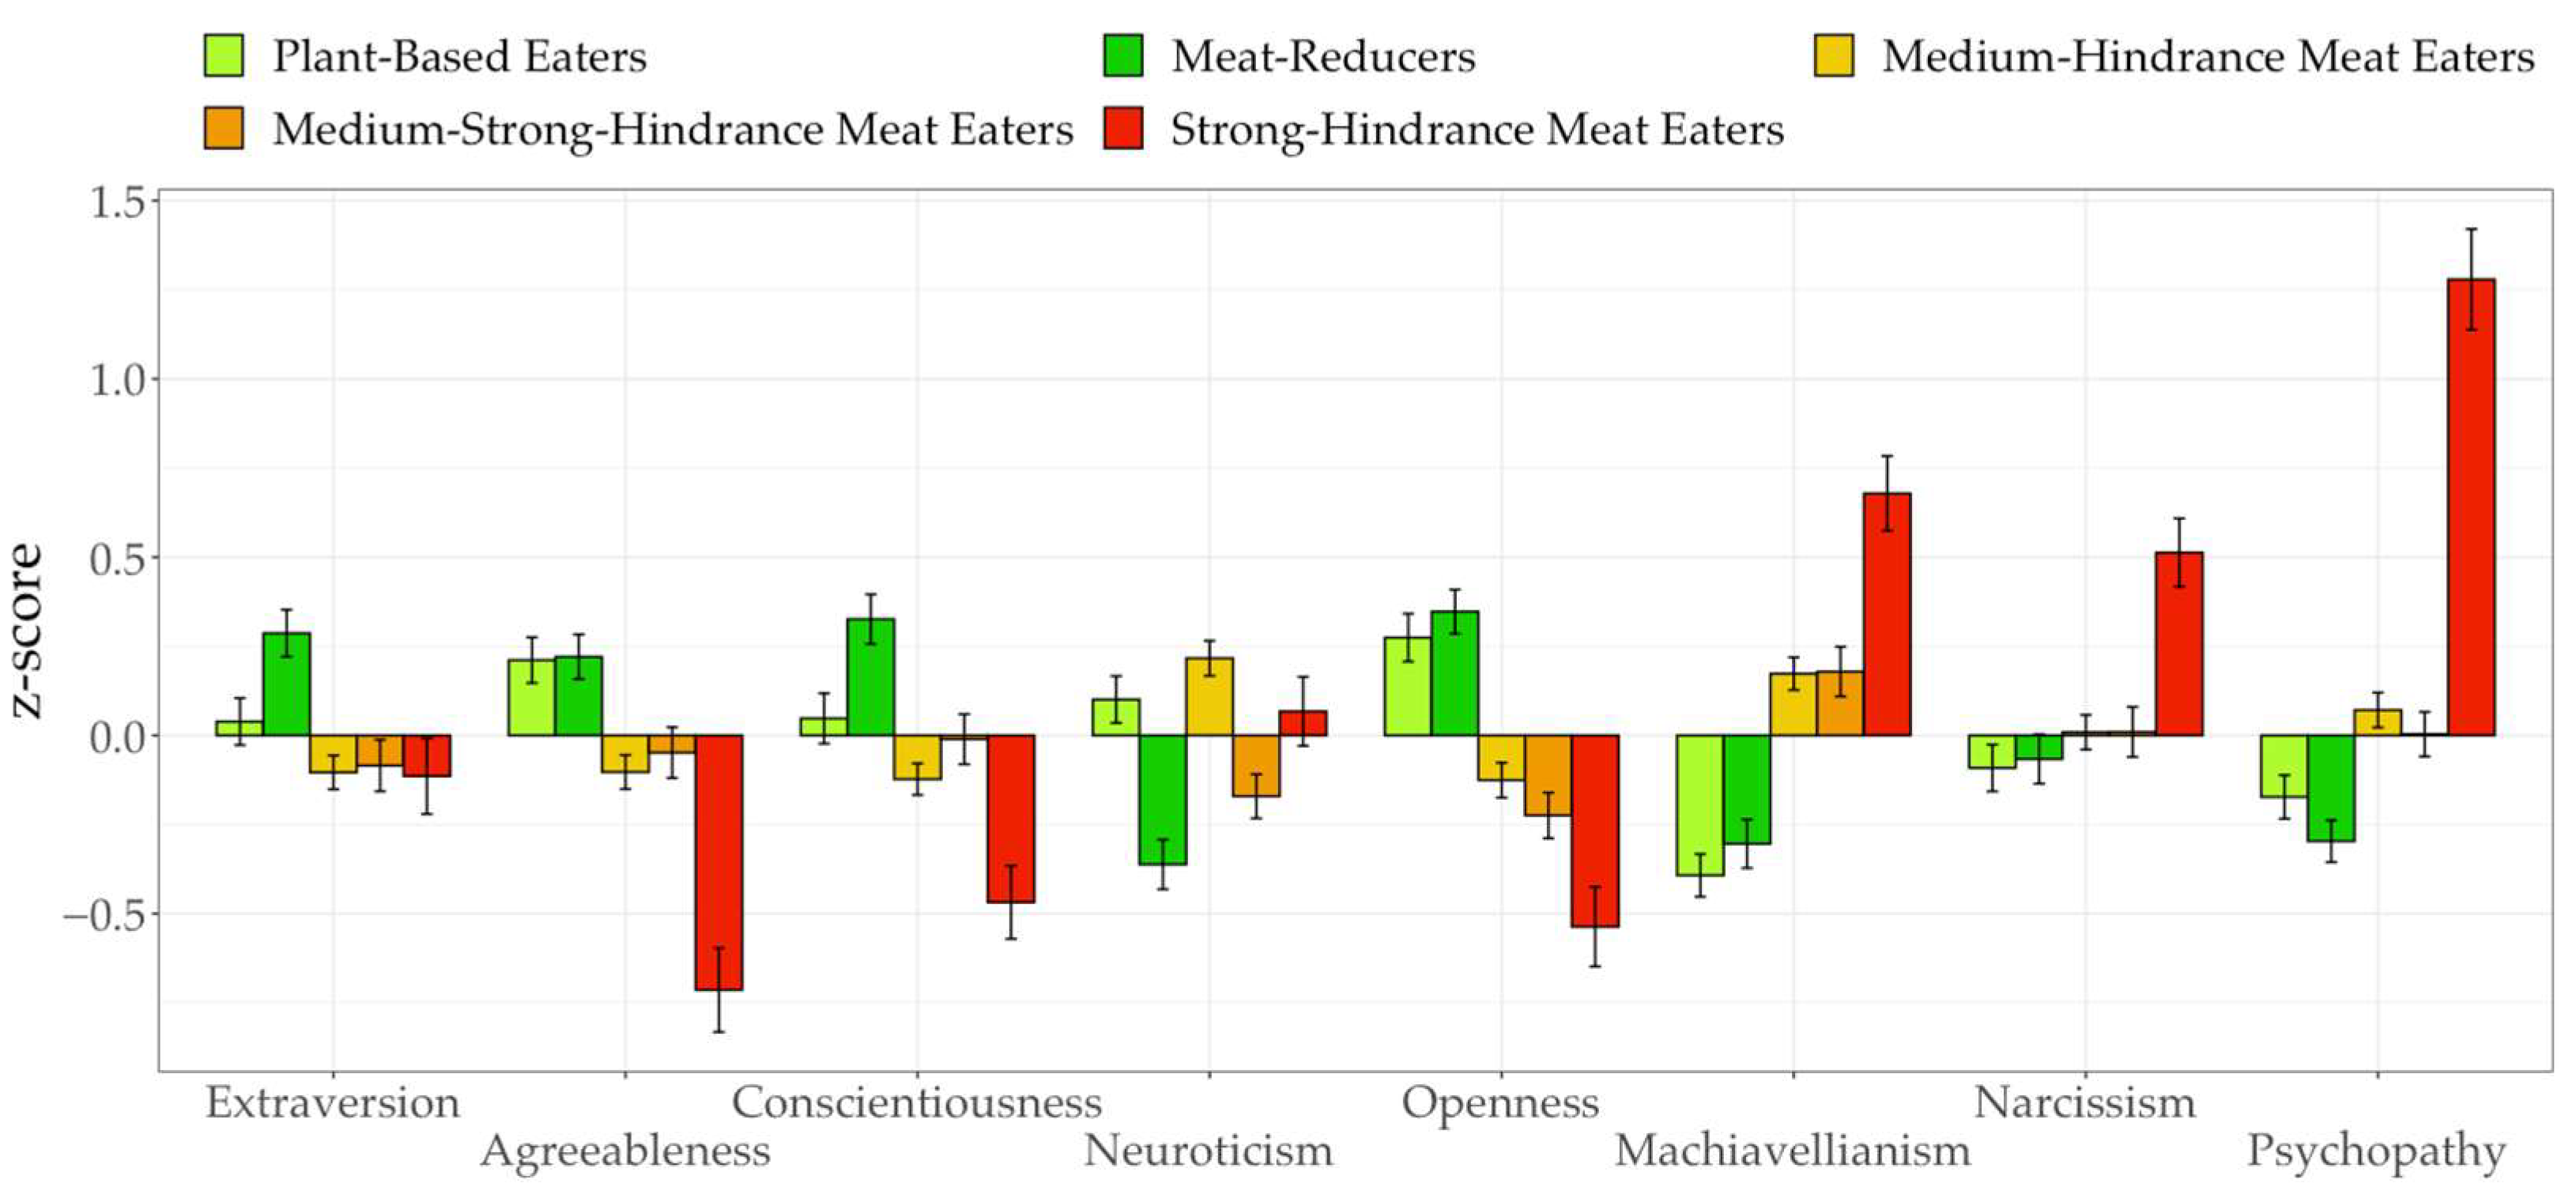
3.4. Personality
4. Discussion
4.1. General Discussion
4.2. Implications for Interventions
5. Conclusions
Author Contributions
Funding
Institutional Review Board Statement
Informed Consent Statement
Data Availability Statement
Conflicts of Interest
Appendix A
| One-Way ANOVA | |||||||
|---|---|---|---|---|---|---|---|
| PBE | MR | MHM | MSHM | SHM | Welch’s F | ||
| Environmentalism | 4.13 (0.33) | 4.02 (0.39) | 3.81 (0.40) | 3.72 (0.48) | 3.35 (0.41) | 69.93 (4, 301) *** | 0.48 |
| Meat Attachment | 1.26 (0.28) | 2.15 (0.77) | 2.43 (0.79) | 3.13 (0.82) | 2.70 (0.62) | 444.69 (4, 294) *** | 0.86 |
| Self-Efficacy | 4.77 (0.23) | 4.47 (0.77) | 3.73 (0.71) | 3.59 (0.91) | 3.31 (0.83) | 283.87 (4, 288) *** | 0.80 |
| Orient. Health | 4.19 (0.63) | 4.30 (0.63) | 3.84 (0.71) | 3.76 (0.89) | 3.54 (0.50) | 37.70 (4, 316) *** | 0.32 |
| Orient. Nat. | 3.60 (0.85) | 3.95 (0.79) | 3.41 (0.85) | 2.81 (1.01) | 3.35 (0.51) | 47.26 (4, 328) *** | 0.37 |
| Orient. Tradition | 2.78 (0.78) | 2.70 (0.93) | 3.52 (0.72) | 3.37 (0.89) | 3.56 (0.53) | 58.68 (4, 315) *** | 0.43 |
| Orient. Pleasure | 3.95 (0.61) | 3.54 (0.82) | 4.03 (0.56) | 3.69 (0.76) | 3.54 (0.49) | 27.37 (4, 306) *** | 0.26 |
| Orient. Aff. | 2.31 (0.94) | 1.29 (0.39) | 2.85 (1.00) | 1.37 (0.43) | 3.32 (0.53) | 379.53 (4, 310) *** | 0.83 |
| Orient. Liking | 4.60 (0.38) | 4.53 (0.44) | 4.40 (0.42) | 4.59 (0.42) | 3.59 (0.47) | 62.36 (4, 298) *** | 0.46 |
| Orient. Habit | 4.00 (0.55) | 3.43 (0.76) | 3.94 (0.53) | 4.10 (0.54) | 3.53 (0.50) | 37.80 (4, 302) *** | 0.33 |
| Orient. Conv. | 3.75 (0.76) | 3.06 (1.08) | 3.83 (0.65) | 3.68 (0.94) | 3.52 (0.47) | 24.64 (4, 317) *** | 0.24 |
| Orient. Soc. | 3.56 (0.94) | 3.53 (0.97) | 3.63 (0.85) | 3.07 (1.08) | 3.53 (0.57) | 11.60 (4, 322) *** | 0.13 |
| Orient. Pr. | 2.92 (0.83) | 2.18 (0.85) | 2.95 (0.86) | 2.82 (1.02) | 3.37 (0.51) | 48.42 (4, 329) *** | 0.37 |
| Orient. App. | 2.84 (0.74) | 2.29 (0.90) | 3.10 (0.75) | 2.40 (0.82) | 3.49 (0.53) | 69.10 (4, 316) *** | 0.47 |
| Orient. Weight | 2.51 (1.00) | 2.46 (1.15) | 3.10 (0.91) | 2.61 (1.06) | 3.47 (0.58) | 38.83 (4, 326) *** | 0.32 |
| Orient. Norms | 2.01 (0.76) | 1.73 (0.77) | 2.62 (0.77) | 1.75 (0.69) | 3.28 (0.48) | 146.46 (4, 323) *** | 0.64 |
| PBE MR | PBE MHM | PBE MSHM | PBE SHM | MR MHM | MR MSHM | MR SHM | MHM MSHM | MHM SHM | MSHM SHM | |
| Environmentalism | −0.11 (0.30) | −0.32 (0.87) | −0.41 (1.00) | −0.78 (2.10) | −0.21 (0.53) | −0.30 (0.69) | −0.67 (1.68) | −0.09 (0.20) | −−0.46 (1.13) | −0.37 (0.83) |
| Meat Attachment | 0.89 (1.53) | 1.16 (1.96) | 1.86 (3.04) | 1.44 (2.98) | 0.28 (0.36) | 0.98 (1.23) | 0.55 (0.79) | 0.70 (0.87) | 0.27 (0.39) | −0.43 (0.59) |
| Self-Efficacy | −0.30 (0.82) | −1.05 (1.98) | −1.19 (1.79) | −1.47 (2.40) | −0.75 (1.24) | −0.89 (1.23) | −1.16 (1.73) | −0.14 (0.17) | −0.42 (0.54) | −0.28 (0.32) |
| Orient. Health | 0.10 (0.17) | −0.35 (0.52) | −0.43 (0.56) | −0.65 (1.14) | −0.46 (0.68) | −0.54 (0.70) | −0.76 (1.34) | −0.09 (0.11) | −0.30 (0.50) | −0.22 (0.30) |
| Orient. Nat. | 0.35 (0.43) | −0.19 (0.23) | −0.79 (0.85) | −0.26 (0.36) | −0.55 (0.67) | −1.15 (1.27) | −0.61 (0.92) | −0.60 (0.64) | −0.06 (0.09) | 0.54 (−0.67) |
| Orient. Tradition | −0.09 (0.10) | 0.74 (0.99) | 0.59 (0.70) | 0.78 (1.17) | 0.82 (0.99) | 0.67 (0.74) | 0.87 (1.14) | −0.15 (0.19) | 0.04 (0.07) | 0.19 (0.27) |
| Orient. Pleasure | −0.41 (0.57) | 0.08 (0.14) | −0.26 (0.38) | −0.41 (0.74) | 0.49 (0.70) | 0.15 (0.19) | 0.01 (0.01) | −0.34 (0.51) | −0.49 (0.93) | −0.15 (0.23) |
| Orient. Aff. | −1.02 (1.41) | 0.55 (0.56) | −0.94 (1.28) | 1.01 (1.31) | 1.56 (2.07) | 0.08 (0.20) | 2.03 (4.36) | −1.48 (1.93) | 0.46 (0.58) | 1.94 (4.02) |
| Orient. Liking | −0.07 (0.16) | −0.19 (0.48) | −0.01 (0.02) | −1.00 (2.36) | −0.13 (0.29) | 0.06 (0.13) | −0.94 (2.06) | 0.18 (0.44) | −0.81 (1.81) | −0.99 (2.24) |
| Orient. Habit | −0.57 (0.85) | −0.06 (0.10) | 0.11 (0.20) | −0.47 (0.89) | 0.51 (0.78) | 0.67 (1.02) | 0.10 (0.15) | 0.16 (0.30) | −0.41 (0.80) | −0.58 (1.11) |
| Orient. Conv. | −0.69 (0.74) | 0.08 (0.12) | −0.07 (0.08) | −0.23 (0.36) | 0.77 (0.86) | 0.62 (0.61) | 0.46 (0.55) | −0.15 (0.19) | −0.31 (0.55) | −0.16 (0.22) |
| Orient. Soc. | −0.03 (0.03) | 0.07 (0.07) | −0.49 (0.48) | −0.03 (0.03) | 0.09 (0.10) | −0.46 (0.45) | −0.01 (0.01) | −0.55 (0.57) | −0.09 (0.13) | 0.46 (0.54) |
| Orient. Pr. | −0.73 (0.87) | 0.03 (0.04) | −0.10 (0.10) | 0.45 (0.66) | 0.77 (0.90) | 0.64 (0.68) | 1.19 (1.70) | −0.13 (0.14) | 0.42 (0.60) | 0.55 (0.68) |
| Orient. App. | −0.56 (0.68) | 0.25 (0.34) | −0.45 (0.57) | 0.65 (1.00) | 0.81 (0.98) | 0.11 (0.13) | 1.20 (1.63) | −0.70 (0.89) | 0.39 (0.61) | 1.09 (1.58) |
| Orient. Weight | −0.04 (0.04) | 0.59 (0.62) | 0.10 (0.10) | 0.97 (1.19) | 0.64 (0.61) | 0.15 (0.13) | 1.01 (1.11) | −0.49 (0.50) | 0.37 (0.49) | 0.86 (1.01) |
| Orient. Norms | −0.28 (0.36) | 0.62 (0.80) | −0.26 (0.35) | 1.28 (2.01) | 0.89 (1.16) | 0.02 (0.03) | 1.55 (2.42) | −0.87 (1.19) | 0.66 (1.03) | 1.53 (2.57) |
References
- European Commission. 2030 Climate Target Plan. 2020. Available online: https://ec.europa.eu/info/law/better-regulation/have-your-say/initiatives/12265-2030-Climate-Target-Plan_en (accessed on 10 November 2021).
- Fujimori, S.; Hasegawa, T.; Krey, V.; Riahi, K.; Bertram, C.; Bodirsky, B.L.; Callen, J.; Després, J.; Doelman, J.; Drouet, L.; et al. A multi-model assessment of food security implications of climate change mitigation. Nat. Sustain. 2019, 2, 386–396. [Google Scholar] [CrossRef] [Green Version]
- Linder, N.; Lindahl, T.; Borgström, S. Using behavioural insights to promote food waste recycling in urban house-holds—Evidence from a longitudinal field experiment. Front. Psychol. 2018, 9, 352. [Google Scholar] [CrossRef] [PubMed] [Green Version]
- Nisa, C.F.; Bélanger, J.J.; Schumpe, B.M.; Faller, D.G. Meta-analysis of randomised controlled trials testing behavioural interventions to promote household action on climate change. Nat. Commun. 2019, 10, 1–13. [Google Scholar] [CrossRef] [PubMed] [Green Version]
- Gao, J.; Hou, H.; Zhai, Y.; Woodward, A.; Vardoulakis, S.; Kovats, S.; Wilkinson, P.; Li, L.; Song, X.; Xu, L.; et al. Greenhouse gas emissions reduction in different economic sectors: Mitigation measures, health co-benefits, knowledge gaps, and policy implications. Environ. Pollut. 2018, 240, 683–698. [Google Scholar] [CrossRef] [PubMed]
- Moberg, K.R.; Aall, C.; Dorner, F.; Reimerson, E.; Ceron, J.-P.; Sköld, B.; Sovacool, B.K.; Piana, V. Mobility, food and housing: Responsibility, individual consumption and demand-side policies in European deep decarbonization pathways. Energy Effic. 2019, 12, 497–519. [Google Scholar] [CrossRef] [Green Version]
- Wynes, S.; Nicholas, K.A. The climate mitigation gap: Education and government recommendations miss the most effective individual actions. Environ. Res. Lett. 2017, 12, 074024. [Google Scholar] [CrossRef] [Green Version]
- Stoll-Kleemann, S.; Schmidt, U.J. Reducing meat consumption in developed and transition countries to counter climate change and biodiversity loss: A review of influence factors. Reg. Environ. Chang. 2017, 17, 1261–1277. [Google Scholar] [CrossRef] [Green Version]
- Lacroix, K.; Gifford, R. Targeting interventions to distinct meat-eating groups reduces meat consumption. Food Qual. Prefer. 2020, 86, 103997. [Google Scholar] [CrossRef]
- Lacroix, K.; Gifford, R. Reducing meat consumption: Identifying group-specific inhibitors using latent profile analysis. Appetite 2019, 138, 233–241. [Google Scholar] [CrossRef] [Green Version]
- Wehner, C.; Maaß, U.; Leckelt, M.; Back, M.D.; Ziegler, M. Validation of the Short Dark Triad in a German sample: Structure, nomological network, and an ultrashort version. Eur. J. Psychol. Assess. 2020, 37, 397–408. [Google Scholar] [CrossRef]
- Mertens, A.; von Krause, M.; Denk, A.; Heitz, T. Gender differences in eating behavior and environmental attitudes—The mediating role of the Dark Triad. Personal. Individ. Differ. 2021, 168, 110359. [Google Scholar] [CrossRef]
- Mertens, A.; von Krause, M.; Meyerhöfer, S.; Aziz, C.; Baumann, F.; Denk, A.; Heitz, T.; Maute, J. Valuing humans over animals—Gender differences in meat-eating behavior and the role of the Dark Triad. Appetite 2020, 146, 104516. [Google Scholar] [CrossRef]
- Costa, P.; McCrae, R.R. A five-factor theory of personality. Five-Factor Model Personal. Theor. Perspect. 1999, 2, 51–87. [Google Scholar]
- Wehner, C.; Ziegler, M.; Gödeke, W.; Lämmle, L. Further inflaming the discussion or cooling down feelings? A network analysis of the Dark Triad and the Five Factor Model of personality. Personal. Individ. Differ. 2021, 175, 110717. [Google Scholar] [CrossRef]
- Jones, D.; Paulhus, D. Introducing the Short Dark Triad ( SD3): A Brief Measure of Dark Personality Traits. Assessment 2013, 21, 28–41. [Google Scholar] [CrossRef]
- Renner, B.; Sproesser, G.; Strohbach, S.; Schupp, H. Why we eat what we eat: The Eating Motivation Survey (TEMS). Appetite 2012, 59, 117–128. [Google Scholar] [CrossRef] [Green Version]
- Matz, S.C.; Kosinski, M.; Nave, G.; Stillwell, D.J. Psychological targeting as an effective approach to digital mass persuasion. Proc. Natl. Acad. Sci. USA 2017, 114, 12714–12719. [Google Scholar] [CrossRef] [PubMed] [Green Version]
- Poushter, J.; Huang, C. Climate Change Still Seen as the Top Global Threat, but Cyberattacks a Rising Concern. Res. Cent. 2019, 10, 1–37. [Google Scholar]
- Slingo, J.M.; Challinor, A.J.; Hoskins, B.J.; Wheeler, T.R. Introduction: Food crops in a changing climate. Philos. Trans. R. Soc. B Biol. Sci. 2005, 360, 1983–1989. [Google Scholar] [CrossRef] [Green Version]
- Lacroix, K. Comparing the relative mitigation potential of individual pro-environmental behaviors. J. Clean. Prod. 2018, 195, 1398–1407. [Google Scholar] [CrossRef]
- IPCC; Masson-Delmotte, V.; Zhai, P.; Pirani, A.; Connors, S.L.; Péan, C.; Berger, S.; Caud, N.; Chen, Y.; Goldfarb, L.; et al. (Eds.) Climate Change 2021: The Physical Science Basis. Contribution of Working Group I to the Sixth Assessment Report of the Intergovernmental Panel on Climate Change; Cambridge University Press: Cambridge, UK, 2021. [Google Scholar]
- Mann, E. The New Climate War: The Fight to Take Back Our Planet; Hachette: London, UK, 2021. [Google Scholar]
- World Resources Institute. Climate Analysis Indicators Tool: WRI’s Climate Data Explorer; World Resources Institute: Washington, DC, USA, 2021; Available online: https://cait2.wri.org (accessed on 11 November 2021).
- Poore, J.; Nemecek, T. Reducing food’s environmental impacts through producers and consumers. Science 2018, 360, 987–992. [Google Scholar] [CrossRef] [PubMed] [Green Version]
- Clark, M.A.; Springmann, M.; Hill, J.; Tilman, D. Multiple health and environmental impacts of foods. Proc. Natl. Acad. Sci. USA 2019, 116, 23357–23362. [Google Scholar] [CrossRef] [PubMed] [Green Version]
- Tilman, D.; Clark, M. Global diets link environmental sustainability and human health. Nature 2014, 515, 518–522. [Google Scholar] [CrossRef]
- Osbaldiston, R.; Schott, J.P. Environmental sustainability and behavioral science: Meta-analysis of proenvironmental behavior experiments. Environ. Behav. 2012, 44, 257–299. [Google Scholar] [CrossRef]
- Michie, S.; Van Stralen, M.M.; West, R. The behaviour change wheel: A new method for characterizing and designing behaviour change interventions. Implement. Sci. 2011, 6, 1–12. [Google Scholar] [CrossRef] [PubMed] [Green Version]
- Verplanken, B. Promoting sustainability: Towards a segmentation model of individual and household behaviour and behaviour change. Sustain. Dev. 2017, 26, 193–205. [Google Scholar] [CrossRef]
- Bamberg, S. Changing environmentally harmful behaviors: A stage model of self-regulated behavioral change. J. Environ. Psychol. 2013, 34, 151–159. [Google Scholar] [CrossRef]
- Schultz, P. Strategies for promoting proenvironmental behavior. Eur. Psychol. 2014, 19, 107–117. [Google Scholar] [CrossRef]
- O’Connor, D.B. The future of health behaviour change interventions: Opportunities for open science and personality research. Health Psychol. Rev. 2019, 14, 176–181. [Google Scholar] [CrossRef]
- Orji, R.; Nacke, L.E.; Di Marco, C. Towards personality-driven persuasive health games and gamified systems. In Proceedings of the 2017 CHI Conference on Human Factors in Computing Systems, Denver, CO, USA, 6–11 May 2017; pp. 1015–1027. [Google Scholar] [CrossRef]
- Apostolidis, C.; McLeay, F. Should we stop meating like this? Reducing meat consumption through substitution. Food Policy 2016, 65, 74–89. [Google Scholar] [CrossRef] [Green Version]
- Pohjolainen, P.; Tapio, P.; Vinnari, M.; Jokinen, P.; Räsänen, P. Consumer consciousness on meat and the environment—Exploring differences. Appetite 2016, 101, 37–45. [Google Scholar] [CrossRef] [PubMed]
- Vainio, A.; Niva, M.; Jallinoja, P.; Latvala, T. From beef to beans: Eating motives and the replacement of animal proteins with plant proteins among Finnish consumers. Appetite 2016, 106, 92–100. [Google Scholar] [CrossRef] [PubMed] [Green Version]
- Graça, J.; Calheiros, M.; Oliveira, A. Meat, beyond the plate. Data-driven hypotheses for understanding consumer willingness to adopt a more plant-based diet. Appetite 2015, 90, 80–90. [Google Scholar] [CrossRef] [PubMed]
- Klöckner, C.A.; Ofstad, S.P. Tailored information helps people progress towards reducing their beef consumption. J. Environ. Psychol. 2017, 50, 24–36. [Google Scholar] [CrossRef]
- Noar, S.M.; Benac, C.M.; Harris, M.S. Does tailoring matter? Meta-analytic review of tailored print health behavior change interventions. Psychol. Bull. 2007, 133, 673. [Google Scholar] [CrossRef] [Green Version]
- Pfeiler, T.M.; Egloff, B. Personality and meat consumption: The importance of differentiating between type of meat. Appetite 2018, 130, 11–19. [Google Scholar] [CrossRef]
- Hopwood, C.J.; Bleidorn, W. Psychological profiles of people who justify eating meat as natural, necessary, normal, or nice. Food Qual. Prefer. 2019, 75, 10–14. [Google Scholar] [CrossRef] [Green Version]
- Pfeiler, T.M.; Egloff, B. Personality and eating habits revisited: Associations between the big five, food choices, and Body Mass Index in a representative Australian sample. Appetite 2020, 149, 104607. [Google Scholar] [CrossRef]
- Dover, R.V.; Lambert, E.V. “Choice Set” for health behavior in choice-constrained settings to frame research and inform policy: Examples of food consumption, obesity and food security. Int. J. Equity Health 2016, 15, 1–8. [Google Scholar] [CrossRef] [Green Version]
- Allen, M.S.; Walter, E.E. Linking Big Five personality traits to sexuality and sexual health: A meta-analytic review. Psychol. Bull. 2018, 144, 1081. [Google Scholar] [CrossRef]
- Lamers, S.M.; Westerhof, G.J.; Kovács, V.; Bohlmeijer, E.T. Differential relationships in the association of the Big Five personality traits with positive mental health and psychopathology. J. Res. Personal. 2012, 46, 517–524. [Google Scholar] [CrossRef]
- Rochefort, C.; Hoerger, M.; Turiano, N.A.; Duberstein, P. Big Five personality and health in adults with and without cancer. J. Health Psychol. 2019, 24, 1494–1504. [Google Scholar] [CrossRef] [PubMed]
- Hudek-Knežević, J.; Kardum, I.; Mehić, N. Dark Triad traits and health outcomes: An exploratory study. Psychol. Top. 2016, 25, 129–156. [Google Scholar]
- Malesza, M.; Kaczmarek, M.C. Dark side health-predicting health behaviors and diseases with the Dark Triad traits. J. Public Health 2021, 29, 1–10. [Google Scholar] [CrossRef]
- Dębska, M.; Dębski, P.; Polechoński, J.; Rozpara, M.; Tomik, R. The Dark Triad of Personality in the Context of Health Behaviors: Ally or Enemy? Int. J. Environ. Res. Public Health 2021, 18, 4113. [Google Scholar] [CrossRef] [PubMed]
- Kesenheimer, J.S.; Greitemeyer, T. Greenwash yourself: The relationship between communal and agentic narcissism and pro-environmental behavior. J. Environ. Psychol. 2021, 75, 101621. [Google Scholar] [CrossRef]
- Pfeiler, T.M.; Egloff, B. Examining the “Veggie” personality: Results from a representative German sample. Appetite 2018, 120, 246–255. [Google Scholar] [CrossRef] [PubMed] [Green Version]
- Pfeiler, T.M.; Egloff, B. Personality and attitudinal correlates of meat consumption: Results of two representative German samples. Appetite 2018, 121, 294–301. [Google Scholar] [CrossRef] [PubMed]
- Laestadius, L.I.; Neff, R.A.; Barry, C.L.; Frattaroli, S. Meat consumption and climate change: The role of non-governmental organizations. Clim. Chang. 2013, 120, 25–38. [Google Scholar] [CrossRef]
- Sanchez-Sabate, R.; Sabaté, J. Consumer attitudes towards environmental concerns of meat consumption: A systematic review. Int. J. Environ. Res. Public Health 2019, 16, 1220. [Google Scholar] [CrossRef] [Green Version]
- Soutter, A.R.B.; Mõttus, R. Big Five facets’ associations with pro-environmental attitudes and behaviors. J. Personal. 2020, 89, 203–215. [Google Scholar] [CrossRef] [PubMed]
- Graça, J.; Calheiros, M.; Oliveira, A. Attached to meat? (Un)Willingness and intentions to adopt a more plant-based diet. Appetite 2015, 95, 113–125. [Google Scholar] [CrossRef] [PubMed]
- Ginn, J.; Lickel, B. A motivated defense of meat: Biased perceptions of meat’s environmental impact. J. Soc. Issues 2020, 76, 54–69. [Google Scholar] [CrossRef]
- Pliner, P.; Hobden, K. Development of a scale to measure the trait of food neophobia in humans. Appetite 1992, 19, 105–120. [Google Scholar] [CrossRef]
- Hielkema, M.H.; Lund, T.B. Reducing meat consumption in meat-loving Denmark: Exploring willingness, behavior, barriers and drivers. Food Qual. Prefer. 2021, 93, 104257. [Google Scholar] [CrossRef]
- Cho, M.S.; Kim, M.; Cho, W. Relationships of adolescent’s dietary habits with personality traits and food neophobia according to family meal frequency. Nutr. Res. Pract. 2014, 8, 476. [Google Scholar] [CrossRef] [PubMed] [Green Version]
- Çinar, Ç.; Karinen, A.K.; Tybur, J.M. The Multidimensional Nature of Food Neophobia. Appetite 2021, 162, 105177. [Google Scholar] [CrossRef]
- Knaapila, A.; Silventoinen, K.; Broms, U.; Rose, R.J.; Perola, M.; Kaprio, J.; Tuorila, H.M. Food neophobia in young adults: Genetic architecture and relation to personality, pleasantness and use frequency of foods, and body mass index—a twin study. Behav. Genet. 2011, 41, 512–521. [Google Scholar] [CrossRef] [PubMed]
- Nezlek, J.B.; Forestell, C.A. Food Neophobia and the Five Factor Model of Personality. Food Qual. Prefer. 2019, 73, 210–214. [Google Scholar] [CrossRef]
- Siegrist, M.; Hartmann, C.; Keller, C. Antecedents of food neophobia and its association with eating behavior and food choices. Food Qual. Prefer. 2013, 30, 293–298. [Google Scholar] [CrossRef]
- Gabriel, Y.; Lang, T. The Unmanageable Consumer; SAGE Publications: London, UK, 2015. [Google Scholar]
- Graça, J.; Truninger, M.; Junqueira, L.; Schmidt, L. Consumption orientations may support (or hinder) transitions to a more plant-based diets. Appetite 2019, 140, 19–26. [Google Scholar] [CrossRef]
- Tein, J.-Y.; Coxe, S.; Cham, H. Statistical Power to Detect the Correct Number of Classes in Latent Profile Analysis. Struct. Equ. Modeling A Multidiscip. J. 2013, 20, 640–657. [Google Scholar] [CrossRef] [PubMed]
- Aggarwal, C. Outlier Analysis, 2nd ed.; Springer: Cham, Switzerland, 2017. [Google Scholar] [CrossRef]
- Haftenberger, M.; Heuer, T.; Heidemann, C.; Kube, F.; Krems, C.; Mensink, G.B.M. Relative validation of a food frequency questionnaire for national health and nutrition monitoring. Nutr. J. 2010, 9, 1–9. [Google Scholar] [CrossRef] [PubMed] [Green Version]
- Rammstedt, B.; Danner, D.; Soto, C.J.; John, O.P. Validation of the short and extra-short forms of the Big Five Inventory-2 (BFI-2) and their German adaptions. Eur. J. Psychol. Assess. 2018, 53, 1–4. [Google Scholar] [CrossRef] [Green Version]
- Dunlap, R.; Liere, K.D.; Mertig, A.G.; Jones, R.E. Measuring Endorsement of the New Ecological Paradigm: A Revised NEP Scale. Soc. Sci. Q. 2000, 56, 425–442. [Google Scholar] [CrossRef]
- Schleyer-Lindenmann, A.; Ittner, H.; Dauvier, B.; Piolat, M. Die NEP-Skala—hinter den (deutschen) Kulissen des Umweltbewusstseins [The NEP Scale—Behind the (German) scenes of environmental concern]. Diagnostica 2018, 64, 156–167. [Google Scholar] [CrossRef]
- Profeta, A.; Baune, M.C.; Smetana, S.; Bornkessel, S.; Broucke, K.; Van Royen, G.; Enneking, U.; Weiss, J.; Heinz, V.; Hieke, S.; et al. Preferences of german consumers for meat products blended with plant-based proteins. Sustainability 2021, 13, 650. [Google Scholar] [CrossRef]
- Ritchey, P.N.; Frank, R.A.; Hursti, U.-K.; Tuorila, H. Validation and cross-national comparison of the food neophobia scale (FNS) using confirmatory factor analysis. Appetite 2003, 40, 163–173. [Google Scholar] [CrossRef]
- R Core Team. R: A Language and Environment for Statistical Computing; (Version 4.1.0); R Foundation for Statistical Computing: Vienna, Austria, 2021. [Google Scholar]
- RStudio Team. RStudio: Integrated Development for R; (Version 1.4.1106); RStudio Inc.: Boston, MA, USA, 2021. [Google Scholar]
- Scrucca, L.; Fop, M.; Murphy, T.B.; Raftery, A.E. mclust 5: Clustering, classification and density estimation using Gaussian finite mixture models. R J. 2016, 8, 289–317. [Google Scholar] [CrossRef] [Green Version]
- Stanley, L.; Kellermanns, F.W.; Zellweger, T.M. Latent profile analysis: Understanding family firm profiles. Fam. Bus. Rev. 2017, 30, 84–102. [Google Scholar] [CrossRef]
- Ketchen, D.J.; Shook, C.L. The application of cluster analysis in strategic management research: An analysis and critique. Strateg. Manag. J. 1996, 17, 441–458. [Google Scholar] [CrossRef]
- Benjamini, Y.; Hochberg, Y. Controlling the false discovery rate: A practical and powerful approach to multiple testing. J. R. Stat. Soc. Ser. B 1995, 57, 289–300. [Google Scholar] [CrossRef]
- Spurk, D.; Hirschi, A.; Wang, M.; Valero, D.; Kauffeld, S. Latent profile analysis: A review and “how to“ guide of its application within vocational behavior research. J. Vocat. Behav. 2020, 120, 103445. [Google Scholar] [CrossRef]
- Gignac, G.E.; Szodorai, E.T. Effect size guidelines for individual differences researchers. Personal. Individ. Differ. 2016, 102, 74–78. [Google Scholar] [CrossRef]
- Becker, E.; Lawrence, N.S. Meat disgust is negatively associated with meat intake–Evidence from a cross-sectional and longitudinal study. Appetite 2021, 164, 105299. [Google Scholar] [CrossRef] [PubMed]
- Mõttus, R.; McNeill, G.; Jia, X.; Craig, L.C.; Starr, J.M.; Deary, I.J. The associations between personality, diet and body mass index in older people. Health Psychol. 2013, 32, 353–360. [Google Scholar] [CrossRef] [Green Version]
- De Boer, J.; Aiking, H. Strategies towards healthy and sustainable protein consumption: A transition framework at the levels of diets, dishes, and dish ingredients. Food Qual. Prefer. 2019, 73, 171–181. [Google Scholar] [CrossRef]
- Heaven, P.C.; Mulligan, K.; Merrilees, R.; Woods, T.; Fairooz, Y. Neuroticism and coscientiousness as predictors of emotional, external, and restrained eating behaviors. Int. J. Eat. Disord. 2001, 30, 161–166. [Google Scholar] [CrossRef]
- Kowalski, C.M.; Rogoza, R.; Vernon, P.A.; Schermer, J.A. The Dark Triad and the self-presentation variables of socially desirable responding and self-monitoring. Personal. Individ. Differ. 2018, 120, 234–237. [Google Scholar] [CrossRef]
- Kesenheimer, J.S.; Greitemeyer, T. Going Green (and Not Being Just More Pro-Social): Do Attitude and Personality Specifically Influence Pro-Environmental Behavior? Sustainability 2021, 13, 3560. [Google Scholar] [CrossRef]
- Heinrich-Böll-Stiftung. Fleischatlas: Daten und Fakten über Tiere als Nahrungsmittel, 1st ed.; Bonifatius GmbH: Paderborn, Germany, 2021. [Google Scholar]
- Hilger, J.; Loerbroks, A.; Diehl, K. Eating behaviour of university students in Germany: Dietary intake, barriers to healthy eating and changes in eating behaviour since the time of matriculation. Appetite 2017, 109, 100–107. [Google Scholar] [CrossRef] [PubMed]
- Jonason, P.K.; Davis, M.D. A gender role view of the Dark Triad traits. Personal. Individ. Differ. 2018, 125, 102–105. [Google Scholar] [CrossRef]
- Breidenassel, C.; Schäfer, A.C.; Micka, M.; Richter, M.; Linseisen, J.; Watzl, B. for the German Nutrition Society (DGE). The Planetary Health Diet in contrast to the food-based dietary guidelines of the German Nutrition Society (DGE). A DGE statement. Ernährungsumschau 2022, 69, 56–72.e1–3. [Google Scholar] [CrossRef]
- Hudson, N.W.; Briley, D.A.; Chopik, W.J.; Derringer, J. You have to follow through: Attaining behavioral change goals predicts volitional personality change. J. Personal. Soc. Psychol. 2019, 117, 839–857. [Google Scholar] [CrossRef] [PubMed] [Green Version]
- Hudson, N.W. Lighten the darkness: Personality interventions targeting agreeableness also reduce participants’ levels of the dark triad. J. Personal. 2022, 1–16. [Google Scholar] [CrossRef]
- Yun, D.; Silk, K.J. Social norms, self-identity, and attention to social comparison information in the context of exercise and healthy diet behavior. Health Commun. 2011, 26, 275–285. [Google Scholar] [CrossRef] [PubMed]

| Number of Profiles | BIC | BLRT | Entropy |
|---|---|---|---|
| 1 | −40,419 | ||
| 2 | −40,214 | 0.99 | |
| 3 | −40,032 | 0.90 | |
| 4 | −40,094 | 0.84 | |
| 5 | −39,968 | 0.86 | |
| 6 | −40,016 | 0.85 |
Publisher’s Note: MDPI stays neutral with regard to jurisdictional claims in published maps and institutional affiliations. |
© 2022 by the authors. Licensee MDPI, Basel, Switzerland. This article is an open access article distributed under the terms and conditions of the Creative Commons Attribution (CC BY) license (https://creativecommons.org/licenses/by/4.0/).
Share and Cite
Palnau, J.-F.; Ziegler, M.; Lämmle, L. You Are What You Eat and So Is Our Planet: Identifying Dietary Groups Based on Personality and Environmentalism. Int. J. Environ. Res. Public Health 2022, 19, 9354. https://doi.org/10.3390/ijerph19159354
Palnau J-F, Ziegler M, Lämmle L. You Are What You Eat and So Is Our Planet: Identifying Dietary Groups Based on Personality and Environmentalism. International Journal of Environmental Research and Public Health. 2022; 19(15):9354. https://doi.org/10.3390/ijerph19159354
Chicago/Turabian StylePalnau, Jan-Felix, Matthias Ziegler, and Lena Lämmle. 2022. "You Are What You Eat and So Is Our Planet: Identifying Dietary Groups Based on Personality and Environmentalism" International Journal of Environmental Research and Public Health 19, no. 15: 9354. https://doi.org/10.3390/ijerph19159354
APA StylePalnau, J.-F., Ziegler, M., & Lämmle, L. (2022). You Are What You Eat and So Is Our Planet: Identifying Dietary Groups Based on Personality and Environmentalism. International Journal of Environmental Research and Public Health, 19(15), 9354. https://doi.org/10.3390/ijerph19159354