
Spatiotemporal Characteristics, Decoupling Effect and Driving Factors of Carbon Emission from Cultivated Land Utilization in Hubei Province

 ,
,
Abstract
:1. Introduction
2. Materials and Methods
2.1. Calculation Method of Carbon Emission from Cultivated Land Use
2.2. Decoupling Relation Model
2.3. Decomposition Model of Carbon Emission Drivers
3. Study Area and Data Source
3.1. Study Area
3.2. Data Sources
4. Results
4.1. Spatiotemporal Characteristics of Carbon Emissions from Cultivated Land Use
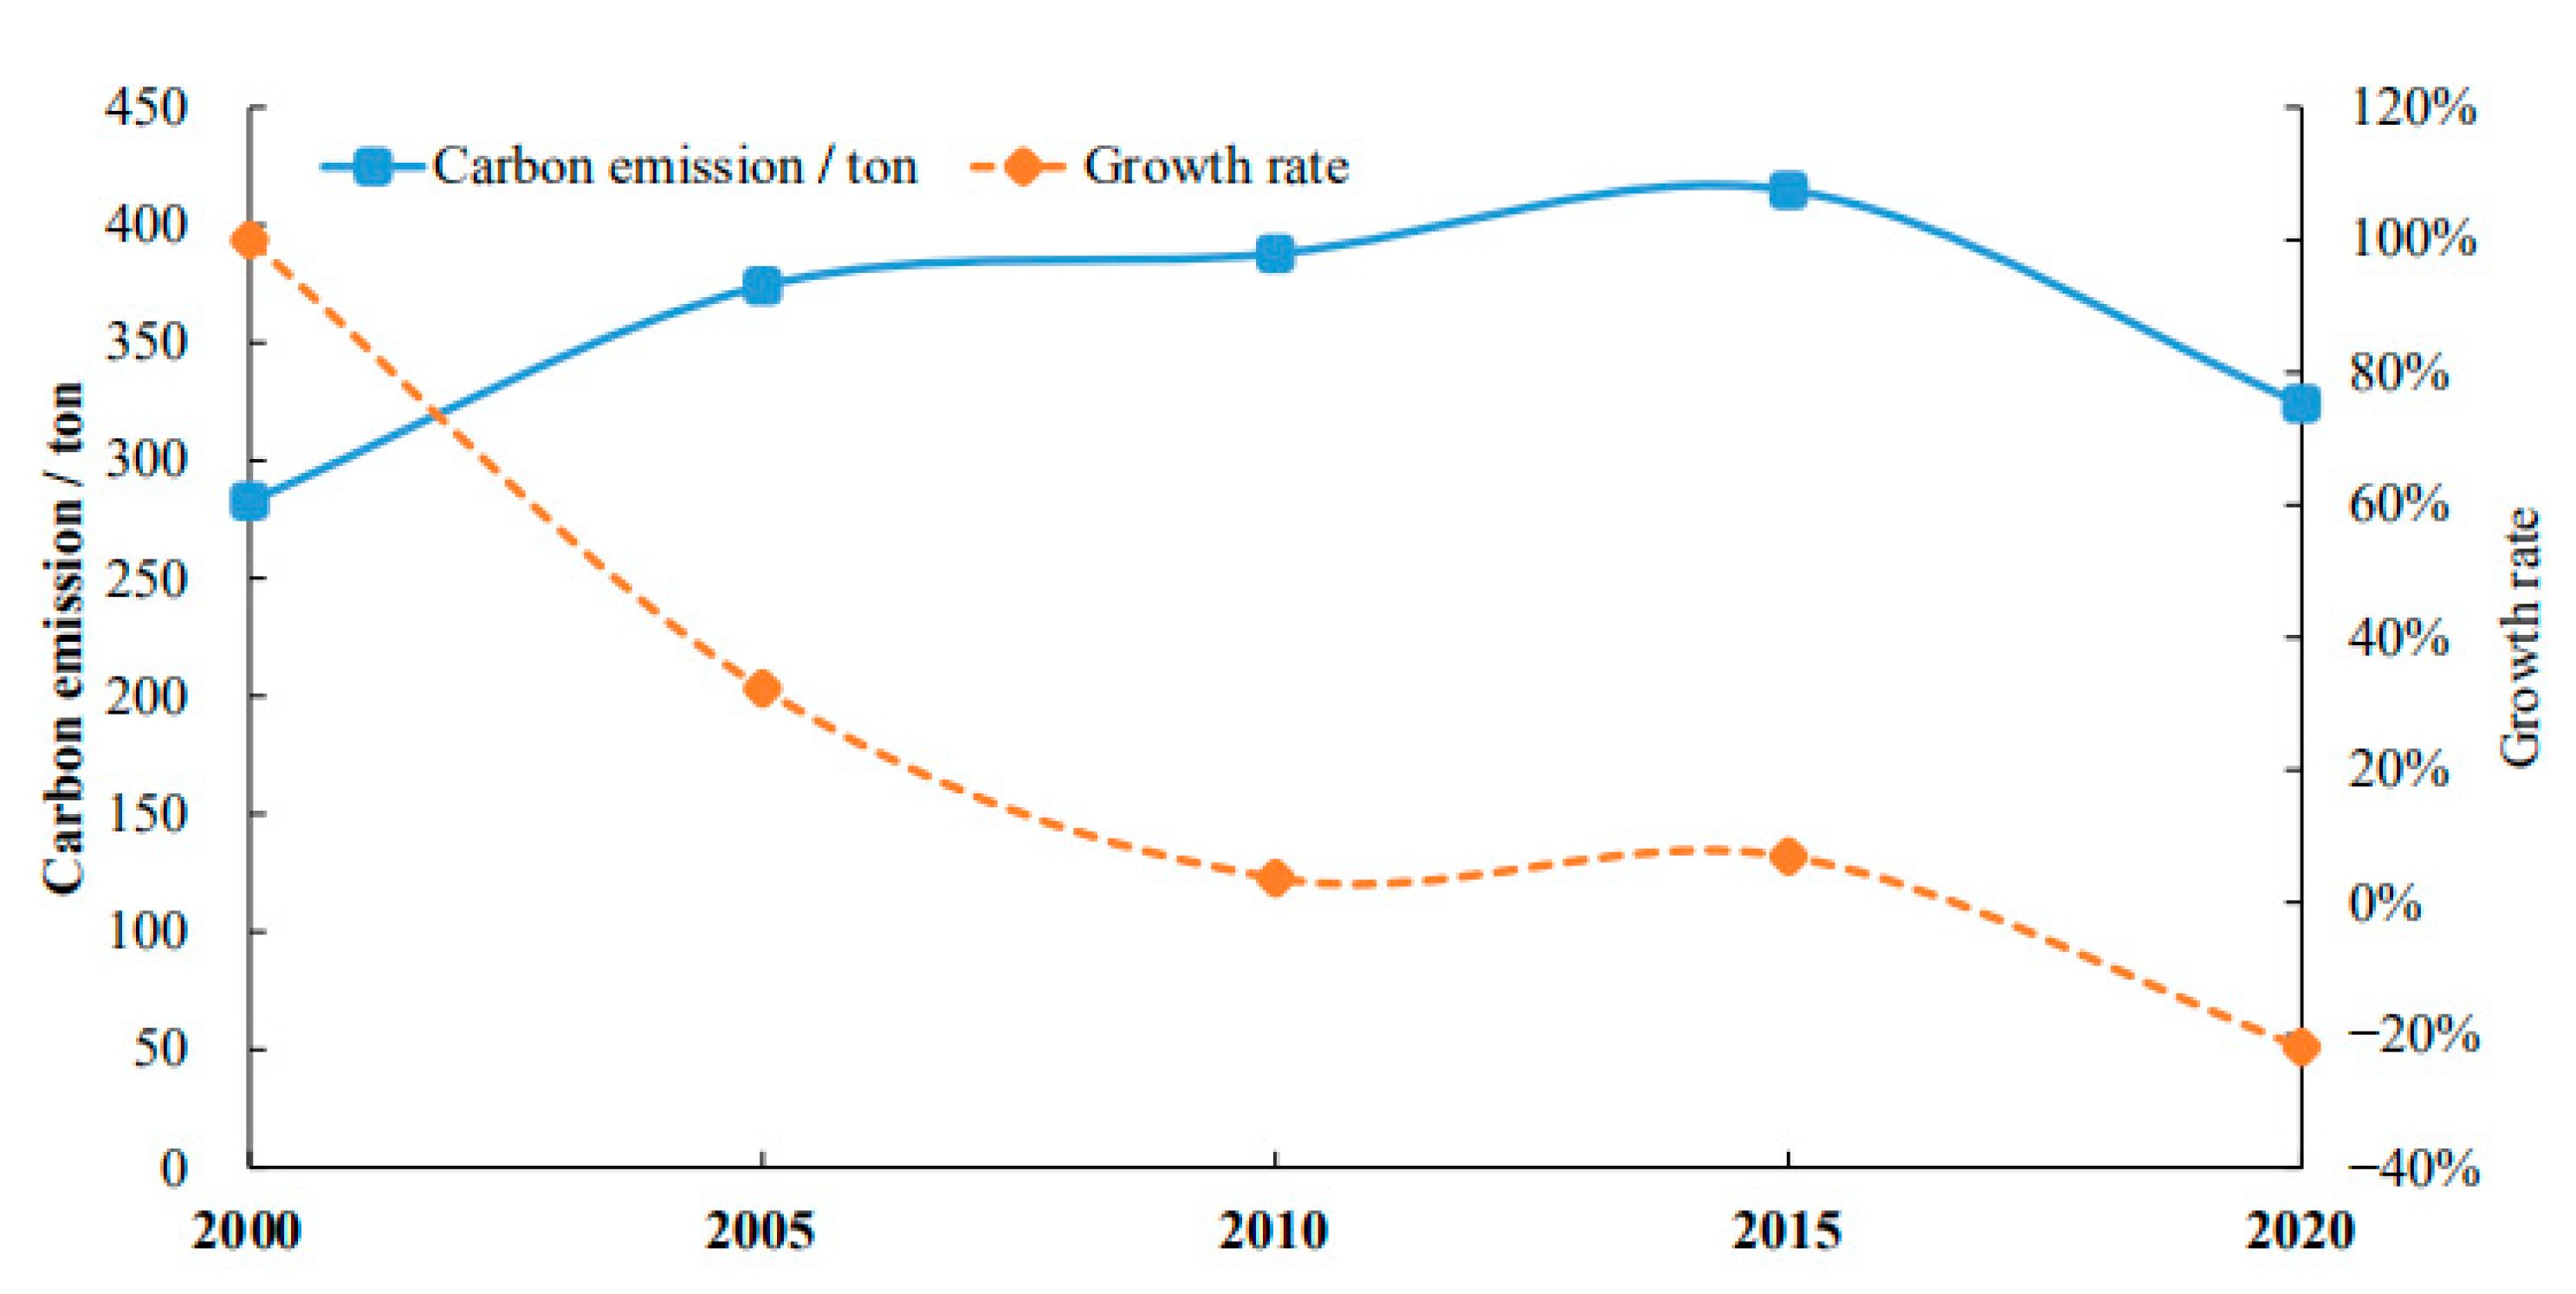
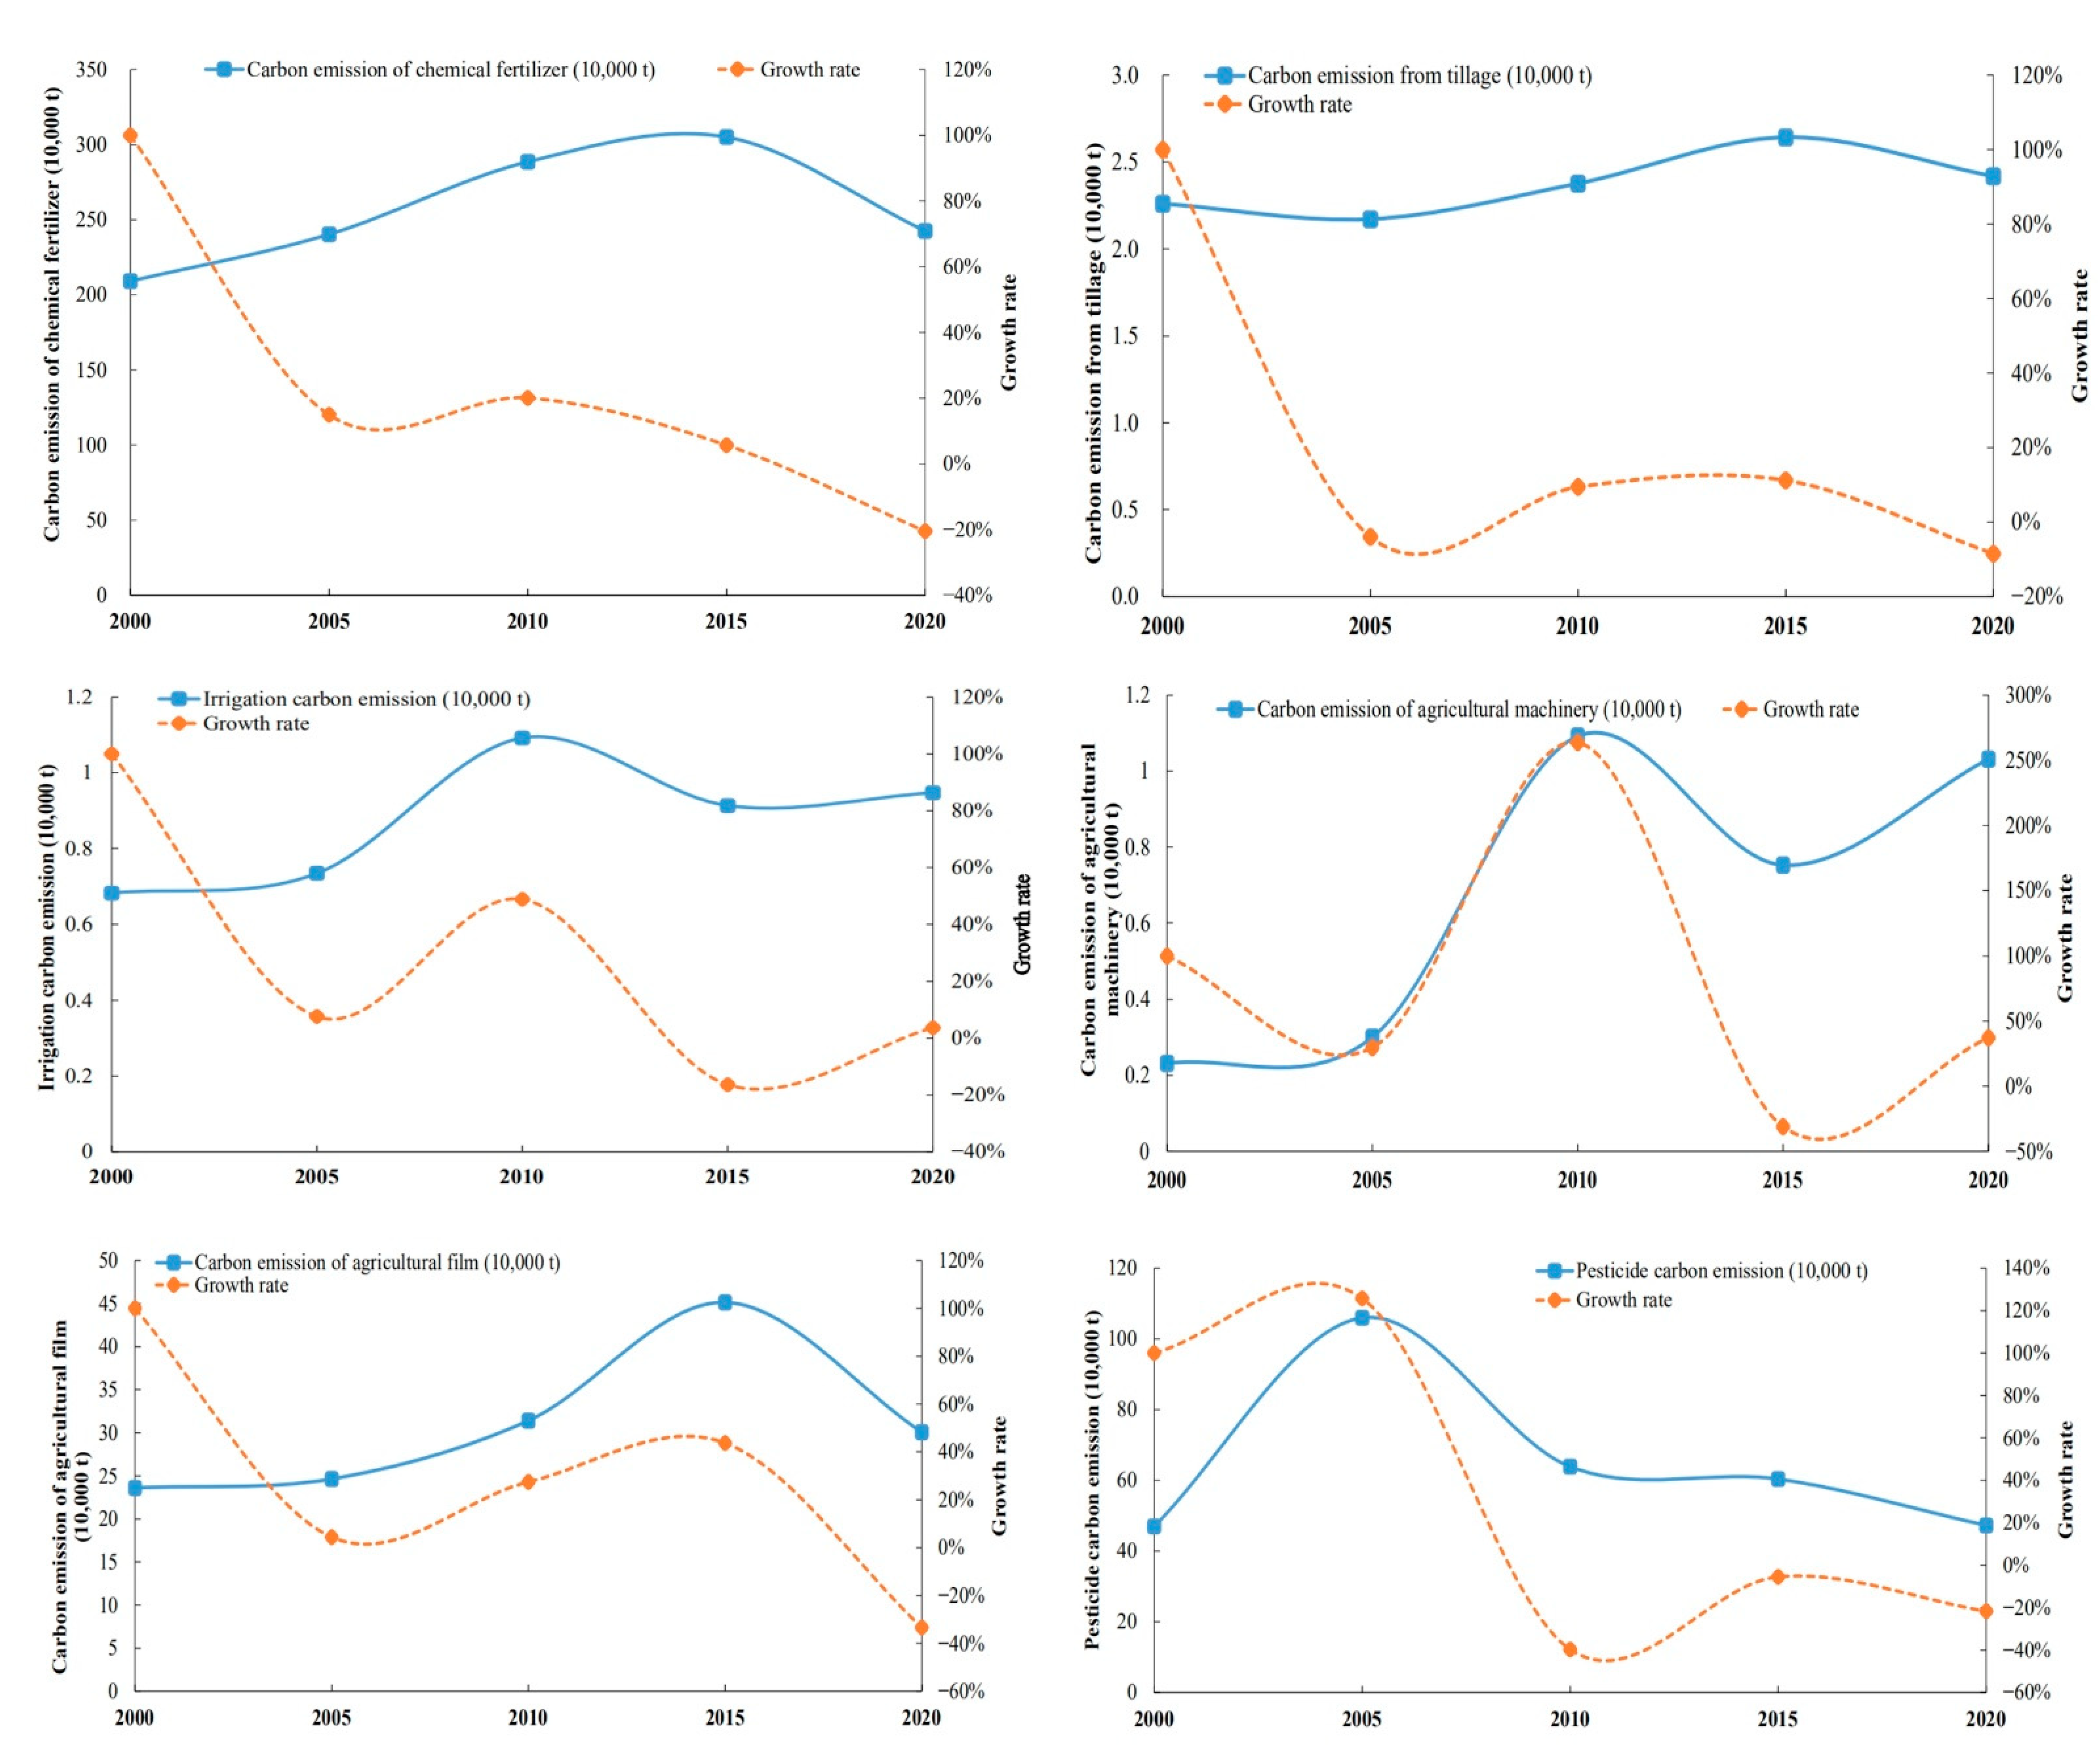
4.1.1. Time Series Change of Carbon Emissions
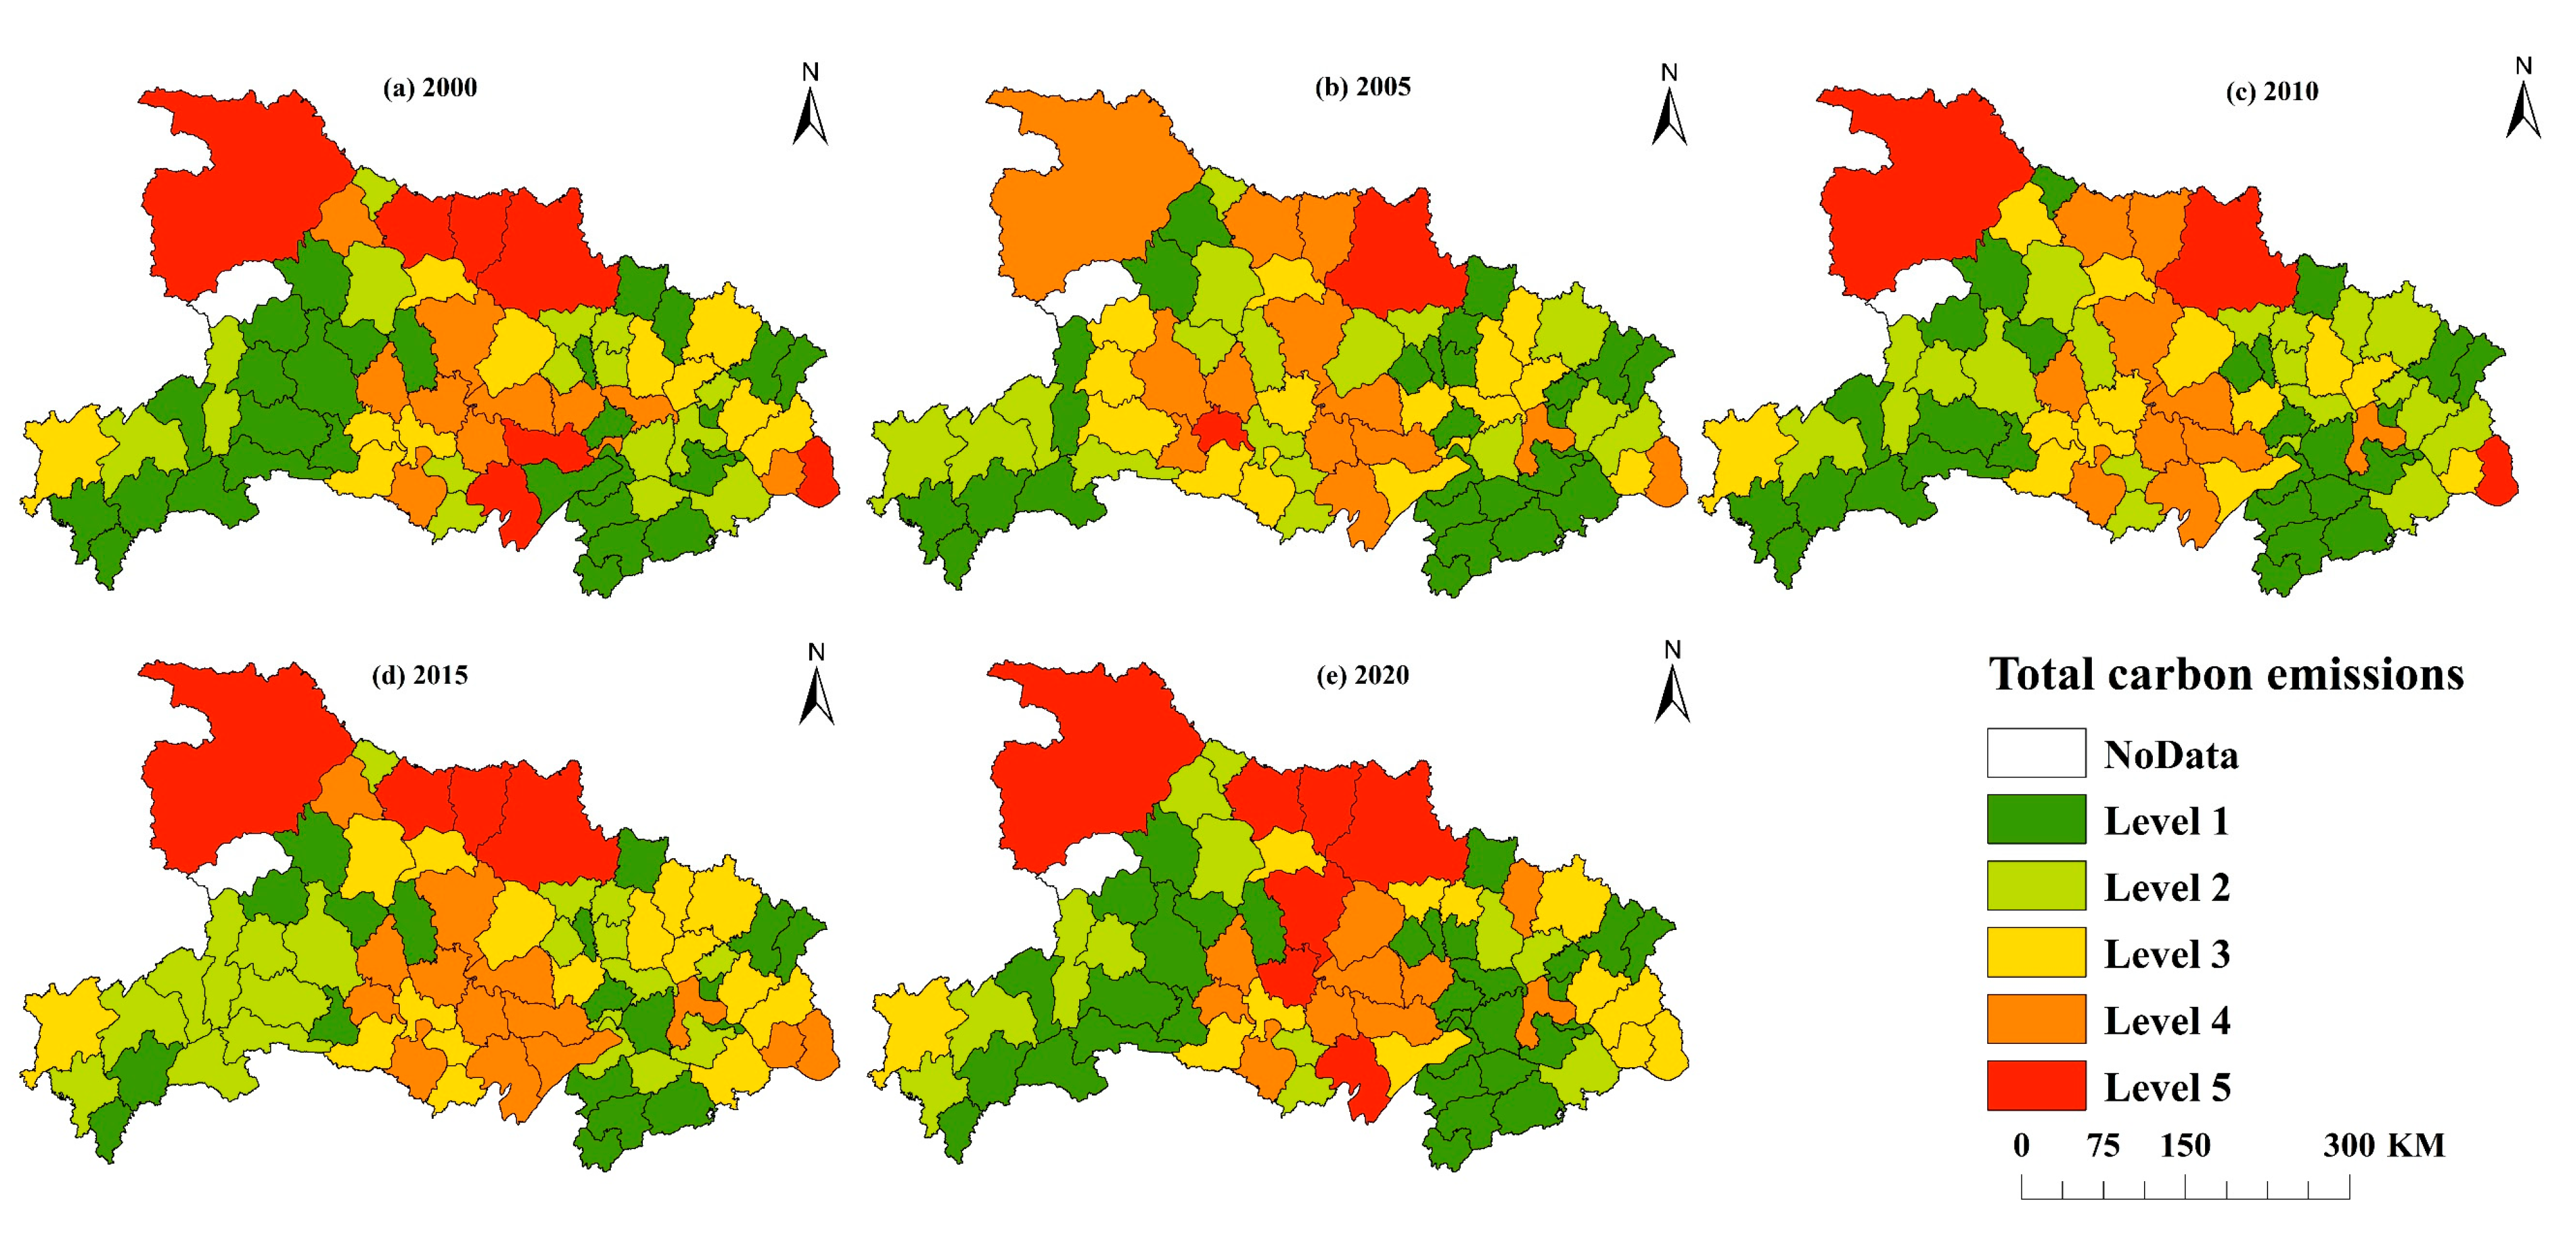
4.1.2. Spatial Variation of Carbon Emissions
4.1.3. Topographic Differences in the Proportion of Emissions Per Carbon Source
4.2. Spatiotemporal Characteristics of Carbon Emission Intensity
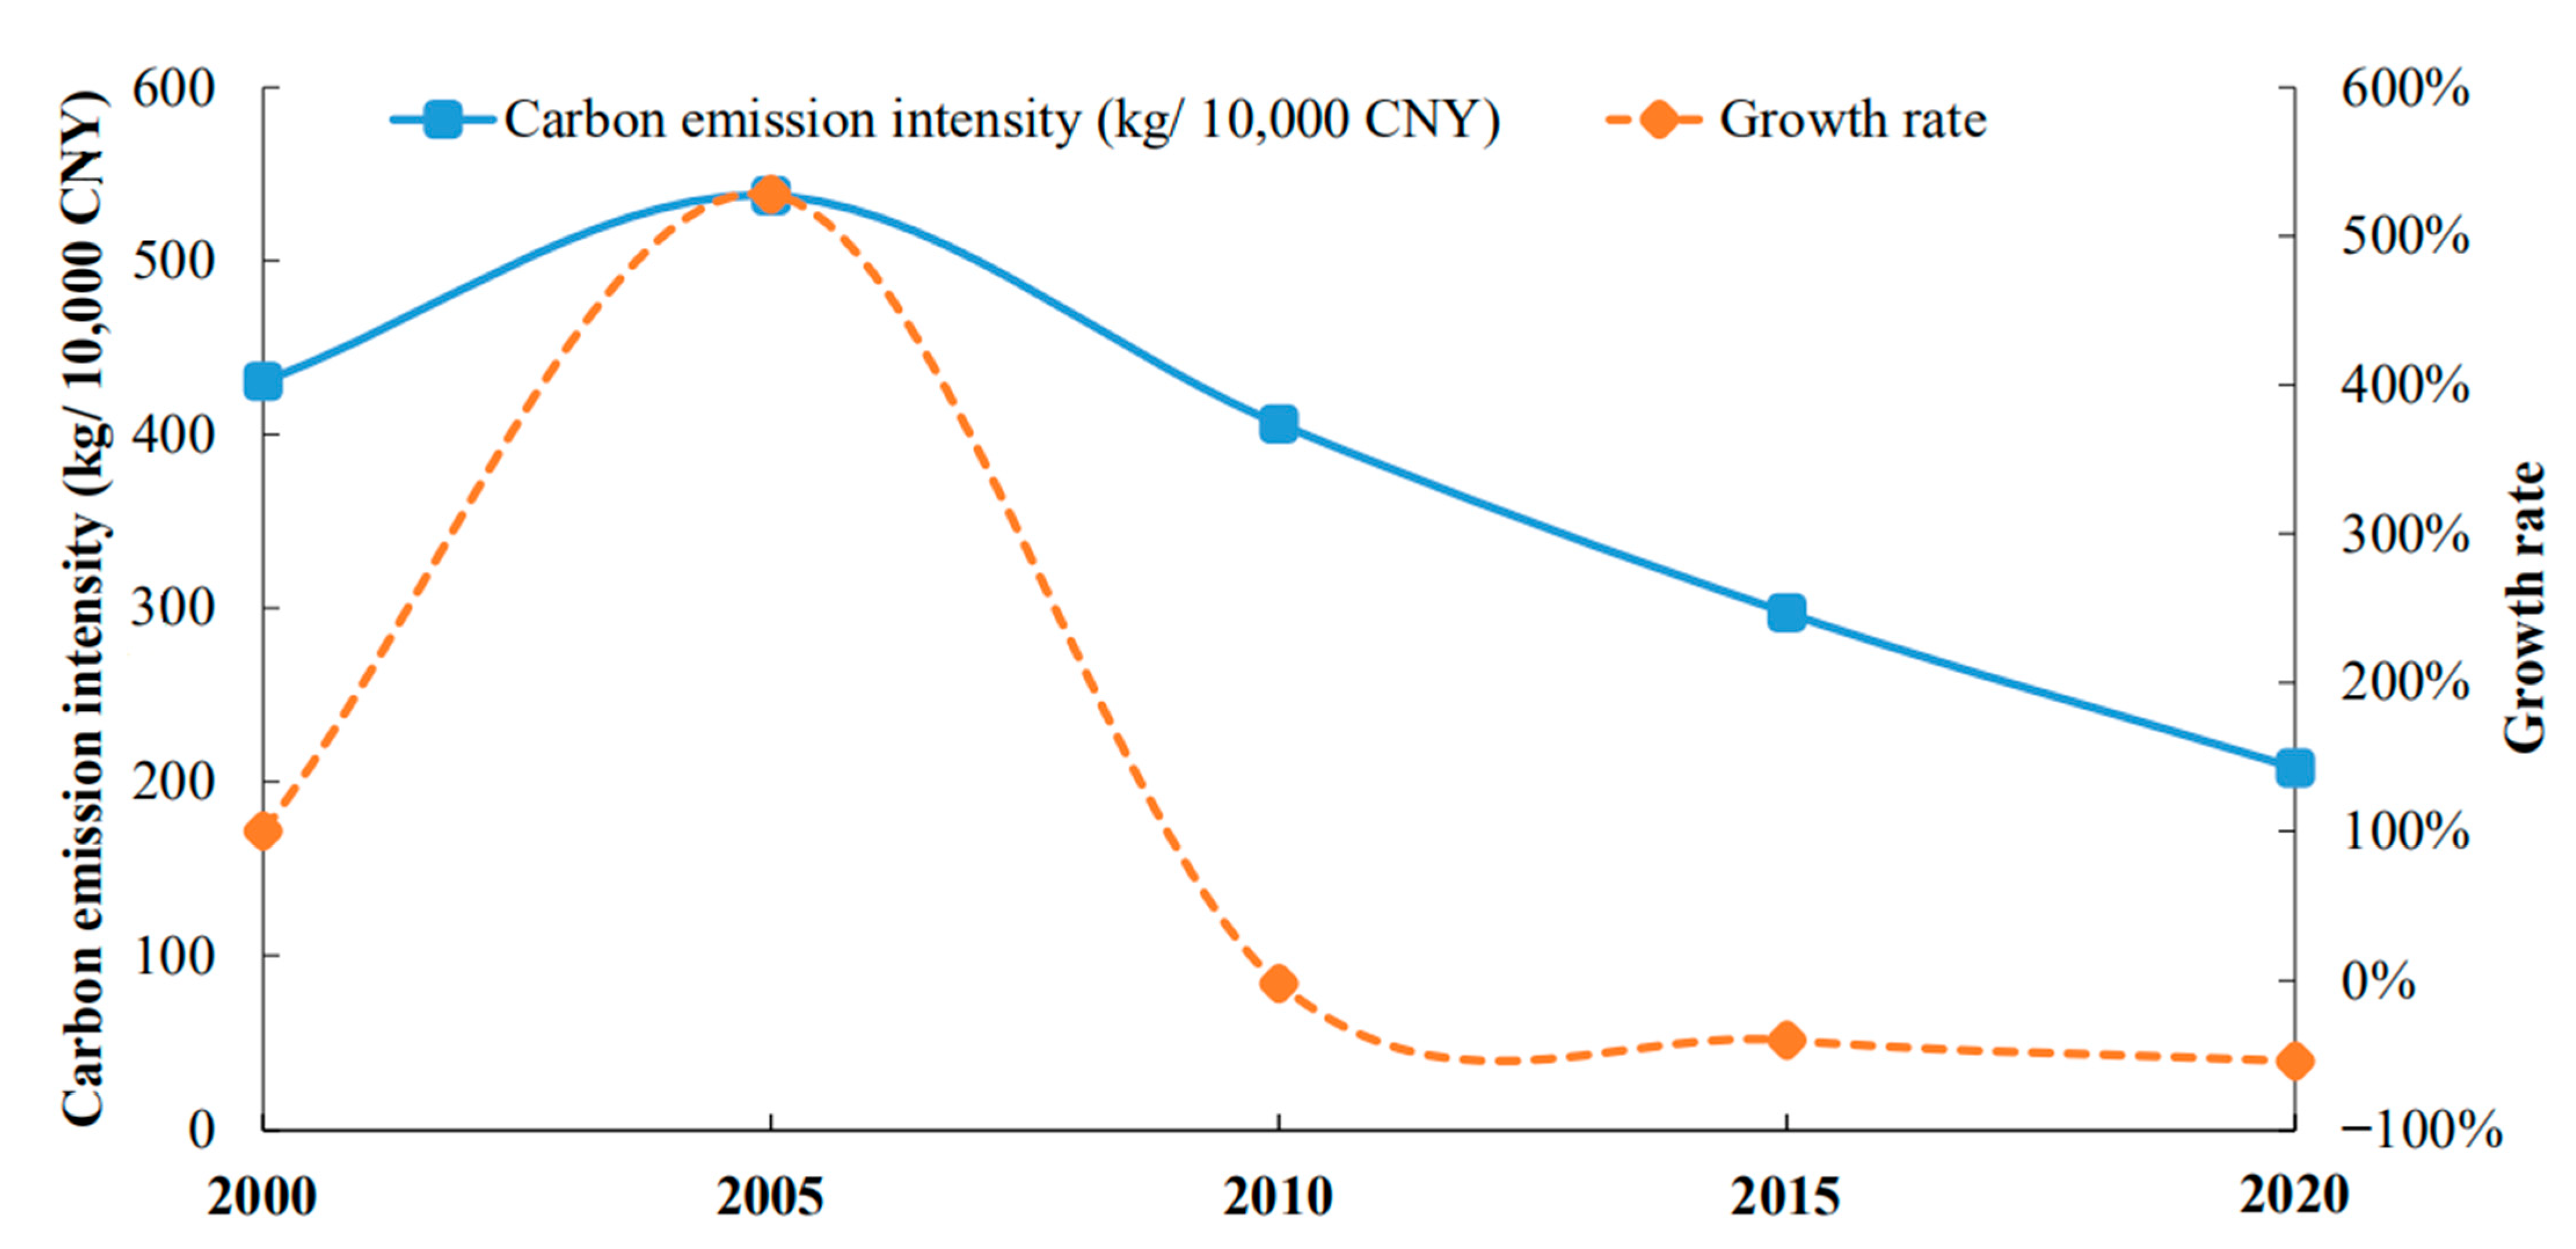
4.2.1. Time Series Change of Carbon Emission Intensity
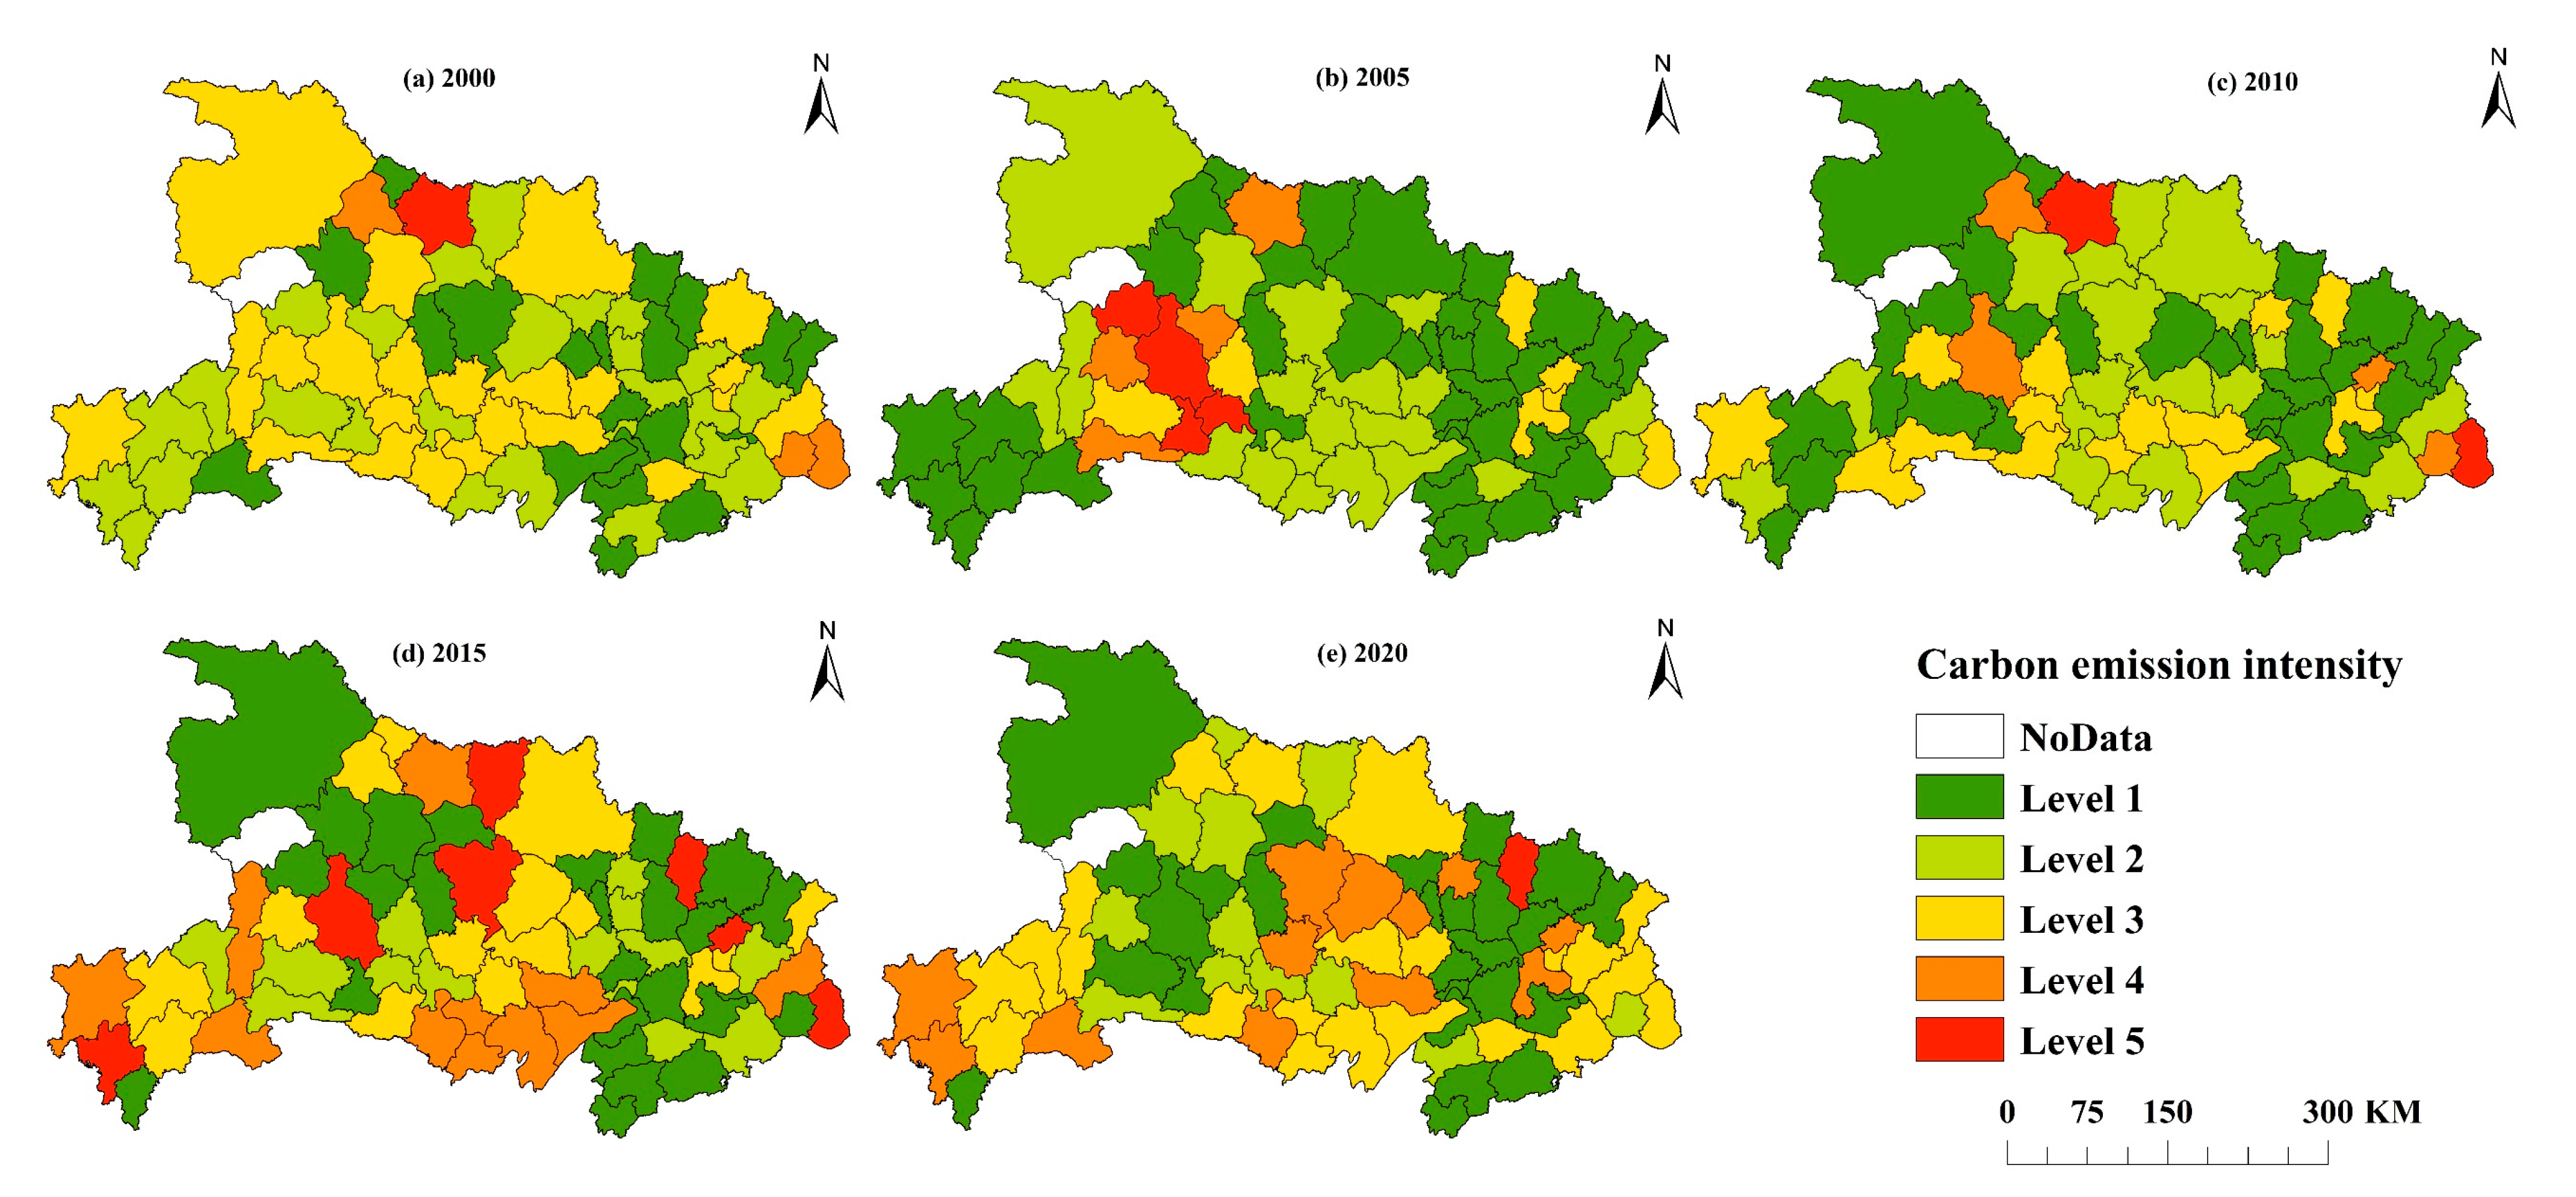
4.2.2. Spatial Variation of Carbon Emission Intensity
4.2.3. Topographic Differences in Carbon Emission Intensity
4.3. Analysis on Decoupling Effect between Carbon Emission and Agricultural Economic Growth
4.4. Analysis of Carbon Emission Drivers
4.4.1. Decomposition of the Driving Factors of Carbon Emission Based on the Overall Sample
- (1)
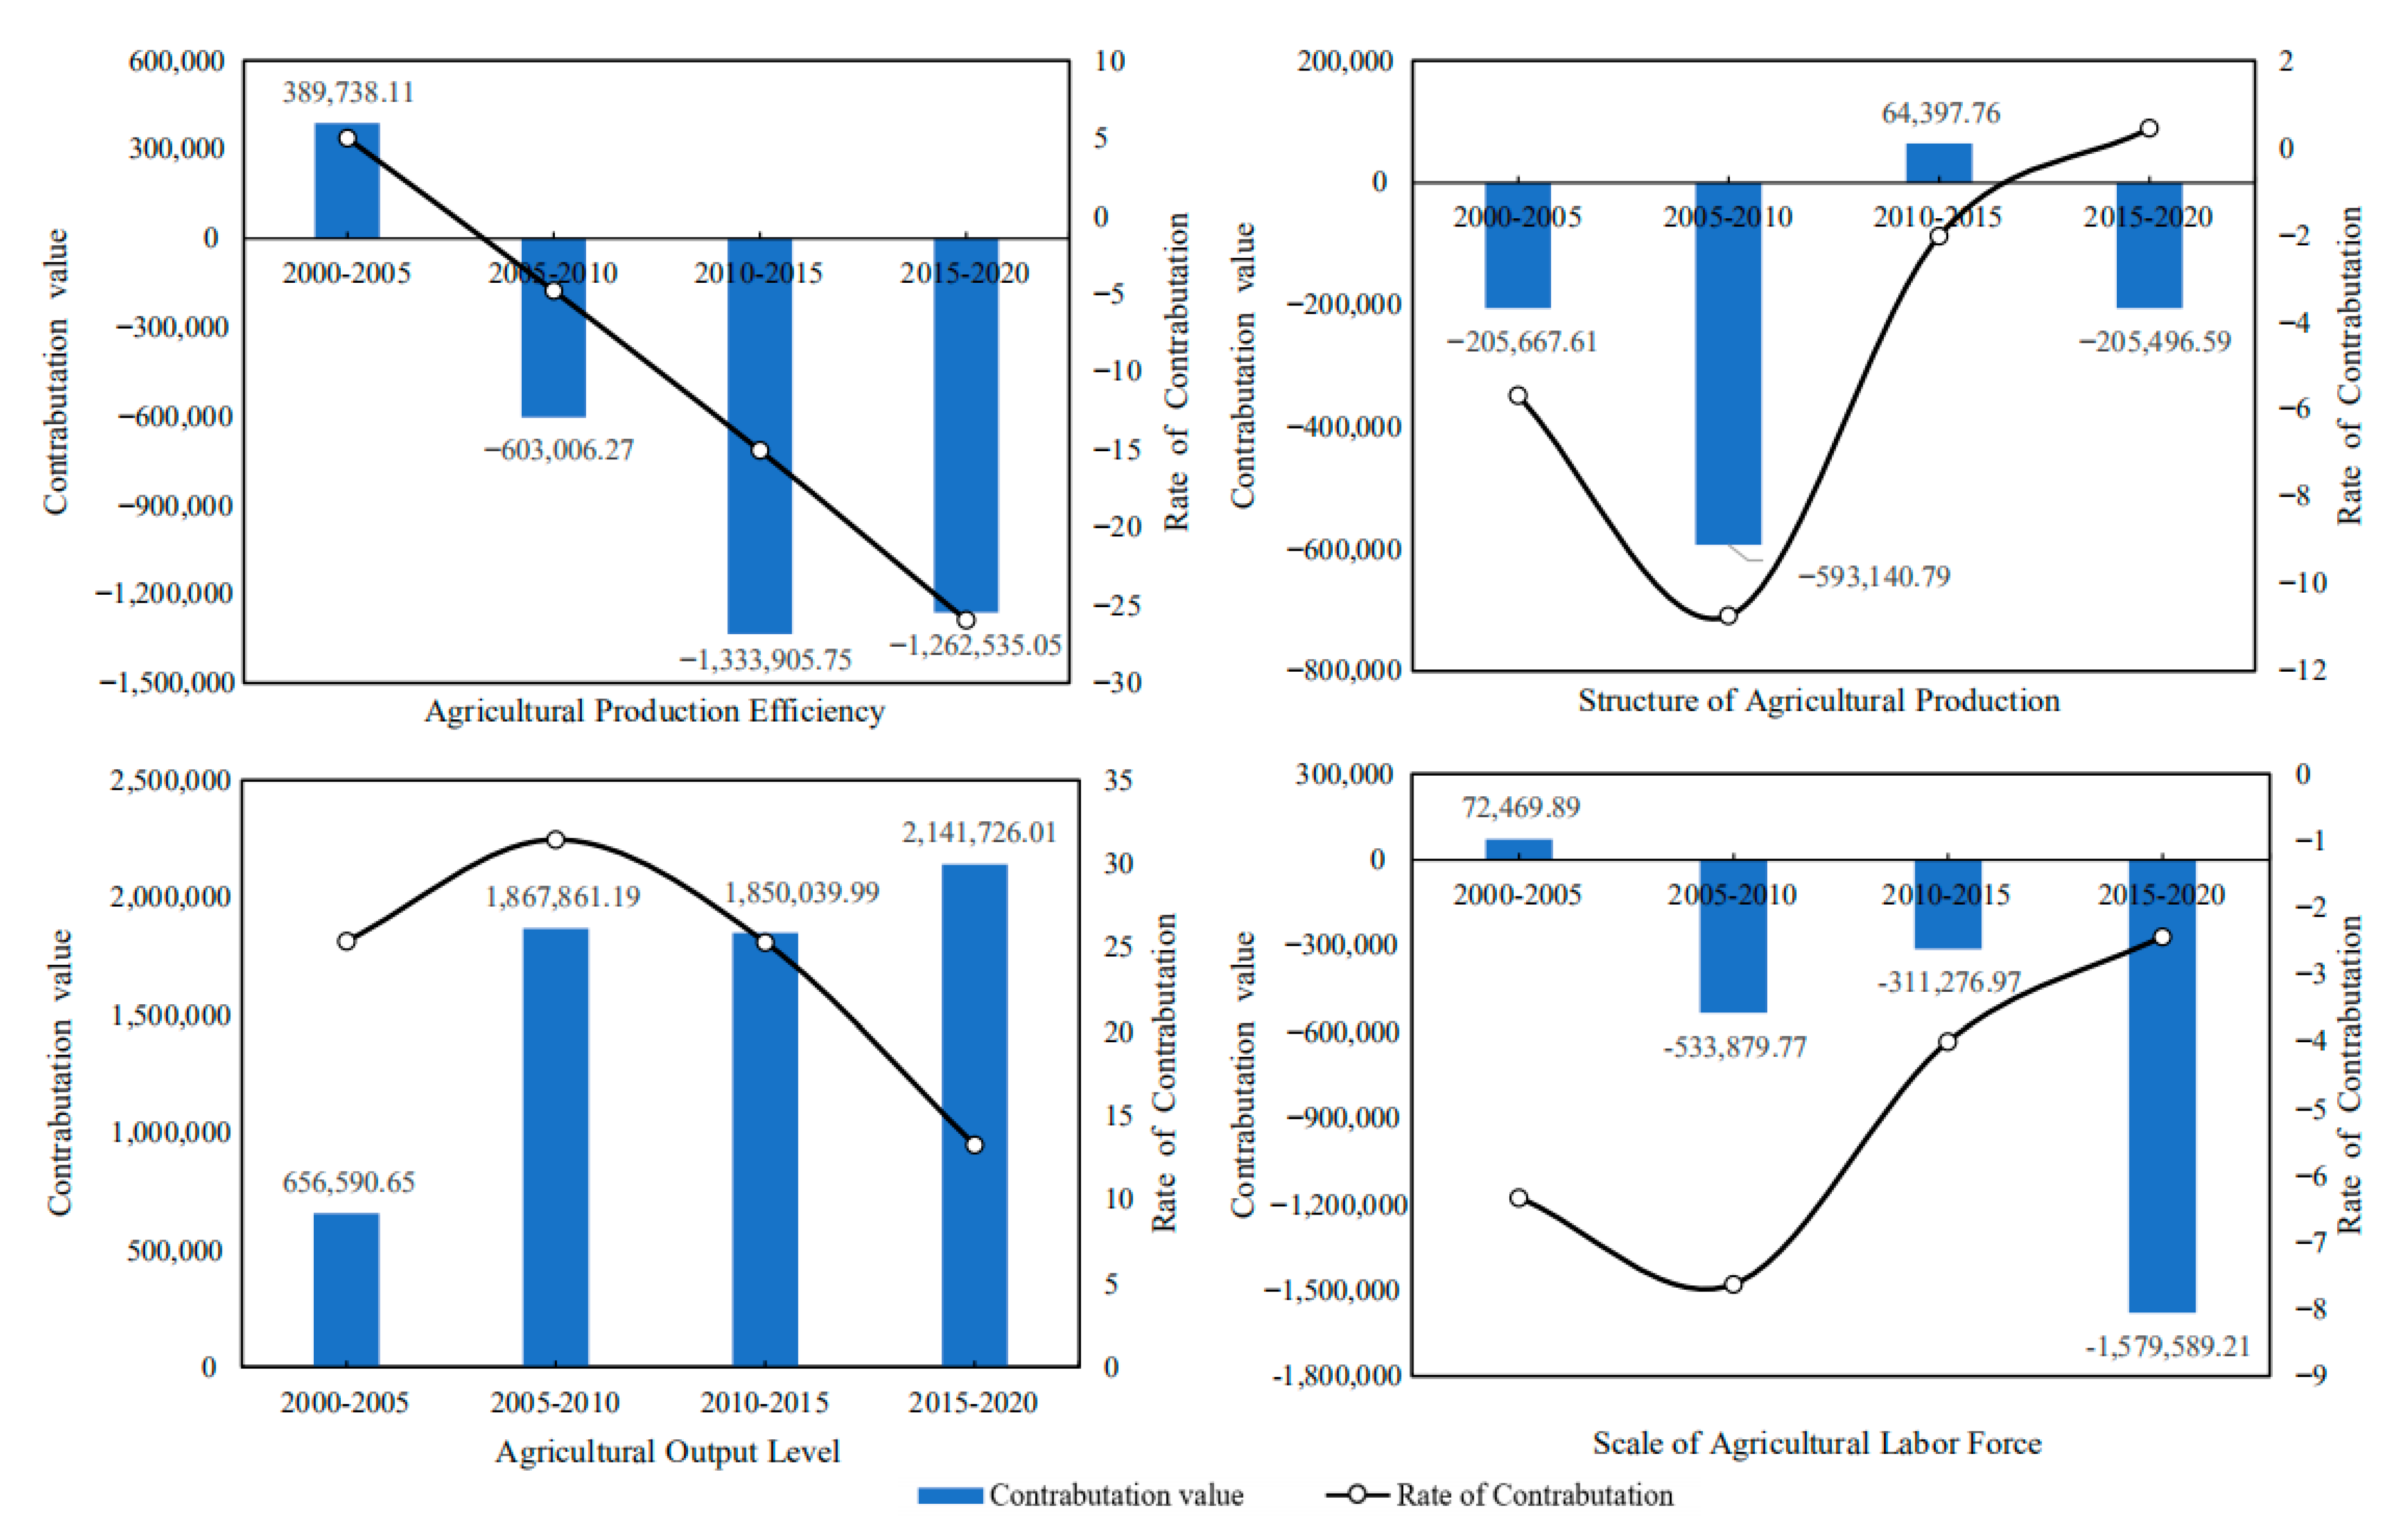
- Agricultural production efficiency is the main driving factor for the reduction in carbon emissions from cultivated land utilization in Hubei Province. From 2000 to 2020, the cumulative carbon emission reduction effect of agricultural production efficiency factors should reach 2.8097 million tons, with an average annual carbon emission reduction effect of approximately −702,400 tons. The contribution rate of carbon emission reduction is generally high and rising, indicating that the inhibitory effect of agricultural production efficiency on carbon emissions is increasing. It can be seen that, in the past two decades, the improvement of agricultural production efficiency has restrained the growth of planting carbon emissions in Hubei Province to a certain extent. Improving agricultural production efficiency will become an important measure to promote the low-carbon planting industry in Hubei Province.
- (2)
- The agricultural production structure (the ratio of the total output value of planting industry to the total output value of agriculture, forestry, animal husbandry and fishery) is an important driving factor for the reduction in carbon emissions from planting industry in Hubei Province. From 2000 to 2020, the cumulative carbon emission reduction effect of agricultural production structure factors reached 939,900 tons, with an average annual carbon emission reduction effect of approximately −235,000 tons. The contribution rate of carbon emission reduction is low on the whole, and gradually shows a weakening trend. On the whole, the effect of a carbon emission increase is not obvious. This may be because the urbanization process in Hubei Province accelerated from 2000 to 2010, and a large number of rural residents transferred to cities, resulting in the reduction in rural cultivated land, and even the abandonment of cultivated land in some areas. From 2010 to 2020, in order to ensure grain production and national food security, and at the same time, thanks to the reform of rural land property rights system and the large-scale management of land brought about by land circulation, the production scale of a planting industry in Hubei province gradually expanded. It can be seen that it is increasingly difficult to reduce carbon emissions from farming by significantly adjusting the structure of agricultural production.
- (3)
- The level of agricultural output is the main driving factor for the increase in carbon emissions from planting in Hubei Province. From 2000 to 2020, the cumulative carbon emission increase effect of agricultural output level factors reached 6.5162 million tons, with an average annual carbon emission increase effect of approximately 1.6291 million tons. The contribution rate of the carbon emission increase is on the high side as a whole. The increasing effect of agricultural output on carbon emissions is increasing from 2001 to 2010, but it tends to weaken after 2010. This may be because the improvement of the agricultural output level depends more on Agricultural Chemistry and agricultural mechanization, that is, it depends on a large number of inputs of high-carbon materials such as chemical fertilizers, agricultural films, pesticides, diesel oil, etc., which leads to the high carbon emissions of planting industry. However, under the guidance of agricultural green development, the carbon emission increase effect of the agricultural output level is gradually weakening.
- (4)
- The scale of the agricultural labor force is one of the important driving factors for the reduction in carbon emissions from planting in Hubei Province. From 2005 to 2020, the cumulative carbon emission reduction effect of agricultural labor scale factor was approximately 2.3523 million tons, and the average annual carbon emission reduction effect was approximately 588,100 tons. The contribution rate of carbon emission reduction is generally high, but it is in a fluctuating trend of rising first and then declining. This may be because, with the promotion of urbanization and the progress of agricultural production technology, the rural labor surplus in Hubei Province is gradually transferred to the non-agricultural part, and the number of labors engaged in agriculture is gradually reduced, but the speed of non-agricultural labor is gradually slowing down. It can be seen that, although agricultural technological progress can partially replace labor, the dependence of a planting industry on labor still exists under the influence of a small-scale peasant economy and family farming methods.
4.4.2. Decomposition of Carbon Emission Driving Factors of Cultivated Land Resource Utilization in Hubei Province Based on Terrain
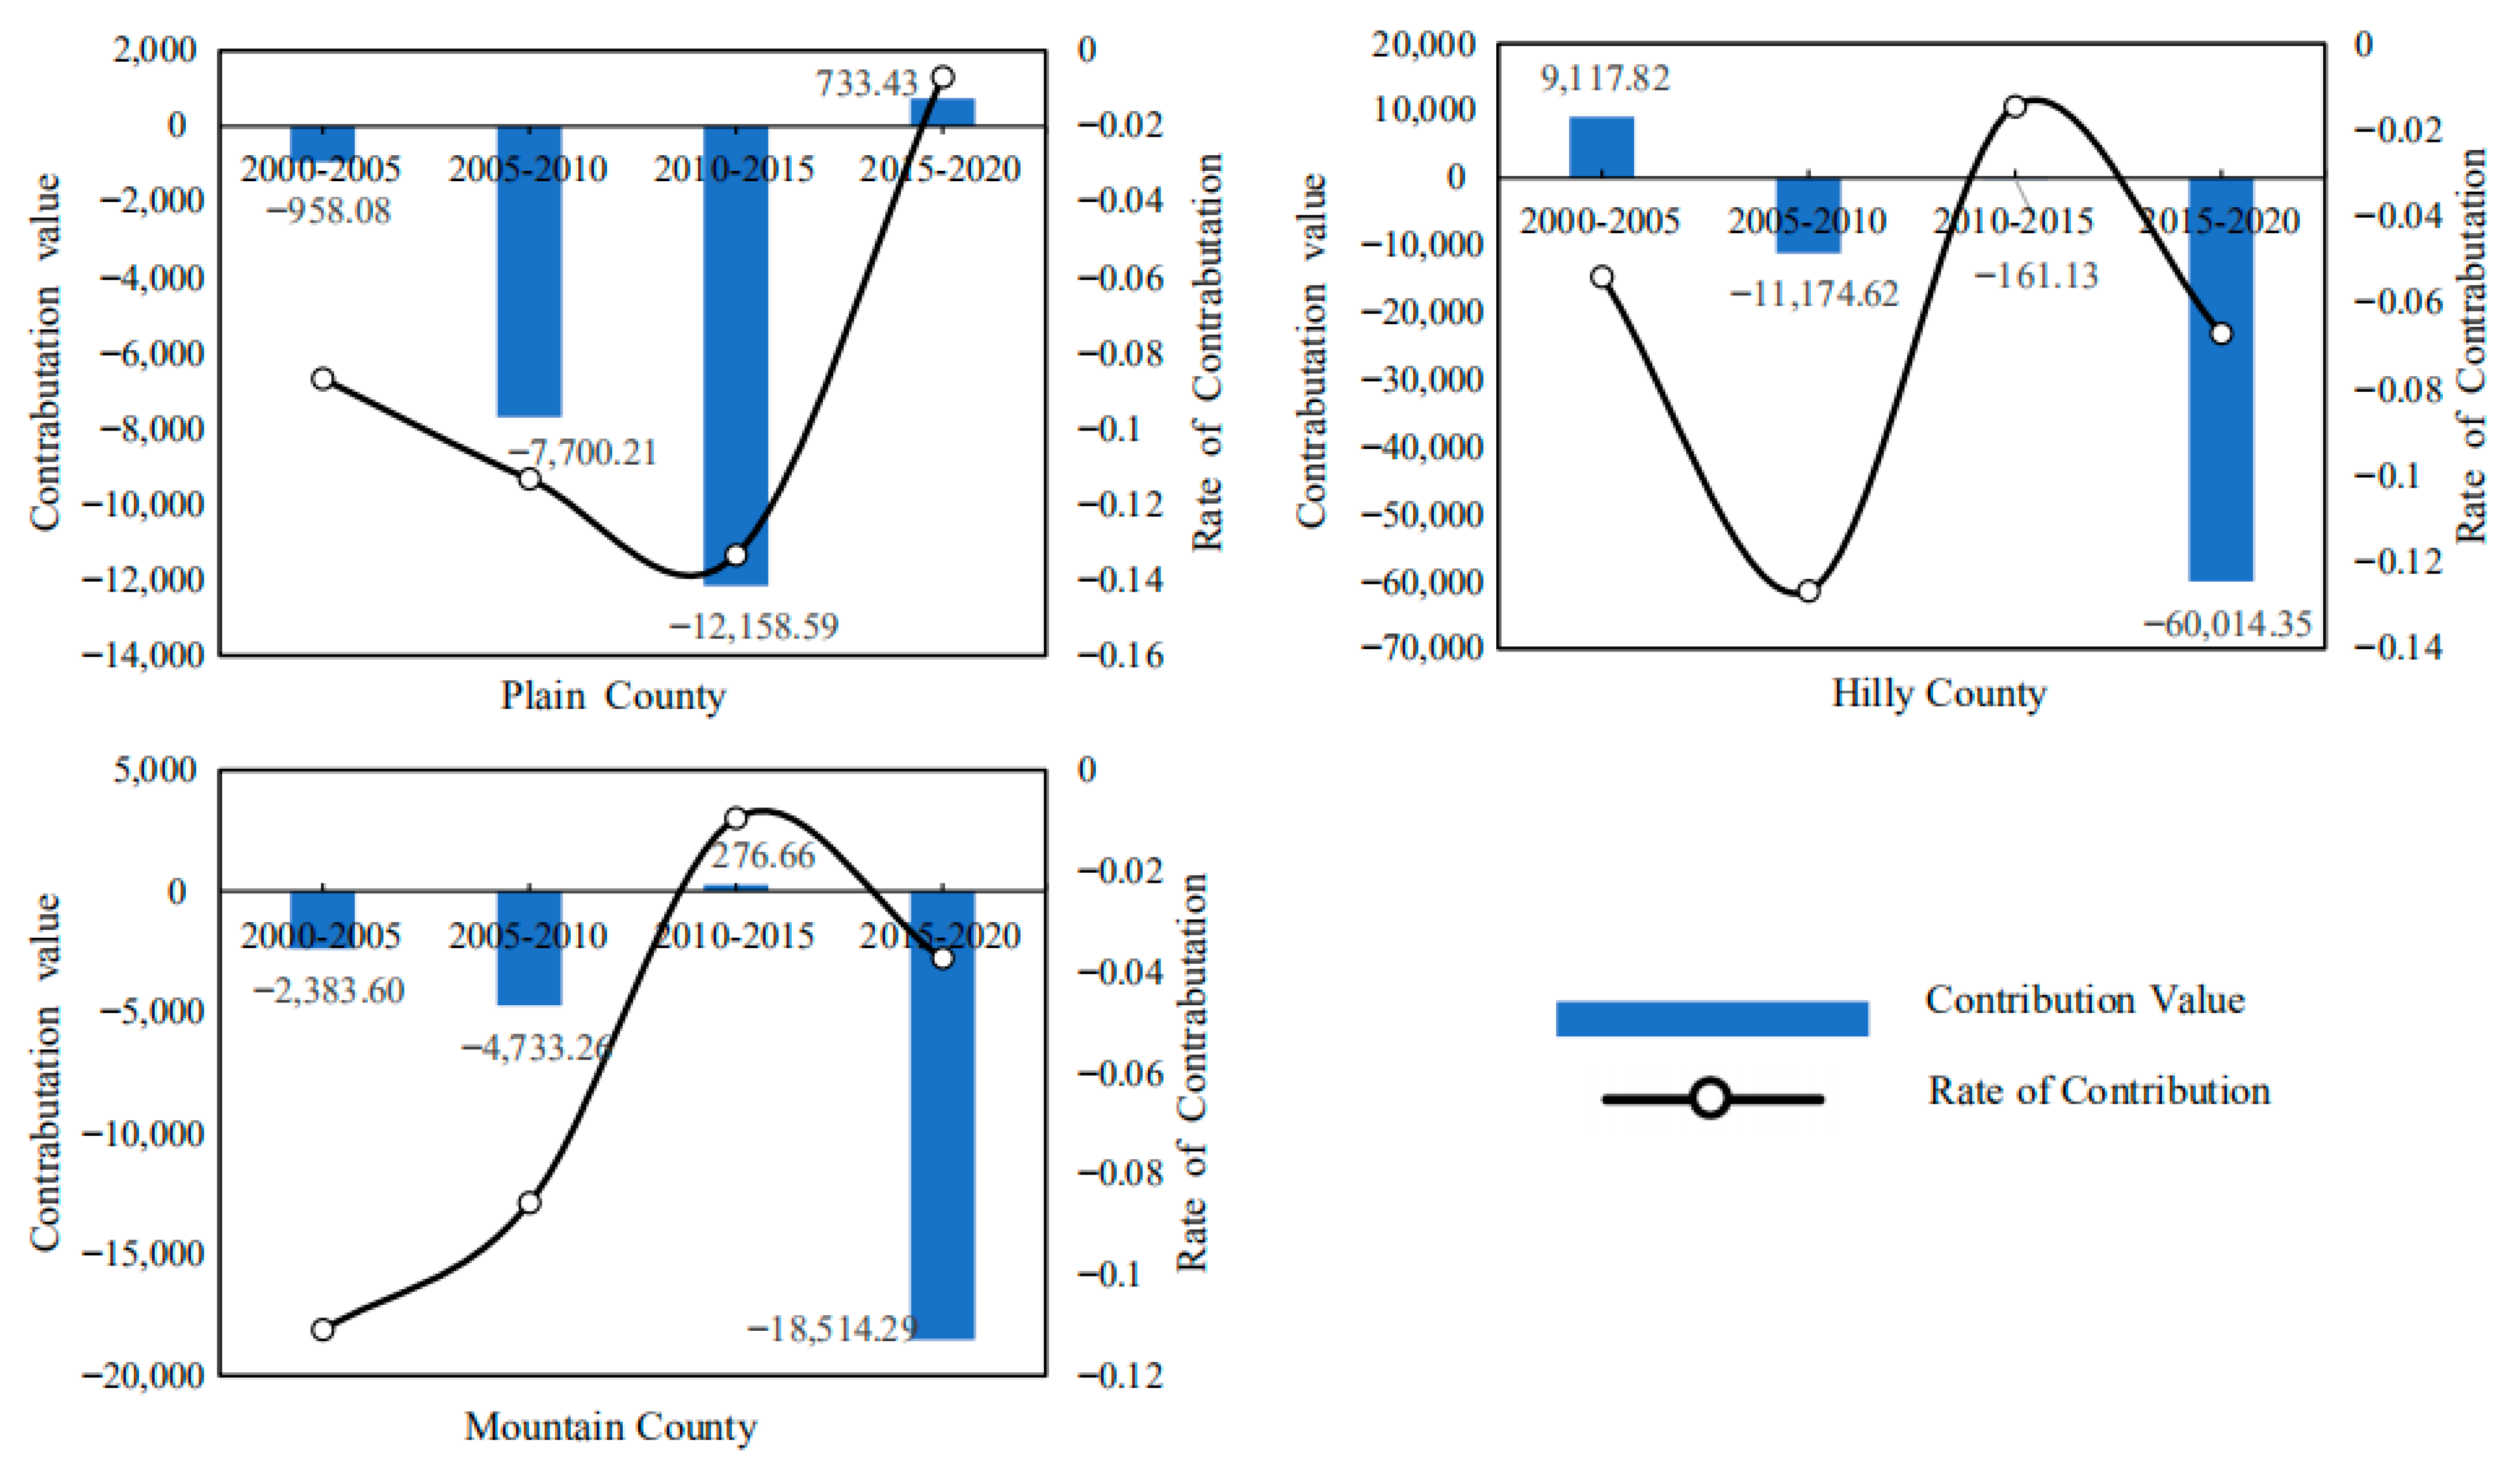
- (1)
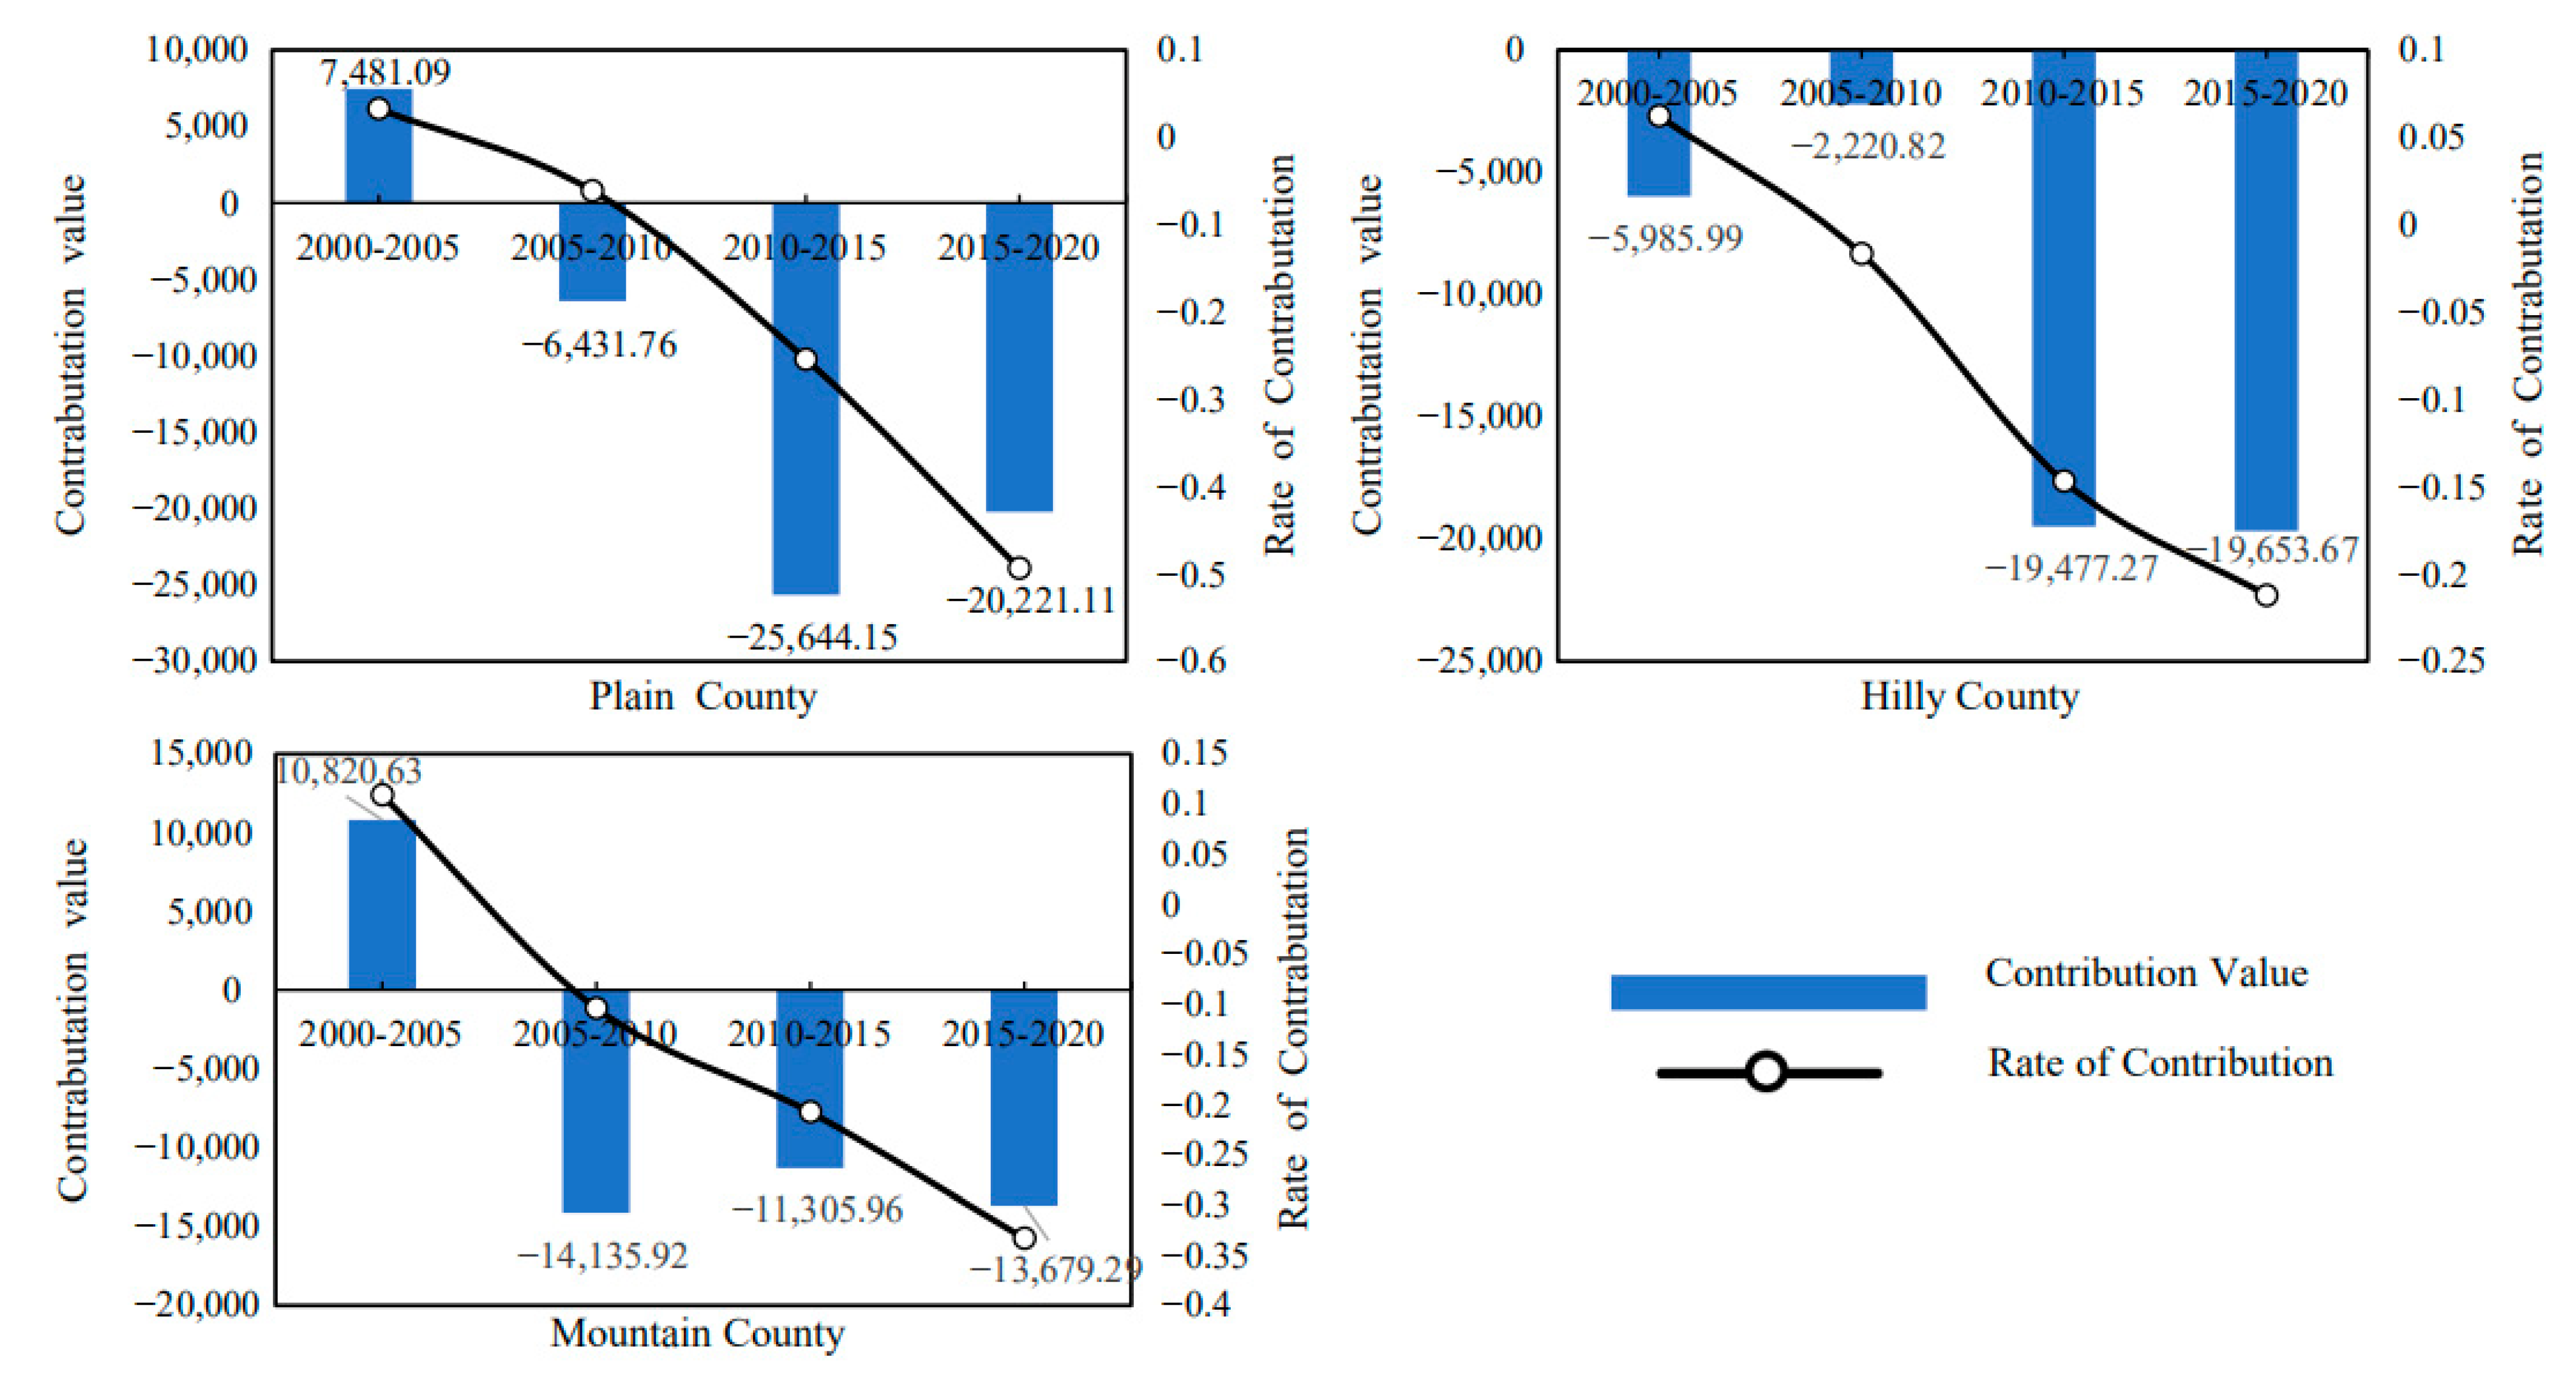
- From the emission reduction effect of agricultural production efficiency, as shown in Figure 11, the cumulative carbon emission reduction in agricultural production efficiency factors in the plain area averaged 44,800 tons from 2000 to 2020. The cumulative carbon emission reduction in agricultural production efficiency factors in hilly areas is 47,300 tons on average. The cumulative carbon emission reduction in agricultural production efficiency factors in mountainous areas averages 28,300 tons. This shows that the emission reduction effect of agricultural production efficiency in plain and hilly areas is strong, while the carbon emission reduction effect of agricultural production efficiency in mountainous areas is relatively low. The possible reason is that the plain and hilly areas are conducive to the promotion and application of modern mechanized production, and the maturity of large-scale planting is higher, so the agricultural production efficiency is higher, while the carbon emission reduction effect of the agricultural production efficiency in mountain areas is limited and weakened due to the existence of topographic barriers. At the same time, it can be seen from the change of contribution rate curve that with the continuous development of modern agriculture, the carbon emission reduction effect brought by agricultural production efficiency factors is gradually increasing.
- (2)
- From the perspective of the emission reduction effect of agricultural production structural factors, as shown in Figure 12, the cumulative carbon emission reduction in agricultural production structural factors in the plain area averaged approximately 17,900 tons from 2000 to 2020. The cumulative carbon emission reduction in agricultural production structure factors in hilly areas is approximately 19,300 tons on average. The cumulative carbon emission reduction in agricultural production structure factors in mountainous areas is approximately 4500 tons on average. The results show that the emission reduction effect of agricultural production structure factors in plain and hilly areas is greater. This may be because the planting industry in plain and hilly areas is large-scale, so its carbon emissions are significantly higher than those in mountain areas. At the same time, it can be seen from the change of the contribution rate curve that with the continuous advancement of agricultural modernization, the carbon emission reduction effect caused by the structural factors of agricultural production is gradually weakening.
- (3)
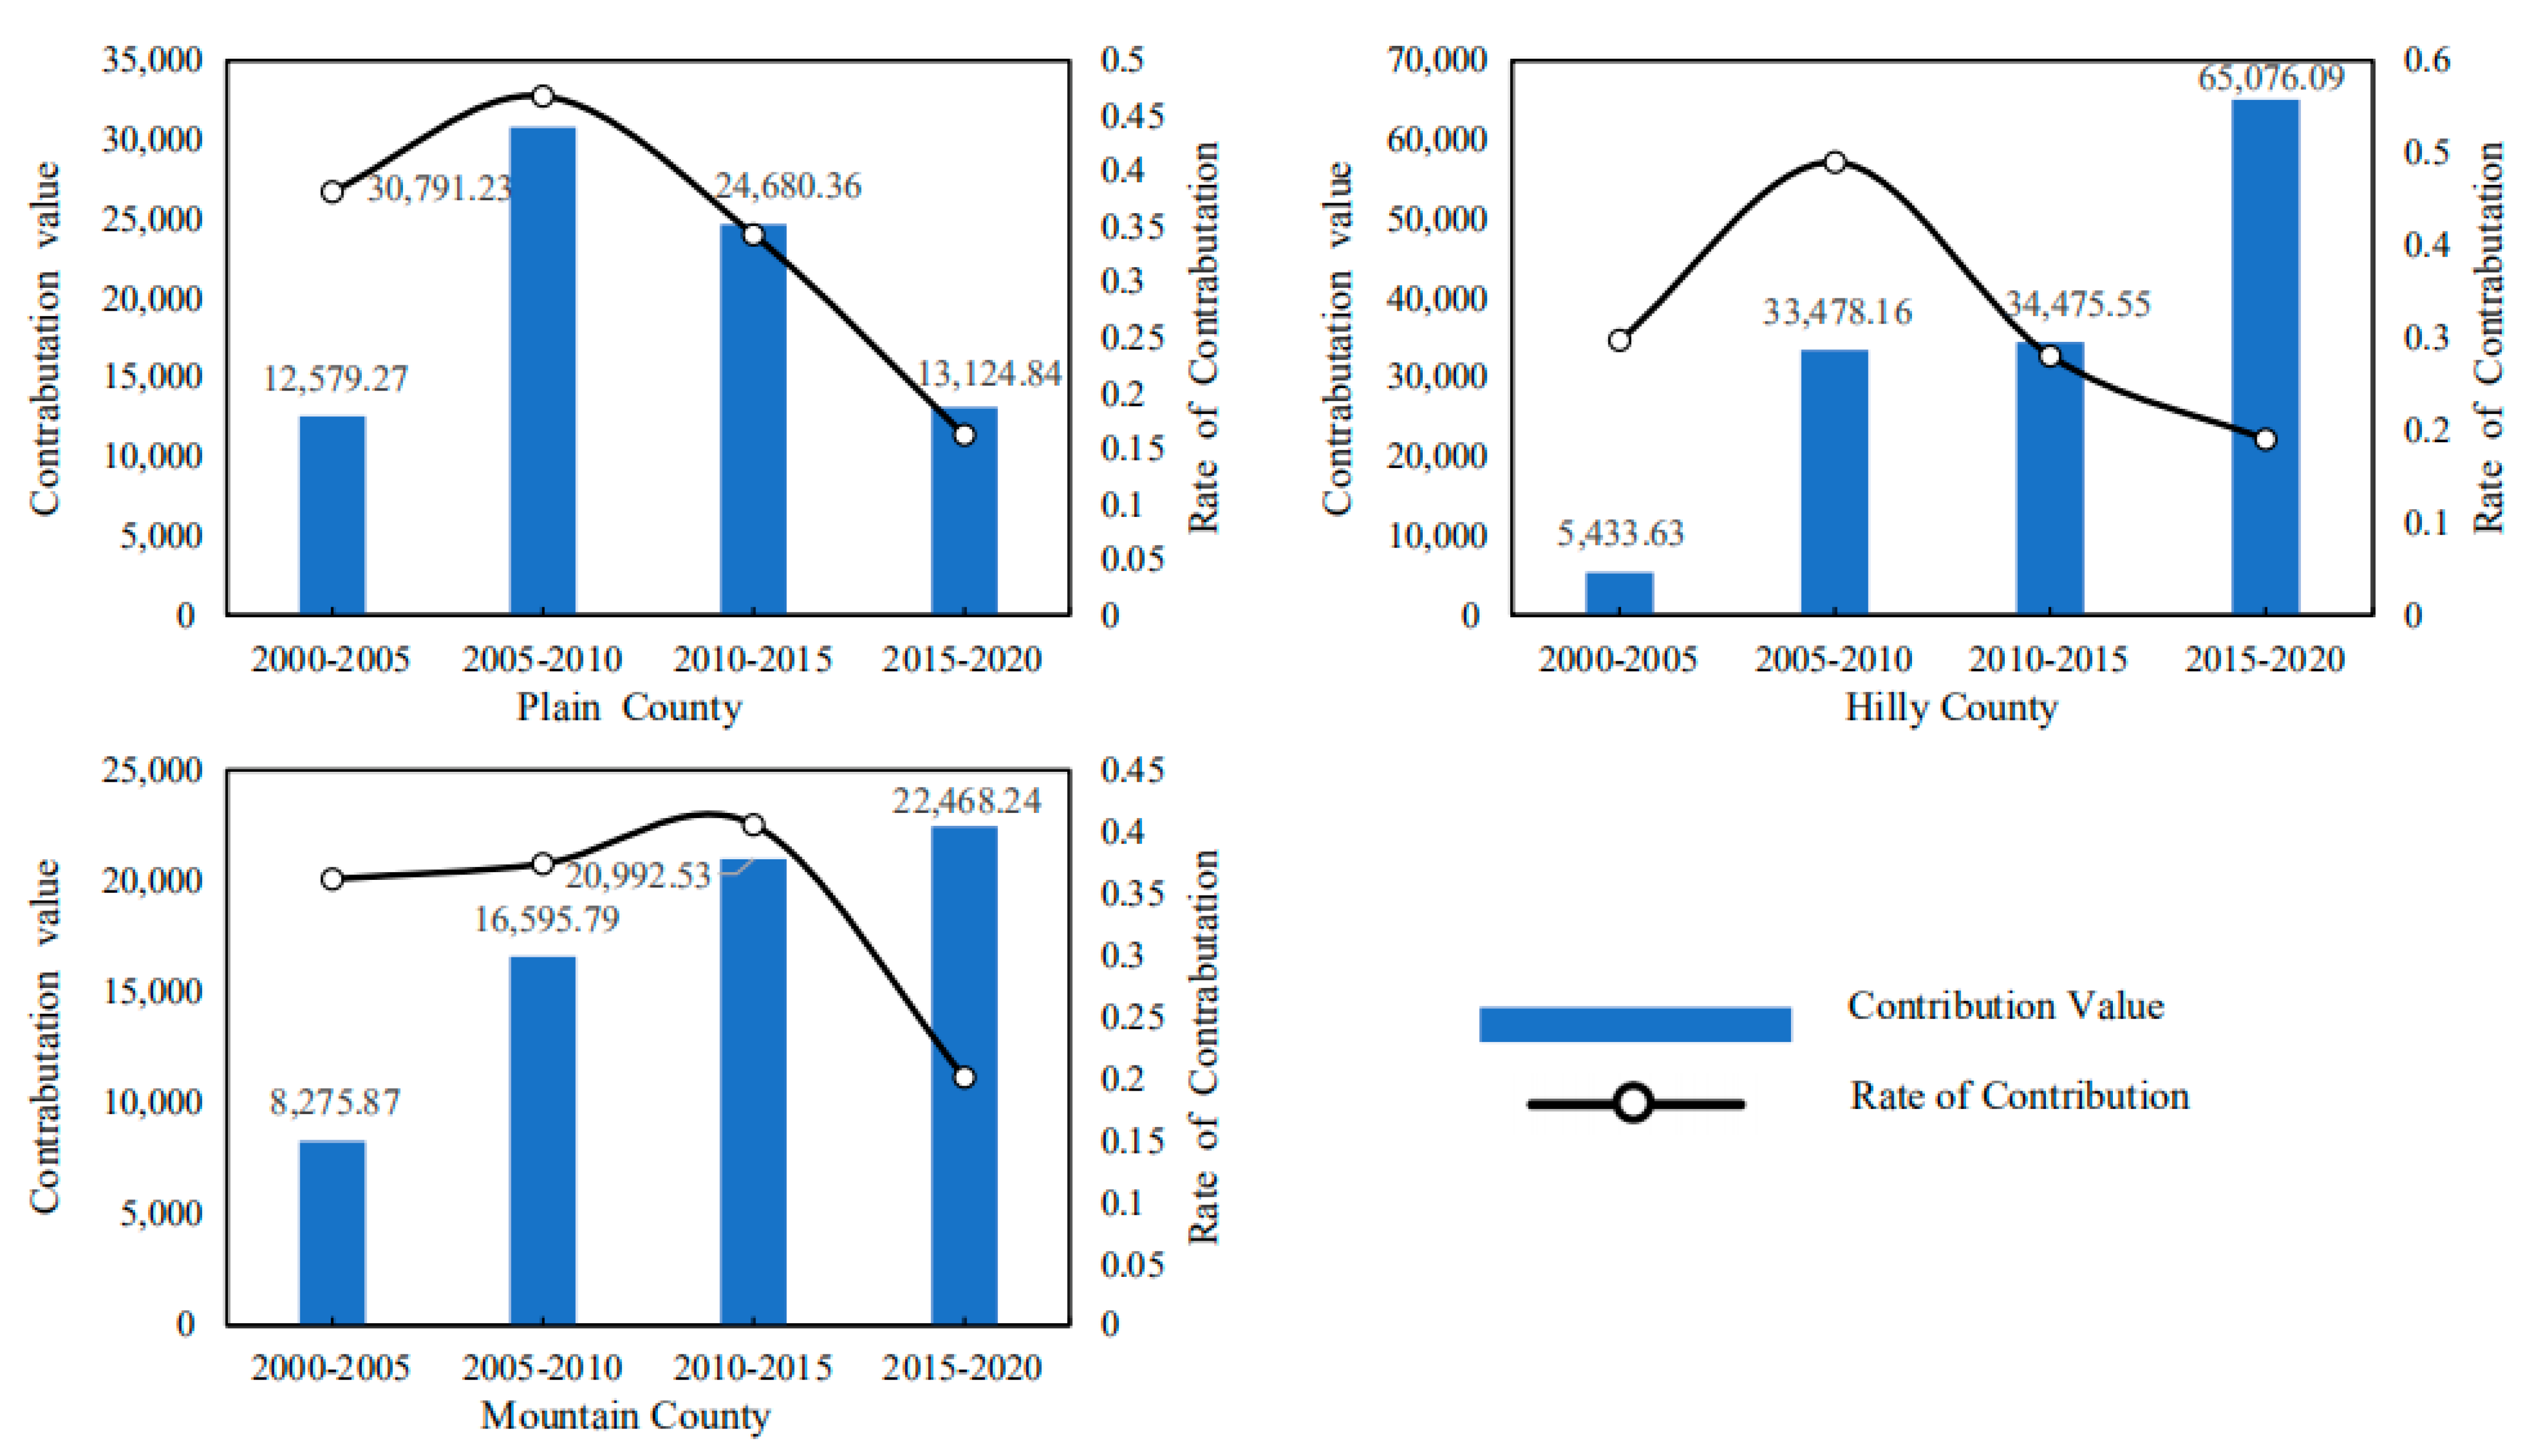
- From the perspective of the increase in and emission effect of agricultural output level factors, as shown in Figure 13, the cumulative carbon increase in and emission of agricultural output level factors in the plain area averaged 81,200 tons from 2000 to 2020. The cumulative carbon emission increase in agricultural output level factors in hilly areas averaged 138,500 tons. The cumulative carbon emission increase in agricultural output level factors in mountainous areas is 68,300 tons on average. The above results show that the carbon emission increase effect brought by the agricultural output level in hilly areas is the strongest, which is significantly higher than that in plain and mountain areas. This may be because the hilly areas bear an important share of agricultural output, coupled with the relatively high level of agricultural labor input, which leads to a higher level of carbon emissions. However, it can be seen from the change of the contribution rate curve that the carbon emission increase effect caused by the level of agricultural output is gradually weakening.
- (4)
- From the perspective of the emission reduction effect of the agricultural labor scale, as shown in Figure 14, the cumulative carbon emission reduction in agricultural labor scale factors in the plain area averaged 20,000 tons from 2000 to 2020. The cumulative carbon emission reduction in agricultural labor scale factors in hilly areas is approximately 62,200 tons on average. The cumulative carbon emission reduction in agricultural labor scale factors in mountainous areas is approximately 25,400 tons on average. The results show that the emission reduction effect of the agricultural labor force scale factor in the plain area is smaller. This may be related to the population and natural factors in the plain area. The agricultural production conditions in Jianghan Plain are good, the population is concentrated, and the agricultural production is dominated by small farmers. Farmers have a strong “cherish land” complex, and the per capita cultivated land is small, which is difficult to form the scale effect of cultivated land. At the same time, plain areas have convenient transportation and developed non-agricultural industries, so compared with mountainous and hilly areas, farmers in plain areas have a higher degree of part-time industrialization. It can be seen that Jianghan Plain should continue to accelerate the transfer of rural surplus labor, promote the large-scale management of agricultural land and then enhance the carbon emission reduction effect caused by the reduction in the scale of agricultural labor.
5. Discussion
5.1. Deficiency and Prospect
5.2. Policy Enlightenment
6. Conclusions
Author Contributions
Funding
Institutional Review Board Statement
Informed Consent Statement
Data Availability Statement
Conflicts of Interest
Appendix A

| County | Ambient Pressure (ΔC/C) | Economic Growth (ΔG/G) | Decoupling Elasticity (e) | Decoupling Feature |
|---|---|---|---|---|
| Wuhan municipal District | −0.0843 | −0.0122 | 6.9378 | Recessive decoupling |
| Caidian District | 0.0927 | 0.2049 | 0.4525 | Weak decoupling |
| Jiangxia District | 0.1036 | 0.1795 | 0.5771 | Weak decoupling |
| Huangpi District | 0.1372 | 0.0708 | 1.9384 | Expansion negative decoupling |
| Xinzhou District | 0.1158 | 0.0682 | 1.6975 | Expansion negative decoupling |
| Shiyan City | 0.2417 | 0.2655 | 0.9105 | Growth connection |
| Huangshi municipal District | 0.2807 | 0.2962 | 0.9478 | Growth connection |
| Daye City | 0.176 | 0.2881 | 0.6111 | Weak decoupling |
| Yangxin County | 0.1397 | 0.2946 | 0.474 | Weak decoupling |
| Jingzhou municipal District | −0.0547 | 0.1058 | −0.5166 | Strong decoupling |
| Jiangling County | 0.0572 | −0.0344 | −1.6598 | Strong negative decoupling |
| Songzi City | 0.0553 | 0.018 | 3.063 | Expansion negative decoupling |
| Gongan County | 0.0404 | 0.1419 | 0.2846 | Weak decoupling |
| Cityshou City | 0.1353 | −0.0684 | −1.978 | Strong negative decoupling |
| Jianli County | −0.102 | −0.2141 | 0.4764 | Weak negative decoupling |
| Honghu City | 0.7047 | −0.2965 | −2.3769 | Strong negative decoupling |
| Yichang municipal District | 0.8528 | 0.335 | 2.5455 | Expansion negative decoupling |
| Yidu City | 0.8664 | 0.0538 | 16.0957 | Expansion negative decoupling |
| Zhijiang City | 0.798 | 0.1518 | 5.2566 | Expansion negative decoupling |
| Dangyang City | 0.1526 | 0.1312 | 1.1628 | Growth connection |
| Yuanan County | 0.782 | 0.2826 | 2.7669 | Expansion negative decoupling |
| Xingshan County | 0.8593 | 0.0921 | 9.3303 | Expansion negative decoupling |
| Zigui County | 0.7131 | 0.0836 | 8.5326 | Expansion negative decoupling |
| Changyang County | 0.7081 | 0.2037 | 3.4763 | Expansion negative decoupling |
| Wufeng County | 0.6954 | 0.1535 | 4.5297 | Expansion negative decoupling |
| Xiangyang municipal District | −0.178 | 0.6338 | −0.2809 | Strong decoupling |
| Laohekou City | 0.2856 | −0.0494 | −5.7786 | Strong negative decoupling |
| Zaoyang City | 0.1109 | 0.0072 | 15.4605 | Expansion negative decoupling |
| Yicheng City | 0.0376 | −0.1562 | −0.2403 | Strong negative decoupling |
| Nanzhang County | 0.2179 | 0.1292 | 1.6863 | Expansion negative decoupling |
| Gucheng County | −1.1319 | 0.0274 | −41.3235 | Strong decoupling |
| Baokang County | 0.2633 | 0.258 | 1.0205 | Growth connection |
| Ezhou City | 0.6816 | 0.2498 | 2.7283 | Expansion negative decoupling |
| Jingmen municipal District | 0.4612 | 0.2631 | 1.7531 | Expansion negative decoupling |
| Shayang County | −0.0154 | 0.0139 | −1.108 | Strong decoupling |
| Zhongxiang City | 0.4044 | 0.0178 | 22.6867 | Expansion negative decoupling |
| Jingshan County | 0.0556 | 0.0225 | 2.4736 | Expansion negative decoupling |
| Xiaogan municipal District | −0.2162 | 0.0689 | −3.1391 | Strong decoupling |
| Xiaochang County | −0.0146 | −0.0028 | 5.2694 | Recessive decoupling |
| Dawu County | 0.0165 | 0.1569 | 0.1051 | Weak decoupling |
| Anlu City | 0.2503 | −0.0081 | −30.7713 | Strong negative decoupling |
| Yunmeng County | 0.0029 | 0.1843 | 0.0156 | Weak decoupling |
| Yingcheng City | 0.0084 | 0.1395 | 0.0601 | Weak decoupling |
| Hanchuan City | 0.041 | 0.1016 | 0.4036 | Weak decoupling |
| Huanggang municipal District | 0.1412 | 0.1051 | 1.3432 | Expansion negative decoupling |
| Tuanfeng County | −0.0906 | −0.1785 | 0.5074 | Weak negative decoupling |
| Hongan County | 0.7769 | 0.0527 | 14.7423 | Expansion negative decoupling |
| Macheng City | −0.3949 | 0.2135 | −1.8496 | Strong decoupling |
| Luotian County | 0.1073 | 0.1366 | 0.7851 | Weak decoupling |
| Yingshan County | 0.0202 | 0.0701 | 0.2883 | Weak decoupling |
| Xishui County | 0.0161 | 0.1798 | 0.0896 | Weak decoupling |
| Qichun County | −0.0151 | −0.0197 | 0.7671 | Weak negative decoupling |
| Wuxue City | −0.117 | 0.1717 | −0.6813 | Strong decoupling |
| Huangmei County | −0.1906 | 0.2322 | −0.8209 | Strong decoupling |
| Xianan District | 0.0277 | 0.1394 | 0.199 | Weak decoupling |
| Jiayu County | 0.2498 | 0.3809 | 0.6558 | Weak decoupling |
| Chibi City | −0.0218 | 0.1784 | −0.1223 | Strong decoupling |
| Tongcheng County | 0.0899 | 0.1927 | 0.4664 | Weak decoupling |
| Chongyang County | 0.1118 | 0.1739 | 0.6429 | Weak decoupling |
| Tongshan County | 0.1211 | 0.087 | 1.3929 | Expansion negative decoupling |
| Zengdu District | 0.3827 | 0.4723 | 0.8103 | Growth connection |
| Enshi City | 0.1643 | 0.232 | 0.7085 | Weak decoupling |
| Lichuan City | 0.4818 | 0.1692 | 2.8483 | Expansion negative decoupling |
| Jianshi County | 0.1698 | 0.1306 | 1.3005 | Expansion negative decoupling |
| Badong County | −0.1239 | 0.2219 | −0.5585 | Strong decoupling |
| Xuanen County | 0.1575 | 0.1823 | 0.864 | Growth connection |
| Xianfeng County | −0.0557 | 0.1745 | −0.3191 | Strong decoupling |
| Laifeng County | −0.1222 | 0.1706 | −0.7164 | Strong decoupling |
| Hefeng County | −0.0102 | 0.0728 | −0.1394 | Strong decoupling |
| Xiantao City | −0.1084 | −0.1137 | 0.9535 | Decay connection |
| Tianmen City | 0.0899 | 0.1303 | 0.6898 | Weak decoupling |
| Qianjiang City | 0.1524 | 0.0318 | 4.7877 | Expansion negative decoupling |
Appendix B
| County | Ambient Pressure (ΔC/C) | Economic Growth (ΔG/G) | Decoupling Elasticity (e) | Decoupling Feature |
|---|---|---|---|---|
| Wuhan municipal District | −0.1526 | 0.0886 | −1.7229 | Strong decoupling |
| Caidian District | −0.0283 | 0.151 | −0.1873 | Strong decoupling |
| Jiangxia District | −0.1502 | 0.1435 | −1.0465 | Strong decoupling |
| Huangpi District | 0.2876 | 0.2273 | 1.2653 | Expansion negative decoupling |
| Xinzhou District | 0.0386 | 0.0344 | 1.1214 | Growth connection |
| Shiyan City | 0.143 | 0.2889 | 0.4949 | Weak decoupling |
| Huangshi municipal District | −0.7571 | −0.409 | 1.8513 | Recessive decoupling |
| Daye City | 0.1453 | −0.0378 | −3.8467 | Strong negative decoupling |
| Yangxin County | 0.2463 | 0.0764 | 3.2218 | Expansion negative decoupling |
| Jingzhou municipal District | 0.3658 | 0.2553 | 1.4328 | Expansion negative decoupling |
| Jiangling County | 0.2508 | 0.1082 | 2.3174 | Expansion negative decoupling |
| Songzi City | 0.0673 | 0.1477 | 0.4557 | Weak decoupling |
| Gongan County | 0.2193 | 0.2054 | 1.0679 | Growth connection |
| Cityshou City | 0.1534 | 0.1775 | 0.8641 | Growth connection |
| Jianli County | 0.2507 | 0.328 | 0.7645 | Weak decoupling |
| Honghu City | 0.1799 | 0.2413 | 0.7456 | Weak decoupling |
| Yichang municipal District | −1.3372 | 0.1826 | −7.3229 | Strong decoupling |
| Yidu City | −4.2845 | 0.43 | −9.9642 | Strong decoupling |
| Zhijiang City | −1.9146 | 0.2948 | −6.4937 | Strong decoupling |
| Dangyang City | 0.0986 | 0.3209 | 0.3071 | Weak decoupling |
| Yuanan County | −3.0973 | 0.2628 | −11.7879 | Strong decoupling |
| Xingshan County | −5.7343 | 0.3004 | −19.0873 | Strong decoupling |
| Zigui County | −0.7954 | 0.2751 | −2.8911 | Strong decoupling |
| Changyang County | −1.1123 | 0.1516 | −7.3352 | Strong decoupling |
| Wufeng County | −0.6602 | 0.3317 | −1.9906 | Strong decoupling |
| Xiangyang municipal District | 0.0926 | 0.2386 | 0.3882 | Weak decoupling |
| Laohekou City | −0.1962 | 0.0384 | −5.1067 | Strong decoupling |
| Zaoyang City | 0.0985 | 0.0855 | 1.1519 | Growth connection |
| Yicheng City | 0.228 | 0.1071 | 2.1279 | Expansion negative decoupling |
| Nanzhang County | 0.1999 | 0.2952 | 0.6771 | Weak decoupling |
| Gucheng County | 0.5189 | −0.0896 | −5.7923 | Strong negative decoupling |
| Baokang County | 0.3032 | 0.2274 | 1.3333 | Expansion negative decoupling |
| Ezhou City | 0.0325 | 0.2083 | 0.156 | Weak decoupling |
| Jingmen municipal District | −0.0409 | 0.0543 | −0.7528 | Strong decoupling |
| Shayang County | 0.1139 | 0.1724 | 0.6606 | Weak decoupling |
| Zhongxiang City | −0.0647 | 0.1175 | −0.5504 | Strong decoupling |
| Jingshan County | 0.2235 | 0.1334 | 1.6752 | Expansion negative decoupling |
| Xiaogan municipal District | 0.438 | 0.1988 | 2.2039 | Expansion negative decoupling |
| Xiaochang County | 0.4383 | 0.1644 | 2.6662 | Expansion negative decoupling |
| Dawu County | 0.1154 | 0.2335 | 0.4943 | Weak decoupling |
| Anlu City | 0.1047 | 0.09 | 1.1633 | Growth connection |
| Yunmeng County | 0.0296 | 0.1664 | 0.1777 | Weak decoupling |
| Yingcheng City | −0.0341 | 0.0546 | −0.6246 | Strong decoupling |
| Hanchuan City | 0.082 | 0.1331 | 0.6161 | Weak decoupling |
| Huanggang municipal District | 0.1913 | 0.3011 | 0.6353 | Weak decoupling |
| Tuanfeng County | 0.335 | 0.1731 | 1.935 | Expansion negative decoupling |
| Hongan County | −0.0788 | 0.1302 | −0.6051 | Strong decoupling |
| Macheng City | 0.1783 | 0.1685 | 1.058 | Growth connection |
| Luotian County | 0.2663 | 0.2687 | 0.9908 | Growth connection |
| Yingshan County | −0.2629 | 0.4381 | −0.6 | Strong decoupling |
| Xishui County | 0.1909 | 0.1543 | 1.2372 | Expansion negative decoupling |
| Qichun County | 0.154 | 0.3338 | 0.4615 | Weak decoupling |
| Wuxue City | 0.3518 | 0.1764 | 1.9947 | Expansion negative decoupling |
| Huangmei County | 0.3459 | −0.0025 | −140.1991 | Strong negative decoupling |
| Xianan District | 0.1196 | 0.1053 | 1.1363 | Growth connection |
| Jiayu County | 0.0752 | 0.1488 | 0.5052 | Weak decoupling |
| Chibi City | 0.105 | 0.0688 | 1.5252 | Expansion negative decoupling |
| Tongcheng County | 0.3166 | 0.1536 | 2.0611 | Expansion negative decoupling |
| Chongyang County | 0.1512 | 0.1473 | 1.0268 | Growth connection |
| Tongshan County | 0.1024 | −0.0254 | −4.0291 | Strong negative decoupling |
| Zengdu District | 0.2182 | 0.1632 | 1.3364 | Expansion negative decoupling |
| Enshi City | 0.0594 | 0.1109 | 0.5357 | Weak decoupling |
| Lichuan City | 0.3783 | 0.525 | 0.7205 | Weak decoupling |
| Jianshi County | −0.2236 | 0.1669 | −1.3392 | Strong decoupling |
| Badong County | 0.042 | −0.5984 | −0.0702 | Strong negative decoupling |
| Xuanen County | 0.2369 | 0.2271 | 1.0431 | Growth connection |
| Xianfeng County | 0.3238 | −0.0323 | −10.0232 | Strong negative decoupling |
| Laifeng County | 0.3037 | 0.0534 | 5.6871 | Expansion negative decoupling |
| Hefeng County | 0.7357 | 0.1659 | 4.4341 | Expansion negative decoupling |
| Xiantao City | 0.0519 | −0.0128 | −4.0425 | Strong negative decoupling |
| Tianmen City | 0.1197 | 0.1326 | 0.9029 | Growth connection |
| Qianjiang City | 0.2067 | 0.1906 | 1.0844 | Growth connection |
Appendix C
| County | Ambient Pressure (ΔC/C) | Economic Growth (ΔG/G) | Decoupling Elasticity (e) | Decoupling Feature |
|---|---|---|---|---|
| Wuhan municipal District | −0.5339 | −0.4884 | 1.093 | Decay connection |
| Caidian District | −0.1156 | 0.4699 | −0.2461 | Strong decoupling |
| Jiangxia District | −0.2188 | 0.5378 | −0.4069 | Strong decoupling |
| Huangpi District | −0.4588 | 0.5155 | −0.89 | Strong decoupling |
| Xinzhou District | −0.009 | 0.5385 | −0.0168 | Strong decoupling |
| Shiyan City | 0.2154 | 0.4964 | 0.4339 | Weak decoupling |
| Huangshi municipal District | 0.1226 | 0.414 | 0.2962 | Weak decoupling |
| Daye City | 0.0484 | 0.3872 | 0.1249 | Weak decoupling |
| Yangxin County | 0.1905 | 0.3833 | 0.497 | Weak decoupling |
| Jingzhou municipal District | −0.1842 | 0.188 | −0.9795 | Strong decoupling |
| Gongan County | 0.5958 | 0.6936 | 0.8589 | Growth connection |
| Jianli County | 0.5465 | 0.667 | 0.8193 | Growth connection |
| Jiangling County | −1.0539 | −0.9733 | 1.0828 | Decay connection |
| Cityshou City | 0.1928 | 0.1824 | 1.0568 | Growth connection |
| Honghu City | −0.2386 | −0.509 | 0.4687 | Weak negative decoupling |
| Songzi City | −0.0661 | −0.064 | 1.0316 | Decay connection |
| Yichang municipal District | −0.1232 | 0.1466 | −0.8403 | Strong decoupling |
| Yidu City | −0.4627 | 0.6654 | −0.6953 | Strong decoupling |
| Zhijiang City | 0.6522 | 0.8224 | 0.793 | Weak decoupling |
| Dangyang City | 0.7461 | 0.784 | 0.9517 | Growth connection |
| Yuanan County | −0.9347 | 0.1378 | −6.7813 | Strong decoupling |
| Xingshan County | −7.3048 | −1.6579 | 4.4061 | Recessive decoupling |
| Zigui County | −1.3684 | −0.7351 | 1.8617 | Recessive decoupling |
| Changyang County | 0.6436 | 0.6272 | 1.0261 | Growth connection |
| Wufeng County | 0.6947 | 0.6447 | 1.0776 | Growth connection |
| Xiangyang municipal District | 0.4481 | 0.7732 | 0.5795 | Weak decoupling |
| Nanzhang County | 0.4193 | 0.1933 | 2.1686 | Expansion negative decoupling |
| Gucheng County | −0.4905 | −1.6472 | 0.2978 | Weak negative decoupling |
| Baokang County | −2.5222 | −0.4299 | 5.8669 | Recessive decoupling |
| Laohekou City | −0.2298 | 0.3917 | −0.5866 | Strong decoupling |
| Zaoyang City | 0.6449 | 0.8369 | 0.7706 | Weak decoupling |
| Yicheng City | 0.7069 | 0.731 | 0.967 | Growth connection |
| Ezhou City | −0.2772 | 0.2204 | −1.2576 | Strong decoupling |
| Jingmen municipal District | −0.3529 | 0.139 | −2.5389 | Strong decoupling |
| Shayang County | −0.0847 | 0.1347 | −0.6288 | Strong decoupling |
| Zhongxiang City | 0.2189 | −0.1305 | −1.6772 | Strong negative decoupling |
| Jingshan County | 0.4992 | 0.4239 | 1.1775 | Growth connection |
| Xiaogan municipal District | −0.0562 | 0.1351 | −0.4158 | Strong decoupling |
| Xiaochang County | −0.2041 | 0.4056 | −0.5032 | Strong decoupling |
| Dawu County | 0.1644 | 0.4328 | 0.3799 | Weak decoupling |
| Yunmeng County | −1.3063 | 0.4563 | −2.8625 | Strong decoupling |
| Yingcheng City | 0.4646 | 0.3503 | 1.3263 | Expansion negative decoupling |
| Anlu City | 0.3423 | −0.2159 | −1.5856 | Strong negative decoupling |
| Hanchuan City | −0.0732 | 0.316 | −0.2317 | Strong decoupling |
| Huanggang municipal District | −0.0777 | 0.2818 | −0.2757 | Strong decoupling |
| Tuanfeng County | −0.0613 | 0.2184 | −0.2809 | Strong decoupling |
| Hongan County | 0.0917 | 0.1352 | 0.6781 | Weak decoupling |
| Luotian County | 0.2587 | 0.374 | 0.6918 | Weak decoupling |
| Yingshan County | −0.1416 | 0.2504 | −0.5653 | Strong decoupling |
| Xishui County | 0.2072 | 0.2705 | 0.7658 | Weak decoupling |
| Qichun County | 0.1109 | 0.3681 | 0.3013 | Weak decoupling |
| Huangmei County | −1.1574 | 0.3305 | −3.502 | Strong decoupling |
| Macheng City | −0.0166 | 0.2657 | −0.0624 | Strong decoupling |
| Wuxue City | −0.0302 | 0.2776 | −0.1089 | Strong decoupling |
| Xianan District | −0.0646 | 0.2497 | −0.2588 | Strong decoupling |
| Jiayu County | 0.1772 | 0.4076 | 0.4347 | Weak decoupling |
| Tongcheng County | 0.0936 | −0.0475 | −1.971 | Strong negative decoupling |
| Chongyang County | 0.1918 | 0.4601 | 0.4168 | Weak decoupling |
| Tongshan County | −1.0363 | 0.1024 | −10.1235 | Strong decoupling |
| Chibi City | 0.6122 | 0.8094 | 0.7564 | Weak decoupling |
| Zengdu District | 0.0576 | 0.2438 | 0.2363 | Weak decoupling |
| Enshi City | 0.1106 | 0.086 | 1.2856 | Expansion negative decoupling |
| Lichuan City | −0.1066 | 0.1749 | −0.6099 | Strong decoupling |
| Jianshi County | 0.3877 | 0.083 | 4.6724 | Expansion negative decoupling |
| Badong County | 0.1272 | 0.1767 | 0.72 | Weak decoupling |
| Xuanen County | 0.2747 | 0.2323 | 1.1824 | Growth connection |
| Xianfeng County | 0.3409 | 0.1406 | 2.4252 | Expansion negative decoupling |
| Laifeng County | −0.1985 | 0.2255 | −0.8802 | Strong decoupling |
| Hefeng County | −0.0326 | 0.1907 | −0.171 | Strong decoupling |
| Xiantao City | −0.0389 | 0.2662 | −0.1461 | Strong decoupling |
| Tianmen City | 0.0086 | 0.1957 | 0.0437 | Weak decoupling |
| Qianjiang City | −0.4066 | 0.1712 | −2.3749 | Strong decoupling |
Appendix D
| County | Ambient Pressure (ΔC/C) | Economic Growth (ΔG/G) | Decoupling Elasticity (e) | Decoupling Feature |
|---|---|---|---|---|
| Wuhan municipal District | −0.6522 | 0.2188 | −2.9808 | Strong decoupling |
| Caidian District | −0.1652 | 0.1467 | −1.1262 | Strong decoupling |
| Jiangxia District | −0.1597 | 0.1597 | −0.9999 | Strong decoupling |
| Huangpi District | −0.1646 | 0.2081 | −0.7909 | Strong decoupling |
| Xinzhou District | −0.3098 | 0.0444 | −6.9807 | Strong decoupling |
| Shiyan City | −0.6745 | −0.0361 | 18.6657 | Recessive decoupling |
| Huangshi municipal District | −1.3918 | −0.0666 | 20.8921 | Recessive decoupling |
| Daye City | −0.1962 | 0.1416 | −1.3859 | Strong decoupling |
| Yangxin County | −0.1822 | 0.1138 | −1.6004 | Strong decoupling |
| Jingzhou municipal District | −0.2322 | 0.1894 | −1.2258 | Strong decoupling |
| Gongan County | −0.6422 | 0.0921 | −6.9759 | Strong decoupling |
| Jianli County | −0.3238 | −0.0601 | 5.3846 | Recessive decoupling |
| Jiangling County | −0.1529 | 0.2184 | −0.6998 | Strong decoupling |
| Cityshou City | −0.4163 | 0.1769 | −2.3529 | Strong decoupling |
| Honghu City | −0.6196 | 0.018 | −34.4189 | Strong decoupling |
| Songzi City | −0.4818 | 0.1973 | −2.4421 | Strong decoupling |
| Yichang municipal District | −2.4889 | 0.06 | −41.4827 | Strong decoupling |
| Yidu City | −0.2088 | 0.2591 | −0.8058 | Strong decoupling |
| Zhijiang City | −0.1603 | 0.213 | −0.7525 | Strong decoupling |
| Dangyang City | −0.1886 | 0.105 | −1.7967 | Strong decoupling |
| Yuanan County | −0.1825 | 0.1627 | −1.1214 | Strong decoupling |
| Xingshan County | 0.0239 | 0.1749 | 0.1369 | Weak decoupling |
| Zigui County | −0.2043 | 0.3213 | −0.6356 | Strong decoupling |
| Changyang County | −0.4715 | 0.3977 | −1.1856 | Strong decoupling |
| Wufeng County | −0.2637 | 0.146 | −1.8058 | Strong decoupling |
| Xiangyang municipal District | −0.5986 | 0.0976 | −6.1303 | Strong decoupling |
| Nanzhang County | −0.6656 | 0.1697 | −3.9225 | Strong decoupling |
| Gucheng County | −1.1968 | 0.2959 | −4.0441 | Strong decoupling |
| Baokang County | −0.8771 | −0.0282 | 31.1522 | Recessive decoupling |
| Laohekou City | −0.075 | 0.1464 | −0.5122 | Strong decoupling |
| Zaoyang City | −0.6873 | −0.0465 | 14.7856 | Recessive decoupling |
| Yicheng City | −0.1009 | 0.0521 | −1.9373 | Strong decoupling |
| Ezhou City | −0.2783 | −0.1318 | 2.111 | Recessive decoupling |
| Jingmen municipal District | −0.1391 | 0.1877 | −0.7413 | Strong decoupling |
| Shayang County | 0.4212 | 0.1668 | 2.5257 | Expansion negative decoupling |
| Zhongxiang City | −0.1293 | 0.2963 | −0.4363 | Strong decoupling |
| Jingshan County | −0.565 | −0.2505 | 2.2558 | Recessive decoupling |
| Xiaogan municipal District | −3.1192 | 0.1137 | −27.4265 | Strong decoupling |
| Xiaochang County | 0.3192 | 0.1049 | 3.0424 | Expansion negative decoupling |
| Dawu County | 0.0802 | 0.1022 | 0.7842 | Weak decoupling |
| Yunmeng County | 0.0881 | 0.1499 | 0.5879 | Weak decoupling |
| Yingcheng City | −0.2743 | 0.0804 | −3.4106 | Strong decoupling |
| Anlu City | 0.2005 | 0.2303 | 0.8705 | Growth connection |
| Hanchuan City | −0.0321 | 0.0648 | −0.4955 | Strong decoupling |
| Huanggang municipal District | −0.3401 | 0.1017 | −3.3439 | Strong decoupling |
| Tuanfeng County | −0.3132 | 0.0587 | −5.339 | Strong decoupling |
| Hongan County | 0.0937 | −0.1019 | −0.9198 | Strong negative decoupling |
| Luotian County | −0.0912 | 0.0008 | −119.0521 | Strong decoupling |
| Yingshan County | −0.2446 | 0.1843 | −1.3272 | Strong decoupling |
| Xishui County | −0.0534 | 0.1363 | −0.3915 | Strong decoupling |
| Qichun County | −0.1511 | 0.0043 | −34.7358 | Strong decoupling |
| Huangmei County | −0.5843 | 0.024 | −24.3088 | Strong decoupling |
| Macheng City | −0.0603 | −0.0058 | 10.3777 | Recessive decoupling |
| Wuxue City | −0.7615 | 0.0365 | −20.8813 | Strong decoupling |
| Xianan District | −0.0548 | 0.1149 | −0.4771 | Strong decoupling |
| Jiayu County | −0.081 | 0.1589 | −0.51 | Strong decoupling |
| Tongcheng County | −0.006 | −0.0937 | 0.0641 | Weak negative decoupling |
| Chongyang County | −0.3339 | 0.1222 | −2.7332 | Strong decoupling |
| Tongshan County | −0.1354 | −0.1148 | 1.1796 | Decay connection |
| Chibi City | −0.0205 | 0.1751 | −0.1171 | Strong decoupling |
| Zengdu District | −0.127 | −0.0067 | 19.0422 | Recessive decoupling |
| Enshi City | −0.1962 | 0.1234 | −1.5896 | Strong decoupling |
| Lichuan City | −0.1743 | 0.0153 | −11.4194 | Strong decoupling |
| Jianshi County | −0.4292 | 0.277 | −1.5496 | Strong decoupling |
| Badong County | −0.0479 | 0.2327 | −0.2059 | Strong decoupling |
| Xuanen County | −0.0886 | 0.1906 | −0.4647 | Strong decoupling |
| Xianfeng County | −0.0185 | 0.36 | −0.0515 | Strong decoupling |
| Laifeng County | −0.1387 | 0.2822 | −0.4916 | Strong decoupling |
| Hefeng County | −0.3658 | 0.1442 | −2.5372 | Strong decoupling |
| Xiantao City | −0.498 | −0.0641 | 7.7734 | Recessive decoupling |
| Tianmen City | −0.0918 | 0.1609 | −0.5704 | Strong decoupling |
| Qianjiang City | −0.3867 | 0.0777 | −4.9777 | Strong decoupling |
References
- Intergovernmental Panel on Climate Change. 2006 IPCC Guidelines for National Greenhouse Gas Emissions Inventories; Institute for Global Environmental Strategies: Kanagawa, Japan, 2006. [Google Scholar]
- Xiao, P.; Zhou, Y.; Li, X.; Xu, J.; Zhao, C. Assessment of Heavy Metals in Agricultural Land: A Literature Review Based on Bibliometric Analysis. Sustainability 2021, 13, 4559. [Google Scholar] [CrossRef]
- Xu, J.; Xiao, P. Influence factor analysis of soil heavy metal based on categorical regression. Int. J. Environ. Sci. Technol. 2021, 8, 7373–7386. [Google Scholar] [CrossRef]
- Ding, B.; Yang, S.; Zhao, Y.; Yi, S. Study on Spatio-Temporal Characteristics and Decoupling Effect of Carbon Emission from Cultivated Land Resource Utilization in China. China Land Sci. 2019, 33, 45–54. [Google Scholar]
- Huang, J.; Sun, Z. Regional Differences and Dynamic Evolution of Carbon Productivity of China’s Planting Industry. J. Agrotech. Econ. 2021, 1, 1–19. [Google Scholar]
- Du, X.; Shen, L.; Wai, W.; Meng, C.; Yang, Z. Night-time light data based decoupling relationship analysis between economic growth and carbon emission in 289 Chinese cities. Sustain. Cities Soc. 2021, 73, 103119. [Google Scholar] [CrossRef]
- Wang, X.; Zhang, J. Basic path and system construction of agricultural green and low-carbon development with respect to the strategic target of carbon peak and carbon neutrality. Chin. J. Eco-Agric. 2022, 30, 516–526. [Google Scholar]
- Ding, B.; Zhao, Y.; Deng, J. Calculation, Decoupling Effects and Driving Factors of Carbon Emission from Planting Industry in China. Chin. J. Agric. Resour. Reg. Plan. 2021, 1, 1–14. [Google Scholar]
- Han, H.; Zhang, X. Static and dynamic cultivated land use efficiency in China: A minimum distance to strong efficient frontier approach. J. Clean. Prod. 2020, 246, 119002. [Google Scholar] [CrossRef]
- Hou, X.; Liu, J.; Zhang, D.; Zhao, M.; Xia, C. Impact of urbanization on the eco-efficiency of cultivated land utilization: A case study on the Yangtze River Economic Belt, China. J. Clean. Prod. 2019, 238, 117916. [Google Scholar] [CrossRef]
- Yu, C.; Zhang, L.; Tang, D. Analysis on Effects of Land Use on Carbon Emission and the Trend in Hubei Province Based on IPCC Inventory. Res. Soil Water Conserv. 2014, 21, 168–172. [Google Scholar]
- Daberechı, C.E.; Joshua, D.Z.; Andrew, A.A. Carbon emission effect of renewable energy utilization, fiscal development, and foreign direct investment in South Africa. Environ. Sci. Pollut. R. 2021, 28, 41821–41833. [Google Scholar]
- Ding, Q.; Li, J.; Wang, Q.; Li, C.; Yue, W. Carbon emission effect of the dock-less bike-sharing system in Beijing from the perspective of life cycle assessment. J. Environ. Account. Manag. 2021, 9, 31–42. [Google Scholar] [CrossRef]
- Song, Y.; Ma, F.; Qu, J. Impacts of Cultural Diversity on Carbon Emission Effects: From the Perspective of Environmental Regulations. Int. J. Env. Res. Public Health 2020, 17, 6109. [Google Scholar] [CrossRef]
- Gang, L.; Dong, J.; Donglin, D.; Jingying, F.; Xiang, L. Spatial Characteristic of Coal Production-Based Carbon Emissions in Chinese Mining Cities. Energies 2020, 13, 453. [Google Scholar]
- Wang, X. Study on the Direct Impact of Environmental Regulation Policy on Carbon Emission Intensity in China. J. Appl. Sci. Eng. Innov. 2020, 7, 136–142. [Google Scholar]
- Chen, S.; Zhang, K.; Zhang, Y. Measurement of agricultural carbon emission performance and decoupling effect. Stat. Decis. 2021, 22, 85–88. [Google Scholar]
- Min, Z.; Tao, S.; Qiang, F. A study on evaluation and influencing factors of carbon emission performance in China’s new energy vehicle enterprises. Environ. Sci. Pollut. R. 2021, 28, 57334–57347. [Google Scholar]
- Lin, B.; Zhou, Y. Does the Internet development affect energy and carbon emission performance? Sustain. Prod. Consum. 2021, 28, 1–10. [Google Scholar] [CrossRef]
- Xu, L.; Fan, M.; Yang, L.; Shao, S. Heterogeneous green innovations and carbon emission performance: Evidence at China’s city level. Energy Econ. 2021, 99, 105269. [Google Scholar] [CrossRef]
- Pei, Y.; Zhu, Y.; Wang, N. How do corruption and energy efficiency affect the carbon emission performance of China’s industrial sectors? Environ. Sci. Pollut. Res. Int. 2021, 28, 31403–31420. [Google Scholar] [CrossRef]
- Zhang, Z.; Yuan, Z.; Zhang, C.; Pang, F.; Wang, S.; Xiao, Z.; Zhang, Y. Spatial-temporal characteristics and decoupling elasticity of agricultural carbon emissions in Henan Province. Jiangsu Agric. Sci. 2017, 45, 281–285. [Google Scholar]
- Tian, Y.; Zhang, J.; Li, B. Spatial and temporal characteristics of carbon emissions from agricultural land use and decoupling elasticity in Hubei Province. Resour. Environ. Yangtze Basin 2012, 21, 1514–1519. [Google Scholar]
- Zhang, T.; Zhang, X.; Cai, H. Economic development research on the spatial-temporal characteristics and decoupling elasticity of Jiangxi farm land use carbon emissions. Guangdong Agric. Sci. 2014, 41, 208–212. [Google Scholar]
- Wang, J.; Zhu, C. International Comparison of decomposition and decoupling effects of influencing factors on agricultural carbon emissions. Stat. Decis. 2018, 34, 104–108. [Google Scholar]
- Chen, H.; Wang, H.; Qin, S. Analysis of Decoupling Effect and Driving Factors of Agricultural Carbon Emission: A Case Study of Heilongjiang Province. Sci. Technol. Manag. Res. 2019, 39, 247–252. [Google Scholar]
- Li, J.; Mao, D.; Jiang, Z.; Li, K. Decomposition of land use carbon emission factors and decoupling effect in Changsha Zhuzhou Xiangtan Urban Agglomeration. Ecol. Econ. 2019, 35, 28–34. [Google Scholar]
- Zhang, Y.; Yu, Z.; Zhang, J. Spatiotemporal evolution characteristics and dynamic efficiency decomposition of carbon emission efficiency in the Yellow River Basin. PLoS ONE 2022, 17, e264274. [Google Scholar] [CrossRef]
- Li, R.; Chen, Z.; Xiang, J. A region-scale decoupling effort analysis of carbon dioxide emissions from the perspective of electric power industry: A case study of China. Environ. Dev. Sustain. 2022, 1, 1–26. [Google Scholar] [CrossRef]
- Sun, D.; Cai, S.; Yuan, X.; Zhao, C.; Gu, J.; Chen, Z.; Sun, H. Decomposition and decoupling analysis of carbon emissions from agricultural economic growth in China’s Yangtze River economic belt. Environ. Geochem. Health 2022, 1, 1–20. [Google Scholar] [CrossRef]
- Dong, J.; Li, C.; Wang, Q. Decomposition of carbon emission and its decoupling analysis and prediction with economic development: A case study of industrial sectors in Henan Province. J. Clean. Prod. 2021, 321, 129019. [Google Scholar] [CrossRef]
- Li, K.; Chen, J.; Ma, D. Growth Mechanism and Trend Forecast of Carbon Emission from Farmland Inputs in Hunan Province Based on Stirpat and GM (1, 1) Model. Resour. Environ. Yangtze Basin 2018, 27, 345–352. [Google Scholar]
- Zhou, S.; Xi, F.; Yin, Y.; Bing, L.; Wang, J.; Ma, M.; Zhang, W. Accounting and drivers of carbon emission from cultivated land utilization in Northeast China. J. Appl. Ecol. 2021, 32, 3865–3871. [Google Scholar]
- Shang, J.; Yang, B. Estimation of Carbon Source and Carbon Sequestration in Planting Industry and Dynamic Analysis of Influencing Factors of Net Carbon Sequestration: A Case Study of Shandong Province. Reform 2019, 6, 123–134. [Google Scholar]
- Zhao, X.; Jiang, M.; Zhang, W. Decoupling between Economic Development and Carbon Emissions and Its Driving Factors: Evidence from China. Int. J. Environ. Res. Public Health 2022, 19, 2893. [Google Scholar] [CrossRef]
- Lyu, B.; Ni, W.; Ostic, D.; Yu, H.; Qureshi, N.A. Can Carbon Trading Policy Promote China’s Decoupling of Carbon Emission from the Perspective of Technology-Driven Innovation? Front. Environ. Sci. 2022, 10, 893947. [Google Scholar] [CrossRef]
- Gan, C.; Wang, K.; Voda, M. Decoupling relationship between carbon emission and economic development in the service sector: Case of 30 provinces in China. Environ. Sci. Pollut. R. 2022, 1, 1–13. [Google Scholar] [CrossRef]
- Wang, Q.; Jiang, R. Is carbon emission growth decoupled from economic growth in emerging countries? New insights from labor and investment effects. J. Clean. Prod. 2020, 248, 119188. [Google Scholar] [CrossRef]
- Feng, J.; Zeng, X.; Yu, Z.; Bian, Y.; Li, W.; Wang, Y. Decoupling and driving forces of industrial carbon emission in a coastal city of Zhuhai, China. Energy Rep. 2019, 5, 1589–1602. [Google Scholar] [CrossRef]
- Xia, S.; Zhao, Y.; Xu, X.; Wen, Q.; Cui, P.; Tang, W. Regional Inequality, Spatial-Temporal Pattern and Dynamic Evolution of Carbon Emission Intensity from Agriculture in China in the Period of 1997–2016. Resour. Environ. Yangtze Basin 2020, 29, 596–608. [Google Scholar]
- Chen, Y.; Yang, Y.; Sun, L.; Shen, Y.; Wang, L.; Wang, X. Analysis of carbon emission and its influencing factors of Shanghai’s textile and apparel industry. Int. J. Global Warm. 2021, 25, 123. [Google Scholar] [CrossRef]
- Shi, C. Decoupling analysis and peak prediction of carbon emission based on decoupling theory. Sustain. Comput. Inform. Syst. 2020, 28, 100424. [Google Scholar] [CrossRef]
- Wang, Q.; Su, M. Drivers of decoupling economic growth from carbon emission—an empirical analysis of 192 countries using decoupling model and decomposition method. Environ. Impact Assess. Rev. 2020, 81, 106356. [Google Scholar] [CrossRef]
- West, T.O.; Marland, G.; ORNL, O.R.N.L. A synthesis of carbon sequestration, carbon emissions, and net carbon flux in agriculture: Comparing tillage practices in the United States. Agric. Ecosyst. Environ. 2002, 91, 217–232. [Google Scholar] [CrossRef]
- Jing, Z.; Jixi, G. Comparative analysis of carbon emissions from food consumption of urban and rural residents in China. Prog. Geogr. 2009, 28, 429–434. [Google Scholar]
- Wang, B.; Zhang, W. Study on measurement and temporal and spatial difference of agricultural ecological efficiency in China. China Popul. Resour. Environ. 2016, 26, 11–19. [Google Scholar] [CrossRef]
- Zhao, R.; Liu, Y.; Ding, M.; Jiao, S. Research on Carbon Source and Sink of Farmland Ecosystem in Henan Province. J. Henan Agric. Sci. 2010, 7, 40–44. [Google Scholar]
- Li, B.; Zhang, J.; Li, H. Research on Spatial-temporal Characteristics and Affecting Factors Decomposition of Agricultural Carbon Emission in China. China Popul. Resour. Environ. 2011, 21, 80–86. [Google Scholar]
- Wu, F.; Li, L.; Zhang, H.; Chen, F. Effects of conservation tillage on net carbon flux from farmland ecosystems. Chin. J. Ecol. 2007, 26, 2035–2039. [Google Scholar]
- Tapio, P. Towards a theory of decoupling: Degrees of decoupling in the EU and the case of road traffic in Finland between 1970 and 2001. Transp. Policy 2005, 12, 137–151. [Google Scholar] [CrossRef] [Green Version]
- Li, K.; Zhou, Y.; Xiao, H.; Li, Z.; Shan, Y. Decoupling of economic growth from CO2 emissions in Yangtze River Economic Belt cities. Sci. Total Environ. 2021, 775, 145927. [Google Scholar] [CrossRef]
- Kaya, Y. Impact of Carbon Dioxide Emission Control on GNP Growth: Interpretation of Proposed Scenarios; Intergovernmental Panel on Climate Change/Response Strategies Working Group: Geneva, Switzerland, 1990. [Google Scholar]
- Lu, Y.; Jiahua, P. Disaggregation of Carbon Emission Drivers in Kaya Identity and Its Limitations with Regard to Policy Implications. Clim. Change Res. 2013, 9, 210–215. [Google Scholar]
- Dai, X.; He, Y.; Zhong, Q. Analysis of CO2 emission driving factors in China’s agriculture based on expanded Kaya identity. J. Univ. Chin. Acad. Sci. 2015, 32, 751–759. [Google Scholar]
- Wang, C.; Wang, F.; Zhang, H. The process of energy-related carbon emissions and influencing mechanism research in Xinjiang. Acta Ecol. Sin. 2016, 36, 2151–2163. [Google Scholar]
- Dai, X.; He, Y.; Zhong, Q. Driving factors and their contributions to agricultural CO2 emission due to energy consumption in China: Based on an expended Kaya identity and LMDI decomposition method. Chin. J. Eco-Agric. 2015, 23, 1445–1454. [Google Scholar]
- Guo, C. Decomposition of China’s Carbon Emissions: Based on LMDI Method. China Popul. Resour. Environ. 2010, 20, 6. [Google Scholar]
- Li, G.; Li, Z. Carbon Emissions Decomposition Analysis on Agricultural Energy Consumption—Based LMDI Model. J. Agrotech. Econ. 2010, 10, 66–72. [Google Scholar]
- Lin, J. Research on the relationship and influence between energy consumption and high-quality economic development in China. Mod. Econ. Res. 2022, 4, 11–20. [Google Scholar]
- Xiao, P.; Xu, J.; Yu, Z.; Qian, P.; Lu, M.; Ma, C. Spatiotemporal Pattern Differentiation and Influencing Factors of Cultivated Land Use Efficiency in Hubei Province under Carbon Emission Constraints. Sustainability 2022, 14, 7042. [Google Scholar] [CrossRef]
- Li, G.; Li, Y.; Zhou, X. Agricultural Mechanization, Labor Transfer and the Growth of Farmer’s Income: A Re-examination of Causality. Chin. Rural. Econ. 2018, 11, 112–127. [Google Scholar]
- Zhang, Z.; Lao, Y.; Zhao, N.; Wei, J.; Hu, B. Decoupling Relationship of Landuse Carbon Emission Reduction and Economic Growth in Guangdong Province. Bull. Soil Water Conserv. 2022, 42, 250–258. [Google Scholar]
- Sui, J.; Lv, W. Crop Production and Agricultural Carbon Emissions: Relationship Diagnosis and Decomposition Analysis. Int. J. Environ. Res. Public Health 2021, 18, 8219. [Google Scholar] [CrossRef] [PubMed]
- Ehrlich, P.R.; Holdren, J.P. Impact of Population Growth. Science 1971, 171, 1212–1217. [Google Scholar] [CrossRef] [PubMed]
- Wang, T.; Wang, X.; Peng, S. Review on Influencing Factors of carbon emission and decoupling analysis. Liaoning Urban Rural. Environ. Sci. Technol. 2020, 40, 4–6. [Google Scholar]
- Dietz, T.; Rosa, E.A. Rethinking the Environmental Impacts of Population, Affluence and Technology. Hum. Ecol. Rev. 1994, 1, 277–300. [Google Scholar]
- Guo, X.; AI, J. Temporal and Spatial Variation, Influencing Factors and Decoupling Effect of Agricultural Carbon Emissions: Based on Panel Data of 31 Provinces from 2000 to 2019. J. Xichang Coll. 2022, 36, 9–15. [Google Scholar]
- Feng, Z.; Gao, Y. Study on China’s Regional Driving Factors of Carbon Emission, Emission Reduction Contribution and Potential. J. Beijing Inst. Technol. 2019, 21, 13–20. [Google Scholar]
- Jian, L.; Qingshan, Y.; Suhua, O.; Jie, L. Factor decomposition and the decoupling effect of carbon emissions in China’s manufacturing high-emission subsectors. Energy 2022, 248, 123568. [Google Scholar]
- Liu, J. Decoupling and Decomposition Analysis of Carbon Emissions from the Power Sectors: A Comparative Study of China and the United States. World Sci. Res. J. 2022, 8, 61–73. [Google Scholar]
- Zhang, T.; Li, J.; Cheng, L. Intrinsic correlation among economic structure, growth mode and environmental pollution-Empirical analysis based on the TVP-VAR model. China Environ. Sci. 2016, 36, 2230–2240. [Google Scholar]
- Lv, X. China’s food security and early-warning system based on vector autogregression (VAR) model. Trans. Chin. Soc. Agric. Eng. 2013, 29, 286–292. [Google Scholar]
- Li, B.; Kong, X. A study on the pulling effects of industrialization and urbanization on agricultural modernization. Economist 2016, 8, 55–64. [Google Scholar]
- Li, K.; Qu, R. The Effect of Technological Change on China’s Carbon Dioxide Emission: An Empirical Analysis Based on the Vector Error Correction Model. China Soft Sci. 2012, 6, 51–58. [Google Scholar]
- Hu, C.; Bao, B.; Liu, C. A Research into the Relationship between Industrial Structure Change and Agricultural Economic Growth Based on the Model of Vector Auto Regression—A Case Study of Anhui Province. Econ. Surv. 2011, 6, 57–61. [Google Scholar]
- Li, Y.; Cai, M.; Wu, K.; Wei, J. Decoupling analysis of carbon emission from construction land in Shanghai. J. Clean. Prod. 2019, 210, 25–34. [Google Scholar] [CrossRef]
- Wang, Y.; Xie, T.; Yang, S. Carbon emission and its decoupling research of transportation in Jiangsu Province. J. Clean. Prod. 2017, 142, 907–914. [Google Scholar] [CrossRef]
- Wu, H.; Huang, H.; Chen, W. Decoupling Effects between Carbon Emissions from Cropland Use and Grain Production in the Major Grain-Producing Areas in China. Geogr. Geo-Inf. Sci. 2021, 37, 85–91. [Google Scholar]
- Jiang, T.; Hu, C.; Wang, Q.; Wu, E. Research on spatial-temporal characteristics and decoupling of agricultural carbon emissions in Hubei. Environ. Pollut. Control. 2021, 43, 1476–1480. [Google Scholar]
- Tian, Y.; Lin, Z. Spatio-temporal coupling relationship between agricultural carbon emissions and economic growth in the Yangtze River Economic Belt. J. China Agric. Univ. 2021, 26, 208–218. [Google Scholar]
- Li, C.; Ying, W.; Lei, S. Study on the temporal and spatial characteristics and decoupling elasticity of agricultural carbon emissions in Shandong Province. Jiangsu Agric. Sci. 2020, 48, 250–256. [Google Scholar]


| Carbon Source | Formula | Carbon Source Input | Carbon Emission Coefficient | Reference |
|---|---|---|---|---|
| Chemical fertilizer | [44] | |||
| Pesticides | [45] | |||
| Agricultural film | [46] | |||
| Agricultural machinery | [47] | |||
| Irrigation | [48] | |||
| Ploughing | [49] |
| Decoupling Status | ΔC/C | ΔG/G | Elasticity e | Remarks | |
|---|---|---|---|---|---|
| Negative decoupling | Expansion negative decoupling | >0 | >0 | e > 1.2 | Both economic growth and carbon emissions have surged, with carbon emissions increasing at a higher pace than the economy. |
| Strong negative decoupling | >0 | <0 | 0 < e | Economic growth declines and carbon emissions rise. | |
| Weak negative decoupling | <0 | <0 | 0 ≤ e < 0.8 | Both economic growth and carbon emissions are increasing, with carbon emissions increasing at a higher pace. | |
| Decoupling | Weak decoupling | >0 | >0 | 0 ≤ e < 0.8 | Carbon emissions increase along with economic expansion, which is accelerating. |
| Strong decoupling | <0 | >0 | 0 < e | Increasing economic expansion and decreasing carbon emissions. | |
| Recessive decoupling | <0 | <0 | e > 1.2 | Both economic growth and carbon emissions have declined, with carbon emissions declining more quickly than economic growth. | |
| Connect | Growth connection | >0 | >0 | 0.8 ≤ e < 1.2 | Both economic growth and carbon emissions are on the rise, and their rates of expansion are equal. |
| Decay connection | <0 | <0 | 0.8 ≤ e < 1.2 | Carbon emissions have declined at the same pace as economic growth. | |
| Category | Unit | Data Sources |
|---|---|---|
| Agricultural output value | CNY | The Hubei Province Statistical Yearbook |
| Agricultural employees | 104 people | The Hubei Province Statistical Yearbook |
| Chemical fertilizer | 104 tons | Municipal Statistical Yearbook |
| Pesticides | Ton | Municipal Statistical Yearbook |
| Agricultural film | Ton | Municipal Statistical Yearbook |
| Total mechanical power | 104 kW | Hubei Rural Statistical Yearbook |
| Effective irrigation area | hm2 | Hubei Rural Statistical Yearbook |
| Ploughing (sown area of crops) | hm2 | Hubei Rural Statistical Yearbook |
Publisher’s Note: MDPI stays neutral with regard to jurisdictional claims in published maps and institutional affiliations. |
© 2022 by the authors. Licensee MDPI, Basel, Switzerland. This article is an open access article distributed under the terms and conditions of the Creative Commons Attribution (CC BY) license (https://creativecommons.org/licenses/by/4.0/).
Share and Cite
Xiao, P.; Zhang, Y.; Qian, P.; Lu, M.; Yu, Z.; Xu, J.; Zhao, C.; Qian, H. Spatiotemporal Characteristics, Decoupling Effect and Driving Factors of Carbon Emission from Cultivated Land Utilization in Hubei Province. Int. J. Environ. Res. Public Health 2022, 19, 9326. https://doi.org/10.3390/ijerph19159326
Xiao P, Zhang Y, Qian P, Lu M, Yu Z, Xu J, Zhao C, Qian H. Spatiotemporal Characteristics, Decoupling Effect and Driving Factors of Carbon Emission from Cultivated Land Utilization in Hubei Province. International Journal of Environmental Research and Public Health. 2022; 19(15):9326. https://doi.org/10.3390/ijerph19159326
Chicago/Turabian StyleXiao, Pengnan, Yuan Zhang, Peng Qian, Mengyao Lu, Zupeng Yu, Jie Xu, Chong Zhao, and Huilin Qian. 2022. "Spatiotemporal Characteristics, Decoupling Effect and Driving Factors of Carbon Emission from Cultivated Land Utilization in Hubei Province" International Journal of Environmental Research and Public Health 19, no. 15: 9326. https://doi.org/10.3390/ijerph19159326
APA StyleXiao, P., Zhang, Y., Qian, P., Lu, M., Yu, Z., Xu, J., Zhao, C., & Qian, H. (2022). Spatiotemporal Characteristics, Decoupling Effect and Driving Factors of Carbon Emission from Cultivated Land Utilization in Hubei Province. International Journal of Environmental Research and Public Health, 19(15), 9326. https://doi.org/10.3390/ijerph19159326