
Movement Analysis Could Help in the Assessment of Chronic Low Back Pain Patients: Results from a Preliminary Explorative Study

 ,
,  ,
,  ,
,  and
and
Abstract
:1. Introduction
2. Methods
2.1. Design and Setting
2.2. Participants
2.3. Evaluation Protocol
2.4. Usual Care Exercise Therapy Intervention
2.5. Data Analysis
2.6. Evaluation
2.7. Statistics
3. Results
4. Discussion
5. Conclusions
Author Contributions
Funding
Institutional Review Board Statement
Informed Consent Statement
Data Availability Statement
Conflicts of Interest
Appendix A. Scoring Criteria

| Feature | Scoring Visual Guide | |||
|---|---|---|---|---|
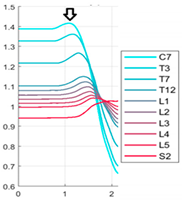
| Start | Score 0 = before the graph begins to decrease there is a clear opposite movement that creates a peak. | |||
| Score 0 | Score 1 | Score 2 | Score 3 | |
 |  | 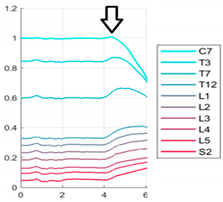 |  | |
| Fluency | Score 0 = the graph lines are continuous with no intermittences. | |||
| Score 0 | Score 1 | Score 2 | Score 3 | |
 |  |  |  | |
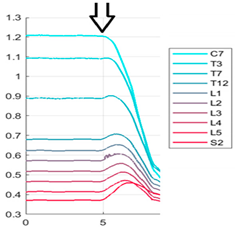
| Total Displacement/ Range of Motion | Score 0 = C7 trajectory line always crosses the S2 trajectory line (the more the C7 trajectory line crosses the S2 trajectory line, the better the ROM is). | |||
| Score 0 | Score 1 | Score 2 | Score 3 | |
 | 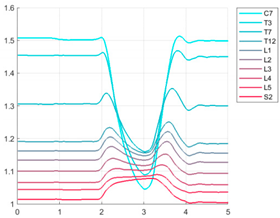 |  |  | |
| Score 0 = when the movement ends, the line of the graph is always at a higher level with respect to the starting line level. | ||||
| Score 0 | Score 1 | Score 2 | Score 3 | |
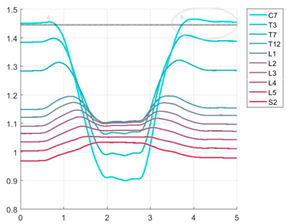 |  |  |  | |
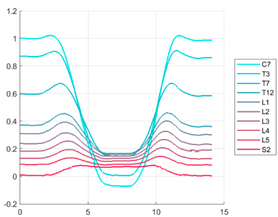
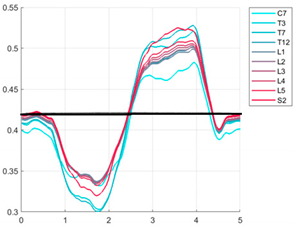
| Symmetry | Score 0 = the descending part of the graph overlaps with the ascending part. | |||
| Score 0 | Score 1 | Score 2 | Score 3 | |
 |  |  |  | |
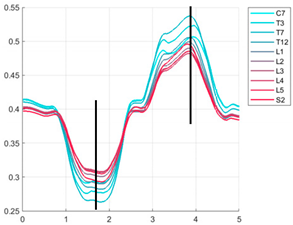
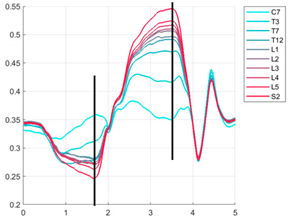
| Pelvis Centre Position | Score 0 = the pelvis centre should be in the point of maximal flexion of the markers identifying S2. | |||
| Score 0 | Score 1 | Score 2 | Score 3 | |
 |  |  |  | |
| Feature | Scoring Visual Guide | |||
|---|---|---|---|---|
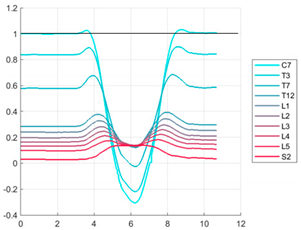
| Fluency | Score 0 = the graph appears with fluid and continuous lines and curves. | |||
| Score 0 | Score 1 | Score 2 | Score 3 | |
 |  |  |  | |
| Total Displacement /Range of Motion | The displacement of segments trajectories | |||
| Score 0 | Score 1 | Score 2 | Score 3 | |
 |  |  |  | |
| Symmetry | Score 0 = the descending part of the graph overlaps with the ascending part | |||
| Score 0 | Score 1 | Score 2 | Score 3 | |
 |  |  |  | |
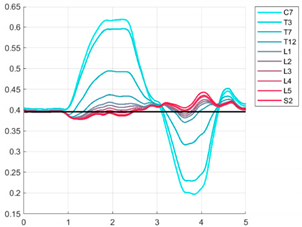
| Cervico-Thoracic/lu Mbosacral Reverse Movement | Score 0 = when observing the movements of C7 and S2, their movements should be in an opposite trend with obviously a different magnitude. | |||
| Score 0 | Score 1 | Score 2 | Score 3 | |
 |  |  |  | |
| Pelvis Centre Movement | Score 0 = the pelvis centre should be aligned with the midpoint of each line of the graph. | |||
| Score 0 | Score 1 | Score 2 | Score 3 | |
 |  |  |  | |
| Feature | Description | |||
|---|---|---|---|---|
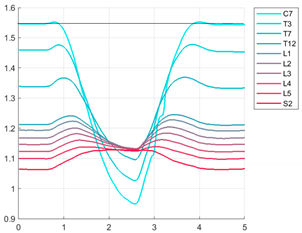
| Fluency | Score 0 = the graph lines are continuous with no intermittences. | |||
| Score 0 | Score 1 | Score 2 | Score 3 | |
 |  |  |  | |
| Total Displacement/ Range of Motion | The displacement of segments trajectories | |||
| Score 0 | Score 1 | Score 2 | Score 3 | |
 |  |  |  | |
| Symmetry | Score 0 = dividing graph at the maximum and minimum point, the two parts are overlapping. | |||
| Score 0 | Score 1 | Score 2 | Score 3 | |
 |  |  |  | |
| End | Score 0 = at the end of the movement, the S2 line arrives at the same level as the start. | |||
| Score 0 | Score 1 | Score 2 | Score 3 | |
 |  |  |  | |
| Pelvis Centre Movement | Score 0 = pelvis centre should be aligned with the midpoint of each line of the graph. | |||
| Score 0 | Score 1 | Score 2 | Score 3 | |
 |  |  |  | |
References
- Buchbinder, R.; van Tulder, M.; Öberg, B.; Costa, L.M.; Woolf, A.; Schoene, M.; Croft, P.; Buchbinder, R.; Hartvigsen, J.; Cherkin, D.; et al. Low back pain: A call for action. Lancet 2018, 391, 2384–2388. [Google Scholar] [CrossRef]
- Foster, N.E.; Anema, J.R.; Cherkin, D.; Chou, R.; Cohen, S.P.; Gross, D.P.; Ferreira, P.H.; Fritz, J.M.; Koes, B.W.; Peul, W.; et al. Prevention and treatment of low back pain: Evidence, challenges, and promising directions. Lancet 2018, 391, 2368–2383. [Google Scholar] [CrossRef]
- Parreira, P.; Heymans, M.W.; van Tulder, M.W.; Esmail, R.; Koes, B.W.; Poquet, N.; Lin, C.-W.C.; Maher, C.G. Back Schools for Chronic Non-Specific Low Back Pain. Cochrane Database Syst. Rev. 2017, 8, CD011674. Available online: https://www.cochranelibrary.com/cdsr/doi/10.1002/14651858.CD011674.pub2/full?highlightAbstract=withdrawn%7Cback%7Cpain%7Clow (accessed on 10 July 2019). [CrossRef] [PubMed]
- Rubinstein, S.M.; van Middelkoop, M.; Assendelft, W.J.; de Boer, M.R.; van Tulder, M.W. Spinal manipulative therapy for chronic low-back pain. Cochrane Database Syst. Rev. 2011, 2, CD008112. Available online: https://www.cochranelibrary.com/cdsr/doi/10.1002/14651858.CD008112.pub2/full?highlightAbstract=withdrawn%7Cback%7Cpain%7Clow (accessed on 10 July 2019).
- Khadilkar, A.; Odebiyi, D.O.; Brosseau, L.; Wells, G.A. Transcutaneous electrical nerve stimulation (TENS) versus placebo for chronic low-back pain. Cochrane Database Syst. Rev. 2008, 4, CD003008. Available online: https://www.cochranelibrary.com/cdsr/doi/10.1002/14651858.CD003008.pub3/full?highlightAbstract=tens%7Cwithdrawn%7Cback%7Cpain%7Cten%7Clow (accessed on 10 July 2019). [CrossRef] [PubMed]
- Chou, R.; Qaseem, A.; Owens, D.K.; Shekelle, P.; Clinical Guidelines Committee of the American College of Physicians. Diagnostic imaging for low back pain: Advice for high-value health care from the American College of Physicians. Ann. Intern. Med. 2011, 154, 181–189. [Google Scholar] [CrossRef] [PubMed] [Green Version]
- O’Sullivan, P. Diagnosis and classification of chronic low back pain disorders: Maladaptive movement and motor control impairments as underlying mechanism. Man. Ther. 2005, 10, 242–255. [Google Scholar] [CrossRef]
- Barrey, C.; Rousseau, M.-A.; Persohn, S.; Campana, S.; Perrin, G.; Skalli, W. Relevance of using a compressive preload in the cervical spine: An experimental and numerical simulating investigation. Eur. J. Orthop. Surg. Traumatol. 2015, 25 (Suppl. 1), S155–S165. [Google Scholar] [CrossRef]
- Baker, R.; Esquenazi, A.; Benedetti, M.G.; Desloovere, K. Gait analysis: Clinical facts. Eur. J. Phys. Rehabil. Med. 2016, 52, 560–574. [Google Scholar]
- Olsson, T.H.; Selvik, G.; Willner, S. Mobility in the lumbosacral spine after fusion studied with the aid of roentgen stereophotogrammetry. Clin. Orthop. Relat. Res. 1977, 129, 181–190. [Google Scholar] [CrossRef]
- Hannink, E.; Shannon, T.; Barker, K.L.; Dawes, H. The reliability and reproducibility of sagittal spinal curvature measurement using the Microsoft Kinect V2. J. Back Musculoskelet. Rehabil. 2020, 33, 295–301. [Google Scholar] [CrossRef] [PubMed]
- Paoletti, M.; Belli, A.; Palma, L.; Paniccia, M.; Tombolini, F.; Ruggiero, A.; Vallasciani, M.; Pierleoni, P. Data acquired by wearable sensors for the evaluation of the flexion-relaxation phenomenon. Data Brief 2020, 31, 105957. [Google Scholar] [CrossRef] [PubMed]
- Buraschi, R.; Pollet, J.; Villafañe, J.H.; Piovanelli, B.; Negrini, S. Temporal and kinematic analyses of timed up and go test in chronic low back pain patients. Gait Posture 2022, 96, 137–142. [Google Scholar] [CrossRef] [PubMed]
- Negrini, S.; Piovanelli, B.; Amici, C.; Cappellini, V.; Bovi, G.; Ferrarin, M.; Zaina, F.; Borboni, A. Trunk motion analysis: A systematic review from a clinical and methodological perspective. Eur. J. Phys. Rehabil. Med. 2016, 52, 583–592. [Google Scholar] [PubMed]
- Kinel, E.; D’Amico, M.; Roncoletta, P. Normative 3D opto-electronic stereo-photogrammetric sagittal alignment parameters in a young healthy adult population. PLoS ONE 2018, 13, e0203679. [Google Scholar] [CrossRef]
- Piovanelli, B.; Amici, C.; Cappellini, V.; Alberto, B.; Negrini, S. Functional assessment of the spine through an optoelectronic system. Gait Posture 2017, 57, 347–348. [Google Scholar] [CrossRef]
- Hides, J.A.; Stokes, M.J.; Saide, M.; Jull, G.A.; Cooper, D.H. Evidence of lumbar multifidus muscle wasting ipsilateral to symptoms in patients with acute/subacute low back pain. Spine 1994, 19, 165–172. [Google Scholar] [CrossRef]
- Wilder, D.G.; Aleksiev, A.R.; Magnusson, M.L.; Pope, M.H.; Spratt, K.F.; Goel, V.K. Muscular response to sudden load. A tool to evaluate fatigue and rehabilitation. Spine 1996, 21, 2628–2639. [Google Scholar] [CrossRef]
- Kaigle, A.M.; Wessberg, P.; Hansson, T.H. Muscular and kinematic behavior of the lumbar spine during flexion-extension. J. Spinal Disord. 1998, 11, 163–174. [Google Scholar] [CrossRef]
- Luoto, S.; Taimela, S.; Hurri, H.; Alaranta, H. Mechanisms explaining the association between low back trouble and deficits in information processing. A controlled study with follow-up. Spine 1999, 24, 255–261. [Google Scholar] [CrossRef]
- Childs, J.D.; Piva, S.R.; Fritz, J.M. Responsiveness of the numeric pain rating scale in patients with low back pain. Spine 2005, 30, 1331–1334. [Google Scholar] [CrossRef] [PubMed]
- Fairbank, J.C.; Pynsent, P.B. The Oswestry Disability Index. Spine 2000, 25, 2940–2952. [Google Scholar] [CrossRef] [PubMed]
- Piovanelli, B.; Pedersini, P.; Buraschi, R.; Pollet, J.; Piotti, S.; Pedretti, S.; Negrini, S. P 127—A pilot study of forward bending, lateral flexion and axial rotation of the spine in healthy subjects. Gait Posture 2018, 65, 449–450. [Google Scholar] [CrossRef]
- Amici, C.; Piovanelli, B.; Ragni, F.; Formicola, R.; Cappellini, V.; Candiani, G.; Borboni, A.; Negrini, S. Functional Analysis of the Trunk Flexion-Extension Through Gaussian Functions Fitting of the Movement Profile. In Proceedings of the ASME 2021 International Design Engineering Technical Conferences and Computers and Information in Engineering Conference, Virtual, 17–19 August 2021; Available online: https://asmedc.silverchair.com/IDETC-CIE/proceedings/IDETC-CIE2021/85437/V007T07A008/1128145 (accessed on 30 June 2022).
- Koo, T.K.; Li, M.Y. A Guideline of Selecting and Reporting Intraclass Correlation Coefficients for Reliability Research. J. Chiropr. Med. 2016, 15, 155–163. [Google Scholar] [CrossRef] [Green Version]
- Papi, E.; Koh, W.S.; McGregor, A.H. Wearable technology for spine movement assessment: A systematic review. J. Biomech. 2017, 64, 186–197. [Google Scholar] [CrossRef]
- Maher, C.; Underwood, M.; Buchbinder, R. Non-specific low back pain. Lancet 2017, 389, 736–747. [Google Scholar] [CrossRef] [Green Version]
- Negrini, S.; Zaina, F. The chimera of low back pain etiology: A clinical rehabilitation perspective. Am. J. Phys. Med. Rehabil. 2013, 92, 93–97. [Google Scholar] [CrossRef]
- Kamper, S.J.; Apeldoorn, A.T.; Chiarotto, A.; Smeets, R.J.E.M.; Ostelo, R.W.J.G.; Guzman, J.; van Tulder, M.W. Multidisciplinary biopsychosocial rehabilitation for chronic low back pain: Cochrane systematic review and meta-analysis. BMJ 2015, 350, h444. [Google Scholar] [CrossRef] [Green Version]
- Snelgrove, S.; Liossi, C. Living with chronic low back pain: A metasynthesis of qualitative research. Chronic Illn. 2013, 9, 283–301. [Google Scholar] [CrossRef]
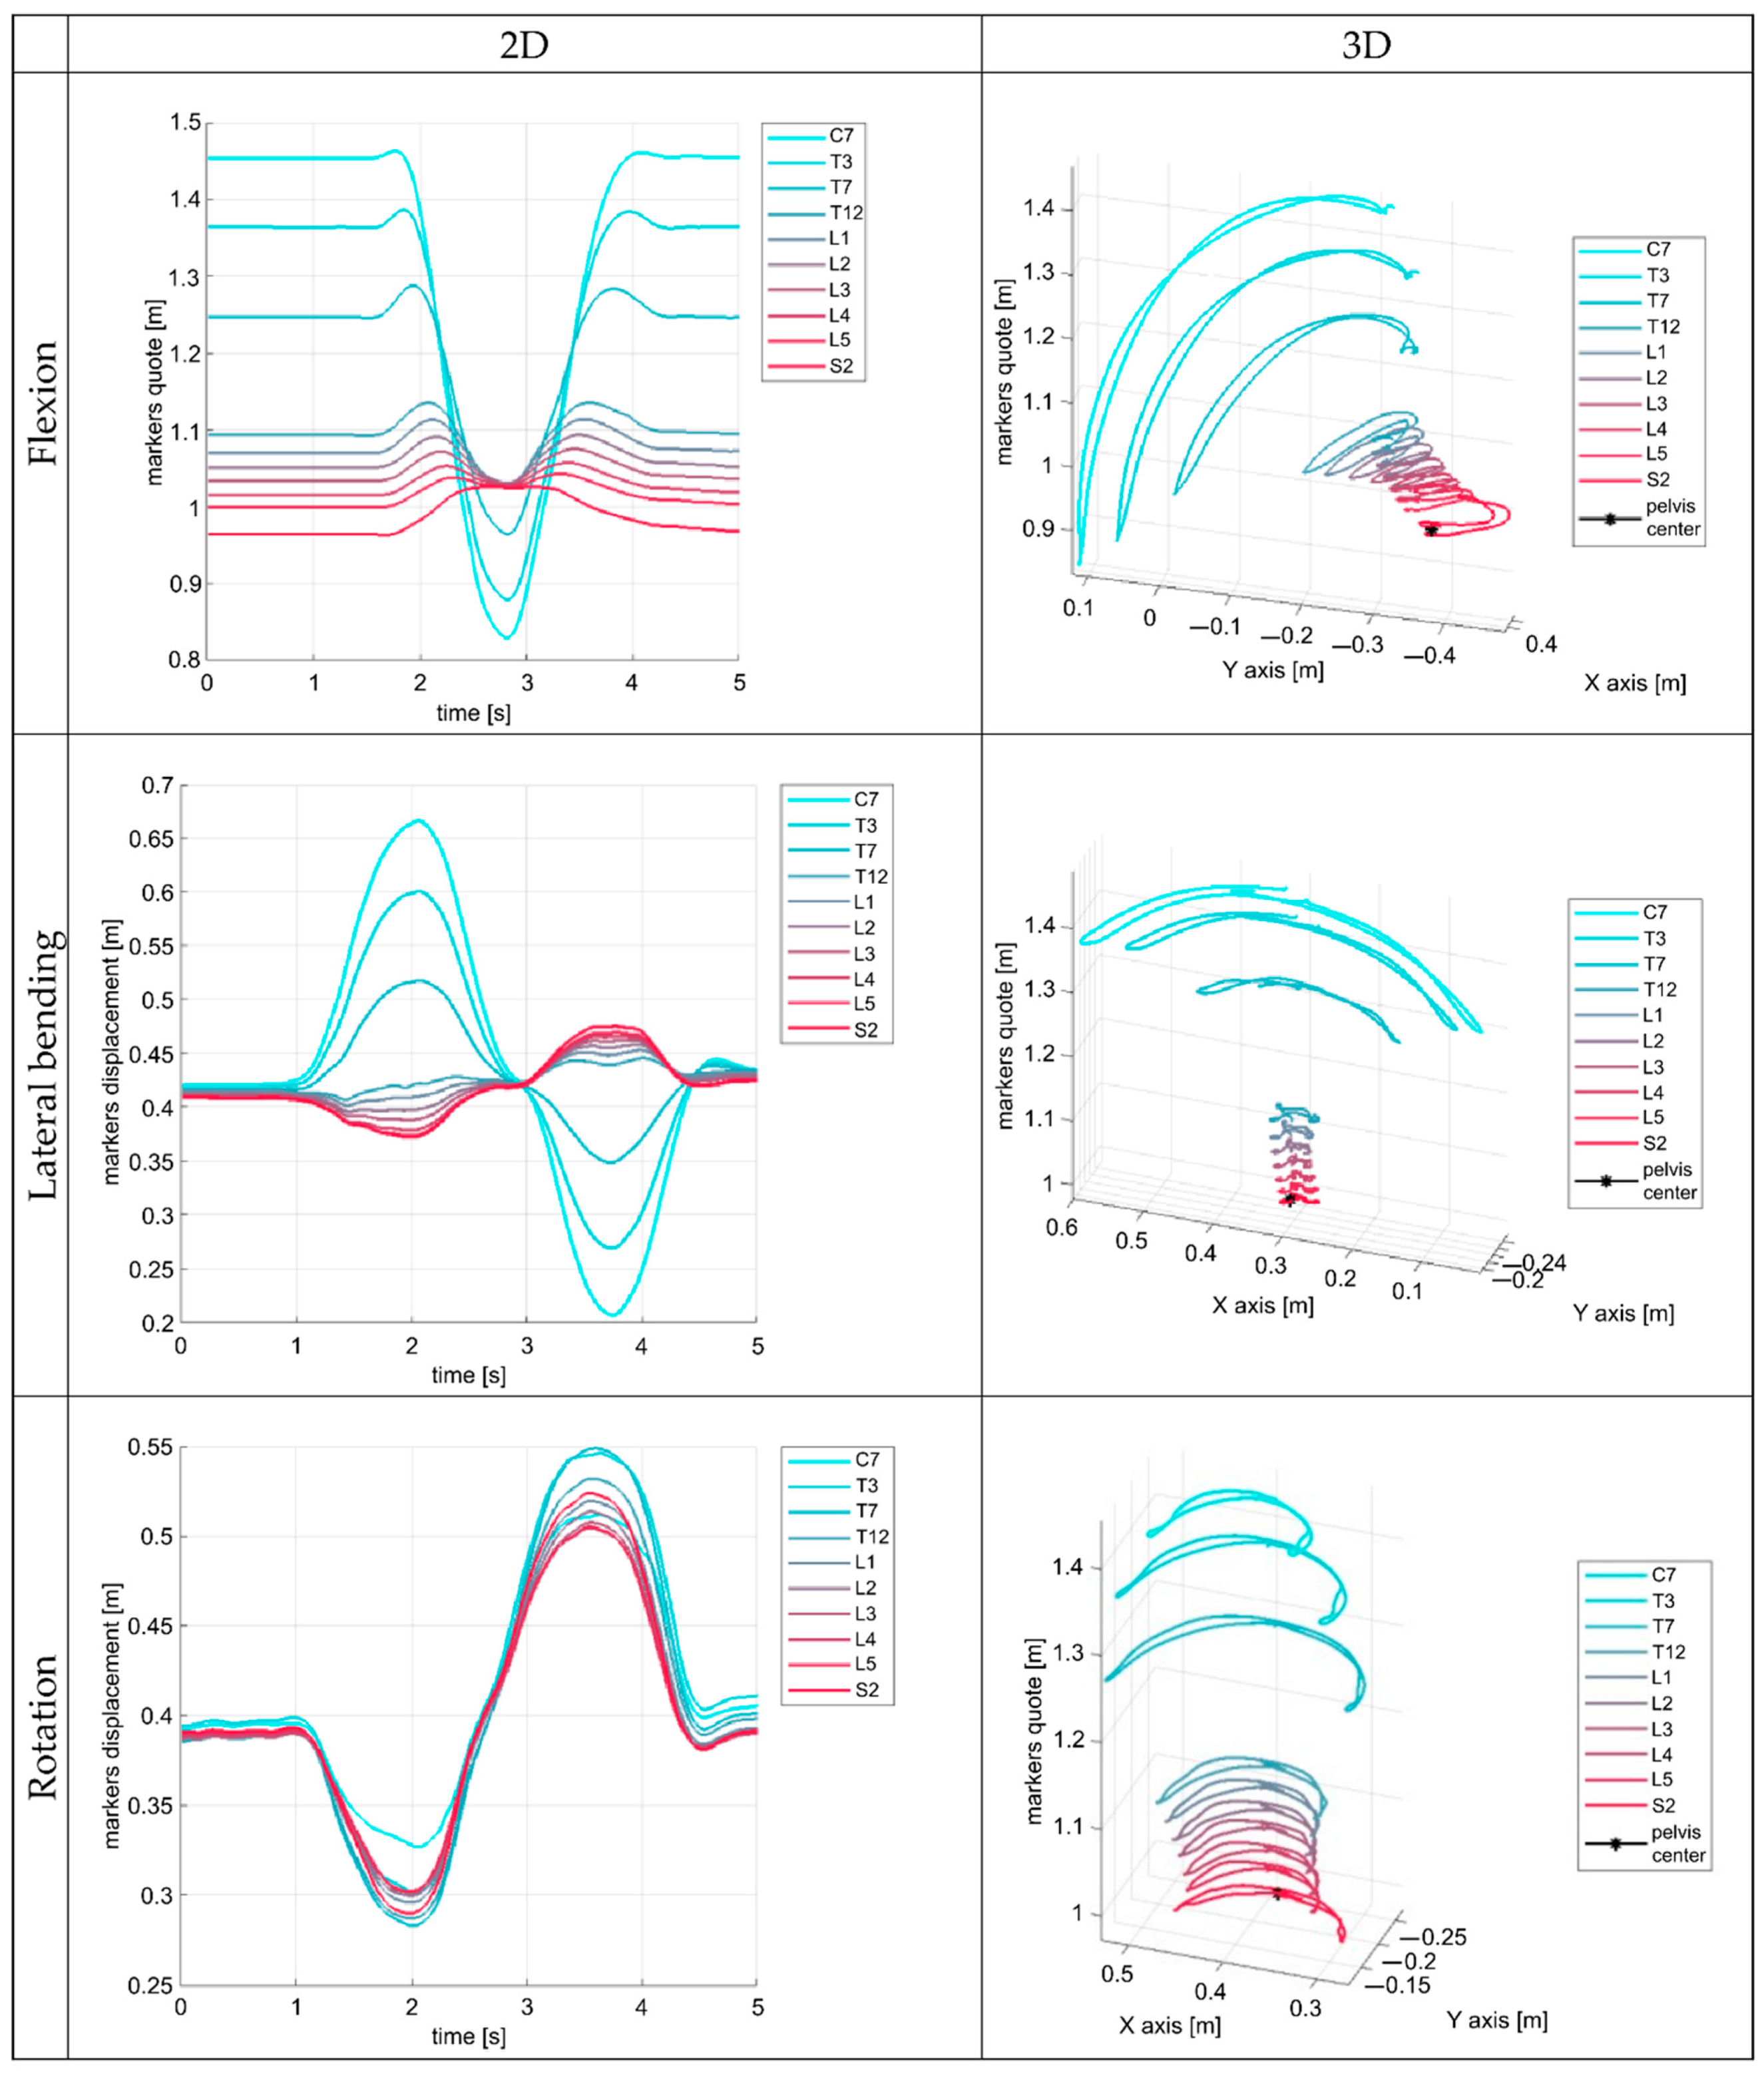
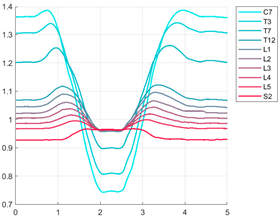
| Flexion and Extension | |
|---|---|
| Feature | Description |
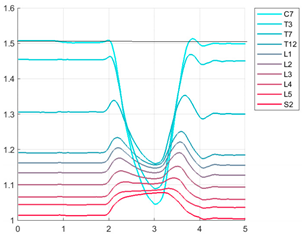
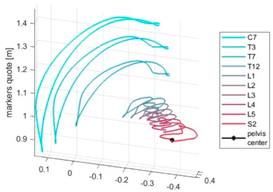
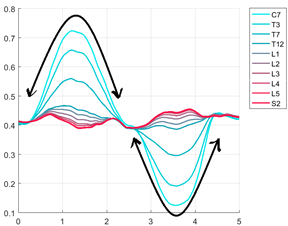
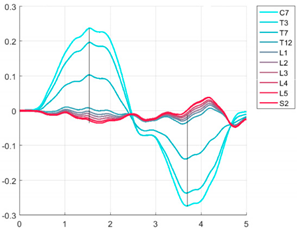
| Start | The presence of a starting overshoot, as a detectable peak in the marker trajectory (opposite to the downward trend of flexion) before the profiles begin to decrease. |
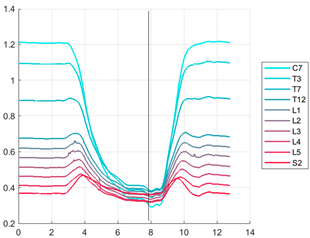
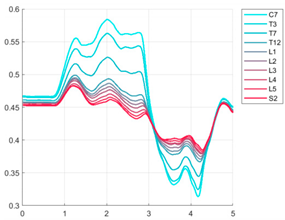
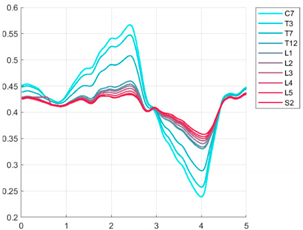
| Fluency | The shape of the time trajectory is configured without sudden stops, jumps, or discontinuities. This is when the execution of the measured movement is fluid both in its trajectory and in speed and acceleration. From an analytical point of view, the graphs show a continuous trend of the trajectory and its temporal derivatives that express the continuity of velocity and acceleration during the execution of the motor task and therefore the absence of sudden irregularities or intermittence in the movement. |
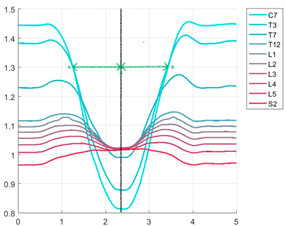
| Total displacement/ Range of Motion | The amount of displacement retrieved in the graph. |
| End | The quote of the profiles at the end of the movement with respect to the starting point quotes. |
| Symmetry | How many descending and ascending parts of the profile represent symmetric slopes with respect to the ideal vertical straight line crossing the profile at the maximum flexion position. |
| Pelvis centre position | The position of the pelvis centre with respect to S2 at the maximal flexion point. |
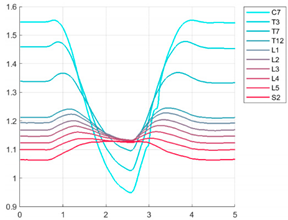
| Lateral Bending | |
| Feature | Description |
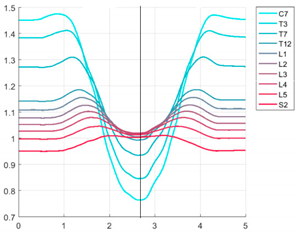
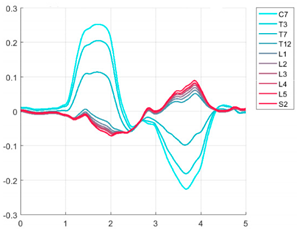
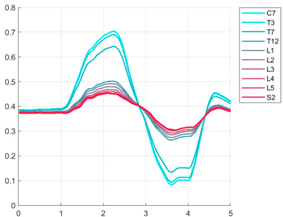
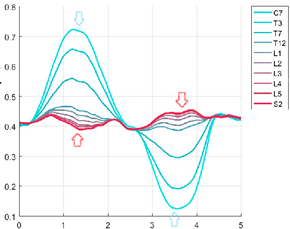
| Fluency | The shape of the time trajectory is configured without sudden stops, jumps, or discontinuities. This is when the execution of the measured movement is fluid both in its trajectory and in speed and acceleration. From an analytical point of view, the graphs show a continuous trend of the trajectory and its temporal derivatives that express the continuity of velocity and acceleration during the execution of the motor task and therefore the absence of sudden irregularities or intermittence in the movement. |
| Total displacement/ Range of Motion | The amount of displacement retrieved in the graph. |
| Symmetry | The amount of overlap between the descending and ascending part of each curve (right and left) in the graph. |
| Cervico-thoracic/lumbosacral reverse movement | The opposite trend trajectory of C7 and S2 lines during movement. |
| Pelvis centre position | The position of the pelvis with respect to the midpoint of each line of the graph. |
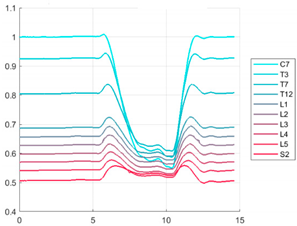
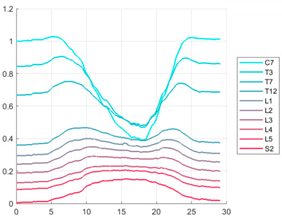
| Rotation | |
| Feature | Description |
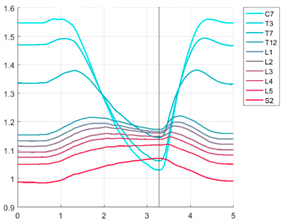
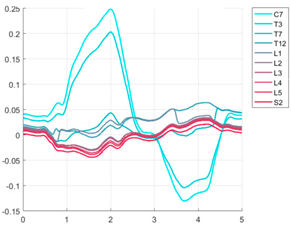
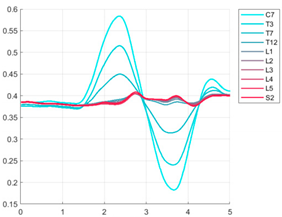
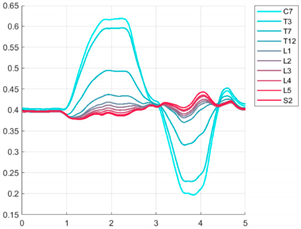
| Fluency | The shape of the time trajectory is configured without sudden stops, jumps, or discontinuities. This is when the execution of the measured movement is fluid both in its trajectory and in speed and acceleration. From an analytical point of view, the graphs show a continuous trend of the trajectory and its temporal derivatives that express the continuity of velocity and acceleration during the execution of the motor task and therefore the absence of sudden irregularities or intermittence in the movement |
| Total displacement/ Range of motion | The total amount of displacement is retrieved in the graph. |
| Symmetry | The amount of overlap between the descending and ascending part of each curve (right and left) in the graph. |
| End | The end height of the lines of the graph with respect to the starting point height. |
| Pelvis centre position | The position of the pelvis with respect to the midpoint of each line of the graph. |
| cLBP | Healthy | p | |
|---|---|---|---|
| Gender | 5F; 5M | 5F; 5M | - |
| Age (year) | 58 ± 16 | 22 ± 1 | 0.00 |
| Height (cm) | 168 ± 7 | 173 ± 6 | 0.20 |
| Weight (kg) | 75 ± 14 | 68 ± 8 | 0.20 |
| BMI (kg/m2) | 26 ± 4 | 23 ± 2 | 0.03 |
| NRS (baseline) | 5.5 ± 3 | // | |
| ODI (baseline) | 19 ± 8 | // |
| Movement | Average Interitem Covariance | Chronbach’s Alpha | Ranges |
|---|---|---|---|
| Flexion and return | 0.60 | 0.88 | 0.10–0.80 |
| Lateral bending | 0.61 | 0.88 | 0.21–0.80 |
| Rotation | 0.45 | 0.84 | 0.20–0.81 |
| ICC | 95%CI | |||
|---|---|---|---|---|
| IC | Intra-rater | Flexion and return | 0.99 | 0.98–1.00 |
| Lateral bending | 0.97 | 0.94–0.99 | ||
| Rotation | 0.95 | 0.88–0.98 | ||
| Inter-rater | Flexion and return | 0.72 | 0.36–0.89 | |
| Lateral bending | 0.78 | 0.53–0.91 | ||
| Rotation | 0.39 | −0.09–0.73 |
| cLBP T0 | cLBP T1 | Healthy | |
|---|---|---|---|
| Mean ± SD | Mean ± SD | Mean ± SD | |
| Overall flexion score | 6.3 ± 3.5 | 5.7 ± 1.9 | 2.8 ± 1.3 |
| Overall lateral bending score | 5.5 ± 2.9 | 5.4 ± 1.9 | 5.2 ± 1.4 |
| Overall rotation score | 6.4 ± 1.2 | 6.3 ± 1.9 | 4.3 ± 1.0 |
| Total movement score | 18.2 ± 6.3 * | 17.4 ± 5.3 + | 12.4 ± 1.9 |
| Measures | Baseline (T0) Mean (SD) | Follow-Up (T1) Mean (SD) | p-Value |
|---|---|---|---|
| Total movement score | 18.52 (7.74) | 21.2 (10.40) | 0.38 |
| ODI (%) | 19 (8.48) | 16 (11.06) | 0.27 |
| NRS | 5.5 (2.99) | 3.2 (2.04) | 0.07 |
Publisher’s Note: MDPI stays neutral with regard to jurisdictional claims in published maps and institutional affiliations. |
© 2022 by the authors. Licensee MDPI, Basel, Switzerland. This article is an open access article distributed under the terms and conditions of the Creative Commons Attribution (CC BY) license (https://creativecommons.org/licenses/by/4.0/).
Share and Cite
Negrini, S.; Pollet, J.; Ranica, G.; Donzelli, S.; Vanossi, M.; Piovanelli, B.; Amici, C.; Buraschi, R. Movement Analysis Could Help in the Assessment of Chronic Low Back Pain Patients: Results from a Preliminary Explorative Study. Int. J. Environ. Res. Public Health 2022, 19, 9033. https://doi.org/10.3390/ijerph19159033
Negrini S, Pollet J, Ranica G, Donzelli S, Vanossi M, Piovanelli B, Amici C, Buraschi R. Movement Analysis Could Help in the Assessment of Chronic Low Back Pain Patients: Results from a Preliminary Explorative Study. International Journal of Environmental Research and Public Health. 2022; 19(15):9033. https://doi.org/10.3390/ijerph19159033
Chicago/Turabian StyleNegrini, Stefano, Joel Pollet, Giorgia Ranica, Sabrina Donzelli, Massimiliano Vanossi, Barbara Piovanelli, Cinzia Amici, and Riccardo Buraschi. 2022. "Movement Analysis Could Help in the Assessment of Chronic Low Back Pain Patients: Results from a Preliminary Explorative Study" International Journal of Environmental Research and Public Health 19, no. 15: 9033. https://doi.org/10.3390/ijerph19159033
APA StyleNegrini, S., Pollet, J., Ranica, G., Donzelli, S., Vanossi, M., Piovanelli, B., Amici, C., & Buraschi, R. (2022). Movement Analysis Could Help in the Assessment of Chronic Low Back Pain Patients: Results from a Preliminary Explorative Study. International Journal of Environmental Research and Public Health, 19(15), 9033. https://doi.org/10.3390/ijerph19159033