
Elite Tennis Players Experiencing High-Arched Supination and Cuboids Dropped Foot Syndromes in Daily Normal Gait


Abstract
1. Introduction
2. Materials and Methods
2.1. Participants
2.2. Procedure
2.3. Instruments
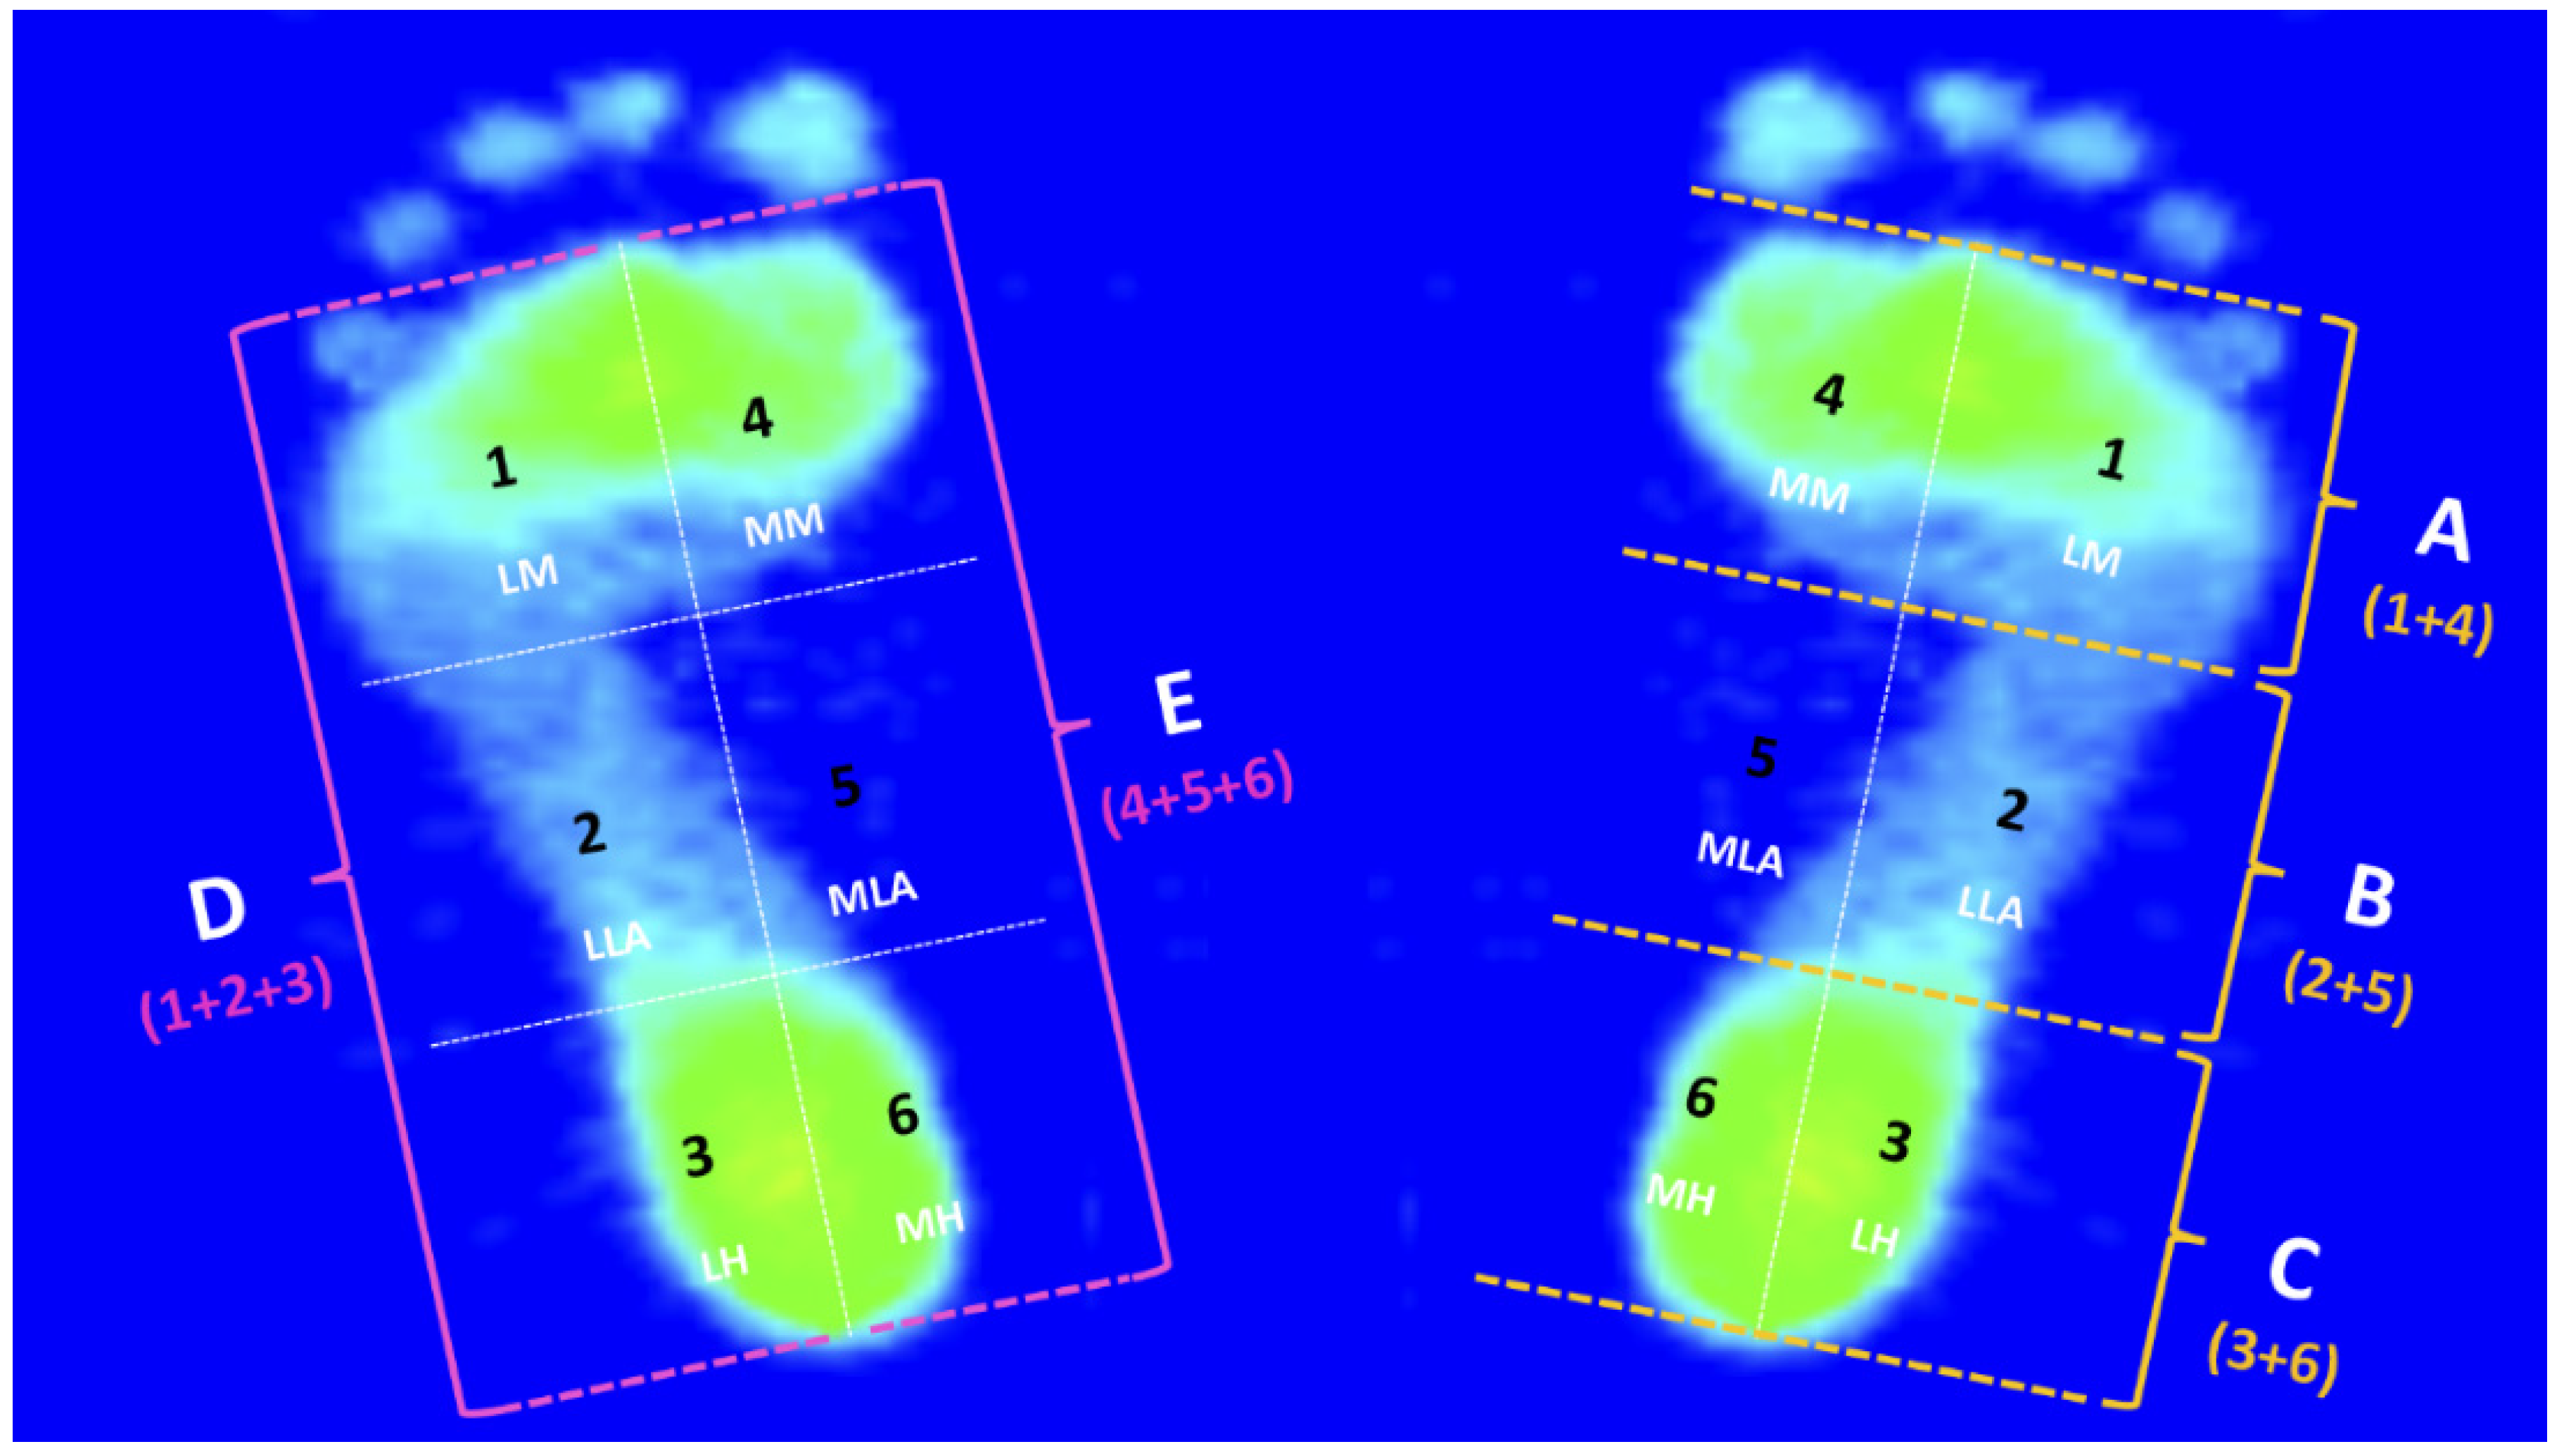
2.4. PPDs Assessment
- Participants were asked to first roll up their trouser legs above the knees to ensure that clothing did not restrict their movements;
- Barefoot stand in a natural posture, with arms hanging vertically at sides;
- Turn around at the end, and immediately walk to the starting point with a natural gait;
- Each participant will need to practice the above steps beforehand, and then enter the experiment after confirmation;
- Upon entering the experiment, each participant was instructed to perform several walking trials until at least three take-off paces were correctly acquired with the left and right foot (i.e., a single foot strikes the sensing cushion marked with the specific measurement range of the JC Mat).
2.5. PPDs Data Analysis
2.6. Rearfoot Postural Alignment Assessment
2.7. Statistical Analysis
3. Results
3.1. Bipedal Arch Index
3.2. The PPDs of the Five Regions of Both Feet during the Midstance Phase of Walking
3.3. The PPDs of the Six Subregions of Both Feet during the Midstance Phase of Walking
3.4. The Balance of the Centers of Gravity
3.5. Bipedal Rearfoot Postural Alignment
3.6. Characteristics of Footprints
4. Discussion
5. Conclusions
Author Contributions
Funding
Institutional Review Board Statement
Informed Consent Statement
Data Availability Statement
Acknowledgments
Conflicts of Interest
References
- Żurek, P.; Lipińska, P.; Antosiewicz, J.; Durzynska, A.; Zieliński, J.; Kusy, K.; Ziemann, E. Planned Physical Workload in Young Tennis Players Induces Changes in Iron Indicator Levels but Does Not Cause Overreaching. Int. J. Environ. Res. Public Health 2022, 19, 3486. [Google Scholar] [CrossRef] [PubMed]
- Arora, A.; Doshi, S. Injury profile of professional Indian tennis players. Int. J. Health Sci. Res. 2017, 7, 202–209. [Google Scholar]
- Fu, M.C.; Ellenbecker, T.S.; Renstrom, P.A.; Windler, G.S.; Dines, D.M. Epidemiology of injuries in tennis players. Curr. Rev. Musculoskelet. Med. 2018, 11, 1–5. [Google Scholar] [CrossRef] [PubMed]
- Verhagen, E.; Clarsen, B.; Capel-Davies, J.; Collins, C.; Derman, W.; De Winter, D.; Dunn, N.; Ellenbecker, T.S.; Forde, R.; Hainline, B.; et al. Tennis-specific extension of the International Olympic Committee consensus statement: Methods for recording and reporting of epidemiological data on injury and illness in sport 2020. Br. J. Sports Med. 2020, 55, 9–13. [Google Scholar] [CrossRef] [PubMed]
- Robison, H.J.; Boltz, A.J.; Morris, S.N.; Collins, C.L.; Chandran, A.J. Epidemiology of injuries in National Collegiate Athletic Association men’s tennis: 2014–2015 Through 2018–2019. J. Athl. Train. 2021, 56, 773–779. [Google Scholar] [CrossRef]
- Domeracki, S.J. Tennis leg: A state-of-the-science review. Workplace Health Saf. 2021, 69, 182–186. [Google Scholar] [CrossRef]
- Kibler, W.B.; Safran, M. Tennis injuries. Med. Sport Sci. 2005, 48, 120–137. [Google Scholar]
- Hess, G.W. Achilles tendon rupture: A review of etiology, population, anatomy, risk factors, and injury prevention. Foot Ankle Spec. 2010, 3, 29–32. [Google Scholar] [CrossRef]
- Kaiser, P.; Stock, K.; Benedikt, S.; Ellenbecker, T.; Kastenberger, T.; Schmidle, G.; Arora, R. Acute tennis injuries in the recrea-tional tennis player. Orthop. J. Sports Med. 2021, 9, 2325967120973672. [Google Scholar] [CrossRef]
- Lucas, R.; Cornwall, M. Influence of foot posture on the functioning of the windlass mechanism. Foot 2017, 30, 38–42. [Google Scholar] [CrossRef]
- Park, S.-Y.; Park, D.-J. Comparison of Foot Structure, Function, Plantar Pressure and Balance Ability According to the Body Mass Index of Young Adults. Osong Public Health Res. Perspect. 2019, 10, 102–107. [Google Scholar] [CrossRef] [PubMed]
- Zhang, C.; Pan, S.; Qi, Y.; Yang, Y. A Footprint Extraction and Recognition Algorithm Based on Plantar Pressure. Trait. Signal 2019, 36, 419–424. [Google Scholar] [CrossRef]
- Truong, P.; You, S.; Ji, S.-H.; Jeong, G.-M. Adaptive Accumulation of Plantar Pressure for Ambulatory Activity Recognition and Pedestrian Identification. Sensors 2021, 21, 3842. [Google Scholar] [CrossRef] [PubMed]
- Monteiro, R.L.; Sartor, C.D.; Ferreira, J.S.S.P.; Dantas, M.G.B.; Bus, S.A.; Sacco, I.C.N. Protocol for evaluating the effects of a foot-ankle therapeutic exercise program on daily activity, foot-ankle functionality, and biomechanics in people with diabetic polyneuropathy: A randomized controlled trial. BMC Musculoskelet. Disord. 2018, 19, 400. [Google Scholar] [CrossRef] [PubMed]
- Szczepanowska-Wolowiec, B.; Sztandera, P.; Kotela, I.; Zak, M. Vulnerability of the foot’s morphological structure to deform-ities caused by foot loading paradigm in school-aged children: A cross-sectional study. Sci. Rep. 2021, 11, 2749. [Google Scholar] [CrossRef]
- Cen, X.; Lu, Z.; Baker, J.; István, B.; Gu, Y. A Comparative biomechanical analysis during planned and unplanned gait ter-mination in individuals with different arch stiffnesses. Appl. Sci. 2021, 11, 1871. [Google Scholar] [CrossRef]
- Zhang, B.; Lu, Q. A Current Review of Foot Disorder and Plantar Pressure Alternation in the Elderly. Phys. Act. Health 2020, 4, 95–106. [Google Scholar] [CrossRef]
- Nagano, K.; Okuyama, R.; Taniguchi, N.; Yoshida, T. Gender difference in factors affecting the medial longitudinal arch height of the foot in healthy young adults. J. Phys. Ther. Sci. 2018, 30, 675–679. [Google Scholar] [CrossRef]
- García-Pinillos, F.; Jaén-Carrillo, D.; Latorre-Román, P.; Escalona-Marfil, C.; Soto-Hermoso, V.; Lago-Fuentes, C.; Pueyo-Villa, S.; Domínguez-Azpíroz, I.; Roche-Seruendo, L. Does Arch Stiffness Influence Running Spatiotemporal Parameters? An Analysis of the Relationship between Influencing Factors on Running Performance. Int. J. Environ. Res. Public Health 2021, 18, 2437. [Google Scholar] [CrossRef]
- Carroll, L.; Paulseth, S.; Martin, R.L. Forefoot Injuries in Athletes: Integration of the Movement System. Int. J. Sports Phys. Ther. 2022, 17, 81–89. [Google Scholar] [CrossRef]
- Chow, T.-H.; Chen, Y.-S.; Tsai, W.-C.; Lin, M.-H. Plantar Pressure Profiles and Possible Foot Syndromes of Taiwanese College Elite Basketball Players. J. Am. Podiatr. Med. Assoc. 2021, 111, 5. [Google Scholar] [CrossRef] [PubMed]
- Chow, T.H.; Chen, Y.S.; Hsu, C.C.; Hsu, C.H. Characteristics of plantar pressure with foot postures and lower limb pain profiles in Taiwanese college elite rugby league athletes. Int. J. Environ. Res. Public Health 2022, 19, 1158. [Google Scholar] [CrossRef] [PubMed]
- Lewson, E.B.; Pulsifer, M.S.E.; Mallette, J.P. Cuboid sling: A novel surgical repair of cuboid syndrome and literature review. Foot Ankle Surg. Tech. Rep. Cases 2021, 1, 100108. [Google Scholar] [CrossRef]
- Helili, M.; Geng, X.; Ma, X.; Chen, W.; Zhang, C.; Huang, J.; Wang, X. An investigation of regional plantar soft tissue hard-ness and its potential correlation with plantar pressure distribution in healthy adults. Appl. Bionics Biomech. 2021, 2021, 5566036. [Google Scholar] [CrossRef]
- Hébert-Losier, K.; Murray, L. Reliability of centre of pressure, plantar pressure, and plantar-flexion isometric strength measures: A systematic review. Gait Posture 2020, 75, 46–62. [Google Scholar] [CrossRef]
- Cațan, L.; Cerbu, S.; Amaricai, E.; Suciu, O.; Horhat, D.I.; Popoiu, C.M.; Adam, O.; Boia, E. Assessment of Static Plantar Pressure, Stabilometry, Vitamin D and Bone Mineral Density in Female Adolescents with Moderate Idiopathic Scoliosis. Int. J. Environ. Res. Public Health 2020, 17, 2167. [Google Scholar] [CrossRef]
- Girard, O.; Eicher, F.; Micallef, J.-P.; Millet, G. Plantar pressures in the tennis serve. J. Sports Sci. 2010, 28, 873–880. [Google Scholar] [CrossRef]
- Starbuck, C.; Damm, L.; Clarke, J.; Carre, M.; Capel-Davis, J.; Miller, S.; Stiles, V.; Dixon, S. The influence of tennis court surfaces on player perceptions and biomechanical response. J. Sports Sci. 2015, 34, 1627–1636. [Google Scholar] [CrossRef]
- Girard, O.; Micallef, J.-P.; Millet, G. Effects of the Playing Surface on Plantar Pressures During the First Serve in Tennis. Int. J. Sports Physiol. Perform. 2010, 5, 384–393. [Google Scholar] [CrossRef][Green Version]
- Eckl, M.; Kornfeind, P.; Baca, A. A comparison of plantar pressures between two different playing surfaces in tennis. ISBS Conf. Proc. Arch. 2011, 29, 601–604. [Google Scholar]
- Kornfeind, P.; Eckl, M.; Baca, A. A single step analysis of plantar pressure distribution in tennis specific movements. J. Hum. Sport Exerc. 2019, 14, 425–435. [Google Scholar] [CrossRef]
- Chow, T.H.; Chen, Y.S.; Wang, J.C. Characteristics of plantar pressures and related pain profiles in elite sprinters and recrea-tional runners. J. Am. Podiatr. Med. Assoc. 2018, 108, 33–44. [Google Scholar] [CrossRef] [PubMed]
- Chow, T.-H.; Chen, Y.-S.; Hsu, C.-C. Relationships between Plantar Pressure Distribution and Rearfoot Alignment in the Taiwanese College Athletes with Plantar Fasciopathy during Static Standing and Walking. Int. J. Environ. Res. Public Health 2021, 18, 12942. [Google Scholar] [CrossRef] [PubMed]
- Wang, J.-C.; Dommati, H.; Cheng, J. A Turnkey Manufacturing Solution for Customized Insoles Using Material Extrusion Process. In 3D Printing and Additive Manufacturing Technologies; Springer: Singapore, 2019; pp. 203–216. [Google Scholar] [CrossRef]
- Zhao, Y.; Zheng, D.; Yan, S.; Liu, M.; Yang, L. Children with Obesity Experience Different Age-Related Changes in Plantar Pressure Distributions: A Follow-Up Study in China. Int. J. Environ. Res. Public Health 2020, 17, 6602. [Google Scholar] [CrossRef]
- Lee, H.; Ishikawa, H.; Shibuya, T.; Takai, C.; Nemoto, T.; Nomura, Y.; Abe, A.; Otani, H.; Ito, S.; Nakazono, K.; et al. The Combination of Modified Mitchell’s Osteotomy and Shortening Oblique Osteotomy for Patients with Rheumatoid Arthritis: An Analysis of Changes in Plantar Pressure Distribution. Int. J. Environ. Res. Public Health 2021, 18, 9948. [Google Scholar] [CrossRef]
- Hawrylak, A.; Brzeźna, A.; Chromik, K. Distribution of Plantar Pressure in Soccer Players. Int. J. Environ. Res. Public Health 2021, 18, 4173. [Google Scholar] [CrossRef]
- Cavanagh, P.R.; Rodgers, M.M. The arch index: A useful measure from footprints. J. Biomech. 1987, 20, 547–551. [Google Scholar] [CrossRef]
- Ribeiro, A.P.; Sacco, I.C.N.; Dinato, R.C.; João, S.M.A. Relationships between static foot alignment and dynamic plantar loads in runners with acute and chronic stages of plantar fasciitis: A cross-sectional study. Braz. J. Phys. Ther. 2016, 20, 87–95. [Google Scholar] [CrossRef]
- Cornwall, M.W.; McPoil, T.G. Influence of rearfoot postural alignment on rearfoot motion during walking. Foot 2004, 14, 133–138. [Google Scholar] [CrossRef]
- Duan, Y.; Ren, W.; Liu, W.; Li, J.; Pu, F.; Jan, Y.K. Relationship between plantar tissue hardness and plantar pressure distri-butions in people with diabetic peripheral neuropathy. Front. Bioeng. Biotechnol. 2022, 10, 836018. [Google Scholar] [CrossRef]
- Keatsamarn, T.; Visitsattapongse, S.; Aoyama, H.; Pintavirooj, C. Optical-Based Foot Plantar Pressure Measurement System for Potential Application in Human Postural Control Measurement and Person Identification. Sensors 2021, 21, 4437. [Google Scholar] [CrossRef] [PubMed]
- Gerrard, J.M.; Bonanno, D.R.; Whittaker, G.A.; Landorf, K.B. Effect of different orthotic materials on plantar pressures: A systematic review. J. Foot Ankle Res. 2020, 13, 35. [Google Scholar] [CrossRef] [PubMed]
- Sudhakar, S.; Kirthika, S.V.; Padmanabhan, K.; Kumar, G.M.; Nathan, C.S.; Gopika, R.; Samuel, A.J. Impact of various foot arches on dynamic balance and speed performance in collegiate short distance runners: A cross-sectional comparative study. J. Orthop. 2018, 15, 114–117. [Google Scholar] [CrossRef]
- Chang, Y.W.; Hung, W.; Wu, H.W.; Chiu, Y.C.; Hsu, H.C. Measurements of foot arch in standing, level walking, vertical jump and sprint start. Int. J. Sport Exerc. Sci. 2010, 2, 31–38. [Google Scholar]
- Martínez-Nova, A.; Gómez-Blázquez, E.; Escamilla-Martínez, E.; Pérez-Soriano, P.; Gijon-Nogueron, G.; Fernández-Seguín, L.M. The Foot Posture Index in Men Practicing Three Sports Different in Their Biomechanical Gestures. J. Am. Podiatr. Med. Assoc. 2014, 104, 154–158. [Google Scholar] [CrossRef] [PubMed]
- Netto, C.D.C.; Bernasconi, A.; Roberts, L.; Pontin, P.A.; Lintz, F.; Saito, G.H.; Roney, A.; Elliott, A.; O’Malley, M. Foot Alignment in Symptomatic National Basketball Association Players Using Weightbearing Cone Beam Computed Tomography. Orthop. J. Sports Med. 2019, 7. [Google Scholar] [CrossRef]
- Hertel, J.; Gay, M.R.; Denegar, C.R. Differences in Postural Control During Single-Leg Stance Among Healthy Individuals With Different Foot Types. J. Athl. Train. 2002, 37, 129–132. [Google Scholar]
- Tsai, L.-C.; Yu, B.; Mercer, V.S.; Gross, M.T. Comparison of Different Structural Foot Types for Measures of Standing Postural Control. J. Orthop. Sports Phys. Ther. 2006, 36, 942–953. [Google Scholar] [CrossRef]
- Justine, M.; Ruzali, D.; Hazidin, E.; Said, A.; Bukry, S.A.; Manaf, H. Range of motion, muscle length, and balance performance in older adults with normal, pronated, and supinated feet. J. Phys. Ther. Sci. 2016, 28, 916–922. [Google Scholar] [CrossRef]
- Mulhern, J.L.; Protzman, N.M.; Brigido, S.A. Tibialis Anterior Tendon Transfer. Clin. Podiatr. Med. Surg. 2016, 33, 41–53. [Google Scholar] [CrossRef]
- Cote, K.P.; Brunet, M.; Gansneder, B.M.; Shultz, S.J. Effects of Pronated and Supinated Foot Postures on Static and Dynamic Postural Stability. J. Athl. Train. 2005, 40, 41–46. [Google Scholar] [PubMed]
- Angın, S.; ilçin, N.; Yeşilyaprak, S.S.; Şimşek, I.E. Tek ayak üzerinde durus¸ta postural salınım hızının ayak postur indeksi, ayak büyüklügü ve plantar basınç degerleri ile tahmini. Jt. Dis. Relat. Surg. 2013, 24, 144–148. [Google Scholar]
- Beelen, P.E.; Kingma, I.; Nolte, P.A.; van Dieën, J.H. The effect of foot type, body length and mass on postural stability. Gait Posture 2020, 81, 241–246. [Google Scholar] [CrossRef]
- Barut, C.; Ozer, C.M.; Sevinc, O.; Gumus, M.; Yunten, Z. Relationships between Hand and Foot Preferences. Int. J. Neurosci. 2007, 117, 177–185. [Google Scholar] [CrossRef]
- Packheiser, J.; Schmitz, J.; Berretz, G.; Carey, D.P.; Paracchini, S.; Papadatou-Pastou, M.; Ocklenburg, S. Four meta-analyses across 164 studies on atypical footedness prevalence and its relation to handedness. Sci. Rep. 2020, 10, 14501. [Google Scholar] [CrossRef]
- Tran, U.S.; Stieger, S.; Voracek, M. Evidence for general right-, mixed-, and left-sidedness in self-reported handedness, footedness, eyedness, and earedness, and a primacy of footedness in a large-sample latent variable analysis. Neuropsychologia 2014, 62, 220–232. [Google Scholar] [CrossRef] [PubMed]
- Tran, U.S.; Stieger, S.; Voracek, M. Mixed-footedness is a more relevant predictor of schizotypy than mixed-handedness. Psychiatry Res. 2015, 225, 446–451. [Google Scholar] [CrossRef]


| Characteristic | Recreational Group 1 (n = 100) | Elite Group 2 (n = 95) |
|---|---|---|
| Age (years) | 19.8 ± 0.9 | 20.2 ± 1.2 |
| Height (cm) | 170.7 ± 4.2 | 176.0 ± 5.3 * |
| Mass (kg) | 67.7 ± 3.7 | 71.0 ± 5.7 * |
| BMI (m/kg) | 23.2 ± 0.6 | 22.9 ± 0.9 * |
| Tennis training experience (years) | 2.7 ± 0.6 | 4.9 ± 0.9 |
| Recreational Group (n = 100) | Elite Group (n = 95) | p Value 1 | |
|---|---|---|---|
| Left foot | 0.21 ± 0.06 | 0.18 ± 0.08 | 0.011 |
| Right foot | 0.21 ± 0.04 | 0.18 ± 0.06 | < 0.01 |
| Five Regions | Recreational Group (n = 100) | Elite Group (n = 95) | p Value 1 |
|---|---|---|---|
| Left foot | |||
| Forefoot (%) | 21.67 ± 3.11 | 20.86 ± 3.87 | 0.018 |
| Midfoot (%) | 11.37 ± 10.48 | 12.23 ± 11.58 | <0.01 |
| Rearfoot (%) | 16.97 ± 4.72 | 16.91 ± 8.97 | <0.01 |
| Lateral foot (%) | 21.43 ± 3.60 | 23.34 ± 3.90 | 0.328 |
| Medial foot (%) | 11.91 ± 8.46 | 9.99 ± 8.55 | 0.671 |
| Right foot | |||
| Forefoot (%) | 21.08 ± 2.66 | 19.59 ± 3.30 | <0.01 |
| Midfoot (%) | 11.91 ± 10.66 | 12.59 ± 11.76 | <0.01 |
| Rearfoot (%) | 17.03 ± 5.16 | 17.82 ± 9.40 | <0.01 |
| Lateral foot (%) | 21.42 ± 3.16 | 24.03 ± 3.53 | 0.018 |
| Medial foot (%) | 11.94 ± 8.44 | 9.30 ± 7.38 | <0.01 |
| Six Subregions | Recreational Group (n = 100) | Elite Group (n = 95) | ||
|---|---|---|---|---|
| Left Foot (%) | Right Foot (%) | Left Foot (%) | Right Foot (%) | |
| Lateral Metatarsal bone (LM) | 22.37 ± 3.04 | 21.16 ± 2.70 | 21.06 ± 3.82 | 21.07 ± 2.72 |
| Lateral Longitudinal Arch (LLA) | 21.37 ± 4.31 | 22.37 ± 2.54 | 23.59 ± 2.92 2 | 24.19 ± 2.44 2 |
| Lateral Heel (LH) | 20.71 ± 2.96 | 20.72 ± 3.87 | 25.37 ± 3.66 2 | 26.84 ± 2.73 2 |
| Medial Metatarsal bone (MM) | 20.97 ± 3.03 | 21.01 ± 2.62 | 20.67 ± 3.93 2 | 18.11 ± 3.18 1 |
| Medial Longitudinal Arch (MLA) | 1.37 ± 0.42 | 1.46 ± 1.17 | 0.87 ± 0.35 2 | 1.00 ± 0.33 1 |
| Medial Heel (MH) | 13.36 ± 3.04 | 13.29 ± 3.38 | 8.45 ± 1.96 2 | 8.81 ± 2.42 2 |
| Recreational Group | Elite Group | p Value 1 | p Value 2 | p Value 3 | |
|---|---|---|---|---|---|
| Left foot (%) | 49.03 ± 3.09 | 48.48 ± 4.09 | <0.01 | 1.000 | 1.000 |
| Right foot (%) | 50.97 ± 3.09 | 51.52 ± 4.09 | <0.01 | -- | -- |
| Recreational Group (n = 100) | Elite Group (n = 95) | p Value 1 | |
|---|---|---|---|
| Left foot (deg.) | 2.42 ± 2.84 | −2.13 ± 3.57 | 0.013 |
| Right foot (deg.) | 1.74 ± 3.01 | −2.74 ± 3.14 | 0.004 |
Publisher’s Note: MDPI stays neutral with regard to jurisdictional claims in published maps and institutional affiliations. |
© 2022 by the authors. Licensee MDPI, Basel, Switzerland. This article is an open access article distributed under the terms and conditions of the Creative Commons Attribution (CC BY) license (https://creativecommons.org/licenses/by/4.0/).
Share and Cite
Chow, T.-H.; Hsu, C.-C. Elite Tennis Players Experiencing High-Arched Supination and Cuboids Dropped Foot Syndromes in Daily Normal Gait. Int. J. Environ. Res. Public Health 2022, 19, 8897. https://doi.org/10.3390/ijerph19158897
Chow T-H, Hsu C-C. Elite Tennis Players Experiencing High-Arched Supination and Cuboids Dropped Foot Syndromes in Daily Normal Gait. International Journal of Environmental Research and Public Health. 2022; 19(15):8897. https://doi.org/10.3390/ijerph19158897
Chicago/Turabian StyleChow, Tong-Hsien, and Chin-Chia Hsu. 2022. "Elite Tennis Players Experiencing High-Arched Supination and Cuboids Dropped Foot Syndromes in Daily Normal Gait" International Journal of Environmental Research and Public Health 19, no. 15: 8897. https://doi.org/10.3390/ijerph19158897
APA StyleChow, T.-H., & Hsu, C.-C. (2022). Elite Tennis Players Experiencing High-Arched Supination and Cuboids Dropped Foot Syndromes in Daily Normal Gait. International Journal of Environmental Research and Public Health, 19(15), 8897. https://doi.org/10.3390/ijerph19158897