Article

Socioeconomic Status and Distance to Reference Centers for Complex Cancer Diseases: A Source of Health Inequalities? A Population Cohort Study Based on Catalonia (Spain)

1
Catalonian Cancer Strategy, Department of Health, Government of Catalonia, Avenida Gran Via de l’Hospitalet, 199-203, 08908 L’Hospitalet de Llobregat, Spain
2
Biomedical Research Institute of Bellvitge (IDIBELL), University of Barcelona, C/Feixa Llarga, s/n, 08907 L’Hospitalet de Llobregat, Spain
3
Cartographic and Geological Institute of Catalonia, Parc de Montjuïc, 08038 Barcelona, Spain
4
Health Service Procurement and Assessment, Catalonian Health Service (CatSalut), Government of Catalonia, Travessera de les Corts, 131-159, 08028 Barcelona, Spain
5
Healthcare Information and Knowledge Unit, Department of Health, Government of Catalonia, Gran Via de les Corts Catalanes, 591, 08007 Barcelona, Spain
6
Digitalization for the Sustainability of the Healthcare System (DS3), Sistema de Salut de Catalunya, Government of Catalonia, Gran Via de les Corts Catalanes, 591, 08007 Barcelona, Spain
7
Subdirectorate-General for the Service Portfolio and Health Map, Directorate-General for Health Planning, Department of Health, Government of Catalonia, Travessera de les Corts, 131-159, 08028 Barcelona, Spain
*
Author to whom correspondence should be addressed.
Int. J. Environ. Res. Public Health 2022, 19(14), 8814; https://doi.org/10.3390/ijerph19148814
Submission received: 13 June 2022 / Revised: 13 July 2022 / Accepted: 15 July 2022 / Published: 20 July 2022
(This article belongs to the Special Issue Equity, Access and Use of Health Care Services)

Abstract

:
The centralization of complex surgical procedures for cancer in Catalonia may have led to geographical and socioeconomic inequities. In this population-based cohort study, we assessed the impacts of these two factors on 5-year survival and quality of care in patients undergoing surgery for rectal cancer (2011–12) and pancreatic cancer (2012–15) in public centers, adjusting for age, comorbidity, and tumor stage. We used data on the geographical distance between the patients’ homes and their reference centers, clinical patient and treatment data, income category, and data from the patients’ district hospitals. A composite ‘textbook outcome’ was created from five subindicators of hospitalization. We included 646 cases of pancreatic cancer (12 centers) and 1416 of rectal cancer (26 centers). Distance had no impact on survival for pancreatic cancer patients and was not related to worse survival in rectal cancer. Compared to patients with medium–high income, the risk of death was higher in low-income patients with pancreatic cancer (hazard ratio (HR) 1.46, 95% confidence interval (CI) 1.15–1.86) and very-low-income patients with rectal cancer (HR 5.14, 95% CI 3.51–7.52). Centralization was not associated with worse health outcomes in geographically dispersed patients, including for survival. However, income level remained a significant determinant of survival.

1. Introduction

According to the Institute of Medicine, “health equity implies providing care of the same quality to all people, regardless of gender, ethnicity, geographic location, socioeconomic status, or other personal characteristics” [1]. The reference to the distance that separates patients from health services is apt, as geographical factors have generated situations of health inequity among patients, especially those with complex or low-incidence cancers that require treatment in specialized centers [2,3].
However, distance is a concept that must be understood in relative rather than absolute terms. For example, the distance to an expert center may be modulated by the family support that patients have or by the views of professionals from non-expert centers on the advisability of referring patients with advanced age or high comorbidity to distant treatment centers. Given that the mechanisms that would hypothetically explain how geographic factors impact cancer survival are complex and multidimensional [4], they must be specifically evaluated in each health system according to the territorial distribution of the population and the reference centers.
These issues are subject to active debate in the context of cancer care policies involving the centralization of highly complex therapies [5,6,7]. Such policies aim to reduce clinical practice variability and differences in quality that are not justified by the clinical situation or tumor subtype [8]. Numerous European strategies indicate the need for a limited number of specialized, multidisciplinary teams to take on cases of pathologies such as pancreatic cancer [9] or sarcoma [10], as well as other more common ones, such as breast cancer or other tumours with extensive care and resource requirements [11]. Such care scenarios increase the distance that many patients have to travel to reach reference centers and units, so the sought-after improvement in effectiveness may be countered by a negative impact on equity of access. In fact, different studies have shown how geographical distance can impact the probability of undergoing a full range of cancer treatments and the chances of survival [12,13,14].
Catalonia (Spain) began to implement a centralization policy for 20 procedures and highly complex cancer diseases in 2012 [15]. The legislation underpinning this policy [16] (approved in 2012 and updated in 2018) identified and authorized the so-called reference centers, which had to meet minimum annual thresholds of patients treated with a curative intent (e.g., 50 cases for lung cancer, 11 cases for rectal cancer, and 10 cases for pancreatic cancer). All other hospitals were obliged to refer their patients to the nearest reference center to receive care [15]. For sarcoma, this policy led to a consolidation of service provision from 20 centers to 4, and for esophageal cancer surgery, from 18 to 5.
However, certain characteristics of the reform and of the health system itself have given rise to potential equity problems. From the outset, the creation of reference centers was not accompanied by specific time targets for transitioning patients between hospitals or specific regulations on the roles of non-expert centers in diagnosis and tumor staging. Likewise, the policy did not establish the need to have a shared, interhospital clinical protocol, for example, specifying which center should manage postsurgical complications and how; these details were left to the centers to organize themselves. Moreover, existing patient care financing mechanisms (e.g., for travel and lodging) [17] were not related to the reform and were limited in scope. The referral process itself was critical due to potential problems related to the duplication of radiological tests or the interoperability of computer systems, which could end up causing delays and worsening tumor stage at diagnosis [18].
Taking these considerations as a starting point, the hypothesis of this study is that the centralization of highly complex surgical procedures in Catalonia led to inequities based on the distance between patients’ homes and reference centers, as well as their socioeconomic positions. Thus, our aim is to assess the distance from the patients’ homes to the reference centers and their socioeconomic statuses in relation to survival, adjusting for factors such as age, comorbidity, and tumor stage at diagnosis in people with centralized oncological pathologies in Catalonia.

2. Methods

2.1. Healthcare Setting
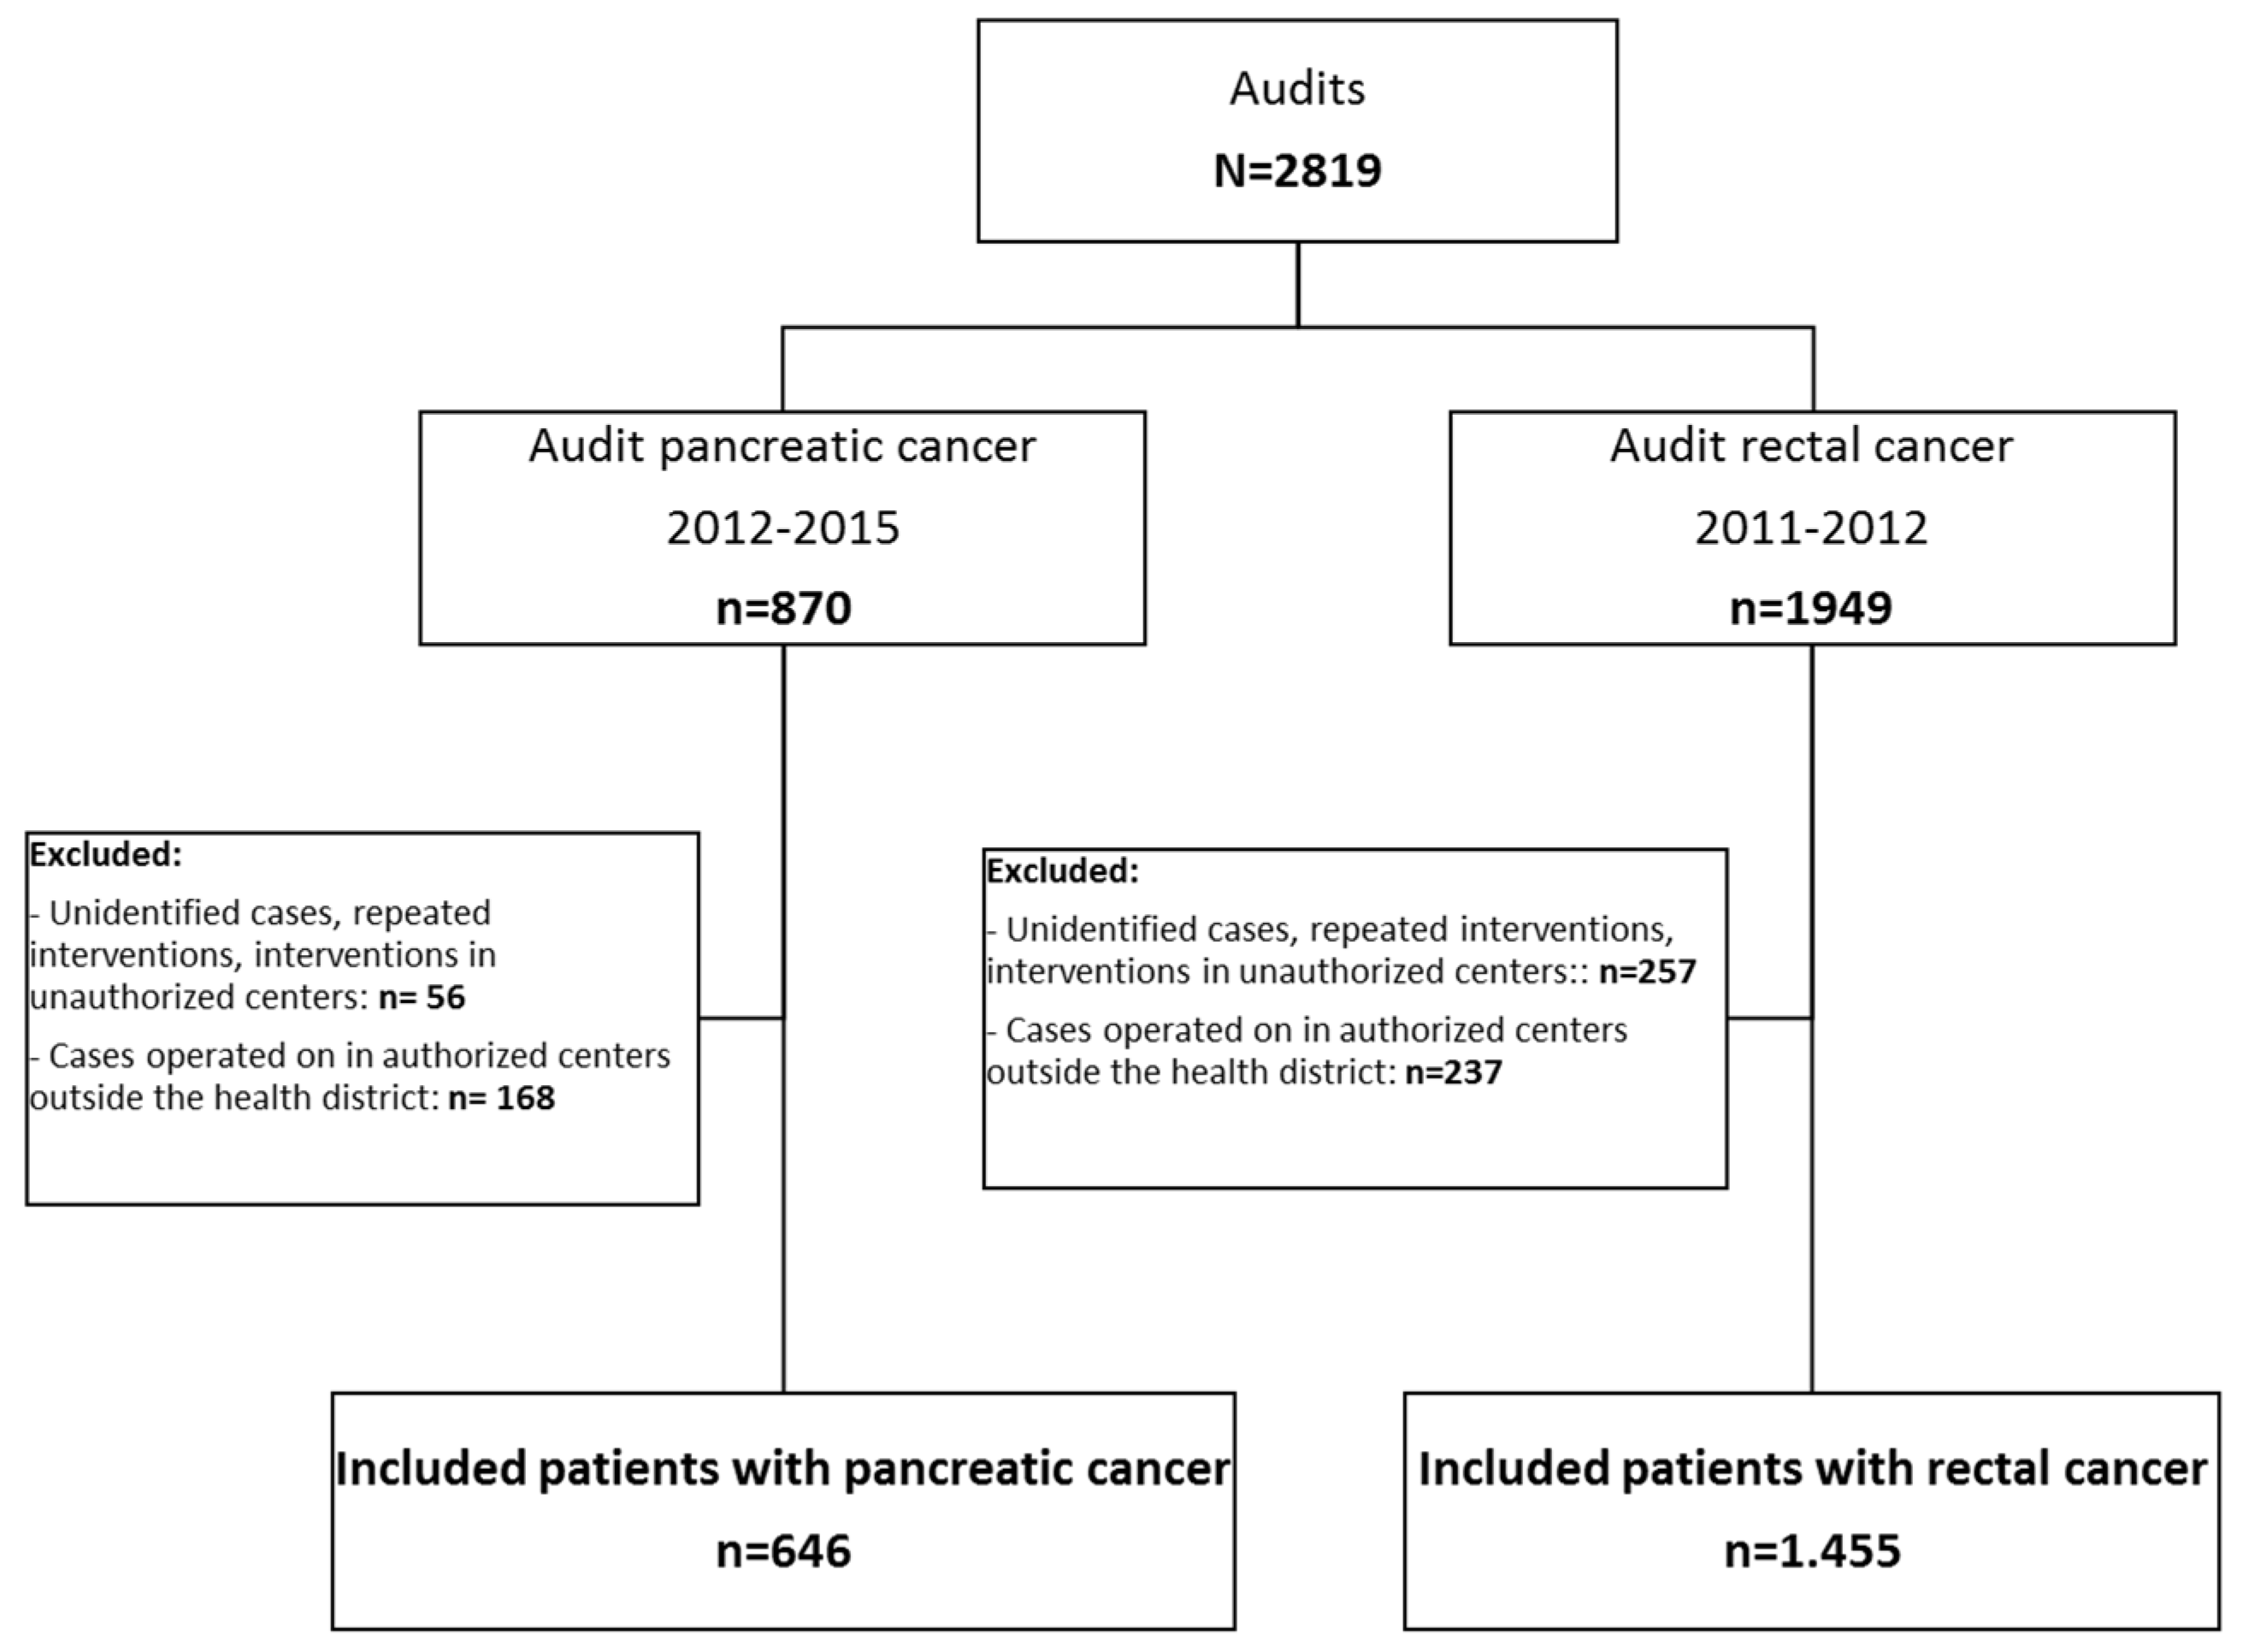
The study took place in Catalonia, Spain (pop. 7.7 million), which follows a national health service model characterized by a purchaser–provider split. The public agency (CatSalut) plays a key role in contracting health services from hospitals. Within the comprehensive healthcare system of Catalonia (SISCAT), there are 68 publicly funded centers that deliver hospital care and participate to some extent in cancer care. Eleven of these have radiotherapy units, and three have satellite services (i.e., linear accelerators controlled by the former). About 10% to 15% of cancer procedures are delivered by private providers. Catalonia is a small (31,895 km2), densely populated region (242.26 inhabitants/km²), with metropolitan Barcelona (with 1937.4 inhabitants/km2) standing out from the rest, including the Pyrenees mountain range.
The centralization decree [16] reorganized the field of highly complex cancer care, giving reference centers the exclusive competency to perform certain surgical interventions, such as rectal or pancreatic cancer surgery, and to assume responsibility for the whole care process—including diagnosis, therapy, and follow-up—for some specific pathologies and conditions, such as pediatric oncology (restricted to two reference centers). Centralization is based on a model combining the accreditation of centers with an external quality assessment system based on clinical audits [19,20]. The results of the clinical audits—implemented by the Catalan Cancer Plan and CatSalut—have led to the revocation of reference center status for some hospitals.

2.2. Study Design

We designed a population-based cohort study in patients treated with a curative intent using four types of related data sources: (1) data on the geographical distance between the patients’ homes and their reference center, calculated by the Cartographic and Geological Institute of Catalonia; (2) clinical patient and treatment data from clinical audits (one in rectal cancer and two in pancreatic cancer), including the surgical center; (3) patients’ income categories, based on the pharmacy copayment level (this categorization is determined according to declared income on individual tax returns); and (4) data from the patients’ district hospitals in cases where this center was not a reference center in pancreatic or rectal cancer.
We focused on rectal and pancreatic cancer because of two related factors. First, these pathologies present very different degrees of centralization, with a reduction from 20 to 12 centers for pancreatic cancer and from 51 to 27 centers for rectal cancer. Secondly, surgery for pancreatic cancer is one of the most technically complex and risky surgical interventions performed, while surgery for rectal cancer is a common practice but is considered at the lower limit of a “high complexity” procedure in oncology [9].

2.3. Population

All patients undergoing surgery with curative intent for rectal cancer (study period 2011–12) and pancreatic cancer (2012–15) in SISCAT centers were eligible. These patients were included in clinical audits carried out within the framework of the Catalan Cancer Plan and CatSalut’s reorganization strategy for tertiary care, which proposed the centralization of care for oncological pathologies and highly complex procedures in reference centers [2]. In order to specifically assess the impact of distance on survival, we excluded patients operated on in centers that were not reference centers or in reference centers that did not correspond to their health areas according to residence.

2.4. Variables

The data collected were: tumor stage based on the 7th edition of the TNM Classification of Malignant Tumours; physical status based on the American Society of Anaesthesiologists (ASA) physical status score; reference center; current vital status; distance from home to reference center; individual income based on pharmaceutical copayment category; and existence of a district hospital other than the reference center providing care for rectal and pancreatic cancer. In addition, we created a dichotomous, composite endpoint, textbook outcome, with the aim of summarizing the quality of care received in a single indicator (for both pathologies). We considered patients to have a textbook outcome if they met five conditions selected by the research team based on the existing literature [21,22]:
  • Absence of emergency admission;
  • Length of hospital stay not exceeding the 75th percentile;
  • No reintervention within 90 days of the first surgical treatment;
  • Lack of postsurgical complication within 30 days of the first surgical treatment;
  • Radical resection (pancreas: R0; rectum: total mesorectal excision).
Socioeconomic status (SES) was considered an exposure of interest, as proxied by an indicator of annual individual income (tax return) and receipt of welfare assistance. The Catalan Health Surveillance system database collects and updates data on annual income. Four individual-level SES categories were defined: “high SES” (annual income > EUR 100,000 /year); “medium SES” (EUR 18,000–100,000/year); “low SES” (<EUR 18,000/year); and “very low SES” (individuals receiving welfare support from the government). These categories were based on the income groups that determine drug copayments nationally (due to the small count of “high SES” for the analysis, we decided to pool the high and medium SES categories). Both working-age and retired individuals were included in this classification [23].

2.5. Statistical Analyses

The main clinical, socioeconomic, and geographical characteristics of the included patients were expressed as medians and interquartile ranges (IQRs) in the case of quantitative data and as numbers of patients and percentages in the case of qualitative data. The Cox proportional hazards model was used to calculate hazard ratios (HR) with 95% confidence intervals (CIs) in the uni- and multivariate analyses of mortality at 5 years. Time to death was assessed using Kaplan–Meier curves. A log-rank test was used to compare mortality between the study groups.
Finally, we performed a subanalysis of the 237 cases of rectal cancer and the 168 cases of pancreatic cancer operated on in authorized centers outside the patients’ health districts.
Statistical analyses were performed using SPSS software (version 21), while QGIS software (QGIS, Grüt, Swiss) was used to calculate the distance from the patients’ homes to the corresponding reference centers according to the centralization strategy. This software also enabled a graphical representation of the distribution of distances in the region. This study was approved by the institutional ethics committee at Bellvitge (PR177/18). It was funded by the Carlos III Health Institute (ISCIII) in the 2019 call for Health Research Projects (PI18/01835).

3. Results

A total of 2819 patients were initially deemed eligible. Figure 1 presents a patient flow chart and details the causes of exclusion. Altogether, 25% of the cases included in the audits were treated in authorized centers outside the patients’ health districts or in unauthorized centers. The final sample included 2101 patients: 646 with pancreatic cancer and 1455 with rectal cancer.
Table 1 describes patient characteristics according to the type of pathology. Most patients lived less than 10 km from the center where they were operated on. This percentage was higher in patients with rectal cancer (71.5%) compared to pancreatic cancer (58.8%). Regarding SES, the largest category was low SES, with 1468 patients (69.9%). The proportion of cases with very low SES was higher in rectal (4.8%) compared to pancreatic cancer (2.9%). Moreover, a higher proportion of patients with low income were women (pancreatic cancer: 81.3% vs. 64.6%, p < 0.001; rectal: 75.8% vs. 65.6%; p < 0.001), along with a lower proportion of patients with middle–high income (pancreatic cancer: 15% vs. 33%, p < 0.001; rectal: 18.9% vs. 29.9%, p < 0.001; Supplementary Table S1).
Surgery for pancreatic cancer took place in 12 centers and, for rectal cancer, in 27, reflecting differences in the centralization strategies between pathologies that condition the distance from patients’ homes to their treatment centers. In pancreatic cancer, the intermediate category for distance in deciles ranged from 10 km to 89 km, whereas in rectal cancer, it was 10 km to 30 km. Figure 2 and Figure 3 show the distribution of cases according to the patients’ home addresses and their reference centers for pancreatic and rectal cancer. In the first case, reference centers were present throughout the region, except for the Pyrenees area, where patients must travel further for treatment. A comparison of Figure 3a (all cases of rectal cancer) and Figure 3b (90th percentile and higher) showed that the 10% of rectal cancer patients who lived furthest away from their treatment centers were distributed evenly throughout the region. In pancreatic cancer, the 10% of patients travelling the longest distances were treated in just three reference centers. In patients with both pathologies, no significant differences were observed in tumor stage according to distance category (Table 2).
On the other hand, patients’ physical statuses did show significant differences according to distance, with a greater percentage of unknown values in the intermediate category in the case of rectal cancer (Table 2). In relation to income categories, no significant differences were observed in either pathology (Table 2). However, the median distance was greater in patients with low compared to medium–high income in both pathologies (pancreatic cancer: median 8.26 km (IQR 35.68) versus 5.4 km (IQR 18.14); rectal: 4.52 km (IQR 10.18) versus 3.94 km (IQR 7.44); Supplementary Table S2). Similarly, in rectal cancer, no significant differences were observed in the distribution of the distance category according to age group, but when distance was analyzed as a continuous variable, it was negatively correlated with age group: the older the patients, the less distance they had to travel (from a median of 5.63 km (IQR 9.83) in people under 60 to 3.75 km (IQR 7.66) in those aged 80 years or older; p = 0.019). These differences were not observed in the case of pancreatic cancer (Supplementary Table S2).

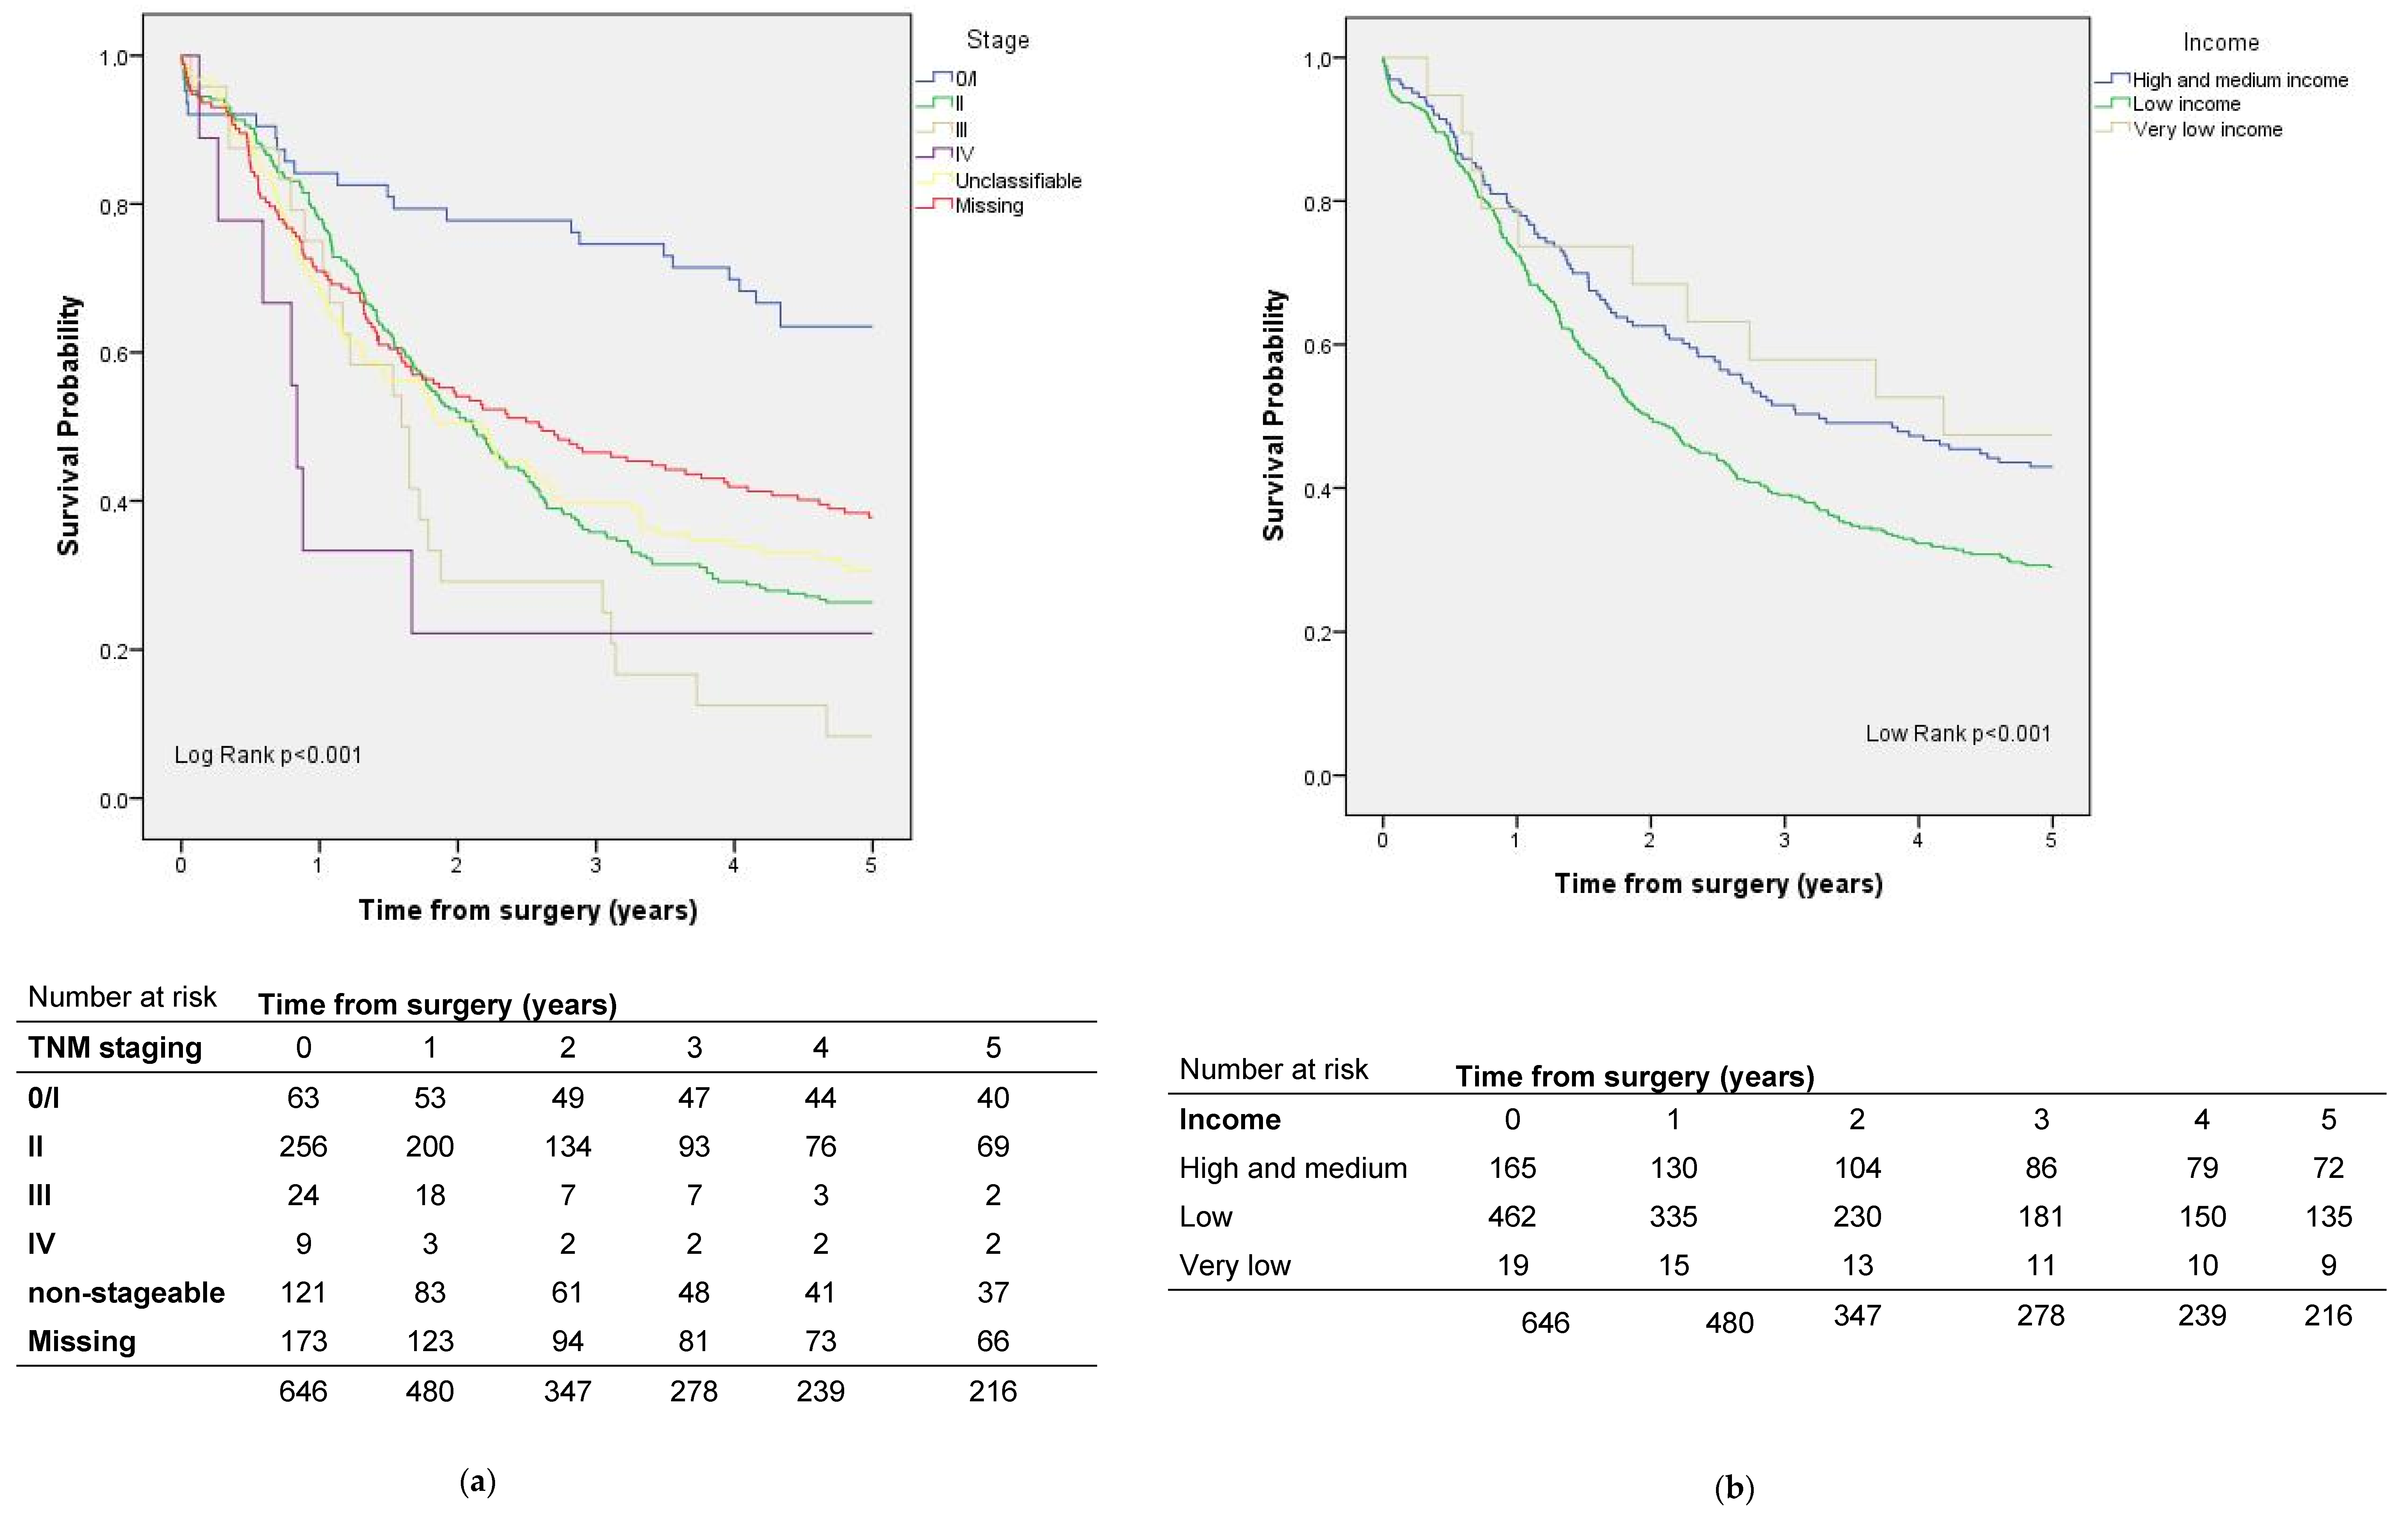
3.1. Factors Influencing Survival in Patients with Pancreatic Cancer

Among the included cases of pancreatic cancer, five-year survival was 33.4%. Risk factors for mortality were low income and not having a textbook outcome (Table 3, Figure 4).

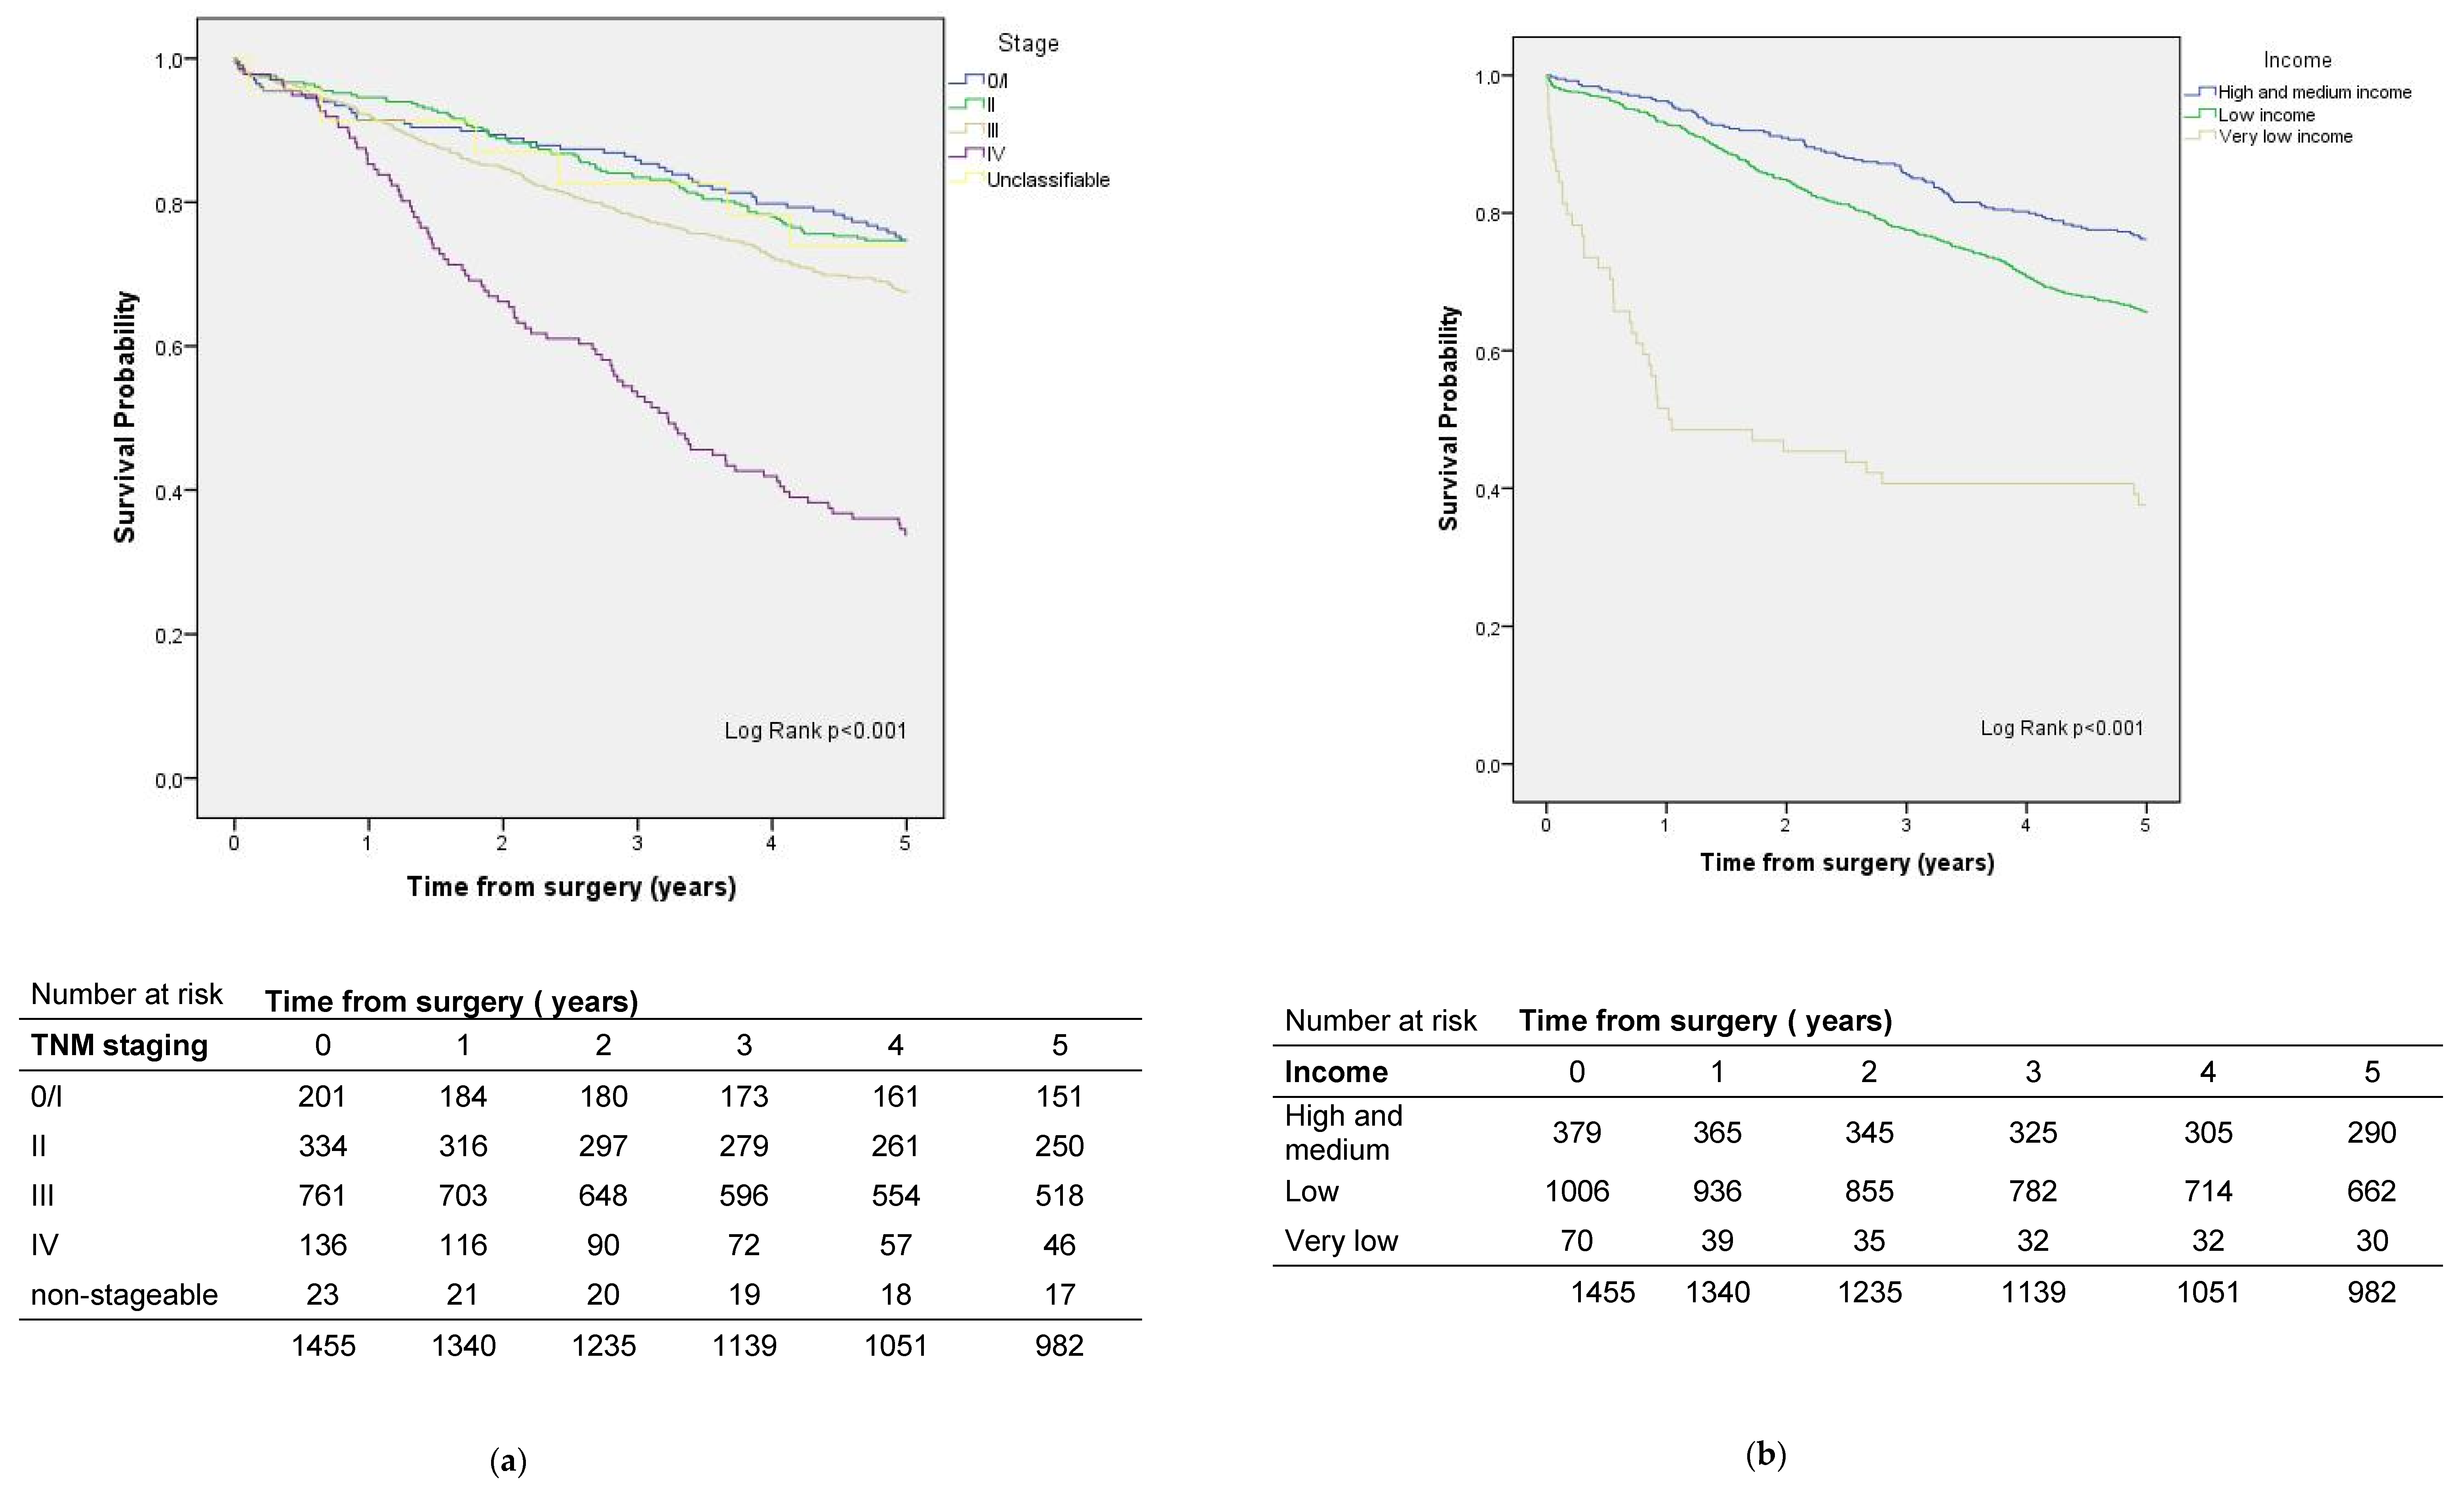
3.2. Factors That Influence Survival in Patients with Rectal Cancer

The five-year crude survival rate for rectal cancer was 67.5% (Figure 5). In the survival analysis adjusted for sex, age, ASA, and stage, patients who lived further from the 90th% cut-off had better survival than patients who lived less than 10 km from the hospital where the surgery was performed (Table 4). On the other hand, patients with a very low income level had a higher risk than those with medium–high income (Table 4, Figure 5). Not having a textbook outcome was also a risk factor (Table 4).
In the subanalysis of the 237 rectal cancer patients and the 168 pancreatic cancer patients operated on in reference centers outside their health districts, we did not observe differences in five-year survival.

4. Discussion

In this population-based study, which included over 2000 cases of pancreatic and rectal cancer operated on in the Catalan public healthcare system, the results did not show that a longer distance from a patient’s home to a reference center was associated with worse survival. The usual adjustment variables (sex, age, tumor stage, and ASA grade) did not contribute to any relationship between distance and survival in pancreatic cancer. In rectal cancer, however, the 10% of patients who lived furthest from their reference centers showed better survival than those who lived within 10 km. This fact might be attributable to social determinants. Focusing solely on the quality of care, as measured by the achievement of a textbook outcome, this factor did have an impact on survival at five years for both cancer diseases. Regarding socioeconomic status, we observed an association between low income and worse survival. Specifically for rectal cancer, compared to patients with medium–high income, those with very low income had a 5.2-fold higher risk of dying, and those with a low income had a 1.3-fold higher risk. In the case of pancreatic cancer, low-income patients had a 1.5-fold higher risk compared to patients with middle–high income.
Evidence has shown how distance can impact the probability of undergoing a full range of cancer treatments and surviving [12,13,14,24], as well as how socioeconomic inequalities can amplify such differences [25,26]. In a review on the origins of socioeconomic inequalities in cancer survival, Woods et al. highlighted that, after adjusting for socioeconomic differences, distance was related to worse tumor stage at diagnosis and shorter survival [18]. Although previous studies have often taken place in regions with a much lower population density than Catalonia (for instance, Queensland (Australia) is 57 times larger and has 2.5 million fewer inhabitants), the centralization strategy implemented in 2012 disrupted a deeply rooted hospital culture in which centers grew naturally in services and technology, treating a wide range of oncological pathologies with negligible coordination between them. Centralization entailed an increase in the distance to reference centers for 42% and 12% of pancreatic and rectal cancer patients, respectively, but without any pre-established clinical coordination formulas or inclusion policies for patients with highs burden of comorbidity or in situations of poverty [17]. In fact, one of the most significant results of this study was the association between lower income and worse five-year survival, which is consistent with other previous studies on survival in pancreatic and rectal cancer [27,28]. The short-term results (i.e., measured as the achievement of a textbook outcome) were comparable between the income groups, suggesting that the health system manages to be equitable in the short term, but it cannot avoid the effect of social inequality on patient life expectancy.
On the other hand, different studies have related the quality of the hospitalization process, measured using the ‘textbook outcome’ endpoint, to medium- and long-term survival [21,22]. In our study, textbook outcomes were independently associated with greater five-year survival in both the rectum and the pancreas, always adjusting for variables such as age, staging, or ASA, which numerous studies have also related to survival.
Regarding the real distance from patients’ homes, our data showed that most patients did not have to travel far for their surgeries: in rectal cancer, 90% of patients were treated at a center less than 30 km away. In the case of pancreatic cancer, subject to a more pronounced centralization strategy, the distance at the 90th percentile was 89 km. In pancreatic cancer patients who lived beyond this distance, a cluster of longer journeys was observed, especially concentrated in people living in one specific region. Since the end of the study period, this situation has changed, with the accreditation of an additional reference center that has significantly shortened the distances. In any case, greater distance did not translate to worse survival in either of the two pathologies studied. On the contrary, an unexpected result of our study was that 10% of rectal cancer patients who live furthest from their reference centers had better survival than patients living within a radius of 10 km. This finding raised several hypotheses, such as selection or self-selection of the ‘best cases’ to refer, along with a tendency to not refer patients with the worst prognosis, as they are considered palliative. As the analysis was adjusted for age, sex, and staging, this hypothesis is unlikely. A post hoc analysis by subregion showed that these cases were geographically spread out.
Looking longitudinally at the impact of cancer diagnosis on survivors’ earnings offers an important avenue for future research. In our study, the level of income corresponded to the year of surgery, which may subsequently decrease. Oncological processes can accelerate situations of material deprivation (e.g., lower income and professional interruptions) and end up imposing health inequalities. For its part, the distance that patients must travel to reference centers is also an issue of scientific relevance to the extent that the EU policy framework considers the need to specify resources and patients in expert centers. As a matter of fact, Europe’s Beating Cancer Plan (EBCP) “aims to ensure that 90% of eligible cancer patients have access to National Comprehensive Cancer Centres (CCCs) by 2030” [29].
Among the strengths of this study, the income measure used was individual and not grouped by territory or postal code, which would have introduced a risk of bias. Likewise, the use of real-world data is an added value, since it was based on the evaluation of cancer services in real conditions in a population that included all risk groups. Another strength is that the study drew from the interprofessional work of different public institutions in which doctors, epidemiologists, cartographers, demographers, statisticians, and others collaborated.
The main limitation is that it did not include non-operated cases, for which a certain geographical distance could have contributed to the decision to not undergo a surgical intervention. Different studies have shown that the need to travel further as a result of centralization reduces rates of treatment utilization for patients and widens inequities for those less able to travel [30,31]. However, the real impact of centralization on the use of curative surgery must be performed with population-based data that allow calculating the rate of surgery among incident cases. To obtain this information, a population study should be carried out including all incident cases in the study period. Additionally, we did not include the approximately 10% of cases treated in the private healthcare system, nor did we consider patients receiving surgery in non-reference centers in order to avoid the variability of results linked to unauthorized centers [15]. Patients operated on in reference centers outside their health districts were also excluded in consonance with the objective of the study, which was to assess the impact of centralization (a policy that establishes centers and, therefore, the distance to travel for surgery). However, in a subanalysis no differences were observed between these patients and those who attended their reference centers.
Socioeconomic status, while measured at the individual level, may be prone to some measurement errors, arising from the inability of official social security data to capture income from the informal economy or household income (except in minors). This could lead to the misclassification of some individuals, especially women (who show lower participation in the labor market); however, our results did not show gender-based differences in the association between socioeconomic status and mortality [23]. In cases of individuals who file joint tax returns or individuals in the same household with different incomes, this assessment procedure may introduce bias; however, no better information was available. In addition, workers in the informal economy tend to be of lower SES and would, therefore, be correctly categorized in the lowest SES category, as they would not be reporting any income.
Furthermore, in the database, annual individual income was captured as a categorical variable rather than as a continuous measure. This limited our ability to define exposure categories; in particular, the medium income stratum was very broad and, likely, heterogeneous [23]. In addition, because the high-income category included very few individuals, these were included in the same category as the middle-income group.

5. Conclusions

In short, the policy of centralizing highly complex oncological pathologies meant that a significant proportion of patients were treated outside their district hospitals, but this change was not associated with worse health outcomes compared to other patients, including that for survival. The reform was equitable in nature, as reflected by the short-term outcomes (textbook outcome, hospitalization); however, it did not erase the significant impact of income level on medium-term survival in patients with both rectal and pancreatic cancer. Growing clinical complexity and subspecialization, molecular diagnosis, and a policy context marked by pressures toward centralization will condition how health services are articulated to avoid health inequalities along the key planning axes in the coming years.

Supplementary Materials

The following supporting information can be downloaded at: https://www.mdpi.com/article/10.3390/ijerph19148814/s1. Table S1: Baseline characteristics of cohort by type of cancer and by sex; Table S2: Description of distance by age, stage, income and pathology.

Author Contributions

Conceptualization, P.M.-W., L.A., J.M.B., C.C.-O., M.C., À.G. and J.P.; Data curation, P.M.-W., L.A., C.C.-O., J.C., M.C., A.M., A.P. (Antoni Planella), I.T., E.V. and J.P.; Formal analysis, P.M.-W., L.A., C.C.-O., J.C., I.T., E.V. and J.P.; Funding acquisition, P.M.-W. and J.P.; Investigation, P.M.-W., L.A., J.M.B., C.C.-O., C.C.-G., M.C., S.C., À.G., A.P. (Antoni Planella), A.P. (Alfonso Pozuelo) and J.P.; Methodology, P.M.-W., L.A., J.M.B., C.C.-O., J.C., C.C.-G., M.C., S.C., A.M., A.P. (Antoni Planella), A.P. (Alfonso Pozuelo), I.T., E.V. and J.P.; Project administration, P.M.-W. and J.P.; Software, L.A., S.C. and I.T.; Supervision, P.M.-W., L.A., J.M.B., C.C.-O., À.G., Alfonso Pozuelo, I.T. and J.P.; Validation, P.M.-W., L.A., J.M.B., C.C.-G., M.C., À.G., A.M., E.V. and J.P.; Visualization, P.M.-W., S.C., A.M. and J.P.; Writing—original draft, P.M.-W., J.M.B., C.C.-O., J.C., A.M., A.P. (Antoni Planella), I.T. and J.P.; Writing—review & editing, P.M.-W., C.C.-G., M.C., S.C., À.G., A.M., A.P. (Antoni Planella), A.P. (Alfonso Pozuelo), E.V. and J.P. All authors have read and agreed to the published version of the manuscript.

Funding

This study has been funded by Instituto de Salud Carlos III through the project PI18/01835 (Co-funded by European Regional Development Fund. ERDF, a way to build Europe). We thank CERCA Programme/Generalitat de Catalunya for institutional suport.

Institutional Review Board Statement

The study was conducted in accordance with the Declaration of Helsinki, and approved by the Ethics Committee of the Biomedical Research Institute of Bellvitge (protocol code PR177/18, approved on 22 November 2018).

Informed Consent Statement

Informed consent was not requested for the present study as the clinical and therapeutic data were derived from a clinical audit registry. Furthermore, for the latter, strict confidentiality of the patients’ personal data was ensured by separating the registry of identifying data from the clinical data and its custody by the principal investigator. Participating patients cannot be identified.

Data Availability Statement

Data are available on request.

Conflicts of Interest

The authors declare no conflict of interest.

References

  1. Institute of Medicine (U.S.); Committee on Quality of Health Care in America. Crossing the Quality Chasm: A New Health System for the 21st Century; National Academies Press: Washington, DC, USA, 2001. [Google Scholar]
  2. Stitzenberg, K.B.; Sigurdson, E.R.; Egleston, B.L.; Starkey, R.B.; Meropol, N.J. Centralization of cancer surgery: Implications for patient access to optimal care. J. Clin. Oncol. 2009, 27, 4671–4678. [Google Scholar] [CrossRef] [Green Version]
  3. Huang, L.; Pickle, L.W.; Stinchcomb, D.; Feuer, E.J. Detection of spatial clusters: Application to cancer survival as a continuous outcome. Epidemiology 2007, 18, 73–87. [Google Scholar] [CrossRef]
  4. Meilleur, A.; Subramanian, S.V.; Plascak, J.J.; Fisher, J.L.; Paskett, E.D.; Lamont, E.B. Rural residence and cancer outcomes in the United States: Issues and challenges. Cancer Epidemiol. Biomark. Prev. 2013, 22, 1657–1667. [Google Scholar] [CrossRef] [Green Version]
  5. Coll-Ortega, C.; Prades, J.; Manchon-Walsh, P.; Borras, J.M. Centralisation of surgery for complex cancer diseases: A scoping review of the evidence base on pancreatic cancer. J. Cancer Policy 2022, 32, 100334. [Google Scholar] [CrossRef]
  6. Vonlanthen, R.; Lodge, P.; Barkun, J.S.; Farges, O.; Rogiers, X.; Soreide, K.; Kehlet, H.; Reynolds, J.V.; Käser, S.A.; Naredi, P.; et al. Toward a Consensus on Centralization in Surgery. Ann. Surg. 2018, 268, 712–724. [Google Scholar] [CrossRef] [Green Version]
  7. Bendzsak, A.M.; Baxter, N.N.; Darling, G.E.; Austin, P.C. Urbach DR Regionalization and outcomes of lung cancer surgery in Ontario, Canada. J. Clin. Oncol. 2017, 35, 2772–2780. [Google Scholar] [CrossRef] [Green Version]
  8. Timmermans, M.; Schuurman, M.S.; Ho, V.K.Y.; Massuger, L.F.; Nijman, H.W.; van Gorp, T.; Sonke, G.S.; Kruitwagen, R.F.P.M.; van der Aa, M.A. Centralization of ovarian cancer in the Netherlands: Hospital of diagnosis no longer determines patients’ probability of undergoing surgery. Gynecol Oncol. 2018, 148, 56–61. [Google Scholar] [CrossRef]
  9. Prades, J.; Arnold, D.; Brunner, T.; Cardone, A.; Carrato, A.; Coll-Ortega, C.; de Luze, S.; Garel, P.; Goossens, M.E.; Grilli, R.; et al. Bratislava Statement: Consensus recommendations for improving pancreatic cancer care. ESMO Open. 2020, 5, e001051. [Google Scholar] [CrossRef]
  10. Andritsch, E.; Beishon, M.; Bielack, S.; Bonvalot, S.; Casali, P.G.; Crul, M.; Delgado-Bolton, R.; Donati, D.M.; Douis, H.; Haas, R.; et al. ECCO Essential Requirements for Quality Cancer Care: Soft Tissue Sarcoma in Adults and Bone Sarcoma. A critical review. Crit. Rev. Oncol. Hematol. 2017, 110, 94–105. [Google Scholar] [CrossRef]
  11. Biganzoli, L.; Cardoso, F.; Beishon, M.; Cameron, D.; Cataliotti, L.; Coles, C.E.; Bolton, R.C.D.; Trill, M.D.; Erdem, S.; Fjell, M.; et al. The requirements of a specialist breast centre. Breast 2020, 51, 65–84. [Google Scholar] [CrossRef]
  12. Dejardin, O.; Jones, A.; Rachet, B.; Morris, E.; Bouvier, V.; Jooste, V.; Coombes, E.; Forman, D.; Bouvier, A.; Launoy, G. The influence of geographical access to health care and material deprivation on colorectal cancer survival: Evidence from France and England. Health Place 2014, 30, 36–44. [Google Scholar] [CrossRef] [Green Version]
  13. Crawford, S.M.; Sauerzapf, V.; Haynes, R.; Zhao, H.; Forman, D.; Jones, A.P. Social and geographical factors affecting access to treatment of lung cancer. Br. J. Cancer 2009, 101, 897–901. [Google Scholar] [CrossRef] [PubMed]
  14. Baade, P.D.; Dasgupta, P.; Aitken, J.F.; Turrell, G. Distance to the closest radiotherapy facility and survival after a diagnosis of rectal cancer in Queensland. Med. J. Aust. 2011, 195, 350–354. [Google Scholar] [CrossRef] [PubMed] [Green Version]
  15. Prades, J.; Manchon-Walsh, P.; Solà, J.; Espinàs, J.A.; Guarga, A.; Borras, J.M. Improving clinical outcomes through centralization of rectal cancer surgery and clinical audit: A mixed-methods assessment. Eur. J. Public Health 2016, 26, 538–542. [Google Scholar] [CrossRef] [Green Version]
  16. Highly-Specialised Cancer Care Reorganisation Act, Catalan Health Service § 01/2019. 2019. Available online: https://scientiasalut.gencat.cat/bitstream/handle/11351/1323.3/catsalut_instruccio_01_2019.pdf?sequence=8&isAllowed=y (accessed on 15 January 2022).
  17. Urbanos-Garrido, R. La desigualdad en el acceso a las prestaciones sanitarias. Propuestas para lograr la equidad [Inequality in access to health care services. Policy recommendations aimed at achieving equity]. Gac. Sanit. 2016, 30 (Suppl. 1), 25–30. [Google Scholar] [CrossRef] [Green Version]
  18. Woods, L.M.; Rachet, B.; Coleman, M.P. Origins of socio-economic inequalities in cancer survival: A review. Ann Oncol. 2006, 17, 5–19. [Google Scholar] [CrossRef]
  19. Manchon-Walsh, P.; Espinàs, J.A.; Prades, J.; Aliste, L.; Pozuelo, A.; Benaque Guarga, A.; Borras, J.M. Evaluation of the Concentration Process of Highly Specialized Digestive Oncological Surgery in Catalonia; Catalan Agency for Health Information, Assessment and Quality (CAHIAQ): Barcelona, Spain, 2016. [Google Scholar]
  20. Manchon-Walsh, P.; Espinàs, J.A.; Prades, J.; Torrents, A.; Aliste, L.; Pozuelo, A.; Casanovas-Guitart, C.; Guarga, A.; Borras, J.M. Evaluation of the Concentration Process of Highly Specialized Digestive Oncological Surgery in Catalonia. Update 2014–2015; Catalan Agency for Health Information, Assessment and Quality (CAHIAQ): Barcelona, Spain, 2018. [Google Scholar]
  21. Kalff, M.C.; Vesseur, I.; Eshuis, W.J.; Heineman, D.J.; Daams, F.; van der Peet, D.L.; van Berge Henegouwen, M.I.; Gisbertz, S.S. The Association of Textbook Outcome and Long-Term Survival After Esophagectomy for Esophageal Cancer. Ann. Thorac. Surg. 2020, 112, 1134–1141. [Google Scholar] [CrossRef]
  22. Yang, C.C.; Tian, Y.F.; Liu, W.S.; Chou, C.L.; Cheng, L.C.; Chu, S.S.; Lee, C.C. The association between the composite quality measure “textbook outcome” and long term survival in operated colon cancer. Medicine 2020, 99, e22447. [Google Scholar] [CrossRef]
  23. Bilal, U.; Cainzos-Achirica, M.; Cleries, M.; Santaeugènia, S.; Corbella, X.; Comin-Colet, J.; Vela, E. Socioeconomic status, life expectancy and mortality in a universal healthcare setting: An individual-level analysis of >6 million Catalan residents. Prev. Med. 2019, 123, 91–94. [Google Scholar] [CrossRef]
  24. Fonseca, B.D.P.; Albuquerque, P.C.; Saldanha, R.D.F.; Zicker, F. Geographic accessibility to cancer treatment in Brazil: A network analysis. Lancet Reg. Heal. Am. 2022, 7, 100153. [Google Scholar] [CrossRef]
  25. Birkmeyer, J.D.; Siewers, A.E.; Marth, N.J.; Goodman, D.C. Regionalization of high-risk surgery and implications for patient travel times. JAMA 2003, 290, 2703–2708. [Google Scholar] [CrossRef] [PubMed] [Green Version]
  26. Speicher, P.J.; Englum, B.; Ganapathi, A.; Wang, X.; Hartwig, M.G.; D’Amico, T.A.; Berry, M.F. Traveling to a High-volume Center is Associated With Improved Survival for Patients With Esophageal Cancer. Ann Surg. 2017, 265, 743–749. [Google Scholar] [CrossRef] [PubMed]
  27. Baastrup, R.; Sørensen, M.; Hansen, J.; Hansen, R.D.; Würtzen, H.; Winther, J.F. Social inequality and incidence of and survival from cancers of the oesophagus, stomach and pancreas in a population-based study in Denmark, 1994–2003. Eur. J. Cancer 2008, 44, 1962–1977. [Google Scholar] [CrossRef] [PubMed]
  28. Coughlin, S.S. Social determinants of colorectal cancer risk, stage, and survival: A systematic review. Int. J. Color. Dis. 2020, 35, 985–995. [Google Scholar] [CrossRef] [PubMed]
  29. European Commission. Europe’s Beating Cancer Plan. Communication from the Commission to the European Parliament and the Council. COM(2021)44. Available online: https://ec.europa.eu/health/system/files/2022-02/eu_cancer-plan_en_0.pdf (accessed on 12 February 2021).
  30. Parry, M.G.; Sujenthiran, A.; Cowling, T.E.; Nossiter, J.; Cathcart, P.; Clarke, N.W.; Payne, H.; Aggarwal, A.; van der Meulen, J. Impact of cancer service centralisation on the radical treatment of men with high-risk and locally advanced prostate cancer: A national cross-sectional analysis in England. Int. J. Cancer 2019, 145, 40–48. [Google Scholar] [CrossRef] [PubMed]
  31. Versteeg, S.E.; Ho, V.K.Y.; Siesling, S.; Varkevisser, M. Centralisation of cancer surgery and the impact on patients’ travel burden. Int. J. Cancer 2018, 145, 40–48. [Google Scholar] [CrossRef] [PubMed]
Figure 1. Study flow chart.
Ijerph 19 08814 g001
Figure 2. Distribution of pancreatic cancer cases according to locations of patients’ homes and surgical centers in Catalonia. (a) All cases of pancreatic cancer (N = 646). (b) Selection of cases with the longest distances (>90th%) between the patients’ homes and the reference centers (N = 64). Each color represents a different reference center.
Ijerph 19 08814 g002
Figure 3. Distribution of rectal cancer cases according to locations of patients’ homes and surgical centers in Catalonia. (a) All cases of rectal cancer (N = 1455). (b) Selection of cases with the longest distances (>90th%) between the patients’ homes and the reference centers (N = 142). Each color represents a different reference center.
Ijerph 19 08814 g003
Figure 4. Survival by (a) stage and (b) socioeconomic status in pancreatic cancer patients.
Ijerph 19 08814 g004
Figure 5. Survival by (a) stage and (b) socioeconomic status in rectal cancer patients.
Ijerph 19 08814 g005
Table 1. Baseline characteristics of cohort by type of cancer.
VariablesPancreatic Cancer
(N = 646)
Rectal Cancer
(N = 1455)
n%n%
Sex
 Male37958.794765.1
 Female26741.350834.9
Age
 Median (IQR)69.0 (14.0)69.6 (16.9)
 <60 years14121.831121.4
 60–69 years20631.942329.1
 70–79 years22735.145931.5
 ≥80 years7211.126218.0
Physical status score
 ASA I172.6896.1
 ASA II16826.073850.7
 ASA III16225.148633.4
 ASA IV132.0493.4
 Missing28644.3936.4
TNM staging
 0/I639.820113.8
 II25639.633423.0
 III243.776152.3
 IV91.41369.3
 Non-stageable12118.7231.6
 Missing17326.800.0
Income
 High–medium16525.537926.0
 Low46271.5100669.1
 Very low192.9704.8
Distance from patient residence to reference center (km)
 Median (IQR)
 Range
7.00 (32.83)
0.53–246.07
4.37 (8.89)
0.18–134.86
 0–10 km38058.8104071.5
 >10 km to < 90th% *20231.327318.8
 ≥90th% *649.91429.8
District hospital
 Non-reference center27342.318312.6
 Reference center37357.7127287.4
ASA: American Society of Anaesthesiologists; IQR: Interquartile range. * 90th%: pancreatic cancer, 89.14 km; rectal cancer, 29.70 km. Missing: no data found.
Table 2. Baseline characteristics according to distance between patients’ homes and treatment centers.
Pancreatic Cancer (N = 646) Rectal Cancer (N = 1455)
0–10 km>10 km to <90th%≥90th%0–10 km>10 km to <90th%≥90th%
n%n%n%n%n%n%
Age<60 years8422.14220.81523.420820.07025.63323.2
60–69 years11329.77034.72335.930028.88430.83927.5
70–79 years13435.37436.61929.733332.07627.85035.2
≥80 years4912.9167.9710.919919.14315.82014.1
p-value0.520.21
Physical status scoreASA I92.452.534.7626.0197.085.6
ASA II10527.64522.31828.154051.913148.06747.2
ASA III8622.66431.71218.834633.38832.25236.6
ASA IV92.431.511.6383.751.864.2
ASA V00.000.000.000.000.000.0
Missing17145.08542.13046.9545.23011.096.3
p-value0.330.044 *
Tumor stage0/I4612.1125.957.815114.53011.02014.1
II14237.48743.12742.224423.56222.72819.7
III164.284.000.053851.714753.87653.5
IV71.810.511.6878.43111.41812.7
Non-stageable6918.24120.31117.2201.931.100.0
Missing10026.35326.22031.300.000.000.0
p-value0.290.24
IncomeHigh-medium10828.44120.31625.029128.06323.12517.6
Low25867.915878.24671.969767.019972.911077.5
Very low143.731.523.1525.0114.074.9
p-value0.110.052
Total380100.0202100.064100.01040100.0273100.0142100.0
ASA: American Society of Anaesthesiologists. 90th%: pancreatic cancer, 89.14 km; rectal cancer, 29.70 km. p-values below 0.05 (two-sided) were considered to indicate statistical significance. Chi-square test.* Statistically significant.
Table 3. Multivariate survival analysis of pancreatic cancer patients at 5 years of follow-up.
Univariate AnalysisMultivariate Analysis
VariablesnHR95% CIp-ValueHR95% CIp-Value
Sex
Male3791 1
Female2670.970.80, 1.770.790.870.71, 1.060.71
Age
<60 years1411 <0.0011 0.008
60–69 years2061.521.15, 2.020.0041.371.02, 1.840.034
70–79 years2271.751.33, 2.31<0.0011.531.15, 2.050.004
≥80 years722.021.42, 2.86<0.0011.821.25, 2.650.002
Physical status score
ASA I171 0.0141 0.067
ASA II1682.180.96, 4.97 0.0641.750.76, 4.040.19
ASA III1622.971.31, 6.760.0092.020.87, 4.700.10
ASA IV133.211.17, 8.850.0242.310.82, 6.480.11
Missing2862.851.26, 6.420.0122.931.20, 7.190.019
TNM staging
0/I631 <0.0011 <0.001
II2562.781.80, 4.30<0.0012.841.82, 4.42<0.001
III244.222.35, 7.59<0.0013.371.86, 6.12<0.001
IV94.591.97, 10.71<0.0014.521.80, 11.330.001
Non-stageable1212.681.69, 4.25<0.0011.700.96, 3.030.070
Missing1732.241.43, 3.51<0.0011.600.94, 2.720.083
Textbook outcome
Yes2841 1
No3621.481.22, 1.79<0.0011.3441.10, 1.640.004
Distance from patient home to reference center
0–10 km3801 0.901 0.92
11 km to <90th%2021.040.84, 1.280.741.050.80, 1.390.71
≥90th%640.960.70, 1.330.811.080.72, 1.610.73
Income
High–medium 1651 0.0031 0.003
Low4621.451.15, 1.820.0021.471.15, 1.870.002
Very low190.870.45, 1.670.6780.840.43, 1.630.60
District center
Non-reference center2731 1
Reference center3731.030.85, 1.250.751.140.86, 1.500.362
CI: confidence interval; HR: hazard ratio. p-values below 0.05 (two-sided) were considered to indicate statistical significance.
Table 4. Multivariate survival analysis of rectal cancer patients at 5 years of follow-up.
Univariate AnalysisMultivariate Analysis
VariablesnHR95% CIp-ValueHR95% CIp-Value
Sex
Male9471 1
Female5080.960.79, 1.160.640.950.78, 1.150.59
Age
<60 years3111 <0.0011 <0.001
60–69 years4231.070.78, 1.450.691.170.86, 1.610.32
70–79 years4591.791.35, 2.37<0.0011.851.38, 2.49<0.001
≥80 years2622.872.15, 3.84<0.0013.332.43, 4.57<0.001
Physical status score
ASA I891 <0.0011 <0.001
ASA II7381.430.86, 2.380.171.150.68, 1.950.60
ASA III4862.741.65, 4.56<0.0011.961.16, 3.340.013
ASA IV495.282.90, 9.63<0.0013.731.98, 7.01<0.001
Missing933.151.78, 5.60<0.0012.351.30, 4.260.005
TNM staging
0/I2011 <0.0011 <0.001
II3341.010.71, 1.430.971.040.73, 1.480.81
III7611.361.00, 1.850.0471.721.26, 2.340.001
IV1363.612.55, 5.10<0.0014.773.34, 6.81<0.001
Non-stageable231.050.45, 2.450.910.850.36, 1.990.70
Textbook outcome
Yes5291 1
No9261.581.30, 1.93<0.0011.461.20, 1.79<0.001
Distance from patient home to reference center
0–10 km10401 0.701 0.044
11 km to <90th%2731.090.87, 1.370.471.080.84, 1.380.55
≥90th%1420.950.70, 1.300.750.670.46, 0.970.034
Income
High–medium3791 <0.0011 <0.001
Low10061.551.23, 1.96<0.0011.281.00, 1.630.047
Very low704.693.23, 6.81<0.0015.243.58, 7.67<0.001
District center
Non-reference center1831 1
Reference center12720.780.61, 1.010.0580.760.55, 1.040.081
CI: confidence interval; HR: hazard ratio. p-values below 0.05 (two-sided) were considered to indicate statistical significance.
Publisher’s Note: MDPI stays neutral with regard to jurisdictional claims in published maps and institutional affiliations.

