
Rural–Urban Disparities in Realized Spatial Access to General Practitioners, Orthopedic Surgeons, and Physiotherapists among People with Osteoarthritis in Alberta, Canada

 , and
, and
Abstract
:1. Introduction
2. Materials and Methods
2.1. Data Sources
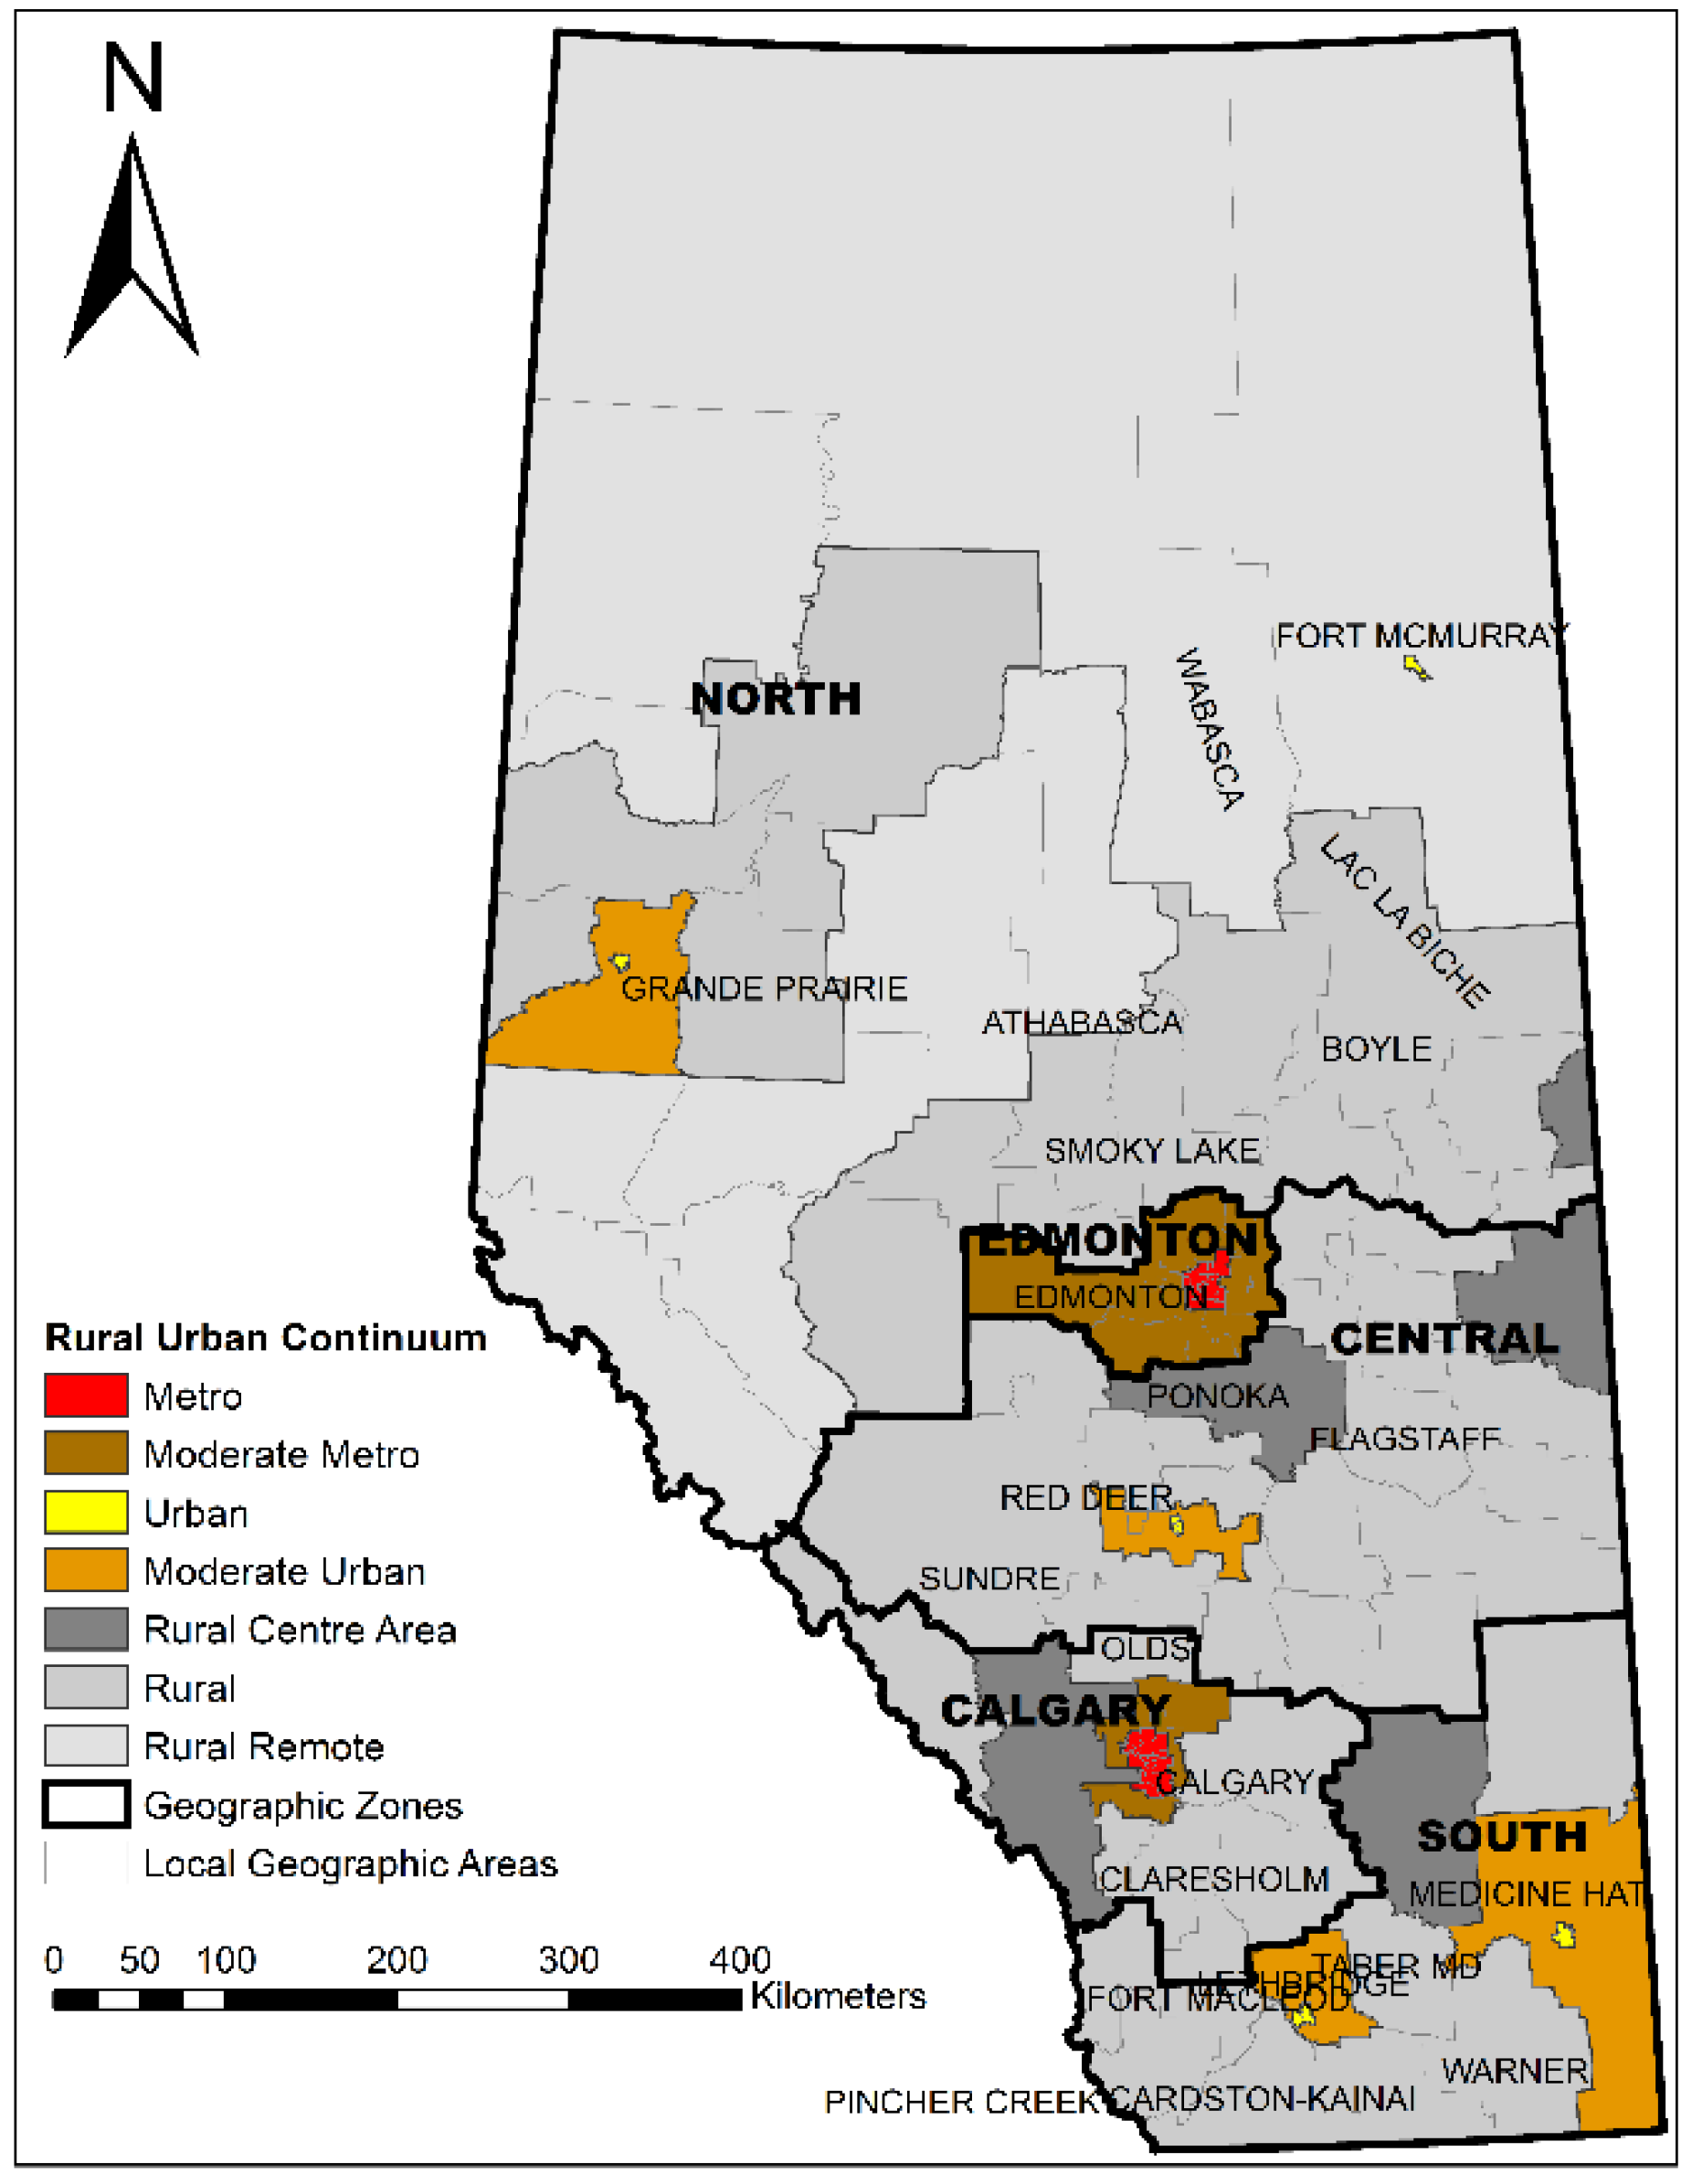
2.2. Standard Geographic Areas
2.3. Travel Time Calculations
2.4. Descriptive Statistics
2.5. Hot Spot Analysis at the LGA Level
2.6. Distance Decay Pattern of Health Care Utilization
3. Results
3.1. Characteristics of Patients with OA in 2012/2013
3.2. Distribution of Patients and Providers
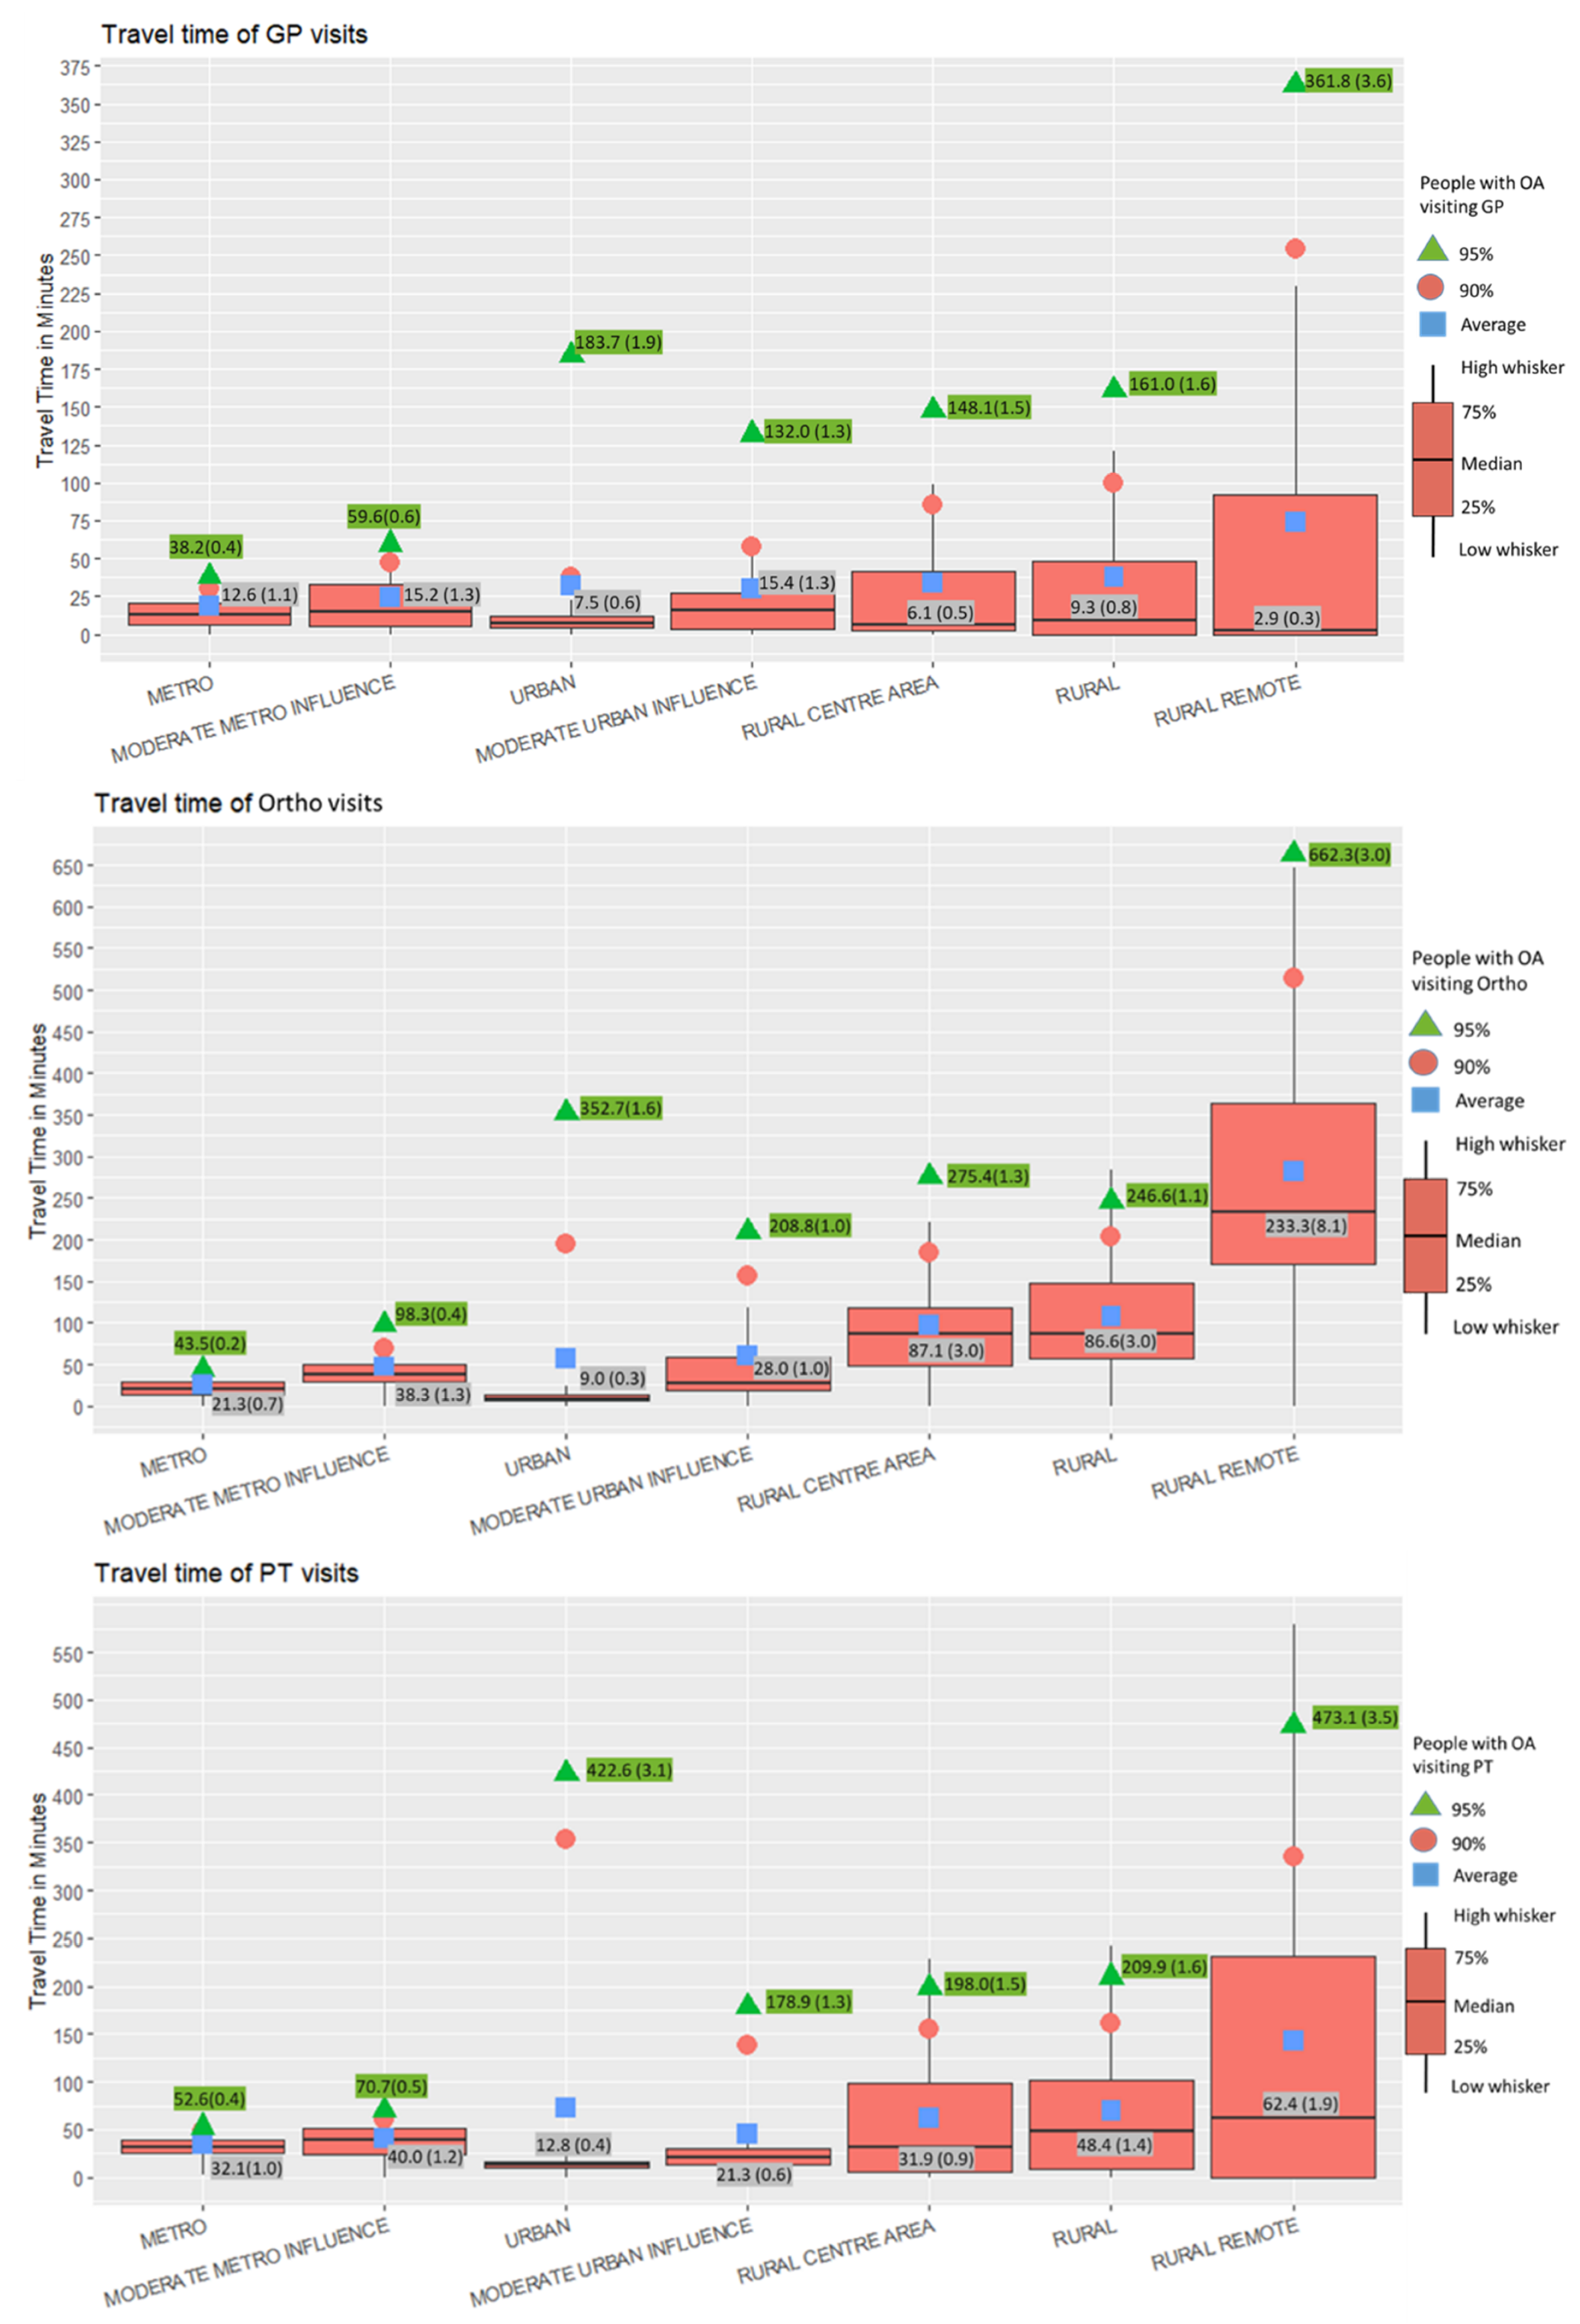
3.3. Travel Time in the Rural–Urban Continuum
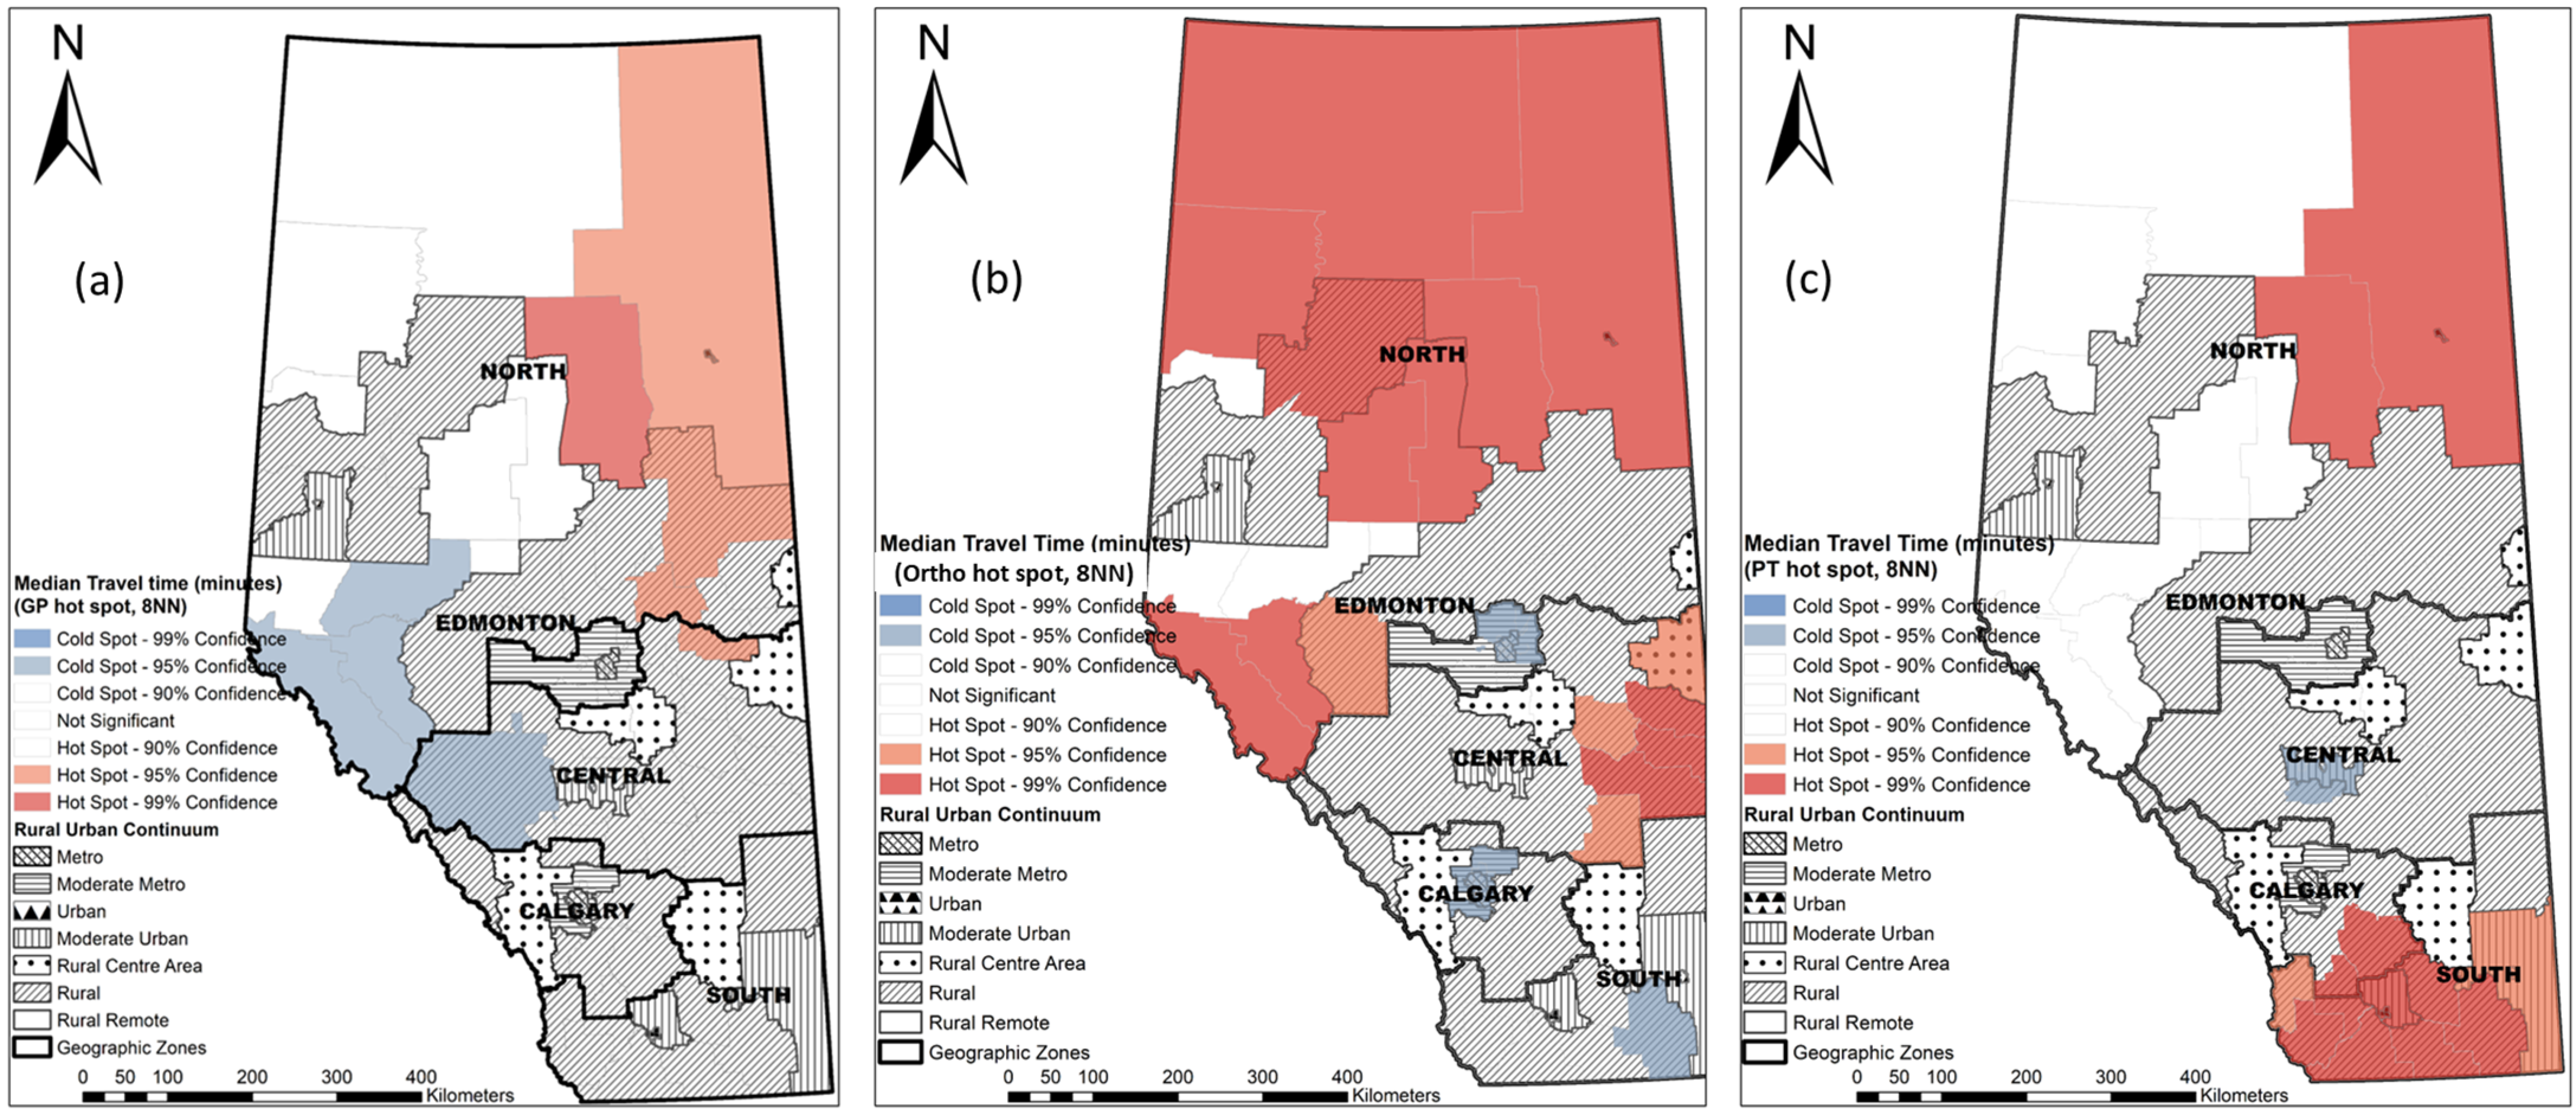
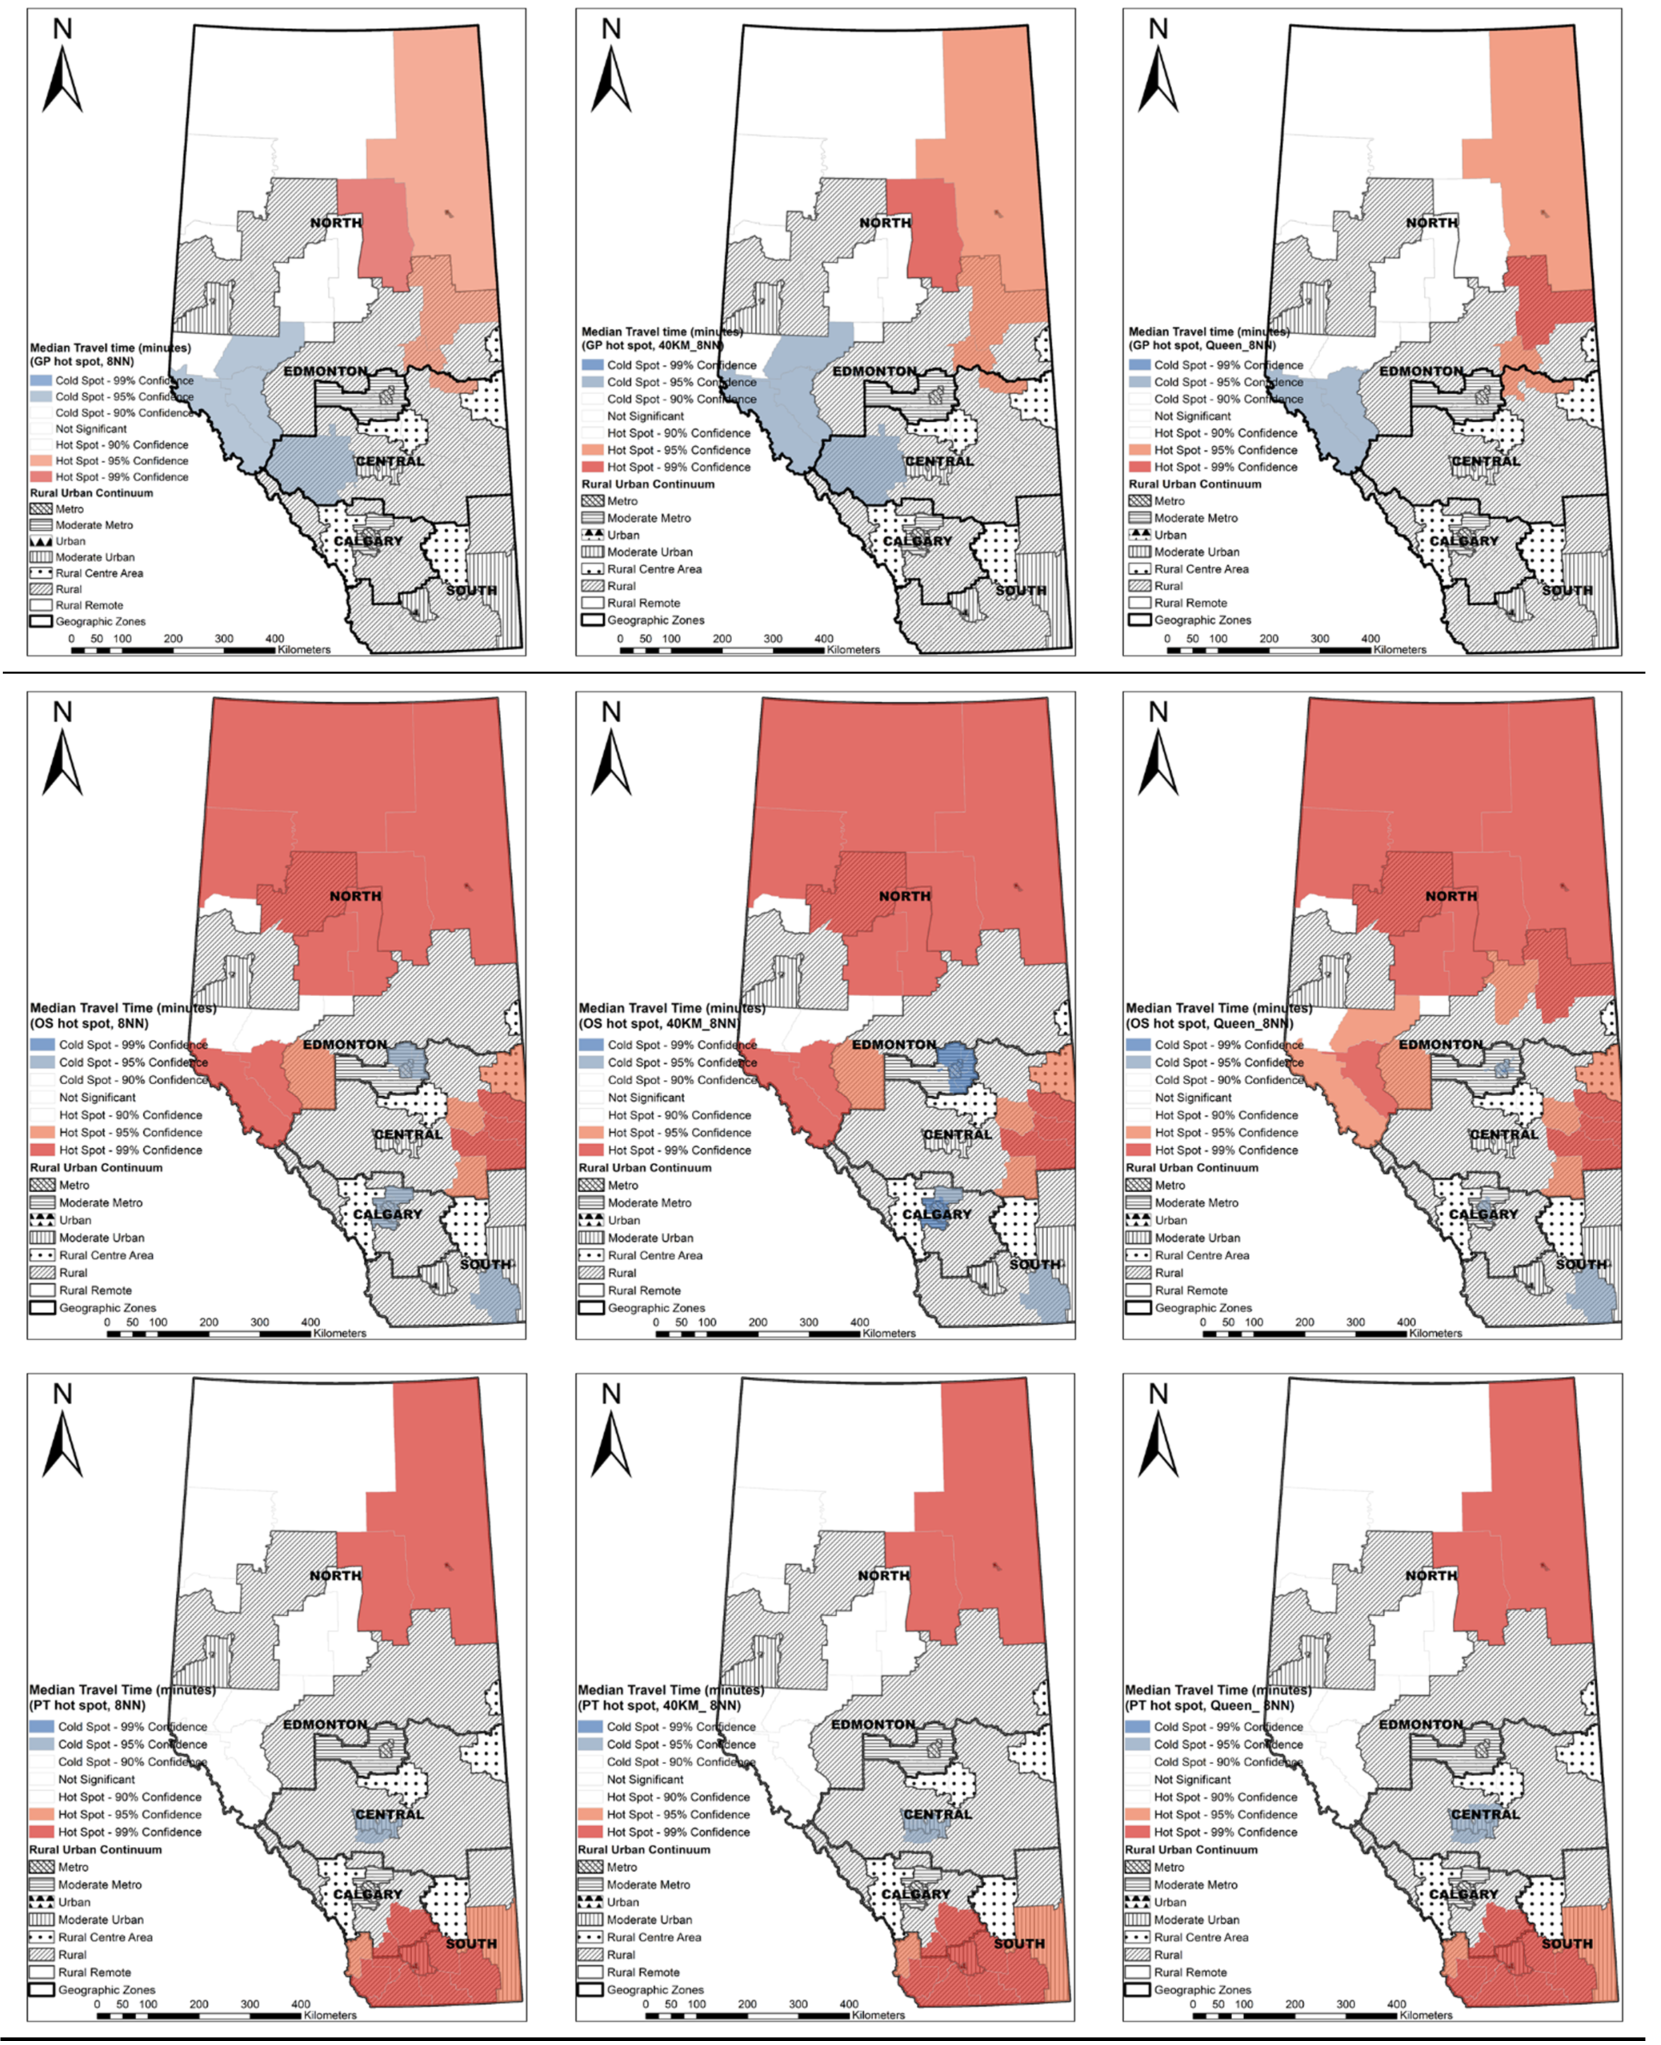
3.4. Hot Spots of Median Travel Time at the LGA Level
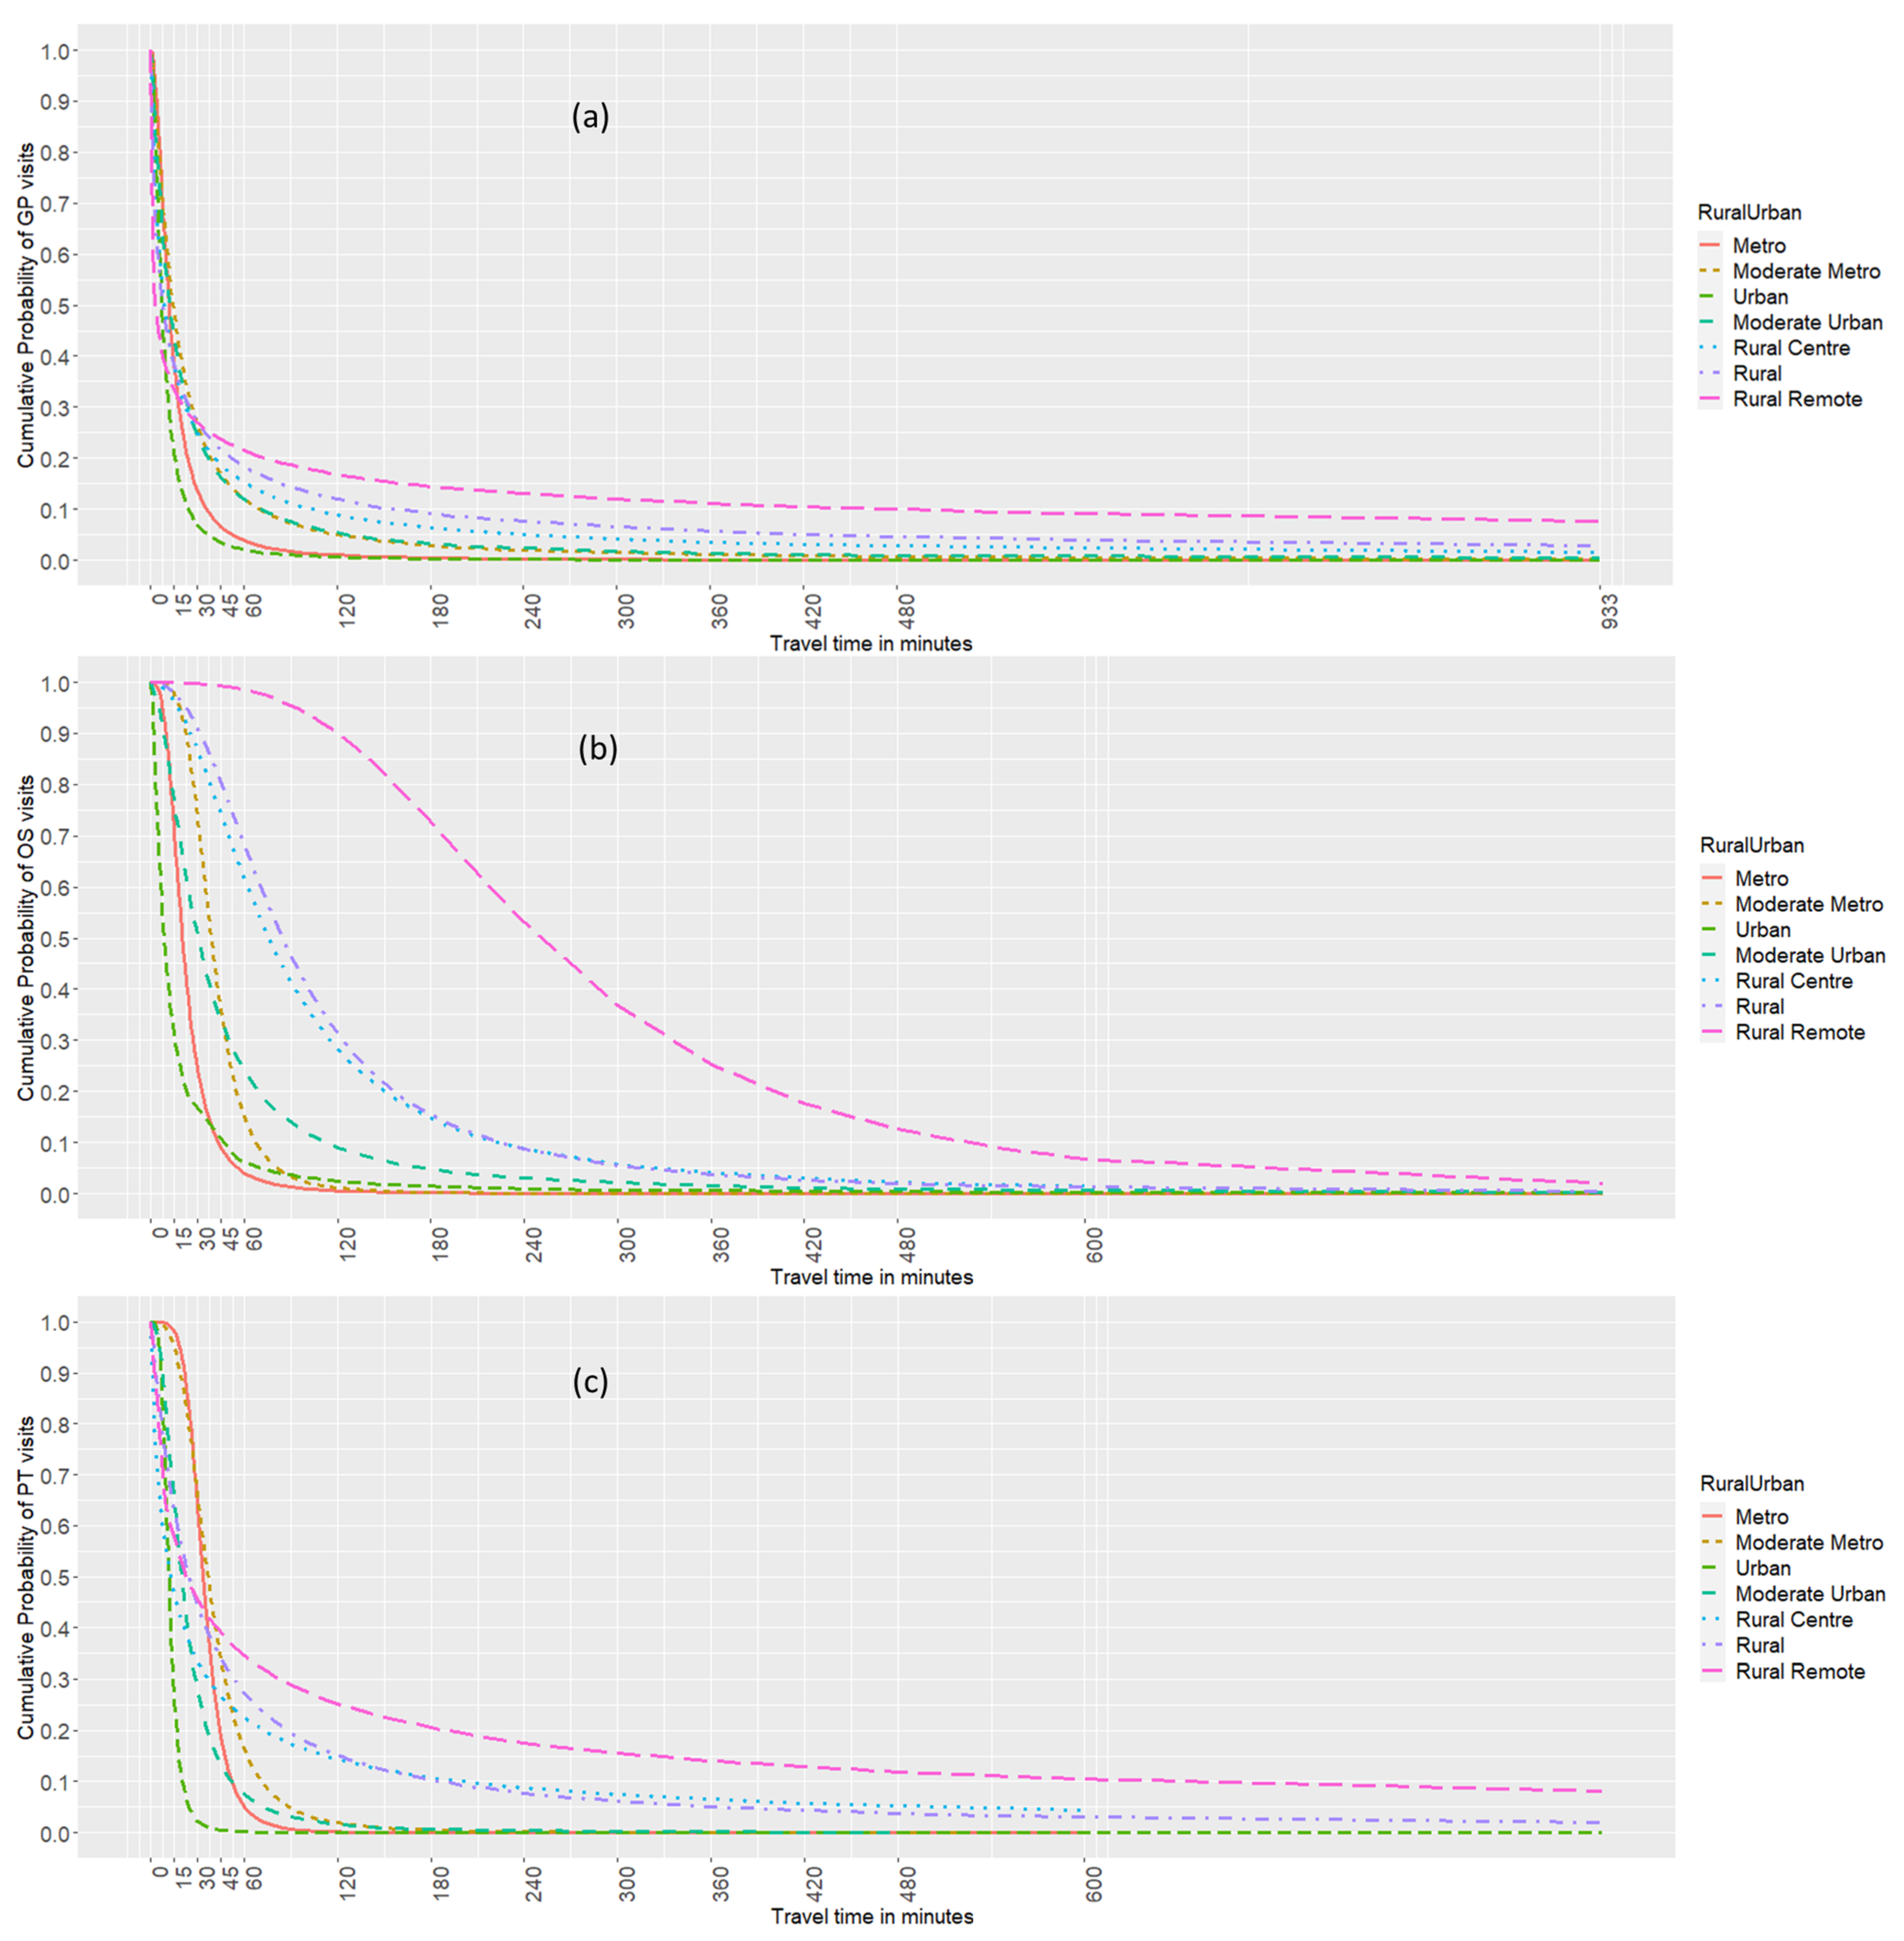
3.5. Distance Decay Pattern of Health Care Utilization
4. Discussion
5. Conclusions
Author Contributions
Funding
Institutional Review Board Statement
Informed Consent Statement
Data Availability Statement
Conflicts of Interest
Appendix A

| Providers | Subgroups | Metro N (%) | Moderate Metro N (%) | Urban N (%) | Moderate Urban N (%) | Rural Centre N (%) | Rural N (%) | Rural Remote N (%) | Alberta N (%) |
|---|---|---|---|---|---|---|---|---|---|
| Number of patients by provider type, demographic factors, and rural–urban status | |||||||||
| GP | Sex | ||||||||
| Female | 50,612 (50.2) | 12,747 (12.7) | 8361 (8.3) | 1873 (1.9) | 4799 (4.8) | 19,683 (19.5) | 2667 (2.6) | 100,742 (100) | |
| Male | 30,122 (46.4) | 9134 (14.1) | 5284 (8.1) | 1341 (2.1) | 3287 (5.1) | 13,835 (21.3) | 1859 (2.9) | 64,862 (100) | |
| Age group (years) | |||||||||
| 18–34 | 1306 (48.7) | 0330 (12.3) | 0264 (9.8) | 0068 (2.5) | 0101 (3.8) | 0497 (18.5) | 0117 (4.4) | 2683 (100) | |
| 35–44 | 3742 (46.7) | 0996 (12.4) | 0713 (8.9) | 0184 (2.3) | 0461 (5.8) | 1546 (19.3) | 0369 (4.6) | 8011 (100) | |
| 45–54 | 11,502 (47.7) | 3179 (13.2) | 2147 (8.9) | 0555 (2.3) | 1213 (5.0) | 4574 (19.0) | 0926 (3.8) | 24,096 (100) | |
| 55–64 | 20,783 (48.3) | 6124 (14.2) | 3685 (8.6) | 0871 (2.0) | 2003 (4.7) | 8322 (19.4) | 1206 (2.8) | 42,994 (100) | |
| 65–74 | 18,946 (47.1) | 5828 (14.5) | 2903 (7.2) | 0812 (2.0) | 1937 (4.8) | 8728 (21.7) | 1060 (2.6) | 40,214 (100) | |
| 75–84 | 16,184 (51.0) | 3742 (11.8) | 2521 (7.9) | 0516 (1.6) | 1559 (4.9) | 6615 (20.8) | 0605 (1.9) | 31,742 (100) | |
| 85+ | 8271 (52.1) | 1682 (10.6) | 1412 (8.9) | 0208 (1.3) | 0812 (5.1) | 3236 (20.4) | 0243 (1.5) | 15,864 (100) | |
| Comorbidity | |||||||||
| No comorbidity | 36,418 (48.7) | 10,261 (13.7) | 6164 (8.2) | 1472 (2.0) | 3491 (4.7) | 15,163 (20.3) | 1827 (2.4) | 74,796 (100) | |
| One comorbidity | 28,308 (49.0) | 7752 (13.4) | 4666 (8.1) | 1127 (1.9) | 2831 (4.9) | 11,502 (19.9) | 1631 (2.8) | 57,817 (100) | |
| Two comorbidities | 11,783 (48.8) | 2900 (12.0) | 2027 (8.4) | 0449 (1.9) | 1288 (5.3) | 4919 (20.4) | 0784 (3.2) | 24,150 (100) | |
| Three or more comorbidities | 4225 (47.8) | 0968 (10.9) | 0788 (8.9) | 0166 (1.9) | 0476 (5.4) | 1934 (21.9) | 0284 (3.2) | 8841 (100) | |
| Ortho | Sex | ||||||||
| Female | 12,534 (47.4) | 3291 (12.4) | 3261 (12.3) | 0630 (2.4) | 1157 (4.4) | 5133 (19.4) | 0449 (1.7) | 26,455 (100) | |
| Male | 8459 (42.6) | 2784 (14.0) | 2489 (12.5) | 0527 (2.7) | 0968 (4.9) | 4220 (21.2) | 0424 (2.1) | 19,871 (100) | |
| Age group (years) | |||||||||
| 18–34 | 0605 (52.0) | 0144 (12.4) | 0144 (12.4) | 0032 (2.8) | 0041 (3.5) | 0178 (15.3) | 0019 (1.6) | 1163 (100) | |
| 35–44 | 0966 (45.9) | 0282 (13.4) | 0286 (13.6) | 0057 (2.7) | 0100 (4.8) | 0347 (16.5) | 0066 (3.1) | 2104 (100) | |
| 45–54 | 2954 (44.1) | 0854 (12.8) | 0892 (13.3) | 0217 (3.2) | 0320 (4.8) | 1278 (19.1) | 0183 (2.7) | 6698 (100) | |
| 55–64 | 5712 (43.2) | 1885 (14.3) | 1703 (12.9) | 0348 (2.6) | 0603 (4.6) | 2687 (20.3) | 0275 (2.1) | 13,213 (100) | |
| 65–74 | 5500 (43.8) | 1793 (14.3) | 1337 (10.7) | 0305 (2.4) | 0593 (4.7) | 2824 (22.5) | 0199 (1.6) | 12,551 (100) | |
| 75–84 | 4127 (49.6) | 0909 (10.9) | 1008 (12.1) | 0167 (2.0) | 0376 (4.5) | 1622 (19.5) | 0115 (1.4) | 8324 (100) | |
| 85+ | 1129 (49.7) | 0208 (9.2) | 0380 (16.7) | 0031 (1.4) | 0092 (4.0) | 0417 (18.3) | 0016 (0.7) | 2273 (100) | |
| Comorbidity | |||||||||
| No comorbidity | 10,071 (45.3) | 3000 (13.5) | 2653 (11.9) | 0558 (2.5) | 1005 (4.5) | 4577 (20.6) | 0386 (1.7) | 22,250 (100) | |
| One comorbidity | 7186 (45.8) | 2103 (13.4) | 1914 (12.2) | 0377 (2.4) | 0707 (4.5) | 3106 (19.8) | 0314 (2.0) | 15,707 (100) | |
| Two comorbidities | 2848 (45.2) | 0743 (11.8) | 0864 (13.7) | 0160 (2.5) | 0320 (5.1) | 1239 (19.7) | 0128 (2.0) | 6302 (100) | |
| Three or more comorbidities | 0888 (43.0) | 0229 (11.1) | 0319 (15.4) | 0062 (3.0) | 0093 (4.5) | 0431 (20.9) | 0045 (2.2) | 2067 (100) | |
| PT | Sex | ||||||||
| Female | 13,567 (55.1) | 4161 (16.9) | 1022 (4.1) | 0207 (0.8) | 1023 (4.2) | 4112 (16.7) | 0540 (2.2) | 24,632 (100) | |
| Male | 7349 (50.7) | 2763 (19.0) | 0622 (4.3) | 0148 (1.0) | 0634 (4.4) | 2608 (18.0) | 0380 (2.6) | 14,504 (100) | |
| Age group (Years) | |||||||||
| 18–34 | 0380 (62.7) | 0088 (14.5) | 0021 (3.5) | 0008 (1.3) | 0024 (4.0) | 0074 (12.2) | 0011 (1.8) | 0606 (100) | |
| 35–44 | 0732 (56.3) | 0224 (17.2) | 0048 (3.7) | 0018 (1.4) | 0057 (4.4) | 0165 (12.7) | 0056 (4.3) | 1300 (100) | |
| 45–54 | 2549 (54.2) | 0845 (18.0) | 0210 (4.5) | 0049 (1.0) | 0171 (3.6) | 0726 (15.4) | 0152 (3.2) | 4702 (100) | |
| 55–64 | 5483 (52.7) | 1973 (19.0) | 0476 (4.6) | 0094 (0.9) | 0407 (3.9) | 1707 (16.4) | 0271 (2.6) | 10,411 (100) | |
| 65–74 | 5682 (50.4) | 2219 (19.7) | 0396 (3.5) | 0109 (1.0) | 0524 (4.7) | 2086 (18.5) | 0248 (2.2) | 11,264 (100) | |
| 75–84 | 4621 (55.7) | 1249 (15.1) | 0354 (4.3) | 0070 (0.8) | 0366 (4.4) | 1496 (18.0) | 0143 (1.7) | 8299 (100) | |
| 85+ | 1469 (57.5) | 0326 (12.8) | 0139 (5.4) | 0007 (0.3) | 0108 (4.2) | 0466 (18.2) | 0039 (1.5) | 2554 (100) | |
| Comorbidity | |||||||||
| No comorbidity | 9554 (53.6) | 3250 (18.2) | 0675 (3.8) | 0158 (0.9) | 0775 (4.4) | 3023 (17.0) | 0378 (2.1) | 17,813 (100) | |
| One comorbidity | 7411 (54.0) | 2442 (17.8) | 0567 (4.1) | 0129 (0.9) | 0548 (4.0) | 2304 (16.8) | 0330 (2.4) | 13,731 (100) | |
| Two comorbidities | 2960 (52.7) | 0919 (16.4) | 0282 (5.0) | 0051 (0.9) | 0251 (4.5) | 0999 (17.8) | 0151 (2.7) | 5613 (100) | |
| Three or more comorbidities | 0991 (50.1) | 0313 (15.8) | 0120 (6.1) | 0017 (0.9) | 0083 (4.2) | 0394 (19.9) | 0061 (3.1) | 1979 (100) | |
| Number of visits by provider type, demographic factors, and rural–urban status | |||||||||
| GP | Sex | ||||||||
| Female | 171,212 (49.4) | 43,375 (12.5) | 26,529 (7.7) | 5620 (1.6) | 18,398 (5.3) | 70,381 (20.3) | 10,930 (3.2) | 346,445 (100) | |
| Male | 95,730 (45.3) | 28,755 (13.6) | 15,960 (7.5) | 3841 (1.8) | 11,852 (5.6) | 48,217 (22.8) | 7095 (3.4) | 211,450 (100) | |
| Age group (years) | |||||||||
| 18–34 | 3940 (44.9) | 1125 (12.8) | 0819 (9.3) | 0176 (2.0) | 0359 (4.1) | 1932 (22.0) | 0418 (4.8) | 8769 (100) | |
| 35–44 | 12,006 (43.0) | 3269 (11.7) | 2156 (7.7) | 0581 (2.1) | 1912 (6.9) | 6355 (22.8) | 1614 (5.8) | 27,893 (100) | |
| 45–54 | 37,155 (46.0) | 10,082 (12.5) | 6698 (8.3) | 1533 (1.9) | 4580 (5.7) | 17,019 (21.1) | 3771 (4.7) | 80,838 (100) | |
| 55–64 | 63,901 (47.2) | 18,314 (13.5) | 11,289 (8.3) | 2520 (1.9) | 7096 (5.2) | 27,382 (20.2) | 4781 (3.5) | 135,283 (100) | |
| 65–74 | 58,853 (46.2) | 17,788 (14.0) | 8398 (6.6) | 2384 (1.9) | 6774 (5.3) | 29,050 (22.8) | 4104 (3.2) | 127,351 (100) | |
| 75–84 | 54,683 (50.0) | 13,474 (12.3) | 7869 (7.2) | 1505 (1.4) | 5762 (5.3) | 23,722 (21.7) | 2388 (2.2) | 109,403 (100) | |
| 85+ | 36,404 (53.3) | 8078 (11.8) | 5260 (7.7) | 0762 (1.1) | 3767 (5.5) | 13,138 (19.2) | 0949 (1.4) | 68,358 (100) | |
| Comorbidity | |||||||||
| No comorbidity | 113,701 (47.3) | 32,105 (13.4) | 18,247 (7.6) | 4194 (1.7) | 12,546 (5.2) | 52,382 (21.8) | 7140 (3.0) | 240,315 (100) | |
| One comorbidity | 95,008 (48.4) | 25,566 (13.0) | 14,620 (7.5) | 3256 (1.7) | 10,527 (5.4) | 40,488 (20.6) | 6641 (3.4) | 196,106 (100) | |
| Two comorbidities | 42,161 (48.2) | 10,274 (11.8) | 6818 (7.8) | 1453 (1.7) | 5286 (6.0) | 18,373 (21.0) | 3064 (3.5) | 87,429 (100) | |
| Three or more comorbidities | 16,072 (47.2) | 4185 (12.3) | 2804 (8.2) | 0558 (1.6) | 1891 (5.6) | 7355 (21.6) | 1180 (3.5) | 34,045 (100) | |
| Ortho | Sex | ||||||||
| Female | 33,217 (45.1) | 8661 (11.8) | 10,943 (14.9) | 2062 (2.8) | 3095 (4.2) | 14,534 (19.7) | 1161 (1.6) | 73,673 (100) | |
| Male | 22,461 (40.0) | 7615 (13.6) | 8407 (15.0) | 1760 (3.1) | 2708 (4.8) | 12,072 (21.5) | 1117 (2.0) | 56,140 (100) | |
| Age group (years) | |||||||||
| 18–34 | 2028 (52.1) | 0480 (12.3) | 0500 (12.9) | 0092 (2.4) | 0129 (3.3) | 0612 (15.7) | 0048 (1.2) | 3889 (100) | |
| 35–44 | 2664 (43.2) | 0889 (14.4) | 0929 (15.1) | 0164 (2.7) | 0295 (4.8) | 1065 (17.3) | 0158 (2.6) | 6164 (100) | |
| 45–54 | 8027 (43.2) | 2232 (12.0) | 2866 (15.4) | 0654 (3.5) | 0884 (4.8) | 3446 (18.5) | 0476 (2.6) | 18,585 (100) | |
| 55–64 | 15,510 (41.2) | 5068 (13.5) | 5996 (15.9) | 1174 (3.1) | 1603 (4.3) | 7516 (20.0) | 0779 (2.1) | 37,646 (100) | |
| 65–74 | 14,336 (40.8) | 4723 (13.4) | 4493 (12.8) | 1130 (3.2) | 1638 (4.7) | 8330 (23.7) | 0519 (1.5) | 35,169 (100) | |
| 75–84 | 10,394 (46.1) | 2397 (10.6) | 3410 (15.1) | 0502 (2.2) | 1034 (4.6) | 4550 (20.2) | 0271 (1.2) | 22,558 (100) | |
| 85+ | 2719 (46.9) | 0487 (8.4) | 1156 (19.9) | 0106 (1.8) | 0220 (3.8) | 1087 (18.7) | 0027 (0.5) | 5802 (100) | |
| Comorbidity | |||||||||
| No comorbidity | 26,228 (42.9) | 7857 (12.9) | 8601 (14.1) | 1768 (2.9) | 2723 (4.5) | 13,011 (21.3) | 0946 (1.5) | 61,134 (100) | |
| One comorbidity | 19,223 (43.5) | 5727 (13.0) | 6524 (14.8) | 1304 (3.0) | 1935 (4.4) | 8617 (19.5) | 0842 (1.9) | 44,172 (100) | |
| Two comorbidities | 7748 (42.5) | 2012 (11.0) | 2926 (16.0) | 0570 (3.1) | 0812 (4.5) | 3818 (20.9) | 0358 (2.0) | 18,244 (100) | |
| Three or more comorbidities | 2479 (39.6) | 0680 (10.9) | 1299 (20.7) | 0180 (2.9) | 0333 (5.3) | 1160 (18.5) | 0132 (2.1) | 6263 (100) | |
| PT | Sex | ||||||||
| Female | 71,764 (53.0) | 20,401 (15.1) | 7065 (5.2) | 1421 (1.0) | 5126 (3.8) | 25,229 (18.6) | 4420 (3.3) | 135,426 (100) | |
| Male | 37,033 (48.3) | 13,017 (17.0) | 4115 (5.4) | 1171 (1.5) | 2737 (3.6) | 15,564 (20.3) | 2972 (3.9) | 76,609 (100) | |
| Age group (years) | |||||||||
| 18–34 | 2113 (65.1) | 0424 (13.1) | 0127 (3.9) | 0038 (1.2) | 0125 (3.8) | 0361 (11.1) | 0060 (1.8) | 3248 (100) | |
| 35–44 | 3491 (51.1) | 1006 (14.7) | 0287 (4.2) | 0148 (2.2) | 0321 (4.7) | 1088 (15.9) | 0486 (7.1) | 6827 (100) | |
| 45–54 | 11,964 (50.5) | 3754 (15.8) | 1216 (5.1) | 0323 (1.4) | 0789 (3.3) | 4403 (18.6) | 1254 (5.3) | 23,703 (100) | |
| 55–64 | 27,913 (50.2) | 8997 (16.2) | 3433 (6.2) | 0851 (1.5) | 1940 (3.5) | 10,458 (18.8) | 2001 (3.6) | 55,593 (100) | |
| 65–74 | 31,259 (49.3) | 11,177 (17.6) | 2933 (4.6) | 0825 (1.3) | 2515 (4.0) | 12,675 (20.0) | 1987 (3.1) | 63,371 (100) | |
| 75–84 | 24,663 (53.8) | 6523 (14.2) | 2393 (5.2) | 0360 (0.8) | 1779 (3.9) | 8817 (19.2) | 1270 (2.8) | 45,805 (100) | |
| 85+ | 7394 (54.8) | 1537 (11.4) | 0791 (5.9) | 0047 (0.3) | 0394 (2.9) | 2991 (22.2) | 0334 (2.5) | 13,488 (100) | |
| Comorbidity | |||||||||
| No comorbidity | 48,109 (50.8) | 15,245 (16.1) | 4533 (4.8) | 1161 (1.2) | 3713 (3.9) | 18,777 (19.8) | 3182 (3.4) | 94,720 (100) | |
| One comorbidity | 39,058 (52.3) | 12,049 (16.1) | 3967 (5.3) | 0967 (1.3) | 2595 (3.5) | 13,283 (17.8) | 2732 (3.7) | 74,651 (100) | |
| Two comorbidities | 16,252 (51.2) | 4514 (14.2) | 2010 (6.3) | 0329 (1.0) | 1158 (3.7) | 6339 (20.0) | 1121 (3.5) | 31,723 (100) | |
| Three or more comorbidities | 5378 (49.2) | 1610 (14.7) | 0670 (6.1) | 0135 (1.2) | 0397 (3.6) | 2394 (21.9) | 0357 (3.3) | 10,941 (100) | |
Appendix B
| Rural–Urban Continuum | Average (Ratio to AB) | Minimum | P5 | P25 | Median | Median (Ratio to AB) | P75 | P90 | P95 | Maximum | |
| GP visit travel time | Metro | 18.8 (0.7) | 0.0 | 1.7 | 6.4 | 12.6 | 12.6 (1.1) | 21.0 | 30.6 | 38.2 | 764.8 |
| Moderate Metro | 24.4 (0.9) | 0.0 | 1.3 | 5.5 | 15.2 | 15.2 (1.3) | 33.1 | 47.4 | 59.6 | 803.3 | |
| Urban | 31.9 (1.2) | 0.0 | 1.4 | 4.5 | 7.5 | 7.5 (0.6) | 11.8 | 37.7 | 183.7 | 862.9 | |
| Moderate Urban | 29.8 (1.1) | 0.0 | 0.0 | 3.8 | 15.4 | 15.4 (1.3) | 27.4 | 57.7 | 132.0 | 798.7 | |
| Rural Centre | 33.8 (1.3) | 0.0 | 0.0 | 2.8 | 6.1 | 6.1 (0.5) | 41.1 | 85.9 | 148.1 | 837.4 | |
| Rural | 37.5 (1.4) | 0.0 | 0.0 | 0.0 | 9.3 | 9.3 (0.8) | 48.4 | 99.3 | 161.0 | 1162.2 | |
| Rural Remote | 74.3 (2.8) | 0.0 | 0.0 | 0.0 | 2.9 | 2.9 (0.3) | 92.1 | 254.4 | 361.8 | 1139.9 | |
| Alberta | 26.9 (1.0) | 0.0 | 0.0 | 4.3 | 11.6 | 11.6 (1.0) | 25.7 | 51.2 | 99.2 | 1162.2 | |
| Ortho visit travel time | Rural–urban continuum | Average (ratio to AB) | Minimum | P5 | P25 | Median | Median (ratio to AB) | P75 | P90 | P95 | Maximum |
| Metro | 26.4 (0.5) | 0.0 | 6.1 | 14.0 | 21.3 | 21.3 (0.7) | 29.3 | 36.7 | 43.5 | 682.3 | |
| Moderate Metro | 47.6 (0.8) | 0.0 | 20.7 | 29.5 | 38.3 | 38.3 (1.3) | 50.2 | 70.2 | 98.3 | 685.5 | |
| Urban | 56.5 (1.0) | 0.0 | 2.3 | 5.9 | 9.0 | 9.0 (0.3) | 13.5 | 195.1 | 352.7 | 847.6 | |
| Moderate Urban | 60.2 (1.0) | 0.0 | 11.0 | 18.0 | 28.0 | 28.0 (1.0) | 58.2 | 156.0 | 208.8 | 626.2 | |
| Rural Centre | 96.9 (1.7) | 0.0 | 3.5 | 48.4 | 87.1 | 87.1 (3.0) | 118.2 | 184.1 | 275.4 | 555.9 | |
| Rural | 107.8 (1.8) | 0.0 | 7.2 | 57.1 | 86.6 | 86.6 (3.0) | 148.2 | 203.8 | 246.6 | 832.7 | |
| Rural Remote | 281.5 (4.8) | 0.0 | 78.4 | 171.3 | 233.3 | 233.3 (8.1) | 363.7 | 513.5 | 662.3 | 933.2 | |
| Alberta | 58.3 (1.0) | 0.0 | 4.7 | 14.8 | 28.9 | 28.9 (1.0) | 65.0 | 151.4 | 218.4 | 933.2 | |
| PT visit travel time | Rural–urban continuum | Average (ratio to AB) | Minimum | P5 | P25 | Median | Median (ratio to AB) | P75 | P90 | P95 | Maximum |
| Metro | 33.8 (0.7) | 0.0 | 11.6 | 25.2 | 32.1 | 32.1 (1.0) | 39.9 | 48.0 | 52.6 | 558.7 | |
| Moderate Metro | 40.9 (0.9) | 0.0 | 14.7 | 24.7 | 40.0 | 40.0 (1.2) | 51.4 | 60.6 | 70.7 | 501.0 | |
| Urban | 72.3 (1.6) | 0.0 | 4.6 | 9.8 | 12.8 | 12.8 (0.4) | 16.9 | 353.7 | 422.6 | 669.7 | |
| Moderate Urban | 45.7 (1.0) | 0.0 | 1.3 | 12.8 | 21.3 | 21.3 (0.6) | 29.5 | 138.5 | 178.9 | 474.8 | |
| Rural Centre | 62.1 (1.4) | 0.0 | 0.7 | 5.1 | 31.9 | 31.9 (0.9) | 99.2 | 155.6 | 198.0 | 598.4 | |
| Rural | 69.3 (1.5) | 0.0 | 0.0 | 8.7 | 48.4 | 48.4 (1.4) | 102.1 | 161.9 | 209.9 | 870.7 | |
| Rural Remote | 143.2 (3.2) | 0.0 | 0.0 | 0.0 | 62.4 | 62.4 (1.9) | 232.1 | 335.9 | 473.1 | 903.7 | |
| Alberta | 45.3 (1.0) | 0.0 | 3.0 | 23.1 | 33.7 | 33.7 (1.0) | 47.3 | 80.4 | 135.3 | 903.7 |
Appendix C

References
- Birtwhistle, R.; Morkem, R.; Peat, G.; Williamson, T.; Green, M.E.; Khan, S.; Jordan, K.P. Prevalence and Management of Osteoarthritis in Primary Care: An Epidemiologic Cohort Study from the Canadian Primary Care Sentinel Surveillance Network. CMAJ Open 2015, 3, E270–E275. [Google Scholar] [CrossRef] [PubMed] [Green Version]
- Kopec, J.A.; Rahman, M.M.; Berthelot, J.-M.; Le Petit, C.; Aghajanian, J.; Sayre, E.C.; Cibere, J.; Anis, A.H.; Badley, E.M. Descriptive Epidemiology of Osteoarthritis in British Columbia, Canada. J. Rheumatol. 2007, 34, 386–393. [Google Scholar] [PubMed]
- Marshall, D.A.; Vanderby, S.; Barnabe, C.; MacDonald, K.V.; Maxwell, C.; Mosher, D.; Wasylak, T.; Lix, L.; Enns, E.; Frank, C.; et al. Estimating the Burden of Osteoarthritis to Plan for the Future. Arthritis Care Res. 2015, 67, 1379–1386. [Google Scholar] [CrossRef] [PubMed] [Green Version]
- Bannuru, R.R.; Osani, M.C.; Vaysbrot, E.E.; Arden, N.K.; Bennell, K.; Bierma-Zeinstra, S.M.A.; Kraus, V.B.; Lohmander, L.S.; Abbott, J.H.; Bhandari, M.; et al. OARSI Guidelines for the Non-Surgical Management of Knee, Hip, and Polyarticular Osteoarthritis. Osteoarthr. Cartil. 2019, 27, 1578–1589. [Google Scholar] [CrossRef] [Green Version]
- Vanderby, S.A.; Carter, M.W.; Noseworthy, T.; Marshall, D.A. Modelling the Complete Continuum of Care Using System Dynamics: The Case of Osteoarthritis in Alberta. J. Simul. 2015, 9, 156–169. [Google Scholar] [CrossRef]
- College of Physical Therapists of Alberta Annual Report 2013; College of Physical Therapists of Alberta: Edmonton, AB, Canada, 2013.
- The College of Family Physicians of Canada. A New Vision for CanadA. Family Practice—The Patient’s Medical Home 2019; The College of Family Physicians of Canada: Mississauga, ON, Canada, 2019. [Google Scholar]
- Bahler, B.; Aasman, E.; Bhella, V.; Hilner, J.; Lee, S.; Myhr, S.; Potter, T.; La, R.J.; Warren, V. The Integrated Health Neighbourhood of the Future: White Paper on Transforming Primary and Community-Based Care; Alberta Medical Association: Edmonton, AB, Canada, 2020. [Google Scholar]
- Primary Care Networks Alberta Surgical Wait-Time Initiatives (ASI). Available online: http://web.albertadoctors.org/albertadoctorsorg-a2s9c/pages/c8894025a7aeeb11a838000c29ee8689.html?PageId=c8894025a7aeeb11a838000c29ee8689#:~:text=WhatisASI%3F,surgerieswithinclinicallyappropriatetimelines (accessed on 1 November 2021).
- Canadian Medical Association. CMA Position Statement: Ensuring Equitable Access to Care: Strategies for Governments, Health System Planners, and the Medical Profession; Canadian Medical Association: Ottawa, ON, Canada, 2013. [Google Scholar]
- Starke, R.; Spenceley, S.; Cafffaro, M.; Sansregret, B.; Garbutt, A.; Dupres, K.; Robbins, C. Rural Health Services Review Final Report: Understanding the Concerns and Challenges of Albertans Who Live in Rural and Remote Communities; Government of Alberta: Edmonton, AB, Canada, 2015. [Google Scholar]
- Public Health Agency of Canada. Key Health Inequalities in Canada: A National Portrait; Public Health Agency of Canada: Ottawa, ON, Canada, 2018. [Google Scholar]
- Pong, R.W.; Pitblado, J.R. Geographic Distribution of Physicians in Canada: Beyond How Many and Where; Canadian Institute for Health Information: Ottawa, ON, Ontario, 2005. [Google Scholar]
- Marshall, D.A.; Liu, X.; Shahid, R.; Bertazzon, S.; Seidel, J.E.; Patel, A.B.; Nasr, M.; Barber, C.E.H.; McDonald, T.; Sharma, R.; et al. Geographic Variation in Osteoarthritis Prevalence in Alberta: A Spatial Analysis Approach. Appl. Geogr. 2019, 103, 112–121. [Google Scholar] [CrossRef]
- Marshall, D.A.; Liu, X.; Barnabe, C.; Yee, K.; Faris, P.D.; Barber, C.; Mosher, D.; Noseworthy, T.; Werle, J.; Lix, L. Existing Comorbidities in People with Osteoarthritis: A Retrospective Analysis of a Population-Based Cohort in Alberta, Canada. BMJ Open 2019, 9, e033334. [Google Scholar] [CrossRef] [Green Version]
- Feely, A.; Lix, L.M.; Reimer, K. Estimating Multimorbidity Prevalence with the Canadian Chronic Disease Surveillance System. Health Promot. Chronic Dis. Prev. Can. Res. Policy Pract. 2017, 37, 215–222. [Google Scholar] [CrossRef] [Green Version]
- Liu, X.; Shahid, R.; Patel, A.B.; McDonald, T.; Bertazzon, S.; Waters, N.; Seidel, J.E.; Marshall, D.A. Geospatial Patterns of Comorbidity Prevalence among People with Osteoarthritis in Alberta Canada. BMC Public Health 2020, 20, 1551. [Google Scholar] [CrossRef]
- Senn, N.; Cohidon, C.; Breton, M.; Levesque, J.F.; Zuchuat, J.C. Patterns of Patient Experience with Primary Care Access in Australia, Canada, New Zealand and Switzerland: A Comparative Study. Int. J. Qual. Health Care 2019, 31, G126–G132. [Google Scholar] [CrossRef]
- Kelly, C.; Hulme, C.; Farragher, T.; Clarke, G. Are Differences in Travel Time or Distance to Healthcare for Adults in Global North Countries Associated with an Impact on Health Outcomes? A Systematic Review. BMJ Open 2016, 6, e013059. [Google Scholar] [CrossRef] [PubMed]
- Bühn, S.; Holstiege, J.; Pieper, D. Are Patients Willing to Accept Longer Travel Times to Decrease Their Risk Associated with Surgical Procedures? A Systematic Review. BMC Public Health 2020, 20, 253. [Google Scholar] [CrossRef] [PubMed]
- Higgs, G. A Literature Review of the Use of GIS-Based Measures of Access to Health Care Services. Health Serv. Outcomes Res. Method 2004, 5, 119–139. [Google Scholar] [CrossRef]
- Khan, A.A. An Integrated Approach to Measuring Potential Spatial Access to Health Care Services. Plann. Sci. 1992, 26, 215–281. [Google Scholar] [CrossRef]
- Guagliardo, M.F. Spatial Accessibility of Primary Care: Concepts, Methods and Challenges. Int. J. Health Geogr. 2004, 3, 3. [Google Scholar] [CrossRef] [Green Version]
- Luo, W.; Wang, F. Measures of Spatial Accessibility to Health Care in a GIS Environment: Synthesis and a Case Study in the Chicago Region. Environ. Plan. B Plan. Des. 2016, 30, 865–884. [Google Scholar] [CrossRef] [Green Version]
- Luo, W.; Whippo, T. Variable Catchment Sizes for the Two-Step Floating Catchment Area (2SFCA) Method. Health Place 2012, 18, 789–795. [Google Scholar] [CrossRef]
- Subal, J.; Paal, P.; Krisp, J.M. Quantifying Spatial Accessibility of General Practitioners by Applying a Modified Huff Three-Step Floating Catchment Area (MH3SFCA) Method. Int. J. Health Geogr. 2021, 20, 9. [Google Scholar] [CrossRef]
- Luo, W.; Qi, Y. An Enhanced Two-Step Floating Catchment Area (E2SFCA) Method for Measuring Spatial Accessibility to Primary Care Physicians. Health Place 2009, 15, 1100–1107. [Google Scholar] [CrossRef]
- Allan, D.P. Catchments of General Practice in Different Countries- a Literature Review. Int. J. Health Geogr. 2014, 13, 32. [Google Scholar] [CrossRef] [Green Version]
- Bauer, J.; Groneberg, D.A. Measuring Spatial Accessibility of Health Care Providers—Introduction of a Variable Distance Decay Function within the Floating Catchment Area (FCA) Method. PLoS ONE 2016, 11, e0159148. [Google Scholar] [CrossRef] [PubMed] [Green Version]
- Wang, L. Analysing Spatial Accessibility to Health Care: A Case Study of Access by Different Immigrant Groups to Primary Care Physicians in Toronto. Ann. GIS 2011, 17, 237–251. [Google Scholar] [CrossRef]
- Wang, L.; Dorkenoo, S. Measuring Spatial Accessibility of Older Adults to Primary Care Physicians and Adult Day Programs in the Toronto CMA. Nurs. Palliat. Care 2018, 3, 29. [Google Scholar] [CrossRef]
- Jia, P.; Wang, F.; Xierali, I.M. Differential Effects of Distance Decay on Hospital Inpatient Visits among Subpopulations in Florida, USA. Environ. Monit. Assess. 2019, 191, 381. [Google Scholar] [CrossRef] [Green Version]
- McGrail, M.R. Spatial Accessibility of Primary Health Care Utilising the Two Step Floating Catchment Area Method: An Assessment of Recent Improvements. Int. J. Health Geogr. 2012, 11, 50. [Google Scholar] [CrossRef] [Green Version]
- Ngui, A.N.; Apparicio, P. Optimizing the Two-Step Floating Catchment Area Method for Measuring Spatial Accessibility to Medical Clinics in Montreal. BMC Health Serv. Res. 2011, 11, 166. [Google Scholar] [CrossRef] [Green Version]
- Stentzel, U.; Piegsa, J.; Fredrich, D.; Hoffmann, W.; Van Den Berg, N. Accessibility of General Practitioners and Selected Specialist Physicians by Car and by Public Transport in a Rural Region of Germany. BMC Health Serv. Res. 2016, 16, 587. [Google Scholar] [CrossRef] [Green Version]
- Kishore Biswas, R.; Kabir, E. Influence of Distance between Residence and Health Facilities on Non-Communicable Diseases: An Assessment over Hypertension and Diabetes in Bangladesh. PLoS ONE 2017, 12, e0177027. [Google Scholar] [CrossRef]
- Gomez, D.; Haas, B.; Doumouras, A.G.; Zagorski, B.; Ray, J.; Rubenfeld, G.; McLellan, B.A.; Boyes, D.M.; Nathens, A.B. A Population-Based Analysis of the Discrepancy Between Potential and Realized Access to Trauma Center Care. Ann. Surg. 2013, 257, 160–165. [Google Scholar] [CrossRef]
- Alberta Health. Postal Code Translator File (PCTF); Alberta Health: Edmonton, AB, Canada, 2013. [Google Scholar]
- Alberta Health Services and Alberta Health. Official Standard Geographic Areas; Alberta Health Services and Alberta Health: Edmonton, AB, Canada, 2017. [Google Scholar]
- DMTI Spatial. Available online: https://www.dmtispatial.com/canmap/ (accessed on 1 May 2020).
- Alberta Municipal Data Sharing Partnership. Available online: https://www.amdsp.ca/about-amdsp.html (accessed on 1 November 2021).
- Alberta Health Servcies. Applied Research and Evaluation Services Primary Health Care Alberta Facilities Distance/Time Look Up Table; Alberta Health Services: Edmonton, AB, Canada, 2016; pp. 1–12. [Google Scholar]
- Carrasco-Escobar, G.; Manrique, E.; Tello-Lizarraga, K.; Miranda, J.J. Travel Time to Health Facilities as a Marker of Geographical Accessibility Across Heterogeneous Land Coverage in Peru. Front. Public Health 2020, 8, 498. [Google Scholar] [CrossRef]
- Getis, A.; Ord, J.K. The Analysis of Spatial Association. Geogr. Anal. 1992, 24, 189–206. [Google Scholar] [CrossRef]
- Anselin, L. Local Indicators of Spatial Association-LISA. Geogr. Anal. 1995, 27, 93–115. [Google Scholar] [CrossRef]
- Getis, A.; Aldstadt, J. Constructing the Spatial Weights Matrix Using a Local Statistic. Geogr. Anal. 2003, 36, 90–104. [Google Scholar] [CrossRef]
- Delamater, P.L.; Messina, J.P.; Grady, S.C.; WinklerPrins, V.; Shortridge, A.M. Do More Hospital Beds Lead to Higher Hospitalization Rates? A Spatial Examination of Roemer’s Law. PLoS ONE 2013, 8, e54900. [Google Scholar] [CrossRef] [Green Version]
- McGrail, M.R.; Humphreys, J.S. Measuring Spatial Accessibility to Primary Health Care Services: Utilising Dynamic Catchment Sizes. Appl. Geogr. 2014, 54, 182–188. [Google Scholar] [CrossRef]
- Arcury, T.A.; Gesler, W.M.; Preisser, J.S.; Sherman, J.; Spencer, J.; Perin, J. The Effects of Geography and Spatial Behavior on Health Care Utilization among the Residents of a Rural Region. Health Serv. Res. 2005, 40, 135. [Google Scholar] [CrossRef] [Green Version]
- Sibley, L.M.; Weiner, J.P. An Evaluation of Access to Health Care Services along the Rural-Urban Continuum in Canada. BMC Health Serv. Res. 2011, 11, 20. [Google Scholar] [CrossRef]
- Wang, F.; Luo, W. Assessing Spatial and Nonspatial Factors for Healthcare Access: Towards an Integrated Approach to Defining Health Professional Shortage Areas. Health Place 2005, 11, 131–146. [Google Scholar] [CrossRef]
- Speech from the Throne|Alberta Canada. Available online: https://www.alberta.ca/throne-speech.aspx (accessed on 20 March 2020).
- Clark; John, P.S.; Menec, V.; Cloutier, D.; Newall, N.; O’Connell, M.; Tate, R. Healthcare Utilisation among Canadian Adults in Rural and Urban Areas—The Canadian Longitudinal Study on Aging. Can. J. Rural Med. 2021, 26, 69. [Google Scholar] [CrossRef]
- Alberta Health Services. Specialist LINK Data Year End Report. Linking Calgary Area Physicians and Clinician Together to Improve Patient Care. April 2020; Alberta Health Services: Edmonton, AB, Canada, 2020. [Google Scholar]
- Martens-Vanhilst, Y.; Mosher, D.P.; Scocombe, L.; MacMullan, P. Specialist Link Telephone Advice Cost Effectively Enhances Rheumatology Patient Care in Alberta, Canada. Arthritis Rheumatol. 2018, 70 (Suppl. S10). Available online: https://acrabstracts.org/abstract/specialist-link-telephone-advice-cost-effectively-enhances-rheumatology-patient-care-in-alberta-canada/ (accessed on 22 June 2021).
- Marie, D.W. Rehabilitation and Total Joint Arthroplasty. Clin. Geriatr. Med. 2012, 28, 489–508. [Google Scholar] [CrossRef]
- Jason, A.W.; Nicholas, F.T. Pre-Operative Interventions (Non-Surgical and Non-Pharmacological) for Patients with Hip or Knee Osteoarthritis Awaiting Joint Replacement Surgery—A Systematic Review and Meta-Analysis. Osteoarthr. Cartil. 2011, 19, 1381–1395. [Google Scholar] [CrossRef] [Green Version]
- Carol, F.; Susan, J.; Victoria, Q.; Katherine, B.; Cheryl, A.C.; Aileen, D.; John, F.; Gillian, H.; Michel, D.L.; Nizar, N.M.; et al. Rehabilitation Services Following Total Joint Replacement: A Qualitative Analysis of Key Processes and Structures to Decrease Length of Stay and Increase Surgical Volumes in Ontario, Canada. J. Eval. Clin. Pract. 2010, 16, 724–730. [Google Scholar] [CrossRef]
- Westby, M.D.; Backman, C.L. Patient and Health Professional Views on Rehabilitation Practices and Outcomes Following Total Hip and Knee Arthroplasty for Osteoarthritis:A Focus Group Study. BMC Health Serv. Res. 2010, 10, 119. [Google Scholar] [CrossRef] [PubMed] [Green Version]
- Jones, C.A.; Martin, R.S.; Westby, M.D.; Beaupre, L.A. Total Joint Arthroplasty: Practice Variation of Physiotherapy across the Continuum of Care in Alberta. BMC Health Serv. Res. 2016, 16, 627. [Google Scholar] [CrossRef] [Green Version]
- Davis, A.M.; Cott, C.A.; Landry, M.D.; Li, L.C.; Jones, A.; Linneker, S.; MacKay, C.; Muzzatti, A.; Venkataramanan, V.; Wong, R.S. Care for People with Arthritis Policy: Decisions, Impacts and Gaps, Arthritis; Arthritis Community Research & Evaluation Unit: Toronto, ON, Canada, 2010; Available online: http://www.modelsofcare.ca/pdf/10-05.pdf (accessed on 1 June 2020).
- Prasanna, S.S.; Korner-Bitensky, N.; Ahmed, S. Why Do People Delay Accessing Health Care for Knee Osteoarthritis? Exploring Beliefs of Health Professionals and Lay People. Physiother. Can. 2013, 65, 56–63. [Google Scholar] [CrossRef] [Green Version]
- Lee, C.; Loh, W.Y.; Qin, X.; Sproul, M. Development of New Performance Measure for Winter Maintenance by Using Vehicle Speed Data. Transp. Res. Rec. 2008, 2055, 89–98. [Google Scholar] [CrossRef] [Green Version]


| Subgroups | GP Patients N (%) | GP Visits N (%) | Ortho Patients N (%) | Ortho Visits N (%) | PT Patients N (%) | PT Visits N (%) | OA Pop N (%) | Reg. Pop N (%) |
|---|---|---|---|---|---|---|---|---|
| Alberta | 170,342 (100) | 577,899 (100) | 47,370 (100) | 132,980 (100) | 39,923 (100) | 215,462 (100) | 359,638 (100) | 3,159,062 (100) |
| Sex | ||||||||
| Female | 100,742 (59.1) | 346,445 (59.9) | 26,455 (55.8) | 73,673 (55.4) | 24,632 (61.7) | 135,426 (62.9) | 209,536 (58.3) | 1,574,534 (49.8) |
| Male | 64,862 (38.1) | 211,450 (36.6) | 19,871 (41.9) | 56,140 (42.2) | 14,504 (36.3) | 76,609 (35.6) | 150,102 (41.7) | 1,584,528 (50.2) |
| Age groups (Years) | ||||||||
| 18–34 | 2683 (1.6) | 8769 (1.5) | 1163 (2.5) | 3889 (2.9) | 0606 (1.5) | 3248 (1.5) | 21,939 (6.1) | 1,056,429 (33.4) |
| 35–44 | 8011 (4.7) | 27,893 (4.8) | 2104 (4.4) | 6164 (4.6) | 1300 (3.3) | 6827 (3.2) | 44,199 (12.3) | 590,364 (18.7) |
| 45–54 | 24,096 (14.1) | 80,838 (14.0) | 6698 (14.1) | 18,585 (14.0) | 4702 (11.8) | 23,703 (11.0) | 89,793 (25.0) | 589,927 (18.7) |
| 55–64 | 42,994 (25.2) | 135,283 (23.4) | 13,213 (27.9) | 37,646 (28.3) | 10,411 (26.1) | 55,593 (25.8) | 97,072 (27.0) | 467,458 (14.8) |
| 65–74 | 40,214 (23.6) | 127,351 (22.0) | 12,551 (26.5) | 35,169 (26.4) | 11,264 (28.2) | 63,371 (29.4) | 69,314 (19.3) | 255,708 (8.1) |
| 75–84 | 31,742 (18.6) | 109,403 (18.9) | 8324 (17.6) | 22,558 (17.0) | 8299 (20.8) | 45,805 (21.3) | 31,316 (8.7) | 140,599 (4.5) |
| 85+ | 15,864 (9.3) | 68,358 (11.8) | 2273 (4.8) | 5802 (4.4) | 2554 (6.4) | 13,488 (6.3) | 6005 (1.7) | 58,577 (1.9) |
| Comorbidity | ||||||||
| No comorbidity | 74,796 (43.9) | 240,315 (41.6) | 22,250 (47.0) | 61,134 (46.0) | 17,813 (44.6) | 94,720 (44.0) | 173,288 (48.2) | NA |
| One comorbidity | 57,817 (33.9) | 196,106 (33.9) | 15,707 (33.2) | 44,172 (33.2) | 13,731 (34.4) | 74,651 (34.6) | 120,936 (33.6) | NA |
| Two comorbidities | 24,150 (14.2) | 87,429 (15.1) | 6302 (13.3) | 18,244 (13.7) | 5613 (14.1) | 31,723 (14.7) | 47,909 (13.3) | NA |
| Three or more comorbidities | 8841 (5.2) | 34,045 (5.9) | 2067 (4.4) | 6263 (4.7) | 1979 (5.0) | 10,941 (5.1) | 17,505 (4.9) | NA |
| Rural–urban continuum | ||||||||
| Metro | 82,952 (48.7) | 276,240 (47.8) | 21,435 (45.3) | 56,873 (42.8) | 21,283 (53.3) | 110,363 (51.2) | 176,502 (49.1) | 1,701,568 (53.9) |
| Moderate Metro | 22,462 (13.2) | 74,630 (12.9) | 6200 (13.1) | 16,655 (12.5) | 7064 (17.7) | 34,005 (15.8) | 48,781 (13.6) | 397,993 (12.6) |
| Urban | 14,112 (8.3) | 44,206 (7.6) | 5916 (12.5) | 20,020 (15.1) | 1697 (4.3) | 11,443 (5.3) | 32,038 (8.9) | 324,084 (10.3) |
| Moderate Urban | 3287 (1.9) | 9695 (1.7) | 1183 (2.5) | 3919 (2.9) | 0368 (0.9) | 2658 (1.2) | 7389 (2.1) | 65,344 (2.1) |
| Rural Centre | 8334 (4.9) | 31,342 (5.4) | 2188 (4.6) | 5992 (4.5) | 1688 (4.2) | 8010 (3.7) | 16,399 (4.6) | 130,994 (4.1) |
| Rural | 34,575 (20.3) | 123,373 (21.3) | 9556 (20.2) | 27,183 (20.4) | 6890 (17.3) | 41,449 (19.2) | 70,408 (19.6) | 469,086 (14.8) |
| Rural Remote | 4620 (2.7) | 18,413 (3.2) | 0892 (1.9) | 2338 (1.8) | 0933 (2.3) | 7534 (3.5) | 8121 (2.3) | 69,993 (2.2) |
| GP Visits | |||||||||
|---|---|---|---|---|---|---|---|---|---|
| Rural–Urban Continuum | Exponential | Log-Logistic | Power | ||||||
| Pseudo-R2 | AIC | Pseudo-R2 | AIC | β | θ | RSE | Pseudo-R2 | AIC | |
| Alberta | 0.998 | −327.3 | 0.997 | −317.8 | 1.27 *** | 10.49 *** | 0.02 | 0.936 | −124.3 |
| Metro | 0.996 | −294.6 | 0.998 | −332.2 | 1.98 *** | 11.82 *** | 0.02 | 0.910 | −83.4 |
| Moderate Metro | 0.996 | −305.3 | 0.990 | −226.7 | 1.39 *** | 14.40 *** | 0.04 | 0.914 | −86.2 |
| Urban | 0.985 | −196.1 | 0.991 | −233.9 | 1.81 *** | 7.21 *** | 0.04 | 0.936 | −140.4 |
| Moderate Urban | 0.996 | −283.3 | 0.990 | −233.4 | 1.26 *** | 12.28 *** | 0.04 | NA | 50.3 |
| Rural Centre | 0.971 | −147.4 | 0.987 | −245.3 | 0.88 *** | 8.66 *** | 0.04 | 0.956 | −166.4 |
| Rural | 0.994 | −319.5 | 0.949 | −168.0 | 0.73 *** | 7.87 *** | 0.07 | 0.906 | −130.7 |
| Rural Remote | 0.996 | −364.8 | 0.834 | −124.0 | 0.44 *** | 3.11 *** | 0.09 | 0.886 | −156.0 |
| Ortho Visits | |||||||||
| Rural–Urban Continuum | Exponential | Log-logistic | Power | ||||||
| Pseudo-R2 | AIC | Pseudo-R2 | AIC | β | θ | RSE | Pseudo-R2 | AIC | |
| Alberta | 0.995 | −247.0 | 0.999 | −378.2 | 1.43 *** | 29.16 *** | 0.01 | 0.906 | −63.4 |
| Metro | 0.985 | −176.0 | 0.999 | −346.5 | 2.94 *** | 20.36 *** | 0.02 | 0.867 | −26.6 |
| Moderate Metro | 0.970 | −103.9 | 0.999 | −341.1 | 3.99 *** | 38.82 *** | 0.02 | 0.805 | 19.6 |
| Urban | 0.964 | −92.9 | 0.958 | −107.9 | 1.39 *** | 8.45 *** | 0.09 | 0.932 | −103.3 |
| Moderate Urban | 0.980 | −144.0 | 0.987 | −172.7 | 1.68 *** | 30.35 *** | 0.06 | −0.245 | 93.8 |
| Rural Centre | 0.981 | −147.4 | 0.987 | −151.7 | 2.04 *** | 75.94 *** | 0.07 | 0.810 | −10.2 |
| Rural | 0.987 | −180.4 | 0.998 | −284.6 | 2.25 *** | 84.55 *** | 0.03 | 0.802 | −4.1 |
| Rural Remote | 0.953 | −61.9 | 0.998 | −166.0 | 2.98 *** | 250.18 *** | 0.02 | −0.146 | 90.3 |
| PT Visits | |||||||||
| Rural–Urban Continuum | Exponential | Log-logistic | Power | ||||||
| Pseudo-R2 | AIC | Pseudo-R2 | AIC | β | θ | RSE | Pseudo-R2 | AIC | |
| Alberta | 0.983 | −164.4 | 0.995 | −222.1 | 2.42 *** | 31.67 *** | 0.05 | NA | 111.2 |
| Metro | 0.962 | −80.7 | 0.999 | −324.0 | 5.02 *** | 33.56 *** | 0.02 | 0.157 | 125.6 |
| Moderate Metro | 0.975 | −111.0 | 0.997 | −258.0 | 3.33 *** | 36.74 *** | 0.03 | 0.807 | 16.6 |
| Urban | 0.961 | −102.9 | 0.994 | −170.7 | 3.93 *** | 11.54 *** | 0.05 | 0.873 | −43.4 |
| Moderate Urban | 0.968 | −103.2 | 0.978 | −113.2 | 2.26 *** | 19.67 *** | 0.08 | 0.858 | −26.9 |
| Rural Centre | 0.944 | −140.6 | 0.975 | −192.8 | 0.79 *** | 12.75 *** | 0.05 | NA | 59.0 |
| Rural | 0.995 | −282.1 | 0.968 | −151.2 | 1.08 *** | 24.46 *** | 0.08 | 0.866 | −62.0 |
| Rural Remote | 0.964 | −134.1 | 0.844 | −67.3 | 0.66 *** | 22.89 *** | 0.09 | −0.247 | 28.4 |
Publisher’s Note: MDPI stays neutral with regard to jurisdictional claims in published maps and institutional affiliations. |
© 2022 by the authors. Licensee MDPI, Basel, Switzerland. This article is an open access article distributed under the terms and conditions of the Creative Commons Attribution (CC BY) license (https://creativecommons.org/licenses/by/4.0/).
Share and Cite
Liu, X.; Seidel, J.E.; McDonald, T.; Patel, A.B.; Waters, N.; Bertazzon, S.; Shahid, R.; Marshall, D.A. Rural–Urban Disparities in Realized Spatial Access to General Practitioners, Orthopedic Surgeons, and Physiotherapists among People with Osteoarthritis in Alberta, Canada. Int. J. Environ. Res. Public Health 2022, 19, 7706. https://doi.org/10.3390/ijerph19137706
Liu X, Seidel JE, McDonald T, Patel AB, Waters N, Bertazzon S, Shahid R, Marshall DA. Rural–Urban Disparities in Realized Spatial Access to General Practitioners, Orthopedic Surgeons, and Physiotherapists among People with Osteoarthritis in Alberta, Canada. International Journal of Environmental Research and Public Health. 2022; 19(13):7706. https://doi.org/10.3390/ijerph19137706
Chicago/Turabian StyleLiu, Xiaoxiao, Judy E. Seidel, Terrence McDonald, Alka B. Patel, Nigel Waters, Stefania Bertazzon, Rizwan Shahid, and Deborah A. Marshall. 2022. "Rural–Urban Disparities in Realized Spatial Access to General Practitioners, Orthopedic Surgeons, and Physiotherapists among People with Osteoarthritis in Alberta, Canada" International Journal of Environmental Research and Public Health 19, no. 13: 7706. https://doi.org/10.3390/ijerph19137706
APA StyleLiu, X., Seidel, J. E., McDonald, T., Patel, A. B., Waters, N., Bertazzon, S., Shahid, R., & Marshall, D. A. (2022). Rural–Urban Disparities in Realized Spatial Access to General Practitioners, Orthopedic Surgeons, and Physiotherapists among People with Osteoarthritis in Alberta, Canada. International Journal of Environmental Research and Public Health, 19(13), 7706. https://doi.org/10.3390/ijerph19137706