
Investigation of Rice Yields and Critical N Losses from Paddy Soil under Different N Fertilization Rates with Iron Application

 ,
,  , and
, and
Abstract
:1. Introduction
2. Materials and Methods
2.1. Field Site
2.2. Experimental Field and Design
2.3. Measurement of Soil Fe2+ Contents
2.4. NH3 Volatilization Measurement
2.5. N2O Emission Measurement
2.6. NO3− and NH4+ Leaching Measurement
2.7. Statistical Analyses
3. Results
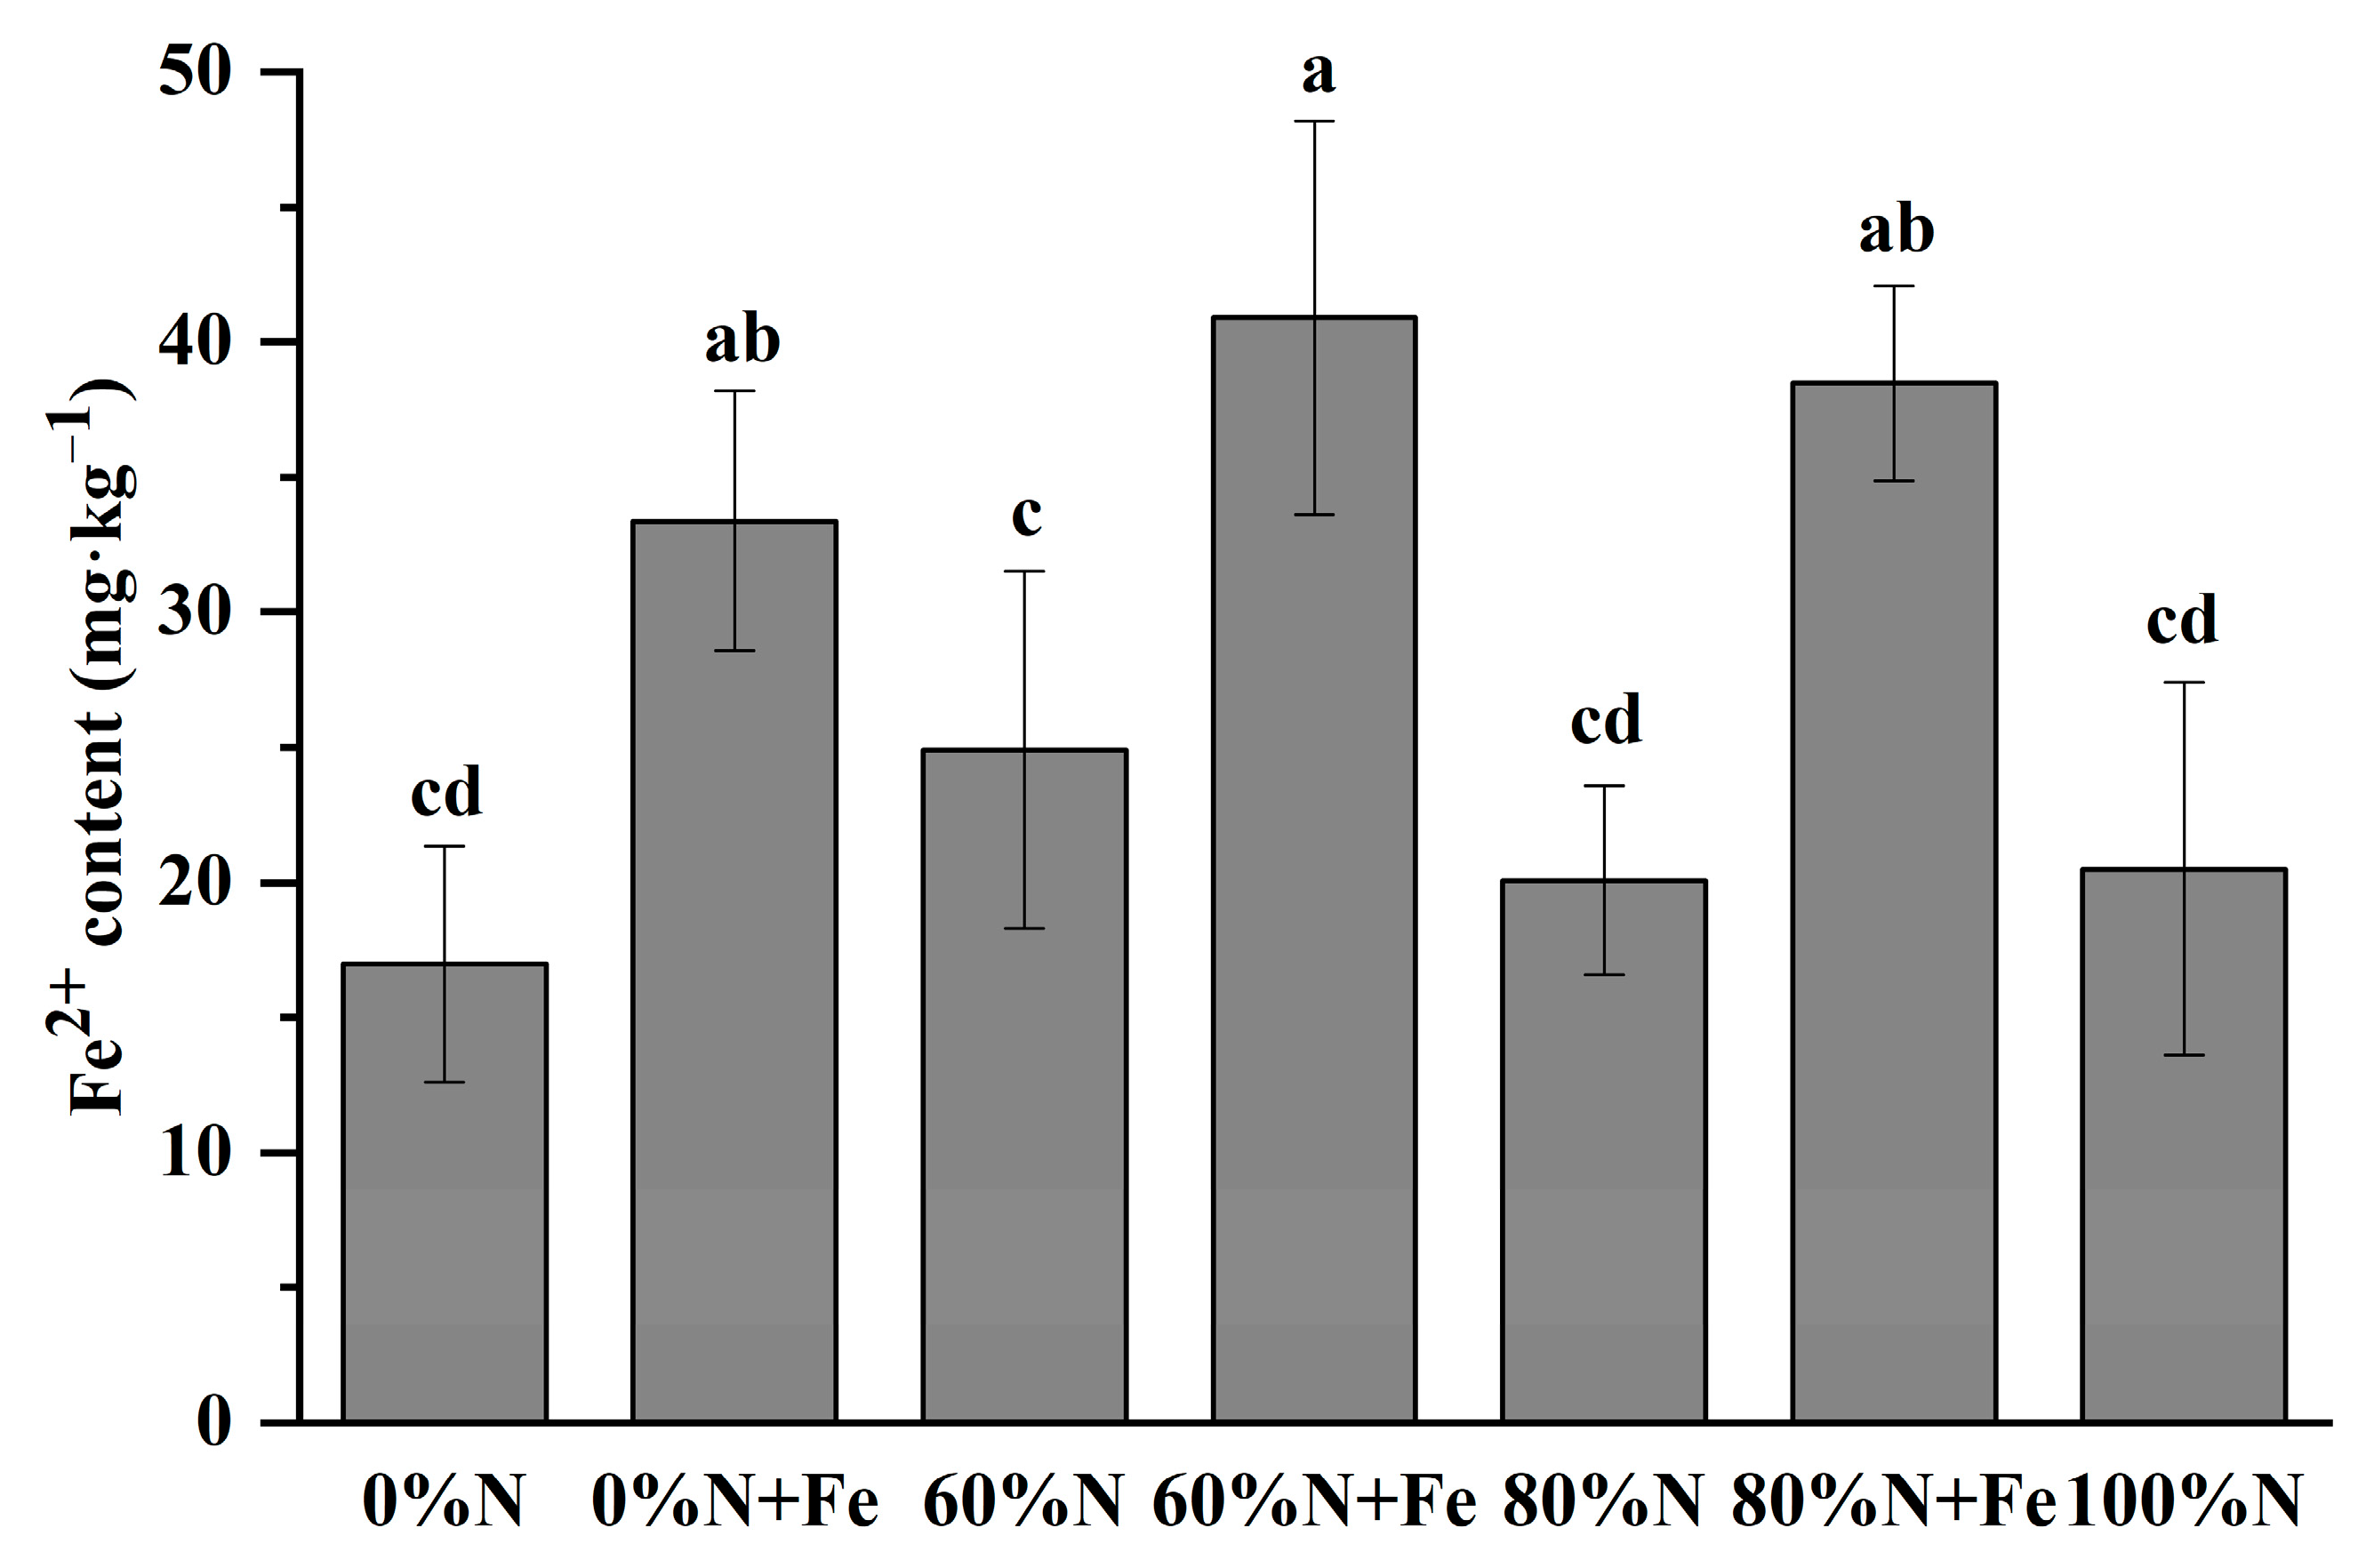
3.1. Soil Fe2+ Contents
3.2. Rice Yield
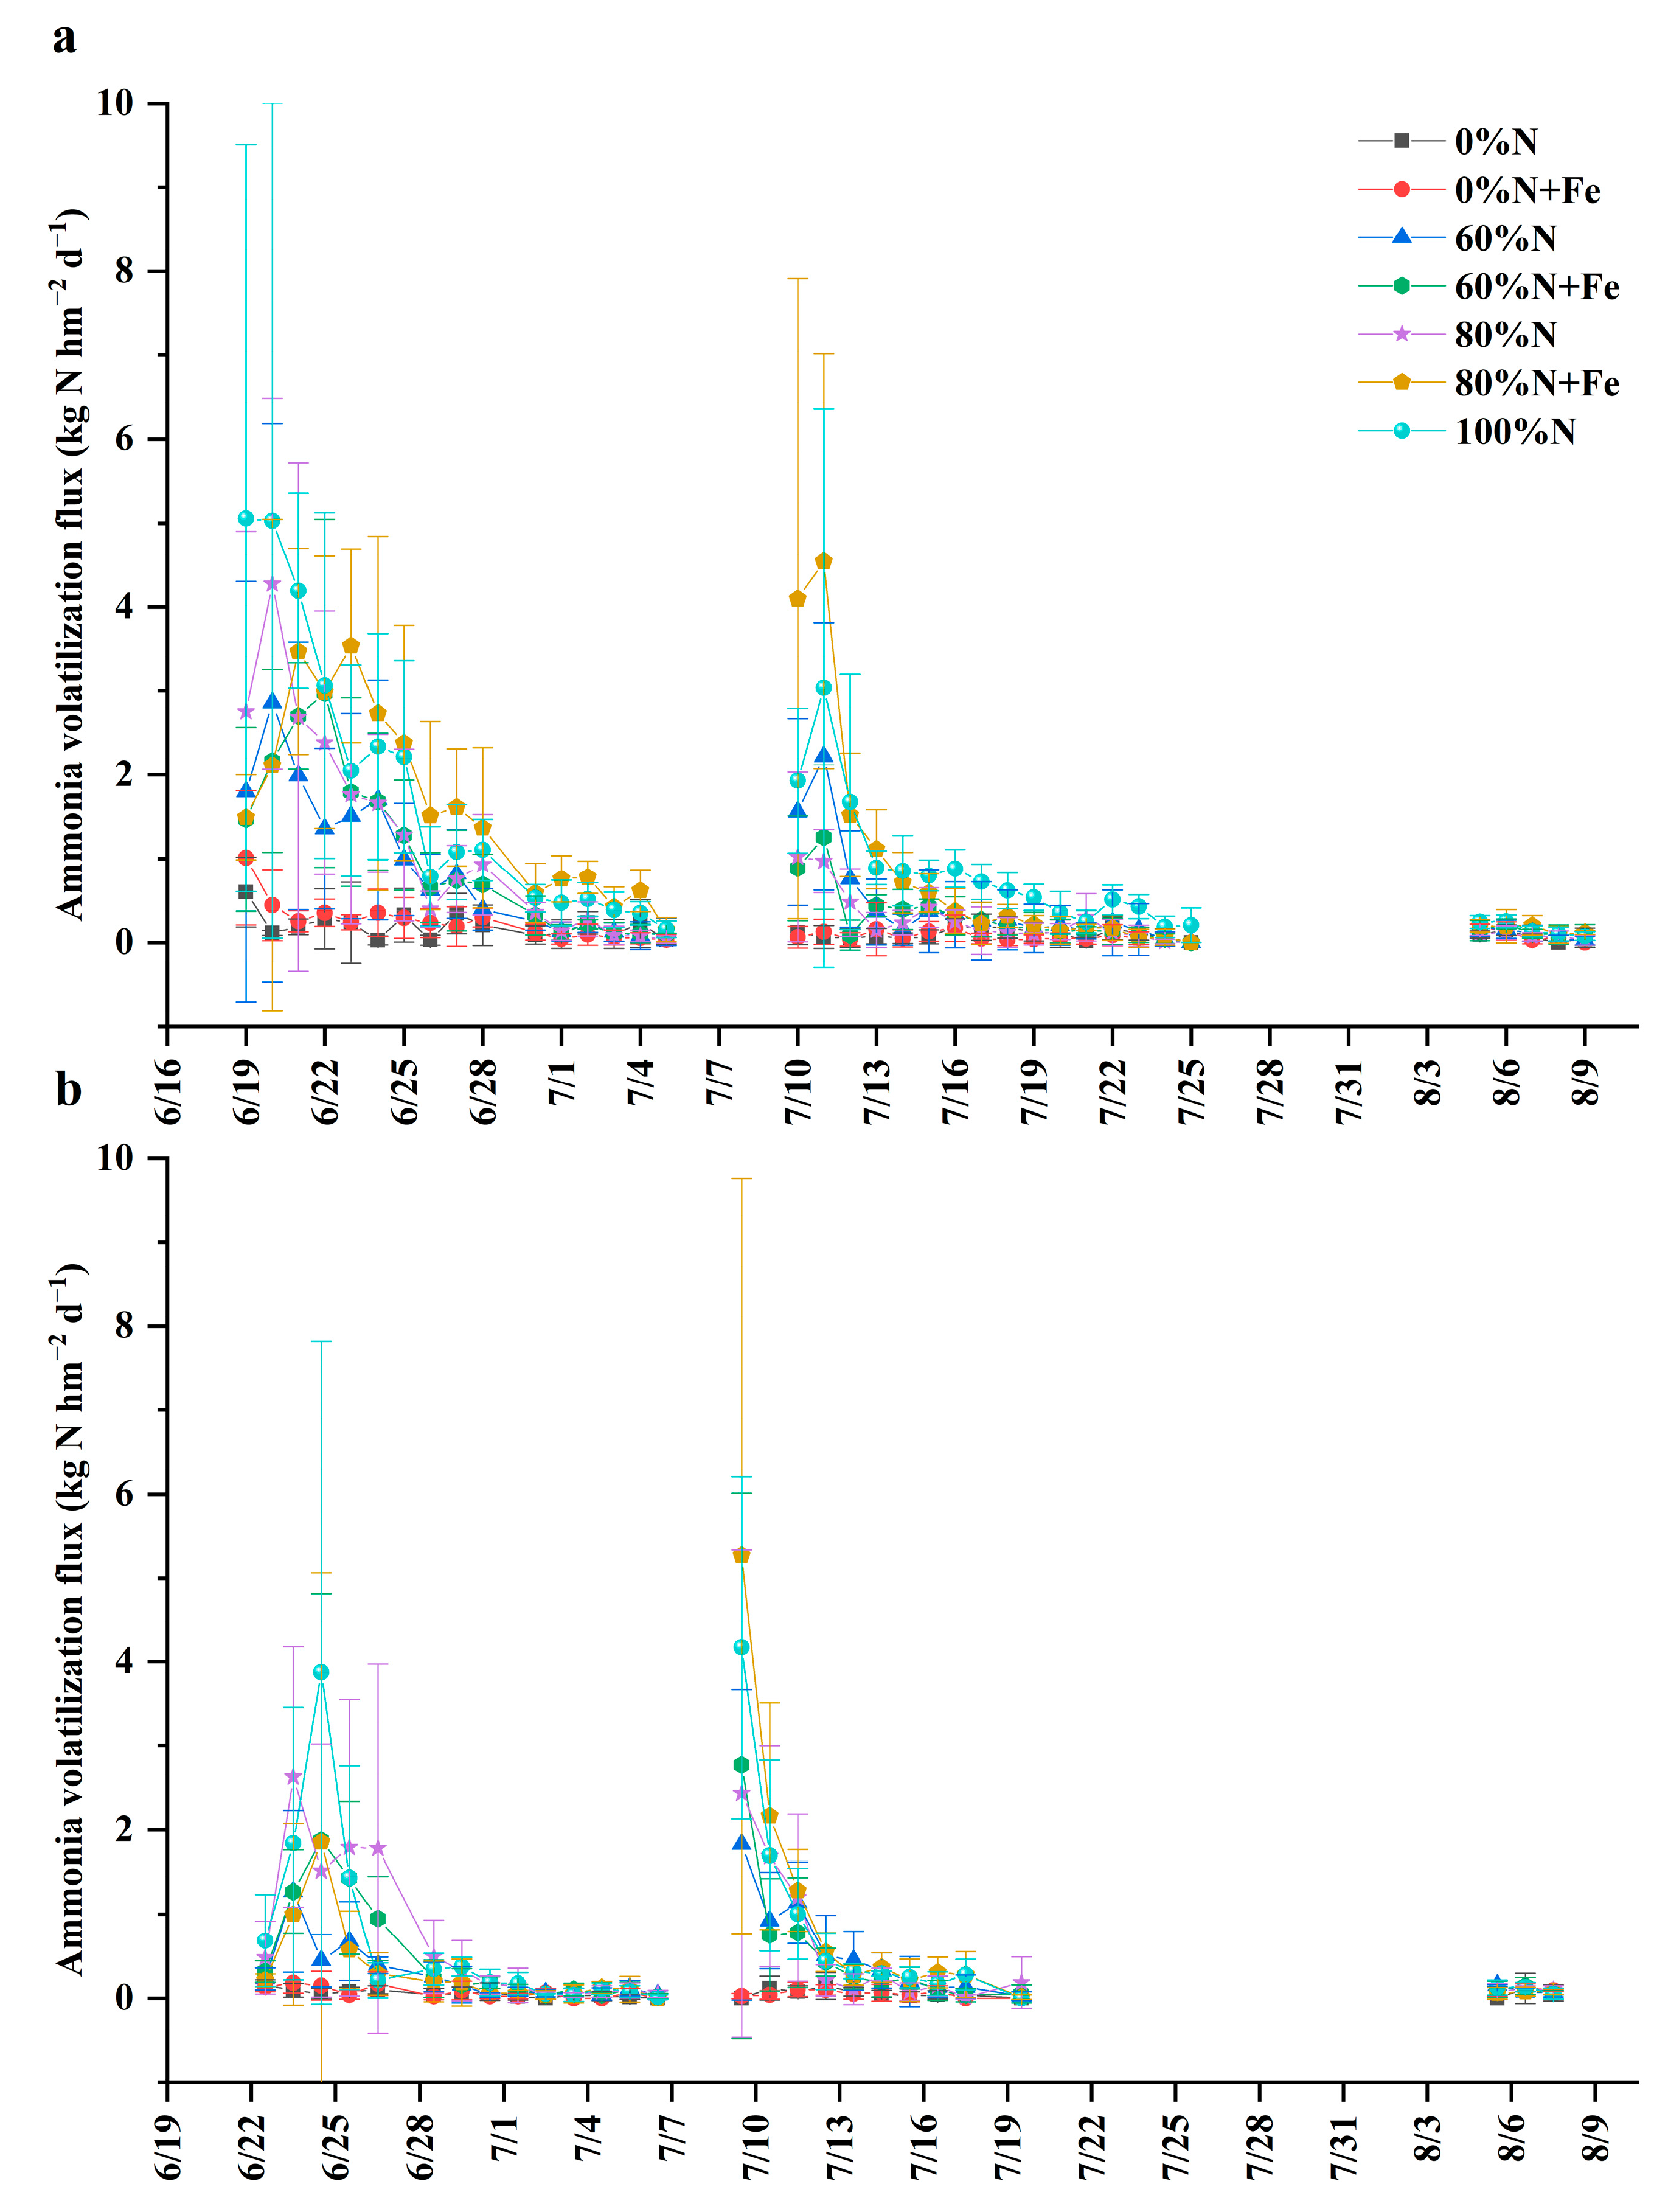
3.3. NH3 Volatilization
3.4. N2O Emissions
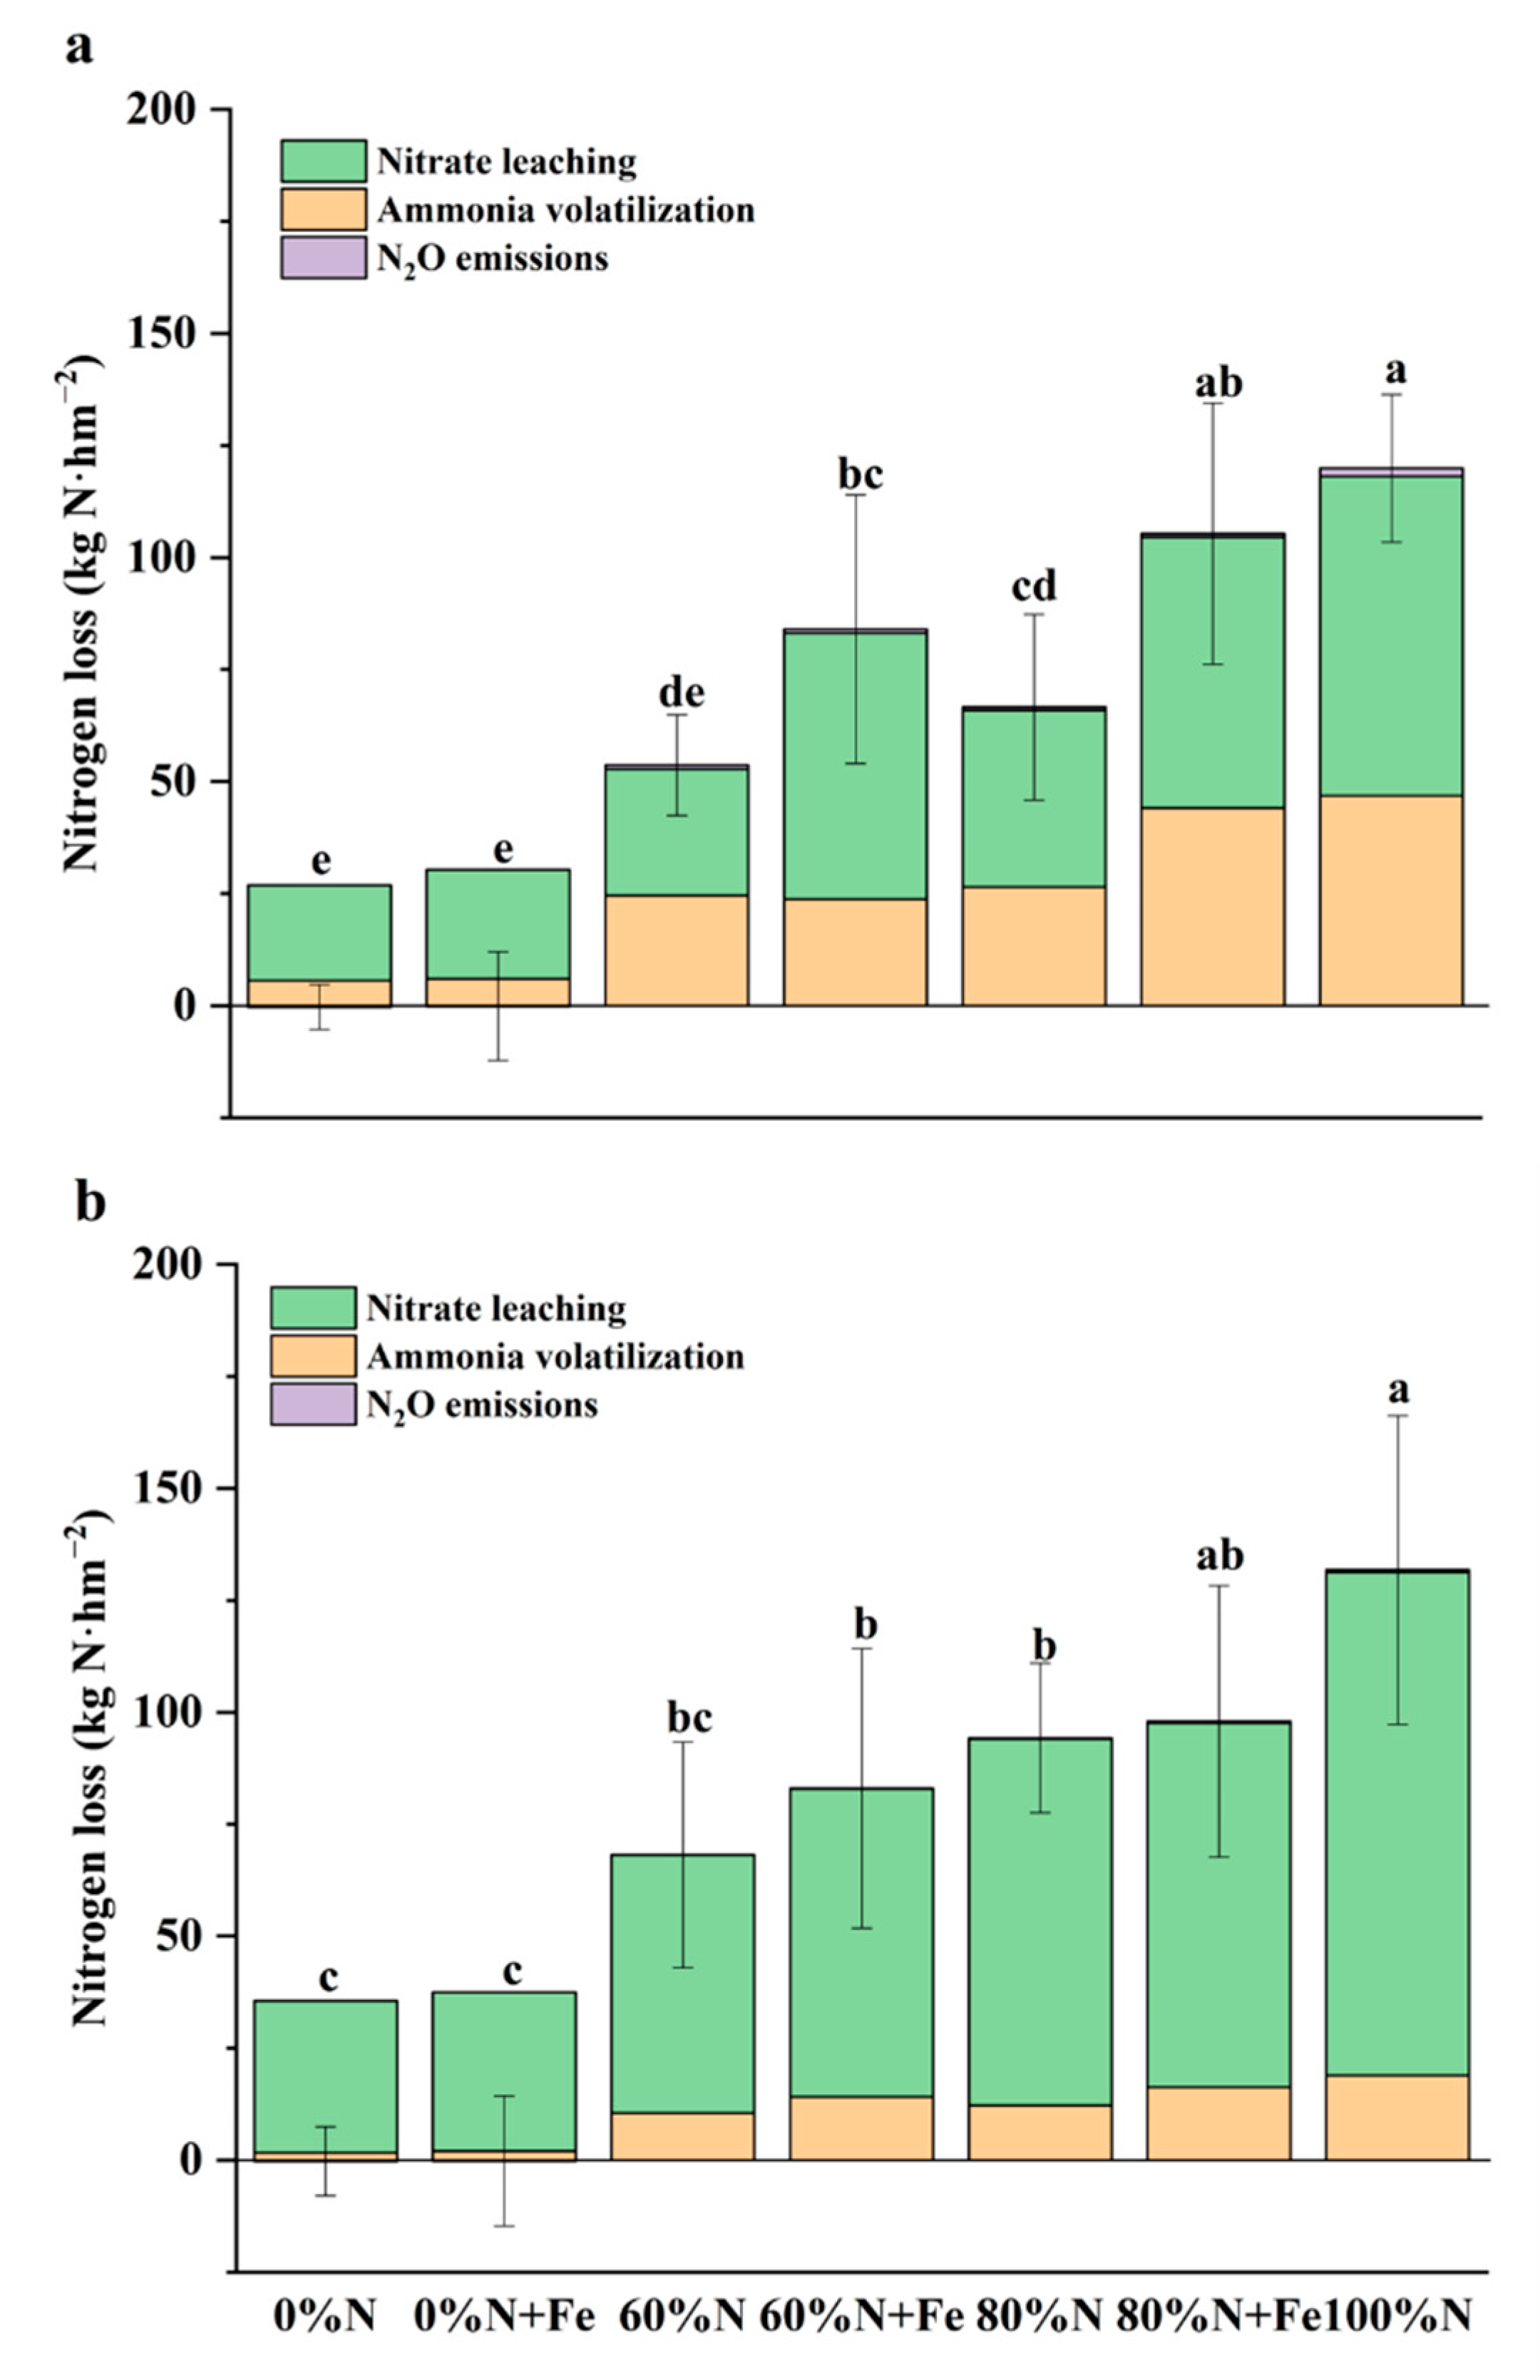
3.5. NO3− and NH4+ Leaching
4. Discussion
5. Conclusions
Supplementary Materials
Author Contributions
Funding
Institutional Review Board Statement
Informed Consent Statement
Data Availability Statement
Conflicts of Interest
References
- Greenland, D.J. CAB International and the International Rice Research Institute, Manila, Philippines. In The Sustainability of Rice Farming; CAB International: Wallingford, UK, 1998. [Google Scholar]
- Woolston, C. Rice. Nature 2014, 514, S49. [Google Scholar] [CrossRef] [PubMed] [Green Version]
- Tilman, D.; Cassman, K.G.; Matson, P.A.; Naylor, R.; Polasky, S. Agricultural sustainability and intensive production practices. Nature 2002, 418, 671–677. [Google Scholar] [CrossRef] [PubMed]
- Roberts, T. The role of fertilizer in growing the world’s food. Better Crops 2009, 93, 12–15. [Google Scholar]
- Timsina, J. Can organic sources of nutrients increase crop yields to meet global food demand? Agronomy 2018, 8, 214. [Google Scholar] [CrossRef] [Green Version]
- Gellings, C.W.; Parmenter, K.E. Energy efficiency in fertilizer production and use. In Efficient Use and Conversation of Energy; Encyclopedia of Life Support Systems (EOLSS): Oxford, UK, 2004. [Google Scholar]
- Tenkorang, F.; Lowenberg-DeBoer, J. Forecasting long-term global fertilizer demand. Nutr. Cycl. Agroecosystems 2009, 83, 233–247. [Google Scholar] [CrossRef]
- Ju, X.T.; Xing, G.X.; Chen, X.P.; Zhang, S.L.; Zhang, L.J.; Liu, X.J.; Cui, Z.L. Reducing environmental risk by improving N management in intensive Chinese agricultural systems. Proc. Natl. Acad. Sci. USA 2009, 106, 3041–3046. [Google Scholar] [CrossRef] [Green Version]
- Liu, X.J.; Zhang, Y.; Han, W.X.; Tang, A.H.; Shen, J.L.; Cui, Z.L.; Vitousek, P. Enhanced nitrogen deposition over China. Nature 2013, 494, 459–462. [Google Scholar] [CrossRef]
- Zhang, W.F.; Dou, Z.X.; He, P.; Powlson, D.; Chadwick, D.; Norse, D.; Lu, Y.L. New technologies reduce greenhouse gas emissions from nitrogenous fertilizer in China. Proc. Natl. Acad. Sci. USA 2013, 110, 8375–8380. [Google Scholar] [CrossRef] [Green Version]
- Zhang, C.; Ju, X.T.; Powlson, D.; Oenema, O.; Smith, P. Nitrogen surplus benchmarks for controlling N pollution in the main cropping systems of China. Environ. Sci. Technol. 2019, 53, 6678–6687. [Google Scholar] [CrossRef]
- Jansen, R.C.; Shi, Y.; Chen, J.; Hu, Y.; Xu, C.; Hong, S.; Li, J.; Zhang, M. Using hourly measurements to explore the role of secondary inorganic aerosol in PM2.5 during haze and fog in Hangzhou, China. Adv. Atmos. Sci. 2014, 31, 1427–1434. [Google Scholar] [CrossRef]
- David, B.; Mejdell, C.; Michel, V.; Lund, V.; Moe, R.O. Air quality in alternative housing systems may have an impact on laying hen welfare. Part II—Ammonia. Animals 2015, 5, 886–896. [Google Scholar] [PubMed] [Green Version]
- Zhang, X.; Davidson, E.A.; Mauzerall, D.L.; Searchinger, T.D.; Dumas, P.; Shen, Y. Managing nitrogen for sustainable development. Nature 2015, 528, 51–59. [Google Scholar] [CrossRef] [PubMed] [Green Version]
- Peng, S.B.; Buresh, R.J.; Huang, J.L.; Zhong, X.H.; Zou, Y.B.; Yang, J.C.; Wang, G.H. Improving nitrogen fertilization in rice by site specific management. A review. Agron. Sustain. Dev. 2010, 30, 649–656. [Google Scholar] [CrossRef]
- Shindo, S.; Okamoto, K.; Kawashima, H. A model-based estimation of nitrogen flow in the food production–supply system and its environmental effects in East Asia. Ecol. Model. 2003, 169, 197–212. [Google Scholar] [CrossRef]
- Jin, S.Q.; Zhou, F. Zero Growth of Chemical Fertilizer and Pesticide Use: China’s objectives, progress and challenges. J. Resour. Ecology. 2018, 9, 50–58. [Google Scholar]
- De Bruijn, F.J. Biological nitrogen fixation. In Principles of Plant-Microbe Interactions; Springer: Cham, Switzerland, 2015. [Google Scholar]
- Santi, C.; Bogusz, D.; Franche, C. Biological nitrogen fixation in non-legume plants. Ann. Bot. 2013, 111, 743–767. [Google Scholar] [CrossRef] [PubMed] [Green Version]
- Vitousek, P.M.; Menge, D.N.L.; Reed, S.C.; Cleveland, C.C. Biological nitrogen fixation: Rates, patterns and ecological controls in terrestrial ecosystems. Philos. Trans. R. Soc. B Biol. Sci. 2013, 368, 20130119. [Google Scholar] [CrossRef] [Green Version]
- Dai, X.L.; Song, D.L.; Guo, Q.K.; Zhou, W.; Liu, G.R.; Ma, R.P.; Liang, G.Q.; He, P.; Sun, G.; Yuan, F.S.; et al. Predicting the influence of fertilization regimes on potential N fixation through their effect on free-living diazotrophic community structure in double rice cropping systems. Soil Biol. Biochem. 2021, 156, 108220. [Google Scholar] [CrossRef]
- Zhang, Y.H.; Hu, T.L.; Wang, H.; Jin, H.Y.; Liu, Q.; Lin, Z.B.; Liu, B.J.; Liu, H.T.; Chen, Z.; Lin, X.W.; et al. How do different nitrogen application levels and irrigation practices impact biological nitrogen fixation and its distribution in paddy system? Plant Soil. 2021, 467, 329–344. [Google Scholar] [CrossRef]
- Zhu, Z.L. Contribution of non-symbiotic nitrogen fixation in paddy field to nitrogen uptake by rice in current season. Soils 1986, 5, 225–229. (In Chinese) [Google Scholar]
- Wang, X.; Liu, B.; Ma, J.; Zhang, Y.; Hu, T.; Zhang, H.; Feng, Y.C. Soil aluminum oxides determine biological nitrogen fixation and diazotrophic communities across major types of paddy soils in China. Soil Biol. Biochem. 2019, 131, 81–89. [Google Scholar] [CrossRef]
- Yao, Y.L.; Zhang, M.; Tian, Y.H.; Zhao, M.; Zhang, B.W.; Zeng, K.; Zhao, M.; Yin, B. Urea deep placement in combination with Azolla for reducing nitrogen loss and improving fertilizer nitrogen recovery in rice field. Field Crops Res. 2018, 218, 141–149. [Google Scholar] [CrossRef]
- Masuda, Y.; Itoh, H.; Shiratori, Y.; Isobe, K.; Otsuka, S.; Senoo, K. Predominant but previously-overlooked prokaryotic drivers of reductive nitrogen transformation in paddy soils, revealed by metatranscriptomics. Microbes Environ. 2017, 32, 180–183. [Google Scholar] [CrossRef] [PubMed] [Green Version]
- Masuda, Y.; Shiratori, Y.; Ohba, H.; Ishida, T.; Takano, R.; Satoh, S.; Shen, W.S. Enhancement of the nitrogen-fixing activity of paddy soils owing to iron application. Soil Sci. Plant Nutr. 2021, 67, 243–247. [Google Scholar] [CrossRef]
- Ding, L.J.; Su, J.Q.; Xu, H.J.; Jia, Z.J.; Zhu, Y.G. Long-term nitrogen fertilization of paddy soil shifts iron-reducing microbial community revealed by RNA-13C-acetate probing coupled with pyrosequencing. ISME J. 2015, 9, 721–734. [Google Scholar] [CrossRef]
- Kim, Y.; Liesack, W. Differential Assemblage of Functional Units in Paddy Soil Microbiomes. PLoS ONE 2015, 10, e0122221. [Google Scholar] [CrossRef] [Green Version]
- Glissmann, K.; Conrad, R. Fermentation Pattern of Methanogenic Degradation of Rice Straw in Anoxic Paddy Soil. FEMS Microbiol. Ecol. 2000, 31, 117–126. [Google Scholar] [CrossRef]
- Masuda, Y.; Yamanaka, H.; Xu, Z.X.; Shiratori, Y.; Aono, T.; Amachi, S.; Senoo, K.; Itoh, H. Diazotrophic Anaeromyxobacter Isolates from Soils. Appl. Environ. Microbiol. 2020, 86, 16. [Google Scholar] [CrossRef]
- Symanowicz, B.; Skorupka, W.; Becher, M.; Jaremko, D.; Krasuski, S. The Effect of Alfalfa Mineral Fertilization and Times of Soil Sampling on Enzymatic Activity. Agronomy 2021, 11, 1335. [Google Scholar] [CrossRef]
- Gong, Z.T. Chinese Soil Taxonomy; Science Press: Beijing, China; New York, NY, USA, 2001. [Google Scholar]
- IUSS Working Group WRB. World Reference Base for Soil Resources 2006; World Soil Resources Reports No. 103; FAO: Rome, Italy, 2006. [Google Scholar]
- Lu, R.K. Methods of Soil Agricultural Chemical Analysis; China Agriculture Science & Technology Press: Beijing, China, 2000. (In Chinese) [Google Scholar]
- Kissel, D.E.; Brewer, H.L.; Arkin, G.F. Design and test of a field sampler for ammonia volatilization. Soil Sci. Soc. Am. J. 1977, 41, 1133–1138. [Google Scholar] [CrossRef]
- Min, J.; Sun, H.J.; Kronzucker, H.J.; Wang, Y.; Shi, W.M. Comprehensive assessment of the effects of nitrification inhibitor application on reactive nitrogen losses in intensive vegetable production systems. Agric. Ecosyst. Environ. 2021, 307, 107227. [Google Scholar] [CrossRef]
- Klein, C.A.M.; Harvey, M.J. Nitrous Oxide Chamber Methodology Guidelines; Ministry of Primary Industries: Wellington, New Zealand, 2012.
- Uchida, Y.; Wang, Y.; Akiyama, H.; Nakajima, Y.; Hayatsu, M. Expression of denitrification genes in response to a waterlogging event in a Fluvisol and its relationship with large nitrous oxide pulses. FEMS Microbiol. Ecol. 2014, 88, 407–423. [Google Scholar] [CrossRef] [PubMed]
- Yoshida, T.; Ancajas, R.R. Nitrogen-fixing Activity in Upland and Flooded Rice Fields. Soil Sci. Soc. Am. J. 1973, 37, 42–46. [Google Scholar] [CrossRef]
- Ladha, J.K.; Tirol-Padre, A.; Reddy, C.K.; Cassman, K.G.; Verma, S.; Powlson, D.S.; Kessel, C.V. Global Nitrogen Budgets in Cereals: A 50-year Assessment for Maize, Rice and Wheat Production Systems. Sci. Rep. 2016, 6, 19355. [Google Scholar] [CrossRef] [Green Version]
- Choudhury, A.T.M.A.; Kennedy, I.R. Prospects and Potentials for Systems of Biological Nitrogen Fixation in Sustainable Rice Production. Biol. Fertil. Soils. 2004, 39, 219–227. [Google Scholar] [CrossRef]
- Levar, C.E.; Hoffman, C.L.; Dunshee, A.J.; Toner, B.M.; Bond, D.R. Redox potential as a master variable controlling pathways of metal reduction by Geobacter sulfurreducens. ISME J. 2017, 11, 741–752. [Google Scholar] [CrossRef] [PubMed] [Green Version]
- Wang, J.J.; Ma, Y.; Di, L.; Qian, X.Q.; Wang, G.L. Straw incorporation with nitrogen amendment shapes bacterial community structure in an iron-rich paddy soil by altering nitrogen reserves. Microorganisms 2021, 9, 988. [Google Scholar] [CrossRef]
- Lin, D.X.; Fan, X.H.; Hu, F.; Zhao, H.T.; Luo, J.F. Ammonia volatilization and nitrogen utilization efficiency in response to urea application in rice fields of the Taihu Lake Region, China. Pedosphere 2007, 17, 639–645. [Google Scholar] [CrossRef]
- Yang, S.H.; Peng, S.Z.; Xu, J.Z.; Hou, H.J.; Gao, X.L. Nitrogen loss from paddy field with different water and nitrogen managements in Taihu lake region of China. Commun. Soil Sci. Plant Anal. 2013, 44, 2393–2407. [Google Scholar] [CrossRef]
- Chen, A.Q.; Lei, B.K.; Hu, W.L.; Lu, Y.; Mao, Y.T.; Duan, Z.Y.; Shi, Z.S. Characteristics of ammonia volatilization on rice grown under different nitrogen application rates and its quantitative predictions in Erhai Lake Watershed, China. Nutr. Cycl. Agroecosytems 2015, 101, 139–152. [Google Scholar] [CrossRef]
- Hayashi, K.; Nishimura, S.; Yagi, K. Ammonia volatilization from the surface of a Japanese paddy field during rice cultivation. Soil Sci. Plant Nutr. 2006, 52, 545–555. [Google Scholar] [CrossRef]
- Pan, Y.P.; Tian, S.L.; Zhao, Y.H.; Zhang, L.; Zhu, X.Y.; Gao, J.; Huang, W. Identifying ammonia hotspots in China using a national observation network. Environ. Sci. Technol. 2018, 52, 3926–3934. [Google Scholar] [CrossRef] [PubMed] [Green Version]
- Xie, W.M.; Li, S.J.; Shi, W.M.; Zhang, H.L.; Fang, F.; Wang, G.X.; Zhang, L.M. Quantitatively ranking the influencing factors of ammonia volatilization from paddy soils by grey relational entropy. Environ. Sci. Pollut. Res. 2020, 27, 2319–2327. [Google Scholar] [CrossRef] [PubMed]
- Majumdar, D. Biogeochemistry of N2O uptake and consumption in submerged soils and rice fields and implications in climate change. Crit. Rev. Environ. Sci. Technol. 2013, 43, 2653–2684. [Google Scholar] [CrossRef]
- Zhu, J.G.; Liu, G.; Han, Y.; Zhang, Y.L.; Xing, G.X. Nitrate distribution and denitrification in the saturated zone of paddy field under rice/wheat rotation. Chemosphere 2003, 50, 725–732. [Google Scholar] [CrossRef]
- Xiong, Z.Q.; Huang, T.Q.; Ma, Y.C.; Xing, G.X.; Zhu, Z.L. Nitrate and ammonium leaching in variable- and permanent-charge paddy soils. Pedosphere 2010, 20, 209–216. [Google Scholar] [CrossRef]
- Mo’allim, A.A.; Kama, M.R.; Muhammed, H.H.; Soom, M.A.M.; Zawawi, M.A.M.; Wayayok, A.; Man, H.B.C. Assessment of Nutrient Leaching in Flooded Paddy Rice Field Experiment Using Hydrus-1D. Water 2018, 10, 785. [Google Scholar] [CrossRef] [Green Version]


| Treatment | Wheat (kg N hm−2) | Rice (kg N hm−2) | |||
|---|---|---|---|---|---|
| Basal Fertilizer | Supplementary Fertilizer | Basal Fertilizer | First Supplementary Fertilizer | Second Supplementary Fertilizer | |
| 0%N | 0 | 0 | 0 | 0 | 0 |
| 0%N + Fe | 0 | 0 | 0 | 0 | 0 |
| 60%N | 89.1 | 59.4 | 113.4 | 56.7 | 18.9 |
| 60%N + Fe | 89.1 | 59.4 | 113.4 | 56.7 | 18.9 |
| 80%N | 118.8 | 79.2 | 151.2 | 75.6 | 25.2 |
| 80%N + Fe | 118.8 | 79.2 | 151.2 | 75.6 | 25.2 |
| 100%N | 148.5 | 99 | 189 | 94.5 | 31.5 |
| Treatment | Cumulative Ammonia Volatilization (kg N hm−2) | Ammonia Volatilization Intensity (g N kg−1) | ||
|---|---|---|---|---|
| 2019 | 2020 | 2019 | 2020 | |
| 0%N | 5.6 ± 1.8 c | 1.7 ± 0.5 b | 1.3 ± 0.4 c | 0.6 ± 0.2 c |
| 0%N + Fe | 6.0 ± 1.6 c | 2.0 ± 0.5 b | 1.5 ± 0.3 c | 0.8 ± 0.4 bc |
| 60%N | 22.1 ± 13.0 b | 10.5 ± 3.3 ab | 3.6 ± 1.8 b | 1.6 ± 0.6 abc |
| 60%N + Fe | 23.8 ± 4.3 b | 14.1 ± 6.1 a | 3.1 ± 0.5 b | 2.0 ± 0.9 ab |
| 80%N | 26.5 ± 11.0 b | 12.2 ± 1.5 a | 3.3 ± 1.1 b | 2.2 ± 1.5 a |
| 80%N + Fe | 44.1 ± 9.7 a | 16.3 ± 8.1 a | 5.5 ± 1.4 a | 2.1 ± 1.2 a |
| 100%N | 46.8 ± 9.7 a | 18.9 ± 7.4 a | 5.2 ± 0.8 a | 2.1 ± 0.6 a |
| Treatment | Cumulative N2O Emissions (g N hm−2) | N2O Emission Intensity (kg CO2-eq·kg−1) | ||
|---|---|---|---|---|
| 2019 | 2020 | 2019 | 2020 | |
| 0%N | −271.97 ± 110.73 d | −232.56 ± 87.90 e | −0.02 ± 0.01 d | −0.02 ± 0.01 c |
| 0%N + Fe | −122.8 ± 70.06 cd | −194.85 ± 13.98 e | −0.01 ± 0.00 cd | −0.02 ± 0.01 c |
| 60%N | 353.26 ± 352.78 bcd | 27.92 ± 62.90 d | 0.01 ± 0.01 bc | 0.00 ± 0.00 b |
| 60%N + Fe | 386.60 ± 140.08 bc | 92.30 ± 80.82 d | 0.01 ± 0.01 bc | 0.00 ± 0.00 b |
| 80%N | 659.25 ± 510.83 b | 207.74 ± 55.13 c | 0.02 ± 0.02 b | 0.01 ± 0.00 b |
| 80%N + Fe | 760.79 ± 573.42 b | 343.53 ± 76.68 b | 0.03 ± 0.02 b | 0.01 ± 0.01 b |
| 100%N | 1737.08 ± 722.16 a | 472.14 ± 124.40 a | 0.05 ± 0.02 a | 0.01 ± 0.01 a |
| Treatment | NO3−-N (kg·hm−2) | NH4+-N (kg·hm−2) | ||||
|---|---|---|---|---|---|---|
| 30 cm | 60 cm | 90 cm | 30 cm | 60 cm | 90 cm | |
| 0%N | 10.60 ± 3.53 b | 6.93 ± 2.93 b | 3.76 ± 1.09 b | 1.99 ± 1.79 b | 0.77 ± 0.40 b | −0.11 ± 0.09 b |
| 0%N + Fe | 13.13 ± 7.74 b | 8.68 ± 3.10 b | 2.53 ± 0.53 b | 1.44 ± 3.43 b | 1.43 ± 1.80 b | 0.13 ± 0.02 b |
| 60%N | 14.08 ± 7.03 b | 7.80 ± 3.11 b | 6.37 ± 3.15 b | 0.29 ± 0.70 b | 2.60 ± 1.98 ab | 1.78 ± 3.31 b |
| 60%N + Fe | 21.07 ± 4.95 ab | 18.20 ± 12.00 ab | 20.16 ± 14.27 a | 3.17 ± 2.68 ab | 7.05 ± 5.89 a | 3.10 ± 3.36 b |
| 80%N | 16.94 ± 6.36 b | 14.11 ± 7.34 ab | 8.37 ± 2.28 b | 0.48 ± 1.98 b | 4.20 ± 3.73 ab | 3.63 ± 2.77 b |
| 80%N + Fe | 30.83 ± 7.83 a | 21.62 ± 13.69 a | 8.03 ± 4.78 b | 12.01 ± 11.64 a | 2.86 ± 3.59 ab | 1.22 ± 1.86 b |
| 100%N | 31.93 ± 14.32 a | 17.28 ± 4.11 ab | 22.11 ± 8.11 a | 7.90 ± 10.78 ab | 0.29 ± 0.63 b | 7.92 ± 3.85 a |
| Treatment | NO3−-N (kg hm−2) | NH4+-N (kg hm−2) | ||||
|---|---|---|---|---|---|---|
| 30 cm | 60 cm | 90 cm | 30 cm | 60 cm | 90 cm | |
| 0%N | 14.71 ± 2.62 c | 10.80 ± 7.40 b | 8.37 ± 3.78 c | 0.30 ± 0.12 b | 0.26 ± 0.15 b | 0.13 ± 0.21 b |
| 0%N + Fe | 14.32 ± 7.25 c | 15.89 ± 11.50 b | 5.29 ± 2.56 c | 0.43 ± 0.08 b | 0.62 ± 0.66 ab | 0.13 ± 0.07 b |
| 60%N | 25.09 ± 10.53 bc | 20.18 ± 12.97 b | 12.39 ± 6.01 bc | 3.55 ± 1.83 a | 0.91 ± 0.65 ab | 0.11 ± 0.04 b |
| 60%N + Fe | 28.02 ± 15.45 abc | 27.85 ± 10.82 ab | 12.93 ± 9.48 bc | 0.97 ± 1.34 b | 1.56 ± 1.49 a | 0.34 ± 0.47 b |
| 80%N | 30.49 ± 2.01 abc | 27.81 ± 8.14 ab | 23.56 ± 11.05 ab | 1.67 ± 1.02 b | 1.08 ± 1.00 ab | 0.51 ± 0.59 ab |
| 80%N + Fe | 33.01 ± 10.01 ab | 21.09 ± 4.52 b | 27.25 ± 17.52 a | 1.99 ± 1.61 ab | 1.01 ± 0.66 ab | 0.55 ± 0.79 ab |
| 100%N | 44.77 ± 22.63 a | 48.26 ± 28.54 a | 19.33 ± 10.91 abc | 0.98 ± 0.71 b | 0.67 ± 0.89 ab | 1.33 ± 1.33 a |
Publisher’s Note: MDPI stays neutral with regard to jurisdictional claims in published maps and institutional affiliations. |
© 2022 by the authors. Licensee MDPI, Basel, Switzerland. This article is an open access article distributed under the terms and conditions of the Creative Commons Attribution (CC BY) license (https://creativecommons.org/licenses/by/4.0/).
Share and Cite
Shen, W.; Long, Y.; Qiu, Z.; Gao, N.; Masuda, Y.; Itoh, H.; Ohba, H.; Shiratori, Y.; Rajasekar, A.; Senoo, K. Investigation of Rice Yields and Critical N Losses from Paddy Soil under Different N Fertilization Rates with Iron Application. Int. J. Environ. Res. Public Health 2022, 19, 8707. https://doi.org/10.3390/ijerph19148707
Shen W, Long Y, Qiu Z, Gao N, Masuda Y, Itoh H, Ohba H, Shiratori Y, Rajasekar A, Senoo K. Investigation of Rice Yields and Critical N Losses from Paddy Soil under Different N Fertilization Rates with Iron Application. International Journal of Environmental Research and Public Health. 2022; 19(14):8707. https://doi.org/10.3390/ijerph19148707
Chicago/Turabian StyleShen, Weishou, Yaou Long, Zijian Qiu, Nan Gao, Yoko Masuda, Hideomi Itoh, Hirotomo Ohba, Yutaka Shiratori, Adharsh Rajasekar, and Keishi Senoo. 2022. "Investigation of Rice Yields and Critical N Losses from Paddy Soil under Different N Fertilization Rates with Iron Application" International Journal of Environmental Research and Public Health 19, no. 14: 8707. https://doi.org/10.3390/ijerph19148707
APA StyleShen, W., Long, Y., Qiu, Z., Gao, N., Masuda, Y., Itoh, H., Ohba, H., Shiratori, Y., Rajasekar, A., & Senoo, K. (2022). Investigation of Rice Yields and Critical N Losses from Paddy Soil under Different N Fertilization Rates with Iron Application. International Journal of Environmental Research and Public Health, 19(14), 8707. https://doi.org/10.3390/ijerph19148707