Abstract
The exclusive pedestrian phase (EPP) has proven to be an effective method of eliminating pedestrian–vehicle conflicts at signalized intersections. The existing EPP setting conditions take traffic efficiency and safety as optimization goals, which may contribute to unfair interactions between vehicles and pedestrians. This study develops a multiobjective optimization framework to determine the EPP setting criteria, with consideration for the tradeoff between transportation equity and cost. In transportation equity modeling and considering environmental conditions, the transportation equity index is proposed to quantify pedestrian–vehicle equity differences. In cost modeling, traffic safety and efficiency factors are converted into monetary values, and the pedestrian–vehicle interaction is introduced. To validate the proposed optimization framework, a video-based data collection is conducted on wet and dry environment conditions at the selected intersection. The parameters in the proposed model are calibrated based on the results of the video analysis. This study compares the performance of the multiobjective evolutionary algorithm based on decomposition (MOEA) and the nondominated sorting genetic algorithm II (NSGA-II) methods in building the sets of nondominated solutions. The optimization results show that the decrease in transportation equity will lead to an increase in cost. The obtained Pareto front approximations correspond to diverse signal timing patterns and achieve a balance between optimizing either objective to different extents. The sensitivity analysis reveals the application domains for the EPP and the traditional two-way control phase (TWC) under different vehicular/pedestrian demand, yielding rate, and environment conditions. The EPP control is more suitable at intersections with high pedestrian volumes and low yielding rates, especially in wet conditions. The results provide operational guidelines for decision-makers for properly selecting the pedestrian phase pattern at signalized intersections.
1. Introduction
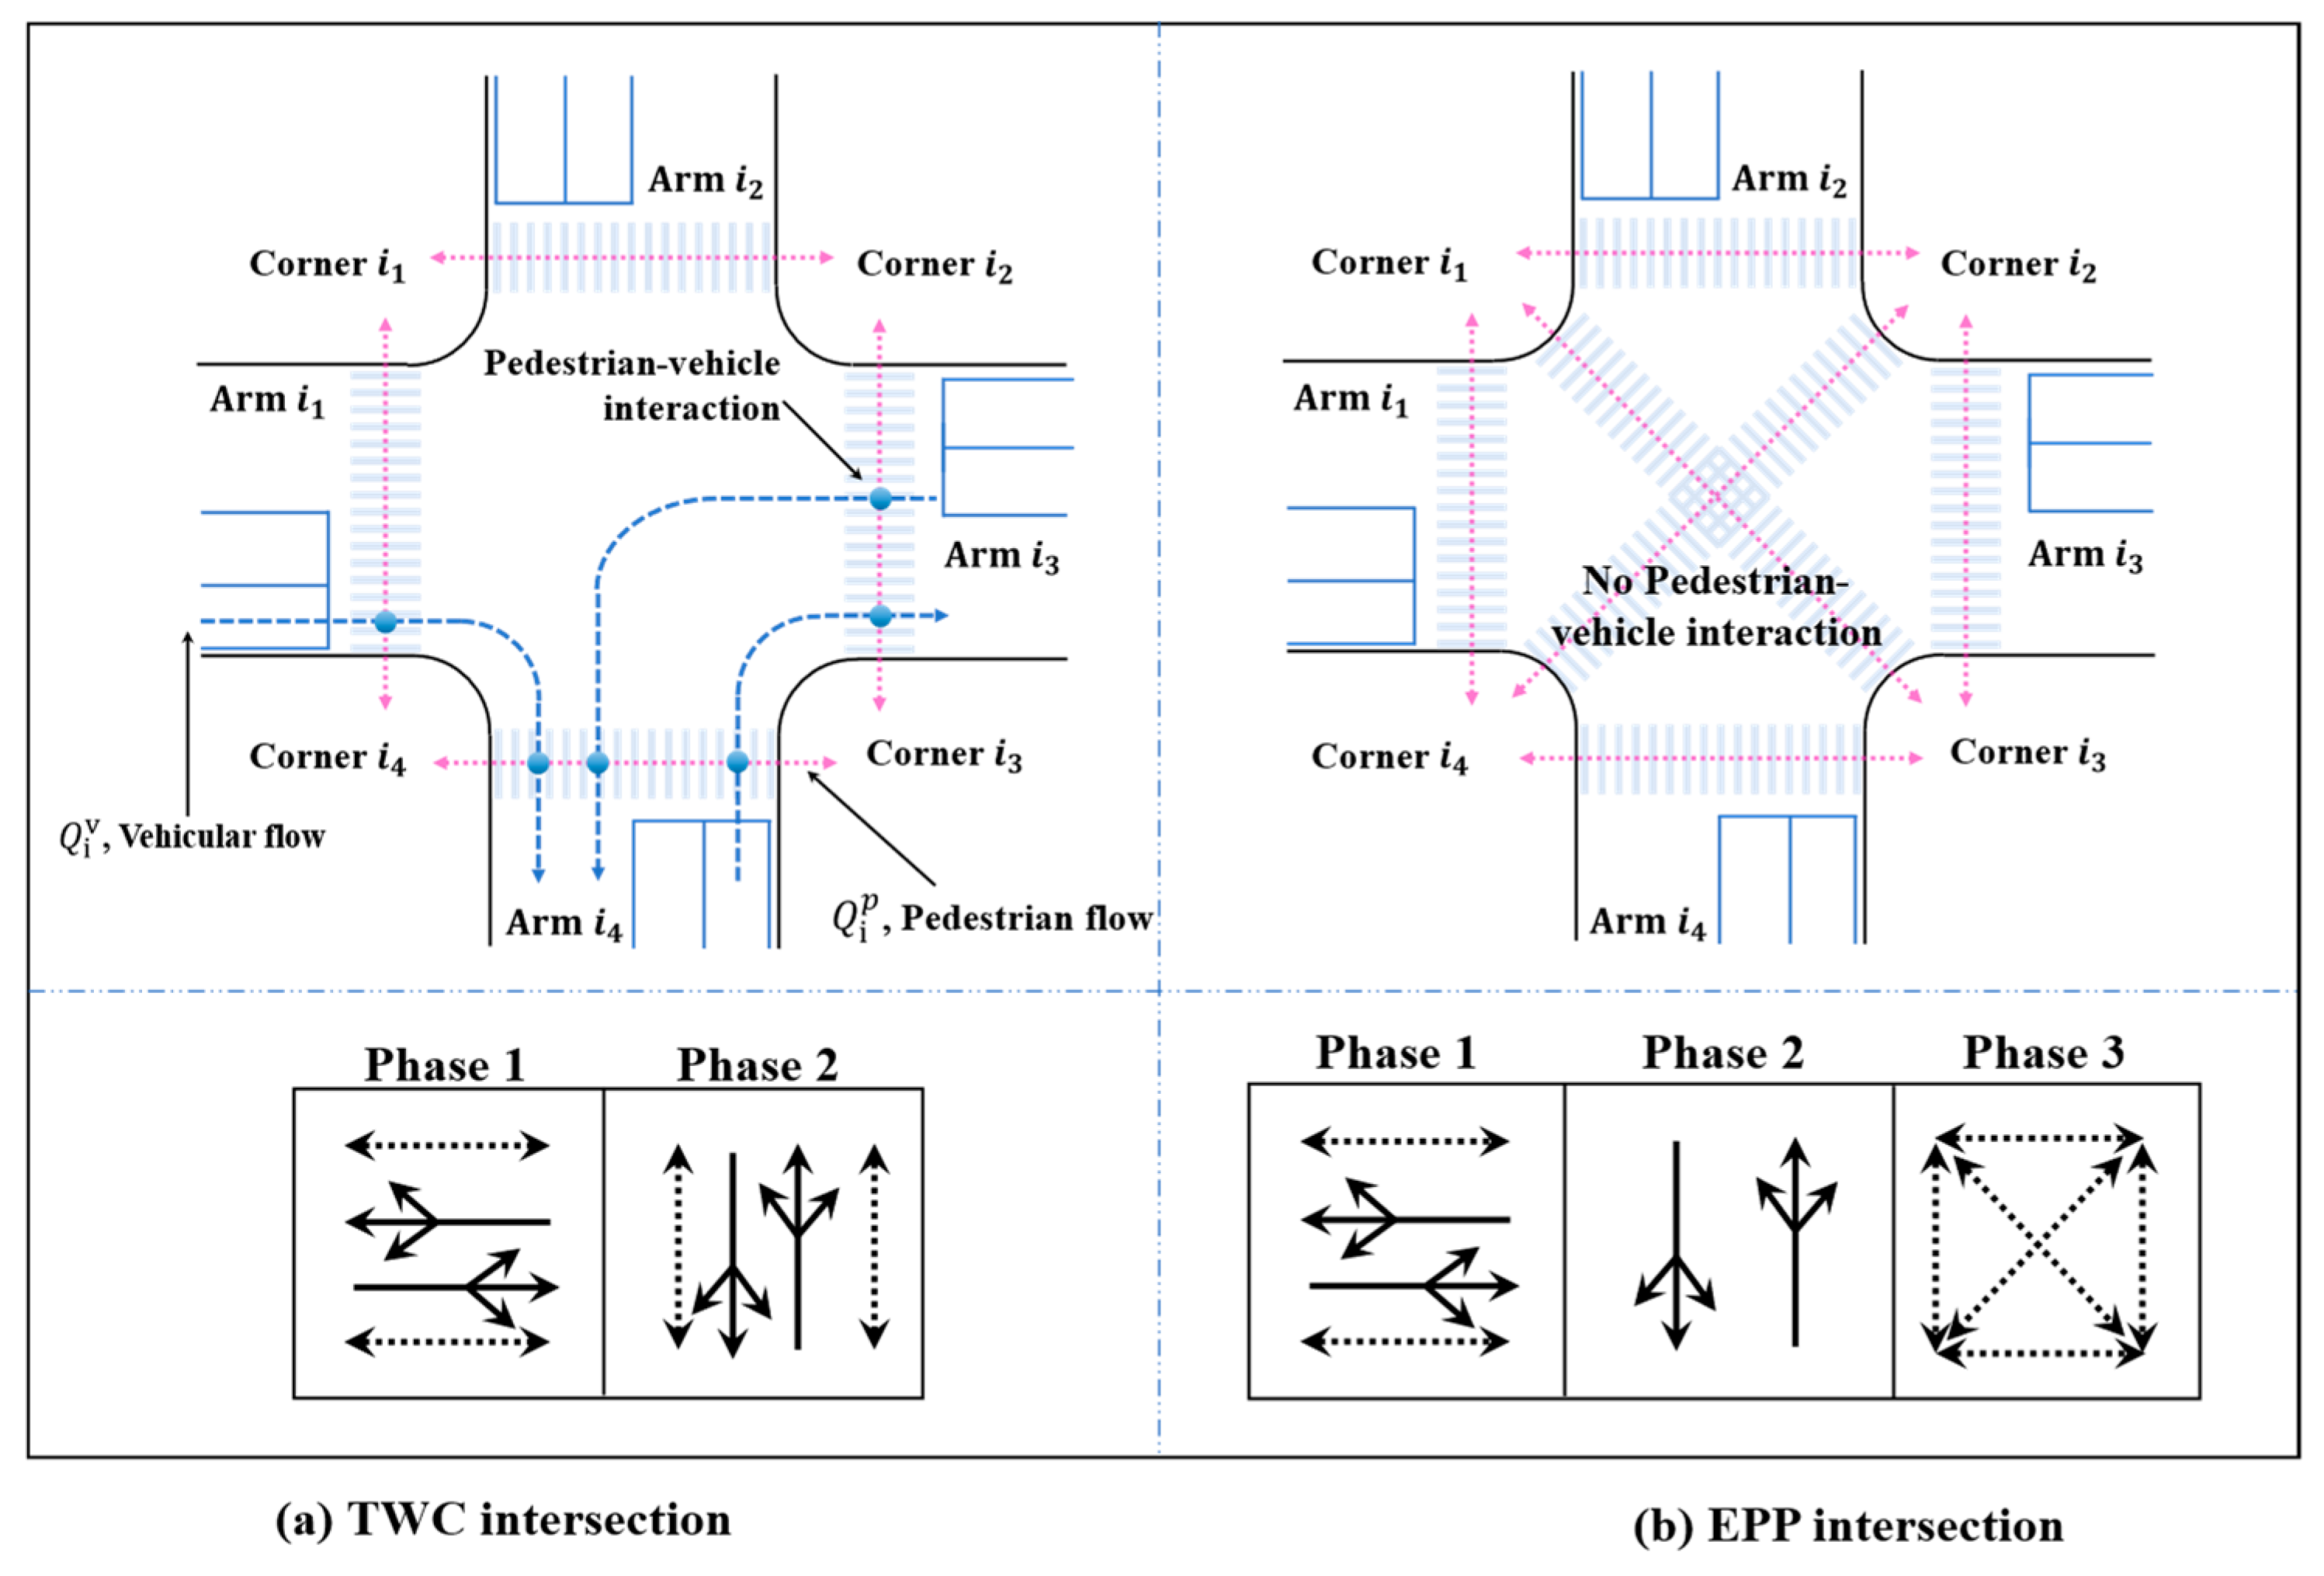
Pedestrian traffic comprises a large proportion of the total mixed traffic flow at urban intersections [1]. Providing relatively fair time–space resources for pedestrians is critical to improving the overall intersection performance. However, the increasing trend of vehicle-miles traveling has led to a vehicle-based signal phase design, which can hardly meet the rising demand of pedestrians. At traditional two-phase signalized intersections, pedestrian–vehicle interaction can lead to increased delay and even accidents, resulting in casualties and economic losses [2]. A crucial issue at signalized intersections is to mitigate conflicting movements between vehicles and pedestrians. Researchers and engineers have been seeking solutions to make the best tradeoff between vehicles and pedestrians in terms of efficiency and safety. The exclusive pedestrian phase (EPP), as one of the common signal phasing approaches, has been applied to promote pedestrianism in downtown areas in many countries. The EPP stops upcoming vehicular traffic from all approaches to allow pedestrians to cross any leg of the intersection (diagonally as well as laterally) without pedestrian–vehicle interaction [3]. Most researchers have concluded that determining the reasonable boundary conditions of EPP can significantly enhance traffic safety at signalized intersections [4,5].
In the field of traffic signal optimization and phase setting, the mainstream studies on the setting conditions and quantitative criteria of EPP fall into three major categories: efficiency-based [6,7], safety-based [3,8], and cost-based studies [9,10]. Numerous studies tend to take either traffic efficiency or safety as the primary optimization objectives for simplification. To systematically integrate the two aspects, Ma et al. [9] developed a cost-based framework through value weight. However, the differences between pedestrians and vehicles are rarely considered under various environmental conditions, resulting in an unfair allocation of time–space resources. First, traffic behavioral models should be further integrated into the optimization of pedestrian phase patterns. Pedestrian–vehicle interaction mechanisms will affect traffic signal models, including the delay model [11], capacity model [12], and signal timing [13,14], thus influencing the implementation of EPP. Second, under various environment conditions, the traffic characteristics and behavior will change significantly, which can affect the saturation flow rate, loss of time, as well as pedestrian–vehicle interaction [3,15]. As a result, the obtained cycle length and green times will vary according to environment conditions. Therefore, from the aspect of transportation equity, it is necessary to minimize the differences under various environment conditions, such that pedestrians and vehicles can cross the intersection with comparatively fair time–space resources of the road.
To solve the above issue, this study established quantitative criteria to determine pedestrian phase patterns between the EPP and the traditional two-way control phase (TWC). A bi-objective optimization model is developed based on transportation equity and cost analysis. In transportation equity modeling, the primary objective is to minimize the difference of saturation between pedestrians and vehicles while considering the environment influences to ensure fair crossing capacity. In cost modeling, traffic safety and efficiency are transformed into monetary values to select the pedestrian phase pattern in the economic framework. The secondary objective is to minimize the total cost of safety and delay with consideration for the pedestrian–vehicle interactions at the intersection. To validate the proposed optimization framework, a video-based data collection was conducted on wet and dry environment conditions at the selected intersection. A nonlinear programming model was formulated and solved by two evolutionary algorithms. This study mainly makes three contributions:
- A transportation equity index (TEI) is proposed to quantify the individual differences under different environment conditions. Additionally, vehicle throughput is converted into passenger throughput to reflect transportation equity between different traffic participants.
- Based on the TEI, a bi-objective optimization model is established to find the best tradeoff between transportation equity and cost. The proposed cost model considers the pedestrian–vehicle interaction, which is more consistent with the actual situation.
- Considering the yielding rate and environment conditions, sensitivity analysis is conducted to determine the application domain of EPP. The results provide operational guidelines for decision-makers to better select the pedestrian phase pattern at signalized intersections.
The rest of this paper is organized as follows: the second section gives an introduction to the EPP setting methods, along with research on transportation equity and pedestrian–vehicle interaction; in the third section, the optimization model is proposed; the fourth section provides the data resource and the model solution; the fifth section is numerical and sensitivity analyses; conclusions are made in the last section.
2. Literature Review
2.1. Pedestrian–Vehicle Interaction Research
The EPP and TWC are two common pedestrian phase patterns at urban signalized intersections. Many studies have analyzed the setting conditions and quantitative criteria of EPP in terms of efficiency and safety [9,10]. Ivan et al. [5] found that the EPP was more safety-beneficial than the TWC in small towns, but was not as effective in large towns with low pedestrian compliance rates. Wang et al. [7] studied the setting criteria for the EPP at two-phase signalized intersections and proposed a new delay estimation model for traffic participants. The setting of the EPP had a better effect in the case of constant vehicle volume and a large pedestrian volume [6,7,16]. Many studies [3,7,17] have focused on the EPP application condition, but most studies have not taken the pedestrian–vehicle behavior into account to ensure fair interactions, especially in different environment conditions.
Various mechanisms of pedestrian–vehicle interaction conditions will influence the performance of the EPP. Studies have been conducted mainly on pedestrian factors [11,18,19,20], vehicle factors [15,21,22], and traffic environment factors [23,24,25]. The first two factors have been widely studied and integrated into traffic models. Most traffic models (such as delay estimation) were based on clear weather and dry pavement, while failing to consider poor weather conditions in metropolitan areas [24,25]. Other research shows that environmental conditions (infrastructure and facilities, weather, temperature, etc.) have effects on traffic flow and driver behaviors [3,15]. The pedestrian–vehicle interaction under different environment conditions will influence traffic characteristics and various models of signalized intersections, including the capacity model [12], delay model [11], and signal control model [13,14], thus affecting the setting condition of pedestrian phase.
Delay is usually used as a vital performance measure to quantitatively assess pedestrian–vehicle interactions [11]. It is difficult to obtain the real-life crossing delay, thus, theoretical delay estimation methods were applied for signal design and performance evaluation [26]. The early delay model was established by Adams [27], followed by many extensions by Webster [28], Akcelik [29], and the Highway Capacity Manual [30]. The Highway Capacity Manual, as the most commonly used model, improved the previous model with the assumption of a certain vehicle yielding rate to estimate average control delay [30]. However, these models may not fully reflect the real-life crossing behavior at urban intersections [11]. Other observational studies have found essential factors that should be taken into the delay model, such as traffic flow patterns [31], vehicle yielding rates [32], and pedestrian yield behavior [33]. These factors capture the influence of signal control, phase design, and traffic conditions, which is more consistent with the real-life situation. To better estimate the delay, pedestrian–vehicle interaction should be further quantified, particularly in city CBD areas with a large pedestrian flow. Li et al. [34] proposed a delay model in developing cities, which considers the pedestrian noncompliance and green phase conflict delay. Marisamynathan et al. [35] established pedestrian delay models, which consider the mixed traffic flow, pedestrian arrival rate, and noncompliance rate.
2.2. Transportation Equity Research
Transportation equity, in concept, refers to the equal access of multimode participants to economic opportunity by providing equitable levels of accessibility from both horizontal and vertical perspectives [36]. These definitions have provided a foundation upon which to develop approaches for quantifying potential and existing equity impacts of transportation planning, investments, and systems [37]. On the basis of these definitions, studies have been conducted to evaluate the transportation systems on traffic management, cost analysis, accessibility, environmental impact, safety, etc. [38,39,40,41]. Some efforts considering equity have focused on the experiences of transportation planners and their planning practices [42], and others have integrated transportation equity into regular approaches. Vossen et al. [43] focused on an equity compensation mechanism in traffic flow management for various participants. Ferguson et al. [44] integrated equity considerations into the transit frequency-setting problem. Feng et al. [45] proposed an integrated multiobjective model to evaluate the tradeoff between mobility and equity maximization considering environmental capacity. Chen et al. [46] developed a new methodology for rural transportation management considering the equity and cost factors under multiple objectives.
Pedestrians and vehicles, as two main traffic participants in urban intersections, are often involved in the competition for time–space resources. Transportation improvements inevitably lead to an uneven distribution of participant benefits [40]. In other words, assigning excessive green time to vehicles may lead to an increase in pedestrian delay. It indicates the importance of improving pedestrian–vehicle equity at intersections. Pedestrians and vehicles need comparatively fair time–space resources when crossing the intersection. However, limited studies have been conducted to develop quantitative standards to determine the proper pedestrian phase for ensuring transportation equity between pedestrians and vehicles [7].
There are multiple transportation equity approaches developed in academic research, although a gap exists between knowing these approaches and integrating them into real-life practice [37,40]. In contrast to the rich approaches and definitions of traffic equity, engineers have known little about how these methods can be utilized with the constraints of the existing transportation conditions. In practice, the pedestrian phase patterns are often determined by the experience of traffic engineers. One bottleneck appears to be the selection of proper solutions to ensure pedestrian crossing capacity and maintain an acceptable service level for vehicles. Specifically, in urban core business districts with large pedestrian volumes, the study of the EPP setting conditions through modeling traffic equity is urgent. Therefore, based on transportation equity and cost analysis, this study proposed a TEI and established a bi-objective optimization framework to determine pedestrian phase patterns. Cycle length and green times were optimized in two environment conditions under the TWC and the EPP.
3. Model Formulations
The EPP gives pedestrians exclusive access to cross the intersection by eliminating the conflicts between pedestrians and vehicles, which can ensure pedestrian safety during the crossing process. However, on the efficiency side, the EPP may contribute to higher pedestrian and vehicular delay compared with the TWC (see Figure 1). Therefore, the selection of EPP and TWC is essential to the overall intersection performance as well as individual mobility experience. In this study, a bi-objective optimization model was developed based on transportation equity and monetary cost to obtain the optimal signal timing under wet and dry environment conditions. Based on this, the setting condition of the EPP was determined.
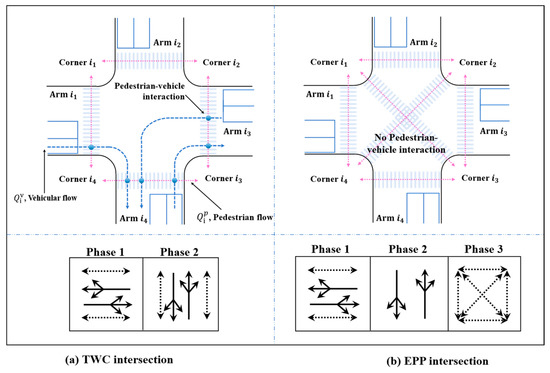
Figure 1.
Intersection layout of under TWC and EPP phase patterns.
3.1. Objective Functions
Pedestrians and vehicles need comparatively fair time–space resources when crossing the intersection. In the construction of the transportation equity model, this study proposed the TEI to quantify the individual differences under various environment conditions by converting vehicles into passengers per vehicle. More specifically, TEI measures the difference in flow rate between pedestrians and vehicles while considering the physical environment in the crossing process. In the overall optimization framework, the primary objective is to minimize the TEI to ensure that pedestrians and vehicles can cross the intersection with comparatively fair time–space resources of road per capita. The secondary objective is to minimize the total monetary cost of traffic efficiency and safety. Both traffic safety and efficiency factors are converted into monetary values to select the pedestrian phase pattern in the economic framework [9]. The primary and secondary objective functions were formulated as follows:
where is the environmental variable of vehicles and pedestrians, obtained from the field data; is the vehicle flow on arm i in the current cycle, (pcu/h) (see Figure 1); is the pedestrian flow on arm i in the current cycle, (ped/h); is vehicle throughput in this cycle; is pedestrian throughput in this cycle; is the total monetary delay cost caused by vehicular delay and pedestrian delay; and is the total monetary safety cost, due to normal exposures and pedestrian noncompliance ratio. The key notations used in this paper are summarized in Table A1, Appendix B.
3.2. Signal Constrains
The minimal and maximal values of the cycle length ( and ), were determined according to the Traffic Signal Timing Manual. The cycle length was constrained by:
The green split should satisfy the minimal green time requirement for pedestrians and vehicles in each phase. The green split is constrained by:
The sum of green times and intergreens () in all phases were required to meet the cycle length and were constrained by:
3.3. Transportation Equity Modeling
The primary objective was to ensure fair crossing capacity between vehicles and pedestrians in pedestrian phase patterns. In this study, TEI was assessed by the difference in the flow ratio between vehicles and pedestrians, in which the flow ratio was modified by the environment coefficient. Based on the previous study on the crosswalk traffic capacity [47,48], vehicle and pedestrian throughput per cycle under the TWC and EPP conditions were further adjusted in this study. To obtain a more comprehensive capacity of signalized intersection, this study carried out capacity modification under the TWC and EPP conditions.
3.3.1. Pedestrian Throughput
Under the TWC control, the right of way was simultaneously allocated to vehicles and pedestrians at the same phase. The interaction between pedestrians and right-turn vehicles could contribute to the degraded throughput and potential traffic conflicts. Under the TWC condition, pedestrian throughput could be affected by right-turn vehicles brought by the exclusive right-turn lane. Based on the traditional crosswalk capacity model [48], this study considered the influence of right-turn vehicles on the pedestrian crossing process. To be consistent with the actual situation, the proposed pedestrian throughput model introduced the reduction coefficient of the exclusive right-turn lane on pedestrians . Henceforth, pedestrian crossing throughput was calculated as follows:
where is the green time of pedestrian signal; is the pedestrian crosswalk length; is the distance between pedestrians; is the speed of crossing pedestrians; is the lost time due to pedestrian safety concerns at the end of the red light; is the reduction coefficient of the exclusive right-turn lane on pedestrians under TWC, ; is the cycle length; is the time when the right-turning vehicle occupies the sidewalk, ; is the converted vehicle length; is the minimum safe distance between pedestrians and right-turn vehicles; and is the speed of right-turn vehicles.
Under the EPP control, pedestrian crossing throughput () was divided into two parts by period: the EPP period and the non-EPP period . During the EPP period , was the corresponding pedestrian crossing throughput from all directions (including diagonal lines) in each cycle. During the non-EPP period , pedestrians could still cross the street as in the TWC. Henceforth, was the pedestrian crossing throughput in each cycle during the non-EPP period . The total pedestrian crossing throughput under the EPP was formulated as follows. The detailed calculations of and are listed in Appendix A.
3.3.2. Vehicle Throughput
Based on the Design Regulation of Urban Road Engineering (CJJ37—90) in China [49], this study established the vehicle throughput model using the basic idea of the stop line method under both the TWC and EPP conditions. The stop line method is one of the commonly used methods to calculate the traffic capacity of signalized intersections in China.
Under the TWC control, the total vehicle throughput consisted of three parts: throughput from left turn, straight, and right-turn lanes. The total vehicle crossing throughput was calculated as follows:
where are the signal period of left turn and go straight in a cycle, respectively; are the average vehicle headway of left turn, straight, and right turn, respectively; are the adjustment coefficients of the turning vehicle headway under TWC and EPP; are the reduction coefficients of the vehicle volume decrease caused by the conflict between pedestrians and right-turn vehicles under the TWC and EPP; is the speed of vehicles; and is the acceleration of vehicles.
Under the EPP control, vehicles were not allowed to cross during the EPP period in a cycle. The vehicle throughput in the rest of the cycle was as follows:
3.4. Cost Modeling
Traffic factors can be converted into monetary values as economic criteria to select the pedestrian phase pattern. Traffic efficiency factors were measured with a new delay model considering vehicle yielding rate under the TWC and the EPP. Traffic safety factors were assessed by modeling the pedestrian–vehicle exposures and pedestrian violations. To calculate the monetary cost of pedestrian and vehicle delay, we estimated the average pedestrian/vehicle delay per hour using the UAV-based traffic datasets and applied the unit average cost of pedestrian/vehicle delay ( to estimate the equivalent monetary value of wasted pedestrian/vehicle time.
The total delay cost of traffic participants consisted of two parts, the vehicle delay cost and the pedestrian delay cost. Pedestrian–vehicle interaction existed under the TWC condition, therefore, the vehicle/pedestrian delay ) during pedestrian–vehicle interaction were considered in the monetary evaluation. The total delay cost under TWC was calculated with the following equation:
where is the unit average delay cost of one pedestrian per hour ($/h); the unit average delay cost of one vehicle per hour ($/h); is the average number of passengers carried by vehicles, (ped/pcu); is the total vehicular demand at corner i, (pcu/h); and is the total pedestrian crossing demand at corner i, (ped/h).
Under the EPP condition, there was no pedestrian–vehicle interaction at the intersection. Only control delay caused by traffic signals was included in the pedestrian delay. Meanwhile, vehicle delay included the control delay and delay caused by EPP. is the green time of the EPP (s). The total delay cost under the EPP () was calculated as follows:
The total safety cost consists of safety costs due to accidents and pedestrian compliance ratio . It can be calculated with the following equation:
3.4.1. Pedestrian–Vehicle Interaction
This study adopted the delay estimation model of Highway Capacity Manual (2010) to estimate the vehicle control delay at signalized intersections [50]. Pedestrian delay under the TWC control consisted of signal delay, conflict delay, and detour delay. The detailed algorithm for the delay model is listed in Appendix A.
Vehicle delay during the pedestrian–vehicle interaction can be caused by the deceleration and the interaction process, which was calculated as:
where is the pedestrian–vehicle interaction time of vehicle, obtained from field study; is the initial vehicle velocity when interaction occurs, (m/s); is the distance between vehicle and pedestrian when pedestrian–vehicle interaction occurs, (m); is the acceleration when the vehicle decelerates, ; and is the vehicle yielding rate.
Pedestrian delay during the pedestrian–vehicle interaction can be caused by the interaction time and condition, which was calculated as:
where is the crosswalk length; is the pedestrian–vehicle interaction time of pedestrian; is the pedestrian yielding rate; and is the number of pedestrian–vehicle interactions before setting the EPP control.
3.4.2. Safety Cost
Considering the pedestrian crossing danger, traffic exposures and the pedestrian noncompliance ratio are two primary factors that affect intersection safety [3]. Therefore, the total safety cost consists of the safety cost due to accidents and the pedestrian compliance ratio . In the potential accidents analysis based on exposures, this study adopted the exposure calculation method from Nilsson [51], which has been applied in many related studies [9,52]. Based on this method, this study divided the calculation into two conditions. Under the EPP condition, the intersection exposure was zero because no vehicle interaction existed during the pedestrian crossing process. Under the TWC condition, the intersection exposure depended on the volume of pedestrians and turning vehicles that may become involved in a conflict with the pedestrians. In safety cost caused by traffic accidents, the accident probability distribution was used to assess the traffic safety under various pedestrian phase patterns [53]. The monetary value of safety costs due to accidents can be calculated as follows:
where is the number of potential traffic accidents under the TWC pattern and is the average cost of an accident ($/accident).
Most pedestrian violations are caused by noncompliance behavior of pedestrians, such as crossing through a red light. To reflect the real-life condition, this study introduced the transformation coefficient () from the noncompliance ratio to accidents based on a safety evaluation method from Yuan [54]. The monetary value of safety cost due to pedestrian violations can be calculated with the following equation:
where is the average accident number to pedestrian noncompliance ratio; is the estimated probability of pedestrian noncompliance; is the total pedestrian crossing demand at corner i; and is the proportion of pedestrian volume from corner i to another in total pedestrian demand of corner i.
4. Preliminaries: Data and Methods
4.1. Solution Algorithms
The proposed optimization model was formulated as a mixed-integer nonlinear programming (MINLP) model with a bi-objective structure. The model has nonlinear, nonconvexity, and nondifferential characteristics, which make it difficult to find the global optimal solution through traditional nonlinear programming methods. The nondominated sorting genetic algorithm II (NSGA-II) is a commonly used algorithm in solving MINLP problems [13,55,56]. This study applied the NSGA-II for yielding optimal cycle length and green time. The performance of the NSGA-II was compared with that of the multiobjective evolutionary algorithm based on decomposition (MOEA). The MOEA explicitly decomposed the multiobjective problems into scalar optimization subproblems and has been demonstrated to be effective for solving two- and three-objective problems [57]. The abbreviations in this study are listed in Abbreviations section.
4.2. Data Resource
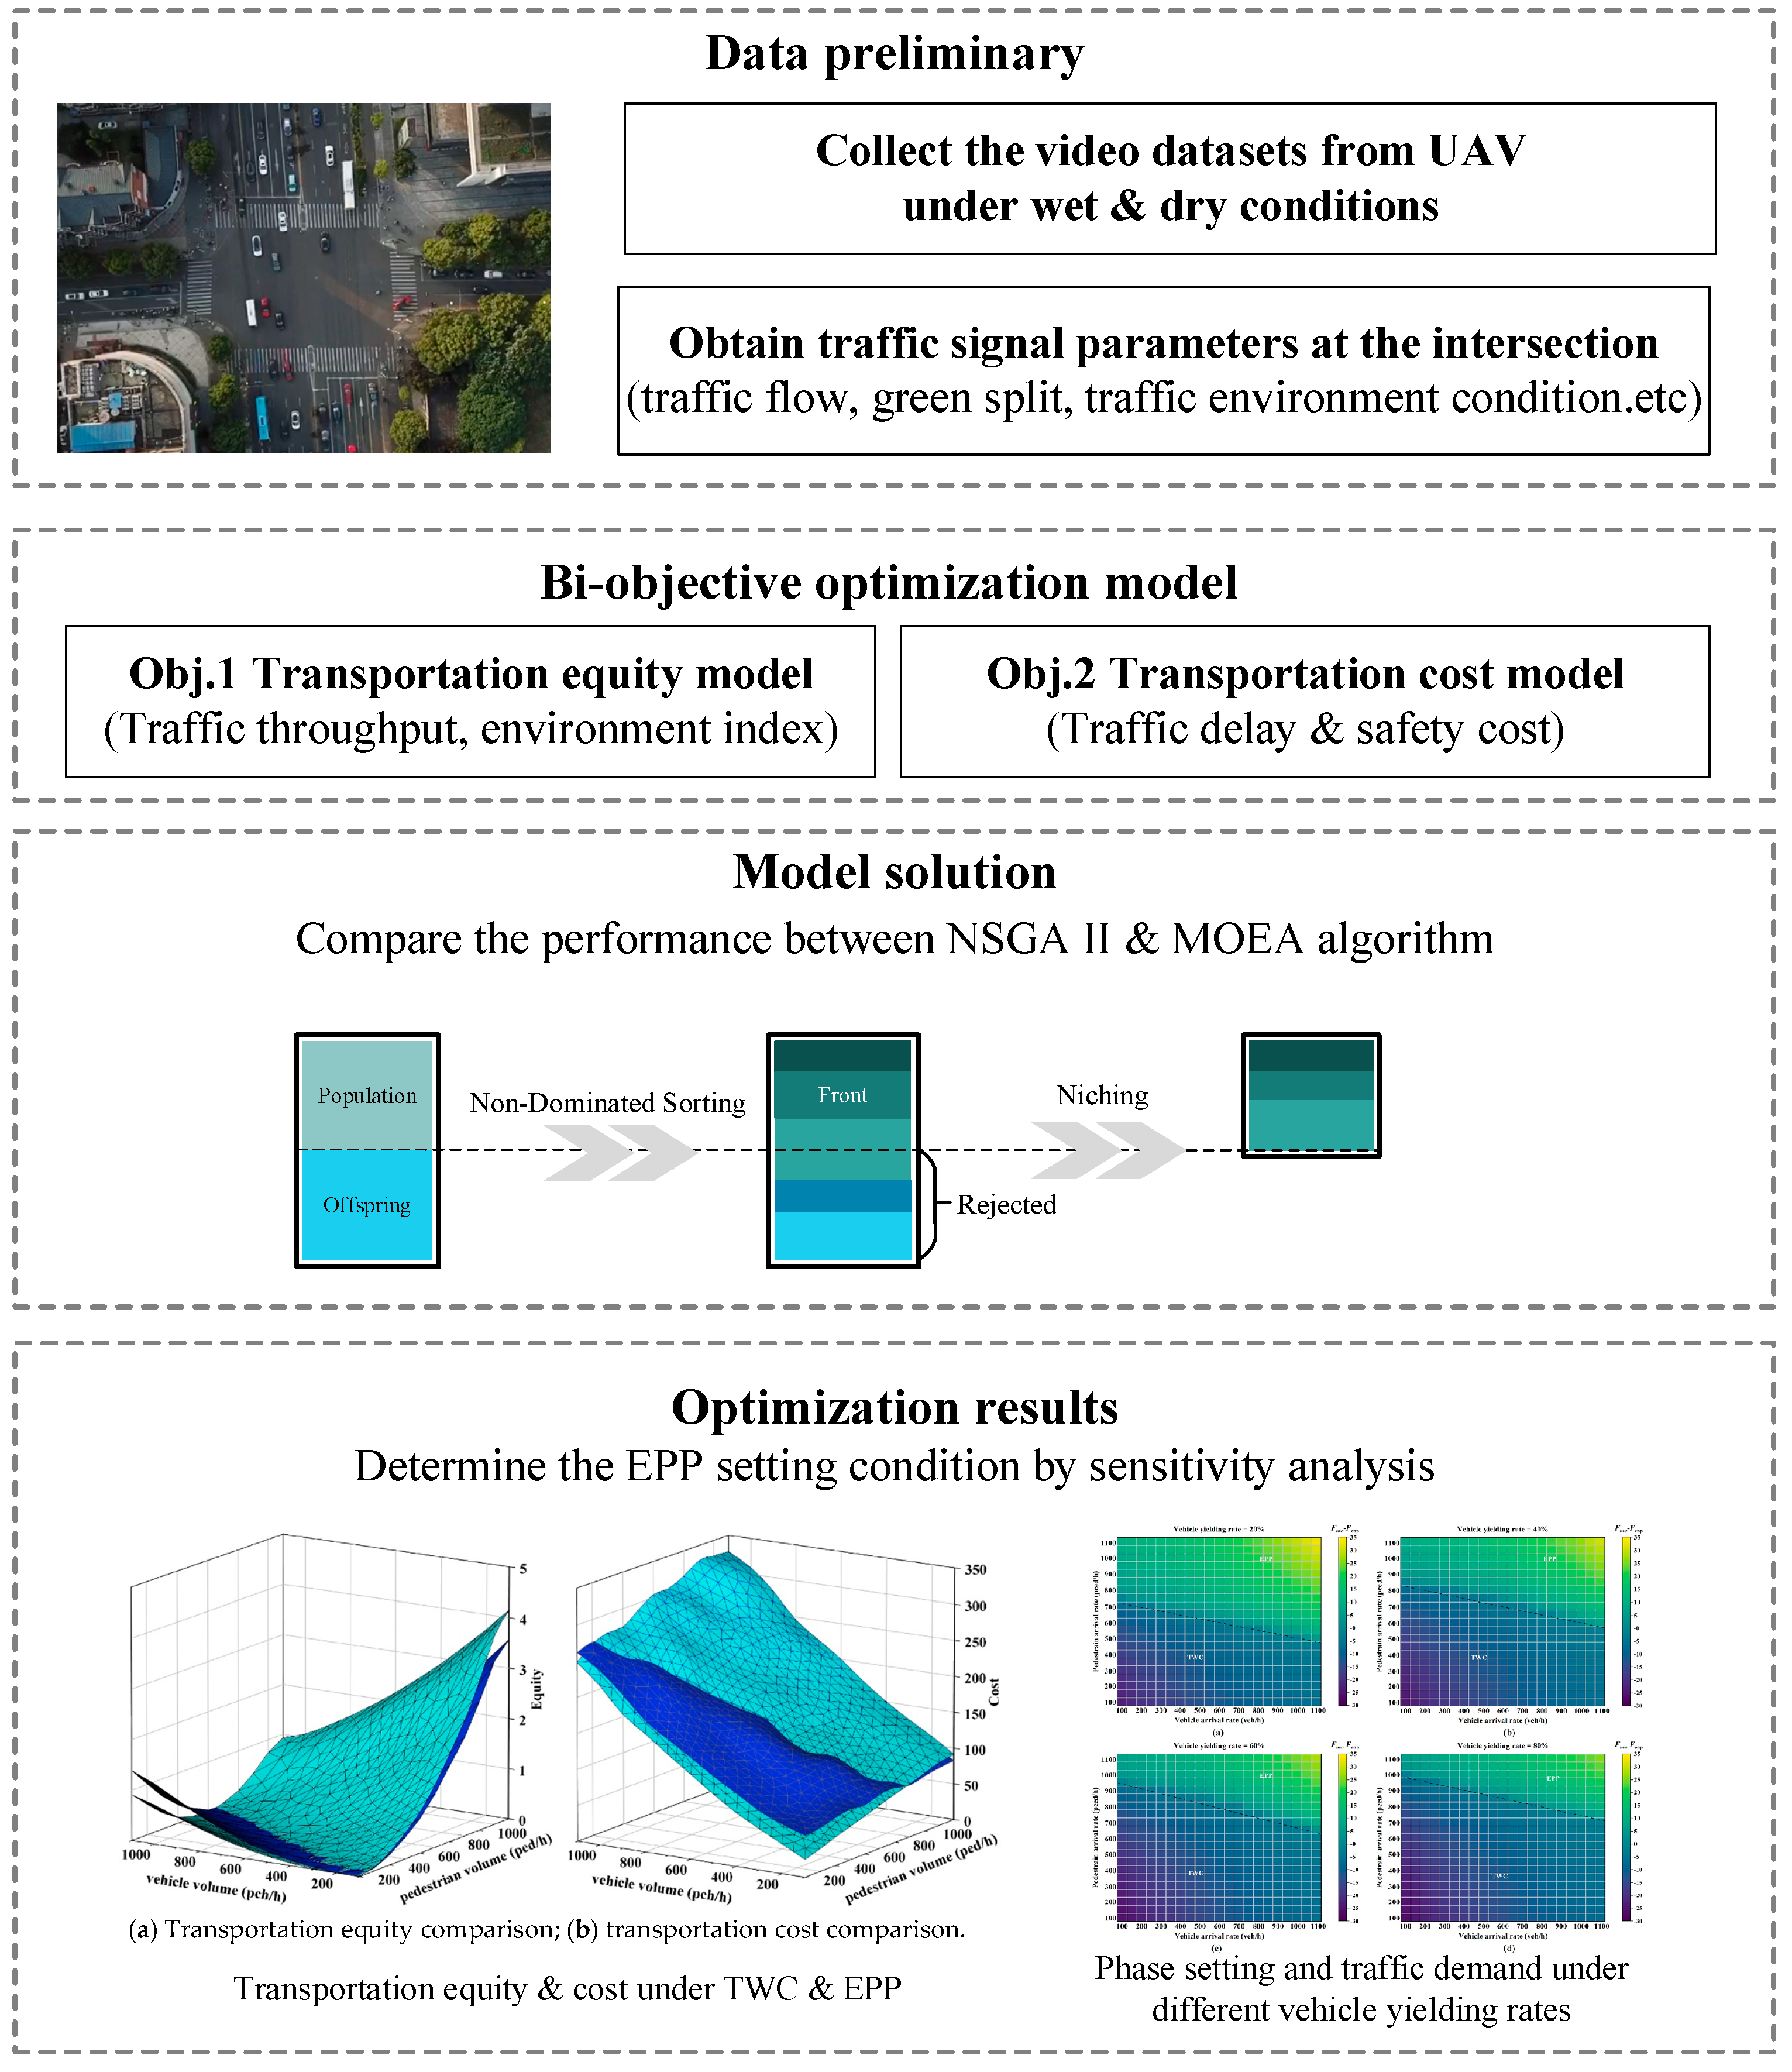
An observational study was conducted to investigate the EPP setting condition at a signalized intersection (Huangxin Rd. and Guoquan Rd.) located in Shanghai, China. The dataset contained in this research came from videos acquired from an unmanned aerial vehicle (UAV). Considering the difference in environment perception between pedestrians and drivers, UAV-based datasets were collected under two conditions. The first condition was set at the morning peak hours of a dry and sunny day, while the second condition is set at the morning peak hours of a wet and rainy day. Traffic parameters were calibrated from the traffic datasets extracted from the UAV-based videos (see Table 1). The proposed model was also implemented with this field data to demonstrate its applicability. The overall framework of this study is illustrated in Figure 2.

Table 1.
Parameters in model validation.

Figure 2.
The proposed optimization framework.
5. Numerical Examples and Sensitivity Analysis
In this section, experiments were carried out to answer the following research questions: 1. What are the characteristics of the nondominated sets constructed by the proposed signal optimization methods? 2. Why is transportation equity important for signal timing optimization? 3. What is the impact of transportation equity and pedestrian–vehicle interaction on the EPP setting?
5.1. Metaparameter Analysis
To compare the modeling performance under both the EPP and the TWC conditions, the initial traffic parameters are summarized in Table 1. Empirical parameters were obtained from previous studies [53,58]. The average cost of each accident () was according to China Statistical Yearbook 2019. The unit average cost of pedestrian delay () and the unit average cost of vehicle delay () were referred to the previous cost-related studies in China [54,59].
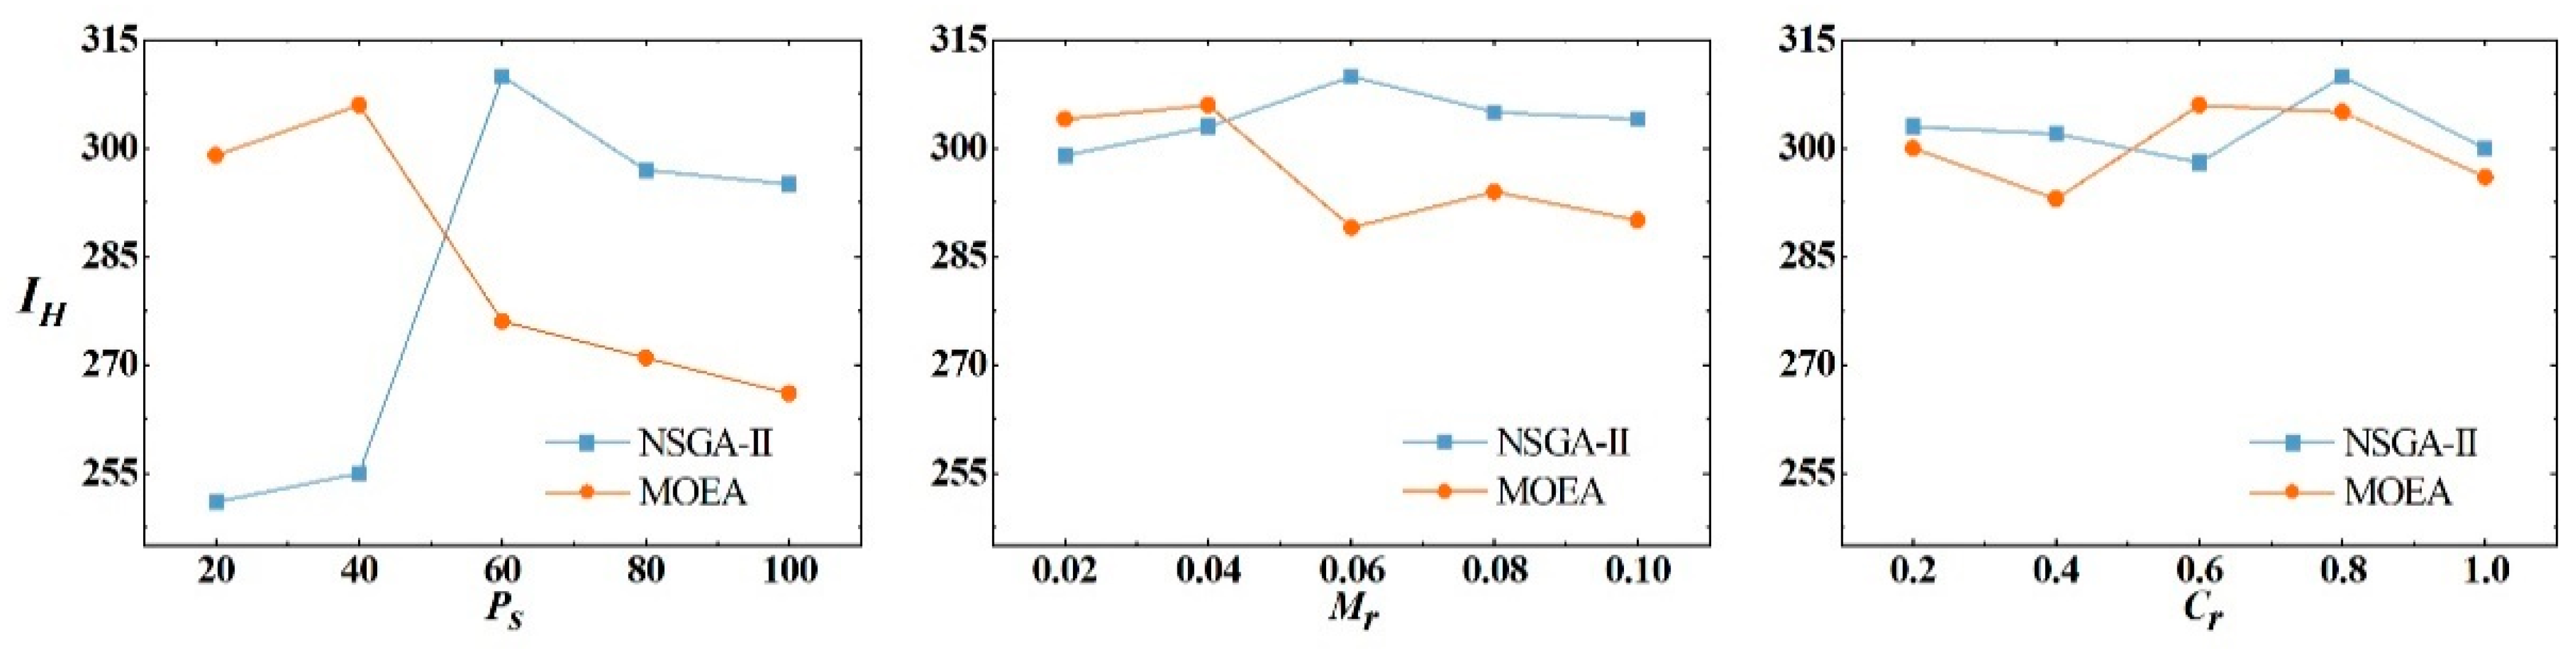
As mentioned in the solution algorithms, the performance of NSGA-II is compared with that of MOEA. To make the tuning process computationally, a grid search for optimal parameter values was performed based on a multiobjective optimization framework [60]. The hypervolume indicator (IH) was calculated to evaluate the optimization performance of NSGA-II and MOEA. The larger the IH, the better the algorithm performance will be. The best out of optimization runs with 3000 objective evaluations were selected for each configuration. For NSGA-II, the overall best configuration was Ps/Mr/Cr = 50/0.05/0.3, while the configuration Ps/Mr/Cr = 50/0.05/0.3 was the top performer for MOEA.
To evaluate the effects of individual metaparameters, a metaparameter analysis was conducted based on the best configuration. For a configuration with a specific value of the observed individual metaparameter, IH was computed by changing the value of the interest parameter. Figure 3 presents how changes in one parameter affect the optimization performance when fixing the other parameters at their best configurations. It can be concluded that Ps has a stronger influence on IH than Mr and Cr in the NSGA-II algorithm. NSGA-II does not rely on an external archive; thus, a large population indicates rich initial diversity. In this case, constructing a large enough pool of nondominated solutions was possible. In contrast, MOEA prefers smaller Mr because the neighborhood mechanism in MOEA accelerates the propagation of mutation across the population.
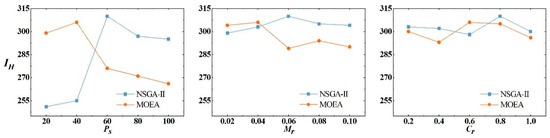
Figure 3.
The influence of changing the metaparameters on IH.
5.2. Optimization Results
The final experiments were run on a desktop computer with an Intel i7 CPU and 16 GB of RAM. The analysis was performed with the Pymoo package under the Python 3.8 environment developed by Python Software Foundation in Netherlands. In this section, the nondominated sets constructed by MOEA and NSGA-II are compared.
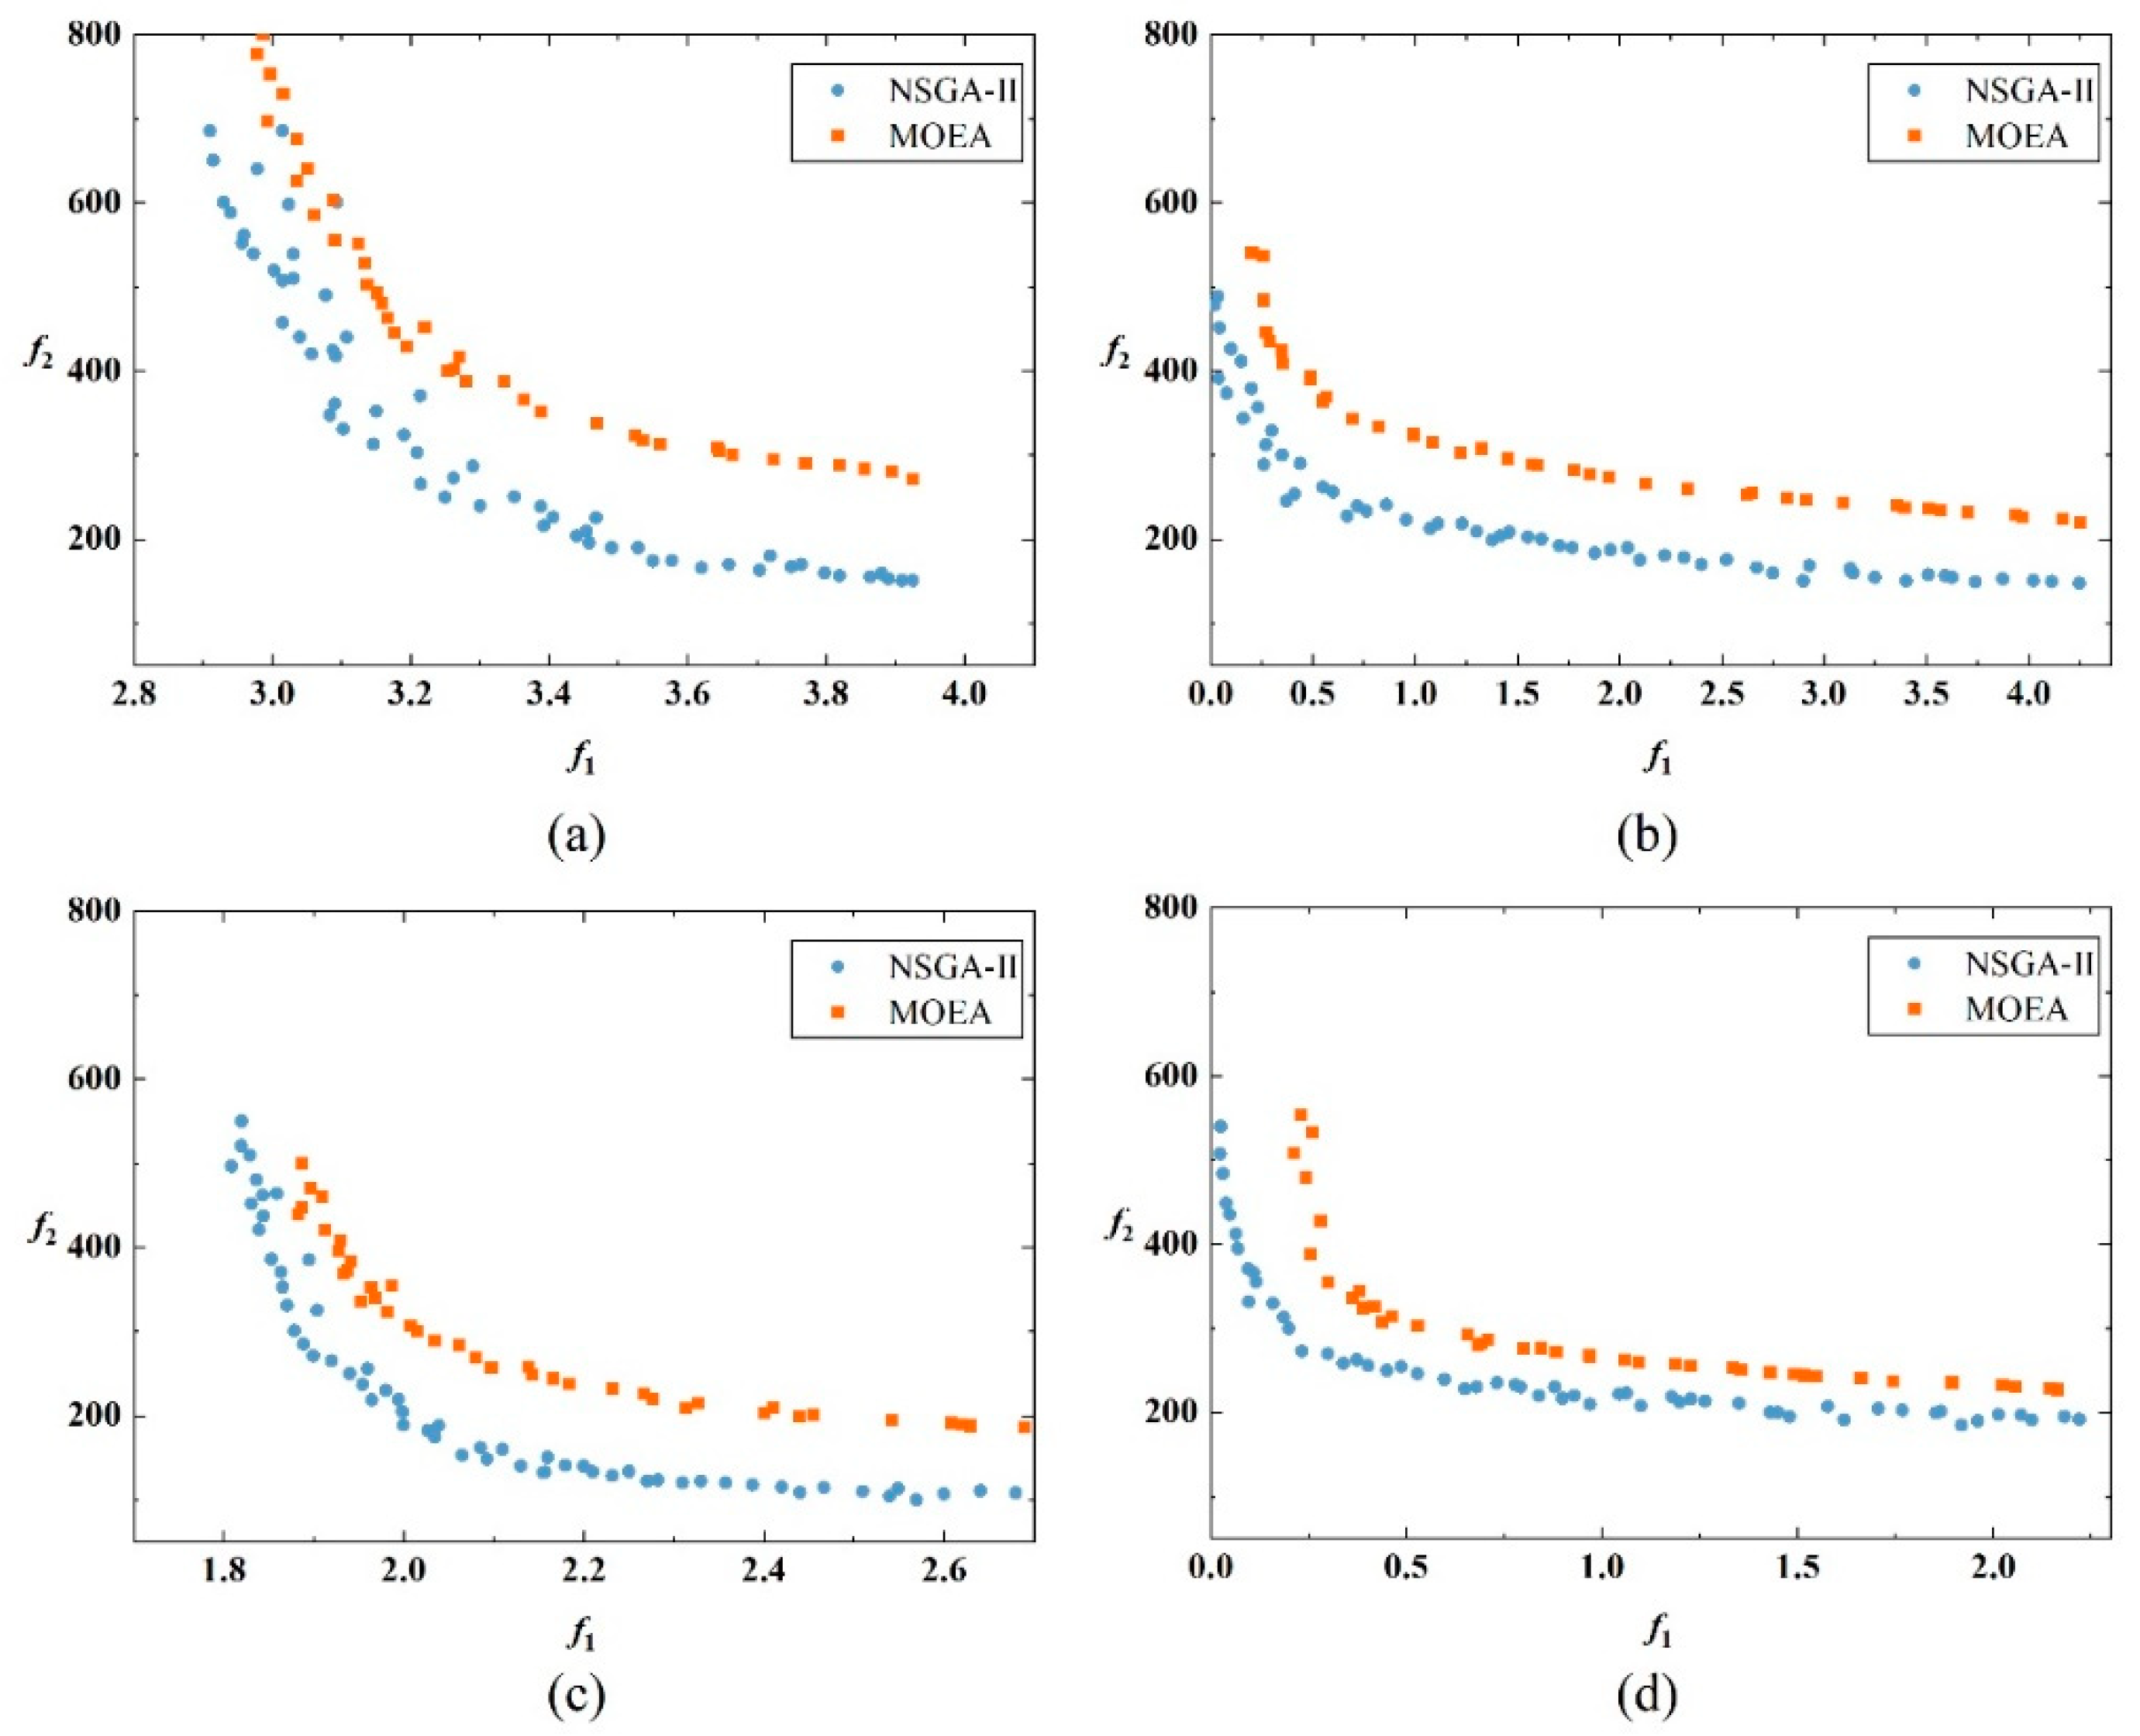
Figure 4 shows the nondominated fronts for the four conditions. In the experiments, NSGA-II outperformed MOEA both in IH and in the spread of the nondominated front. The reason for the poor performance of MOEA is the inherited replacement strategy that can result in limited population diversity and premature convergence. In contrast, NSGA-II had better global exploration capabilities than MOEA. According to the distribution of nondominated fronts of the two methods, the fronts are approximately convex, with two objectives changing in reverse. It indicates that signal optimization methods lacking cost consideration may lead to transportation inequity between pedestrians and vehicles. The nondominated fronts obtained by the proposed model cover a spectrum of solutions that balance either of the two objectives.
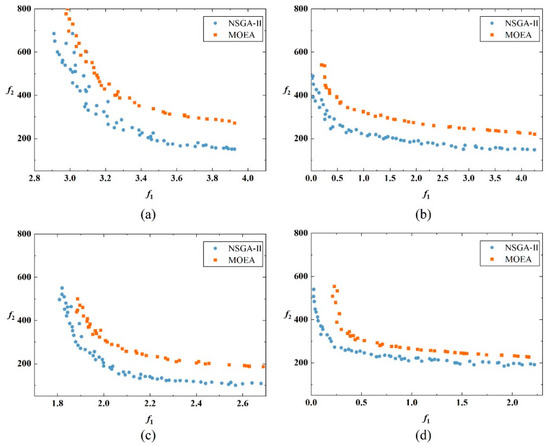
Figure 4.
Nondominated fronts constructed by NSGA-II and MOEA for the corresponding conditions: (a) TWC in wet condition; (b) EPP in wet condition; (c) TWC in dry condition; (d) EPP in dry condition (f1: equity, f2: cost).
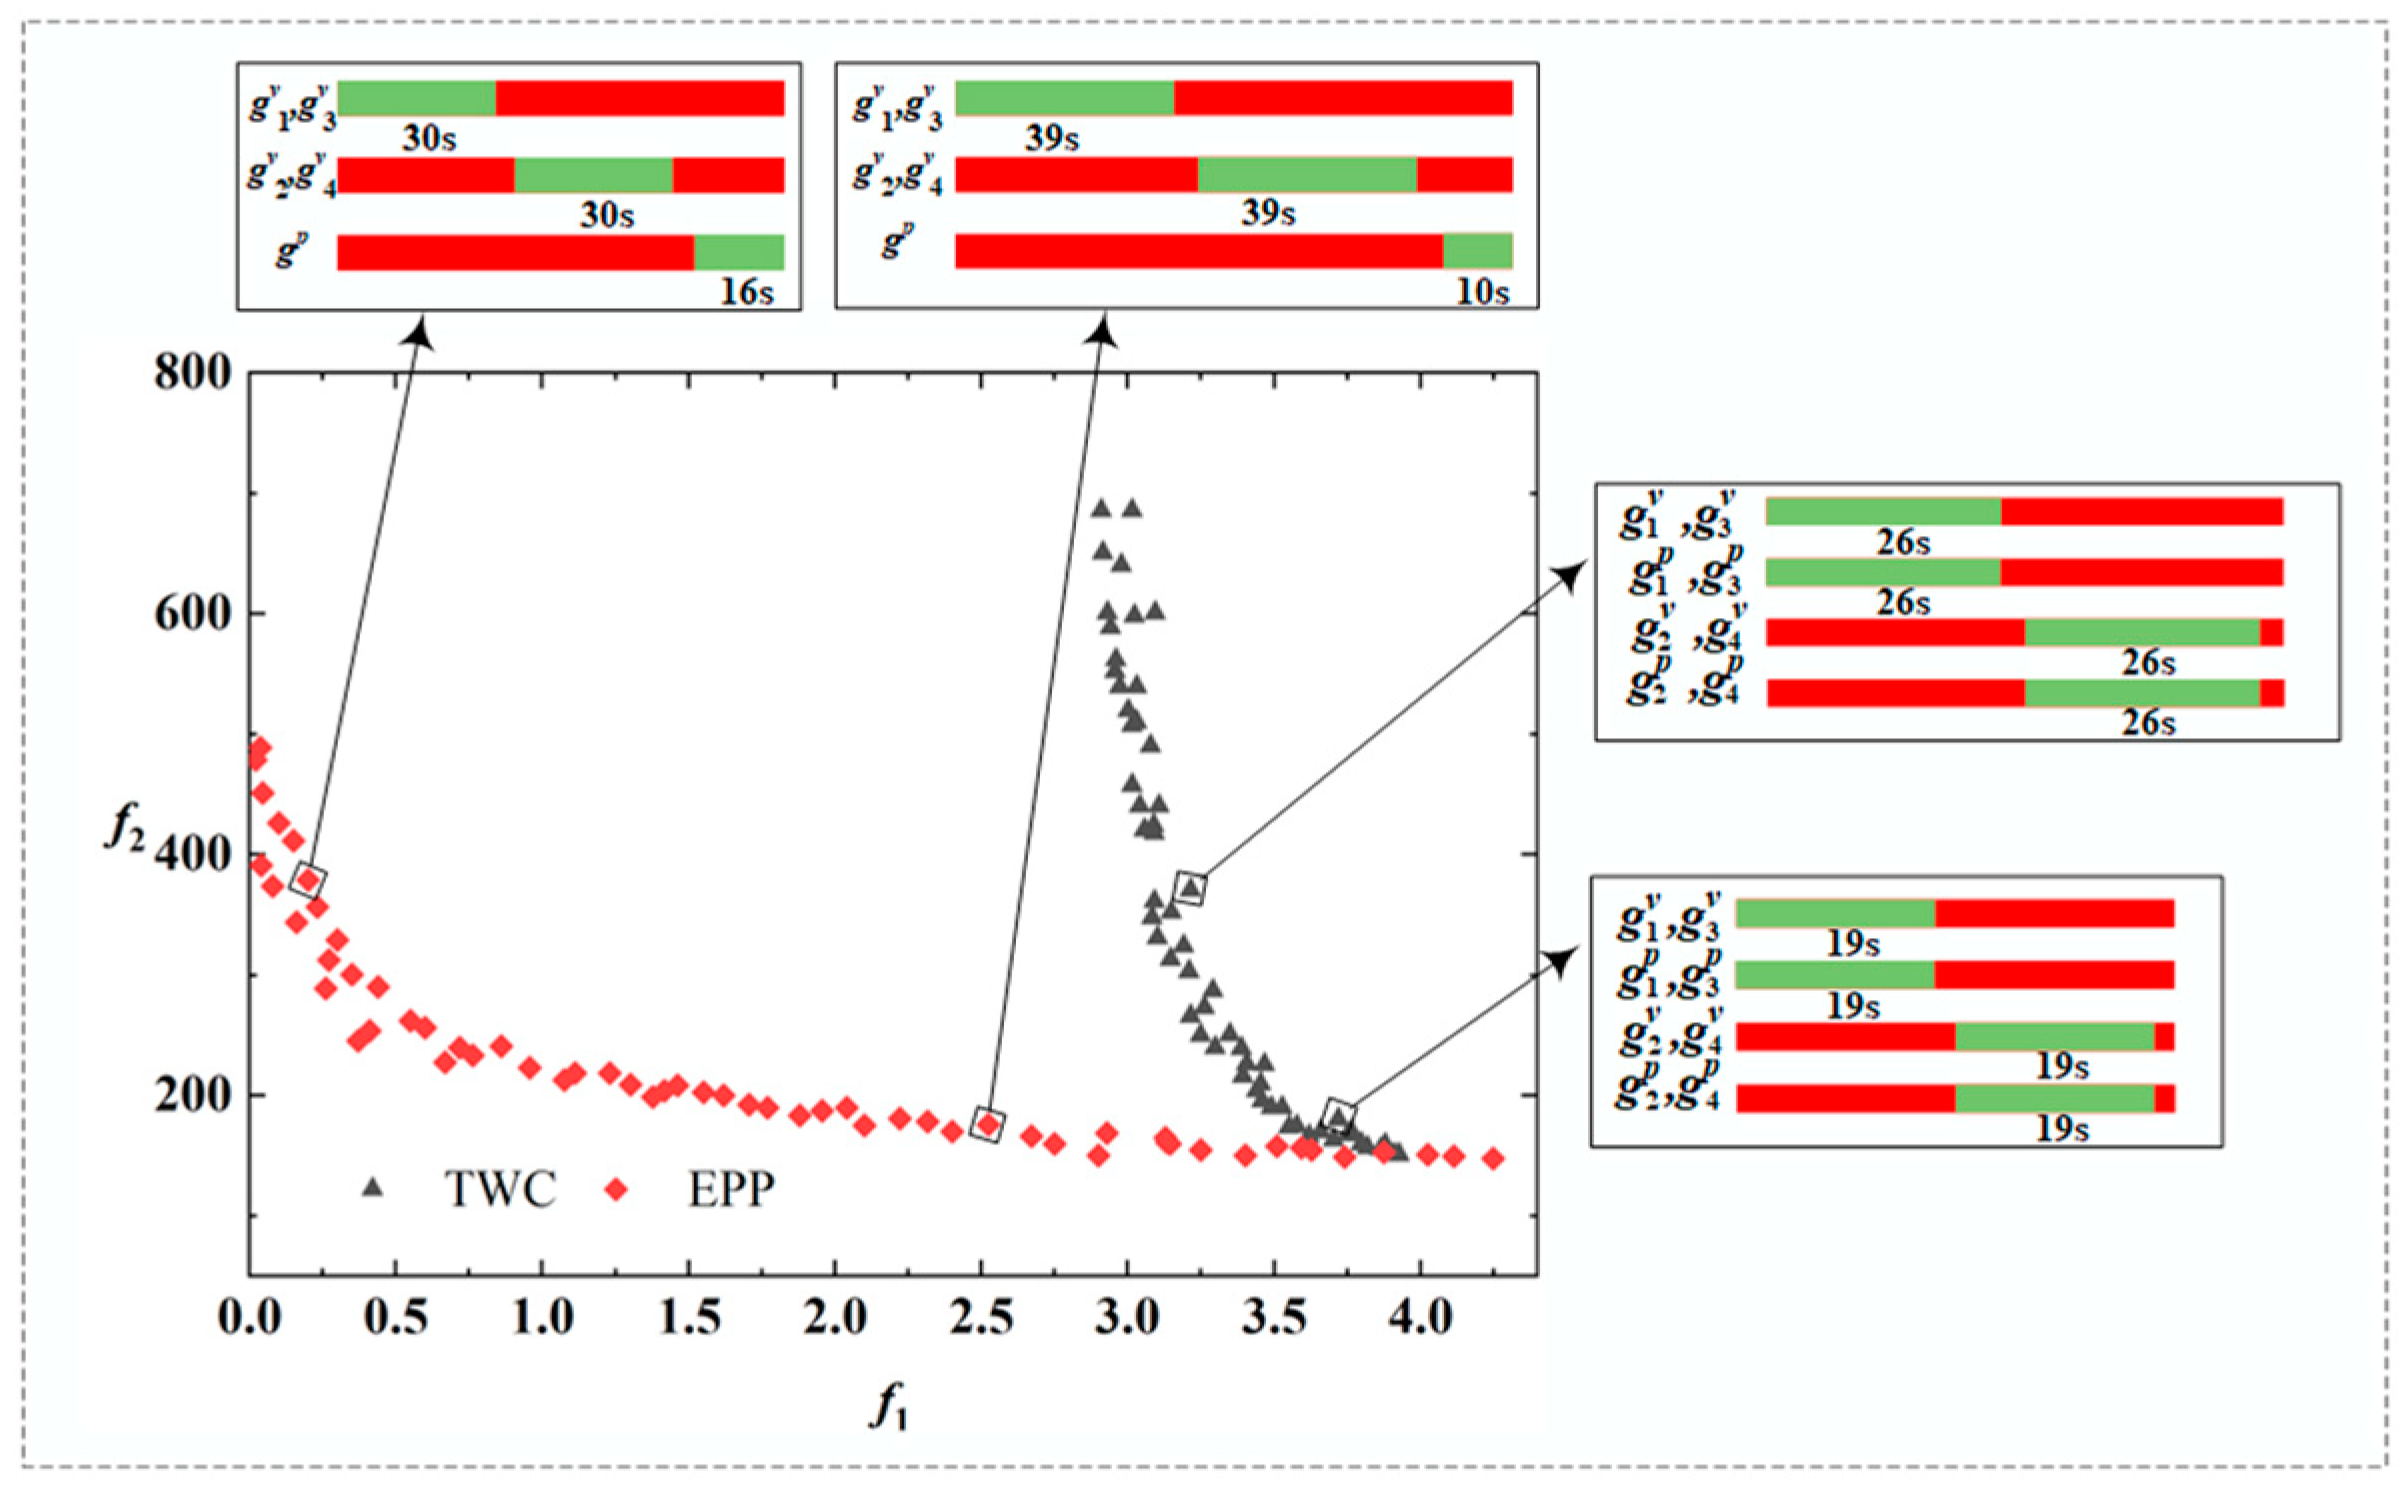
In terms of environment conditions and the EPP setting, conclusions can be drawn from Figure 5. Compared with the TWC, one fundamental advantage of EPP is that it improves the transportation equity between pedestrians and vehicles by increasing the green time for pedestrians (see Figure 5). In the first condition (wet and rainy), the cost of TWC was higher than in the second condition (dry and sunny) (see Figure 4a,c). This is in line with the conclusion that poor weather conditions can lead to degraded road capacity, thus increasing the cost. After setting the EPP, the cost of traffic participants decreased under the first condition because the EPP can eliminate the interaction between pedestrians and vehicles. However, under the second condition, the cost slightly increased under the EPP control (see Figure 4d). One possible explanation is that the traffic demand under the second condition failed to meet the threshold of the EPP setting. Such phenomena will be further discussed in the next section using sensitivity simulations.

Figure 5.
The nondominated front and signal timing pattern under EPP and TWC conditions.
5.3. Sensitivity Analysis
Pedestrian volume, vehicle volume, and yielding rate are three primary parameters influencing the setting conditions of the EPP. This section performs a sensitivity analysis of the proposed model with respect to the yielding rate under two environment conditions. The changes in environment conditions influence the decision-making process of pedestrians and vehicles [24]. Considering the pedestrian–vehicle interaction, the sensitivity analysis was carried out, with the vehicle yielding rates of 0.2, 0.4, 0.6, and 0.8.
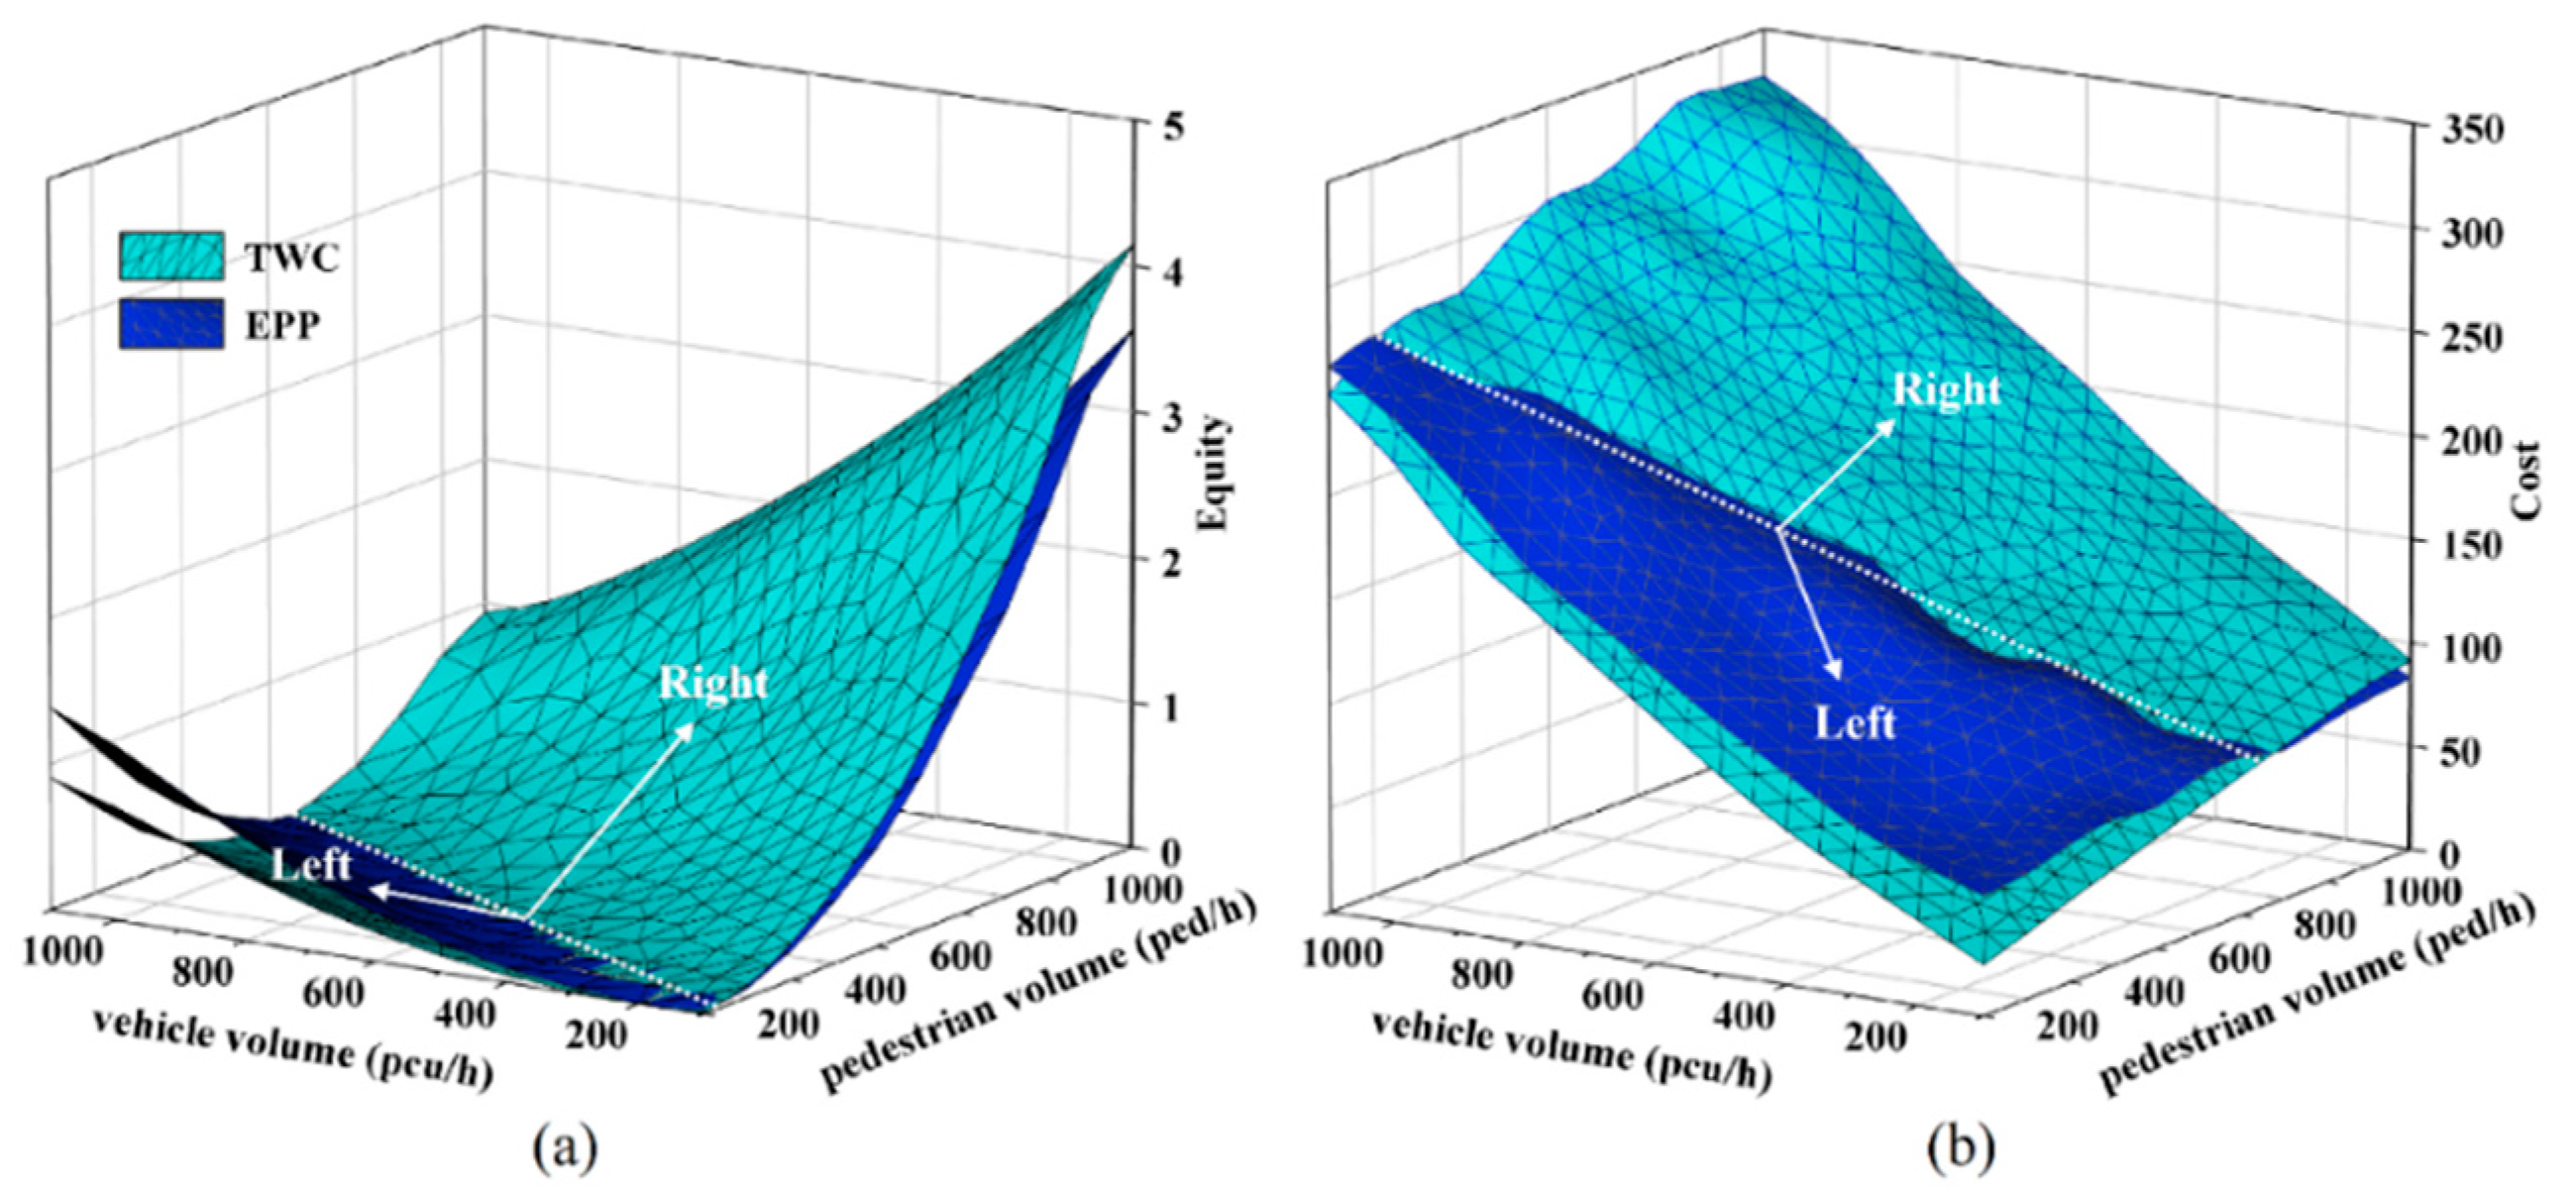
Figure 6 illustrates the impact of pedestrian and vehicle volumes on the EPP and the TWC performances with respect to transportation equity and cost under the first condition. Figure 6a shows the change of setting conditions under varying pedestrian and vehicle volumes in terms of transportation equity. On the right side of the white dotted line, the values of TEI under the EPP are lower than that of the TWC, while the values of TEI under the EPP are higher on the left side. In other words, a lower value of TEI suggests less pedestrian–vehicle difference, indicating fairer interaction. This indicates that under high traffic volumes, the EPP can provide better transportation equity than the TWC. Figure 6b reveals the change of setting conditions under different pedestrian and vehicle volumes regarding transportation cost. On the right side of the white dotted line, the cost of the EPP is lower than that of the TWC, while the cost of the EPP is higher on the left side. In low traffic demand conditions, the cost of the EPP exceeded that of the TWC, while, with high traffic demand, the cost of TWC exceeded that of the EPP. When the pedestrian and vehicle volumes increased, the cost increased under both the EPP and TWC conditions. In other words, under high traffic volumes with high pedestrian volumes, the setting of the EPP was more cost beneficial than the TWC.
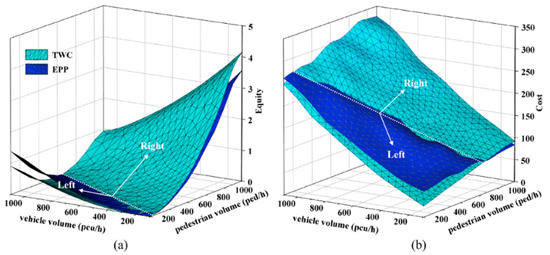
Figure 6.
Impacts of pedestrian and vehicle demand: (a) Transportation equity comparison; (b) transportation cost comparison.
To analyze the combined impact of the two objectives (transportation cost and equity) on the EPP setting, the bi-objective model was transformed into a single objective model. The detailed transformation formulation is based on the pseudoweight vector approach listed in Appendix A.
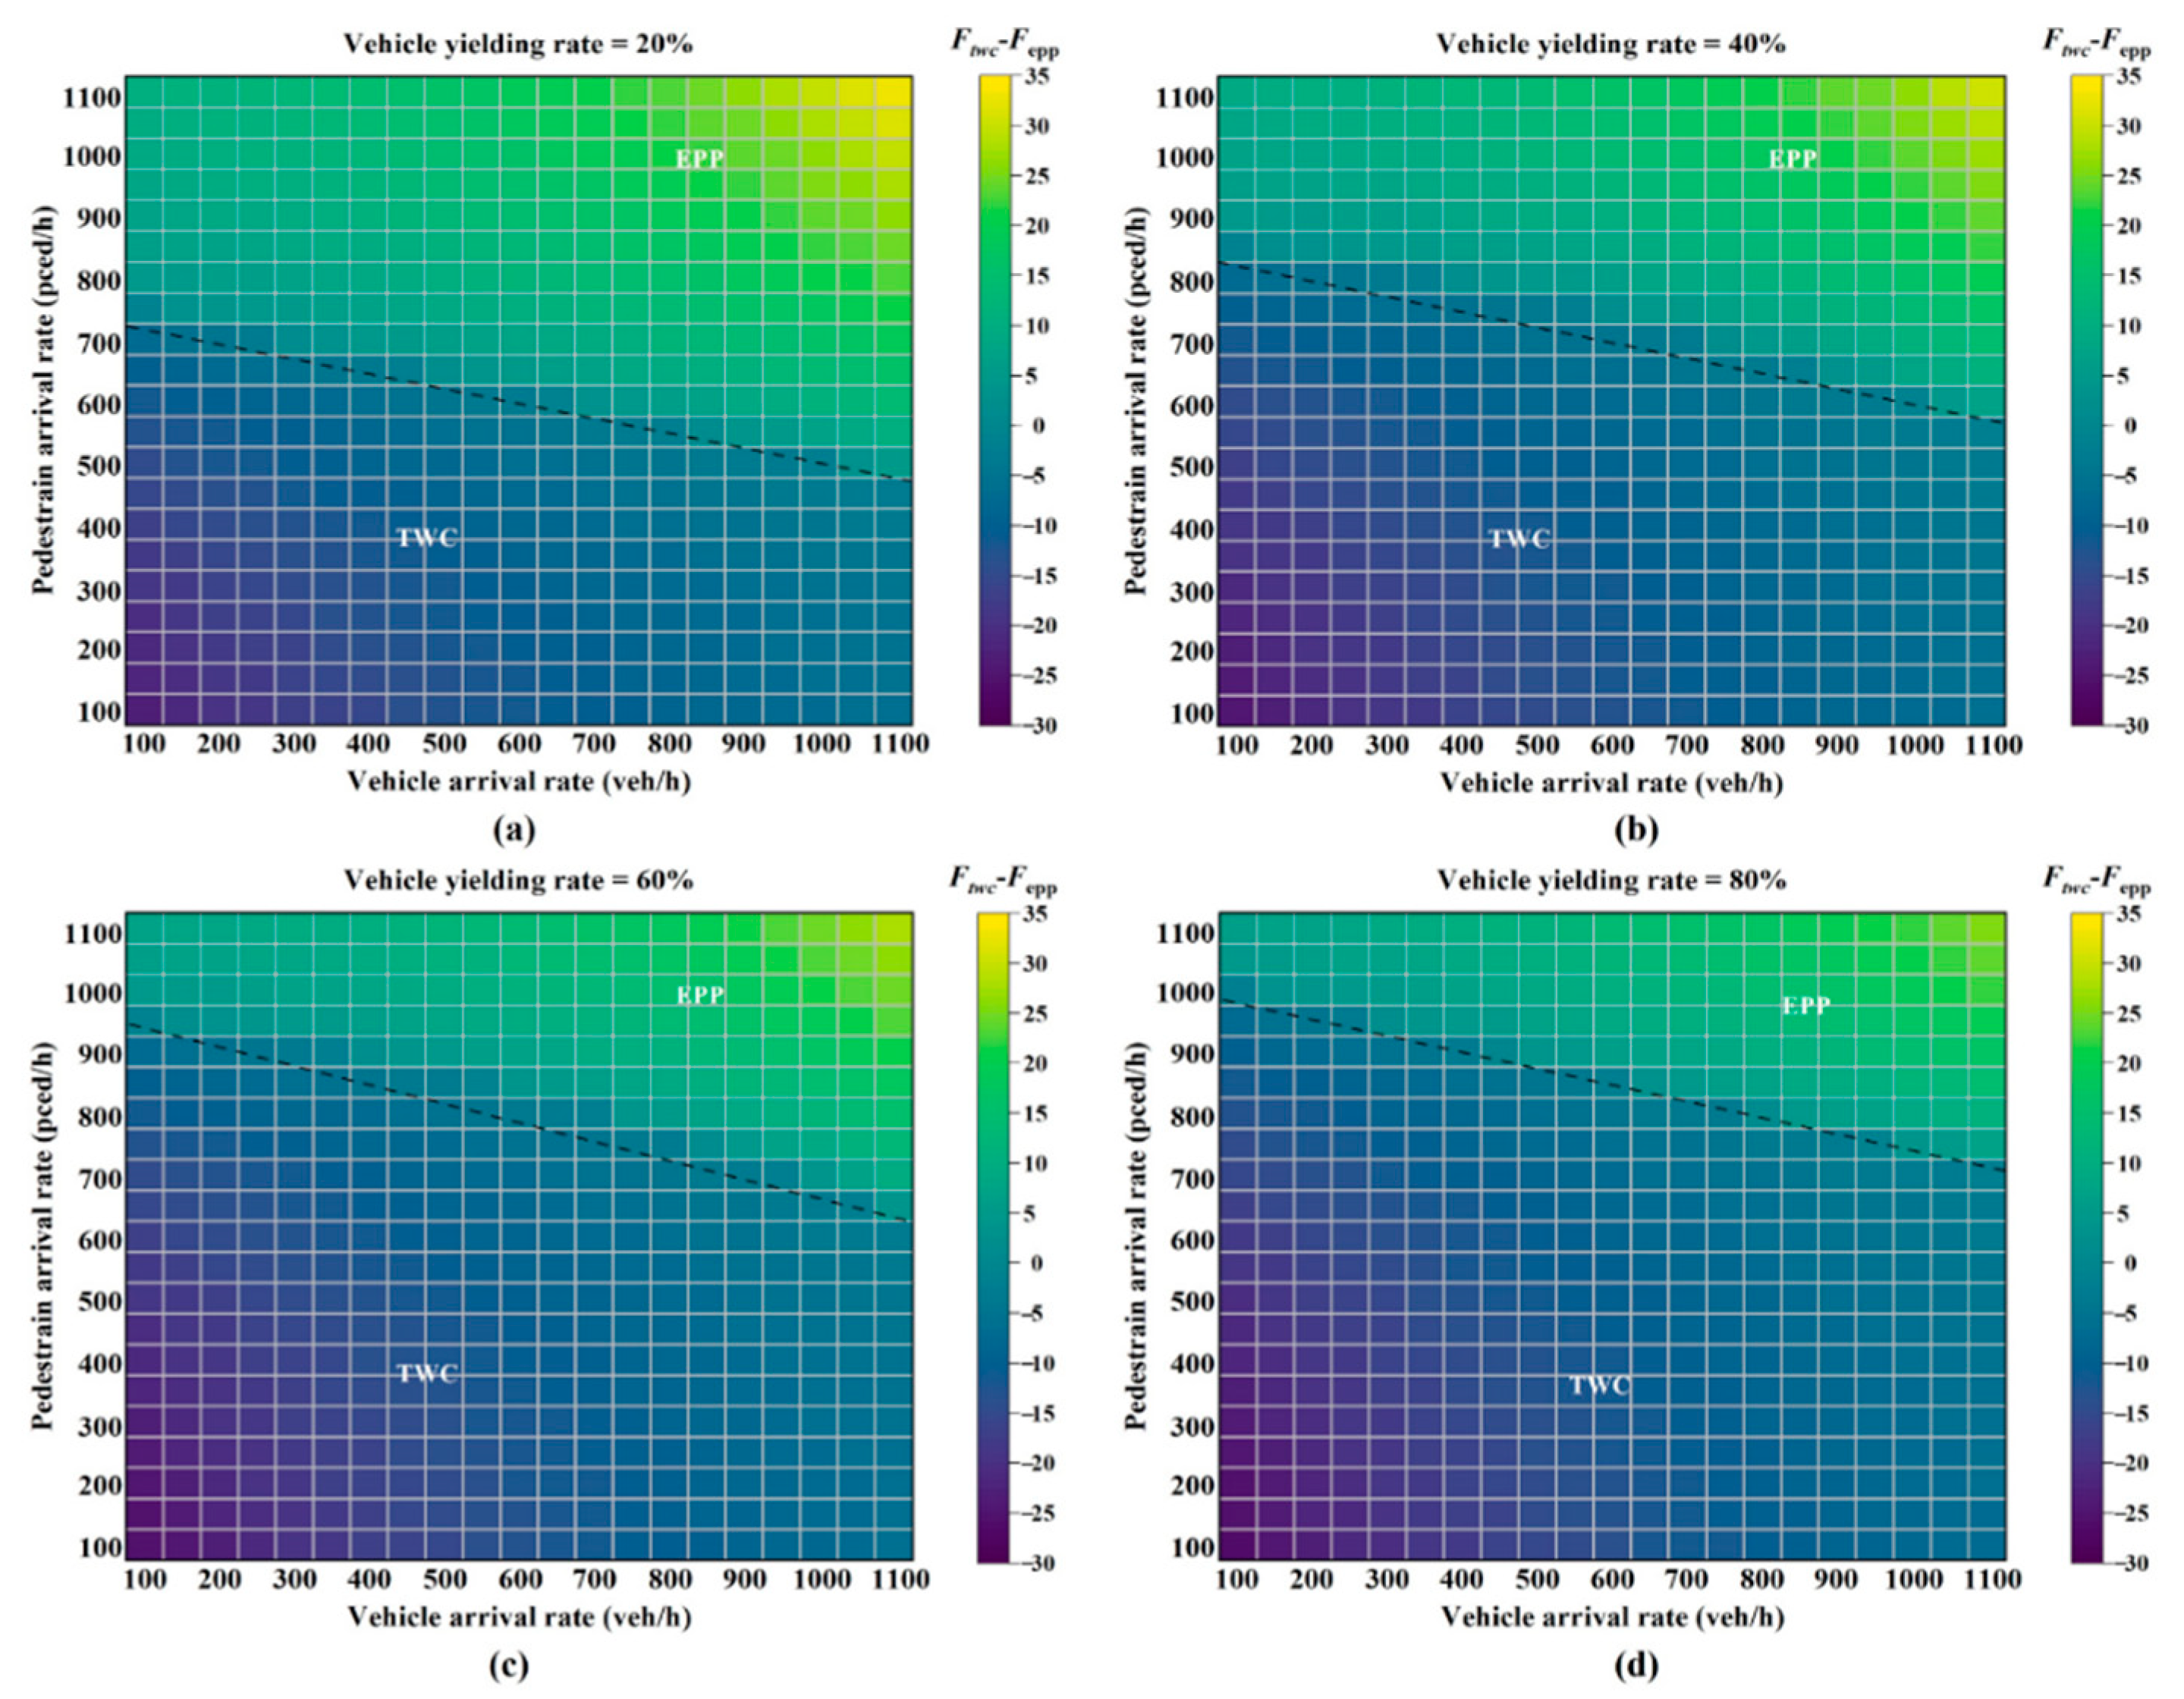
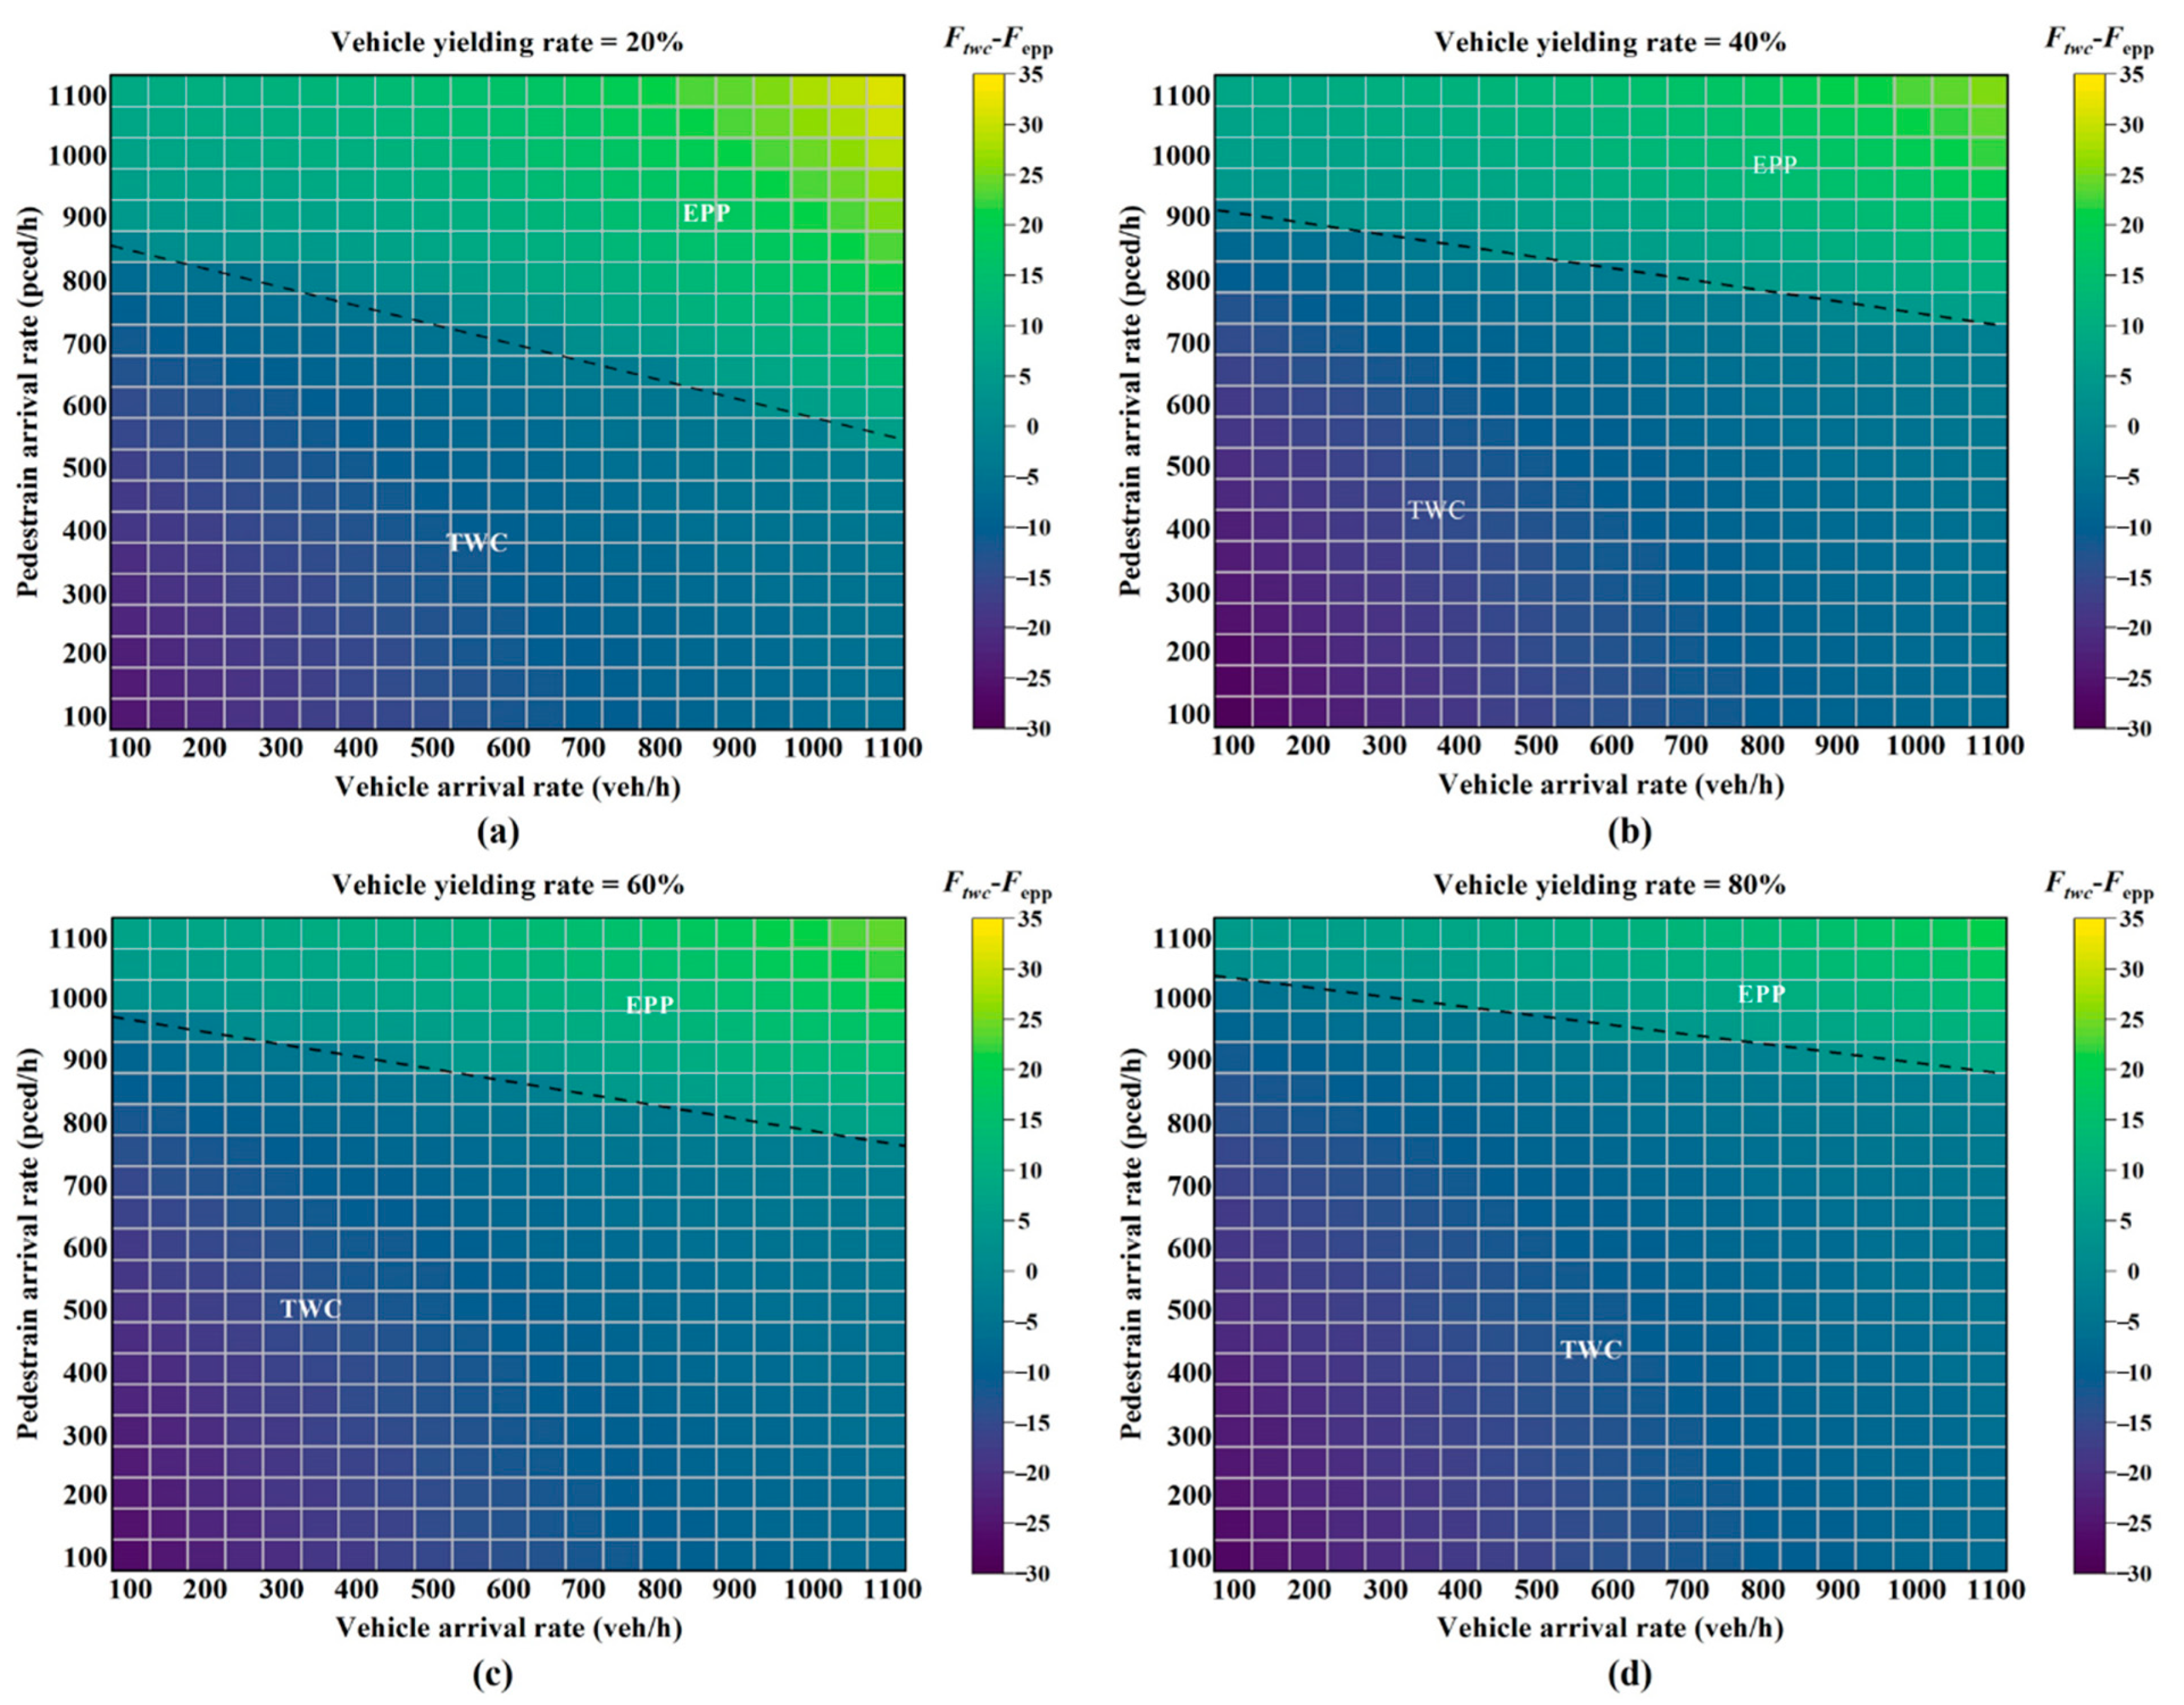
Figure 7 and Figure 8 indicate the EPP setting domain with respect to traffic volume and yielding rate in two different environment conditions. The black dotted line (the zero-difference line) divides the phase setting domain into two parts: the TWC and the EPP application. When the line takes on a negative difference, the TWC is better than the EPP, while the EPP is better when the difference is positive.
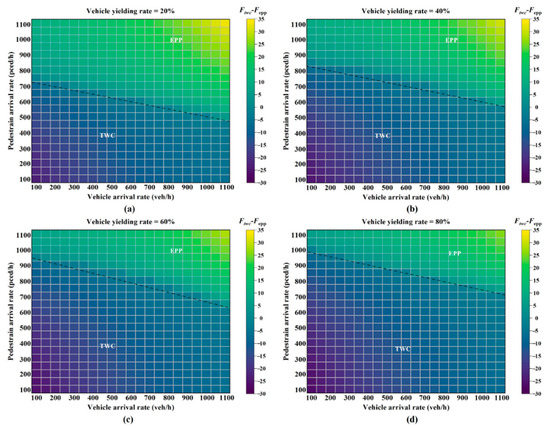
Figure 7.
Phase setting and traffic demand under different vehicle yielding rates in the first condition: (a) vehicle yielding rate, 20%; (b) vehicle yielding rate, 40%; (c) vehicle yielding rate, 60%; (d) vehicle yielding rate, 80%.

Figure 8.
Phase setting and traffic demand under different vehicle yielding rates in the second condition: (a) vehicle yielding rate, 20%; (b) vehicle yielding rate, 40%; (c) vehicle yielding rate, 60%; (d) vehicle yielding rate, 80%.
When the yielding rate increased, the boundary condition for setting the EPP became loose under both environment conditions, as shown in Figure 7 and Figure 8. When the yielding rate was 0.2 (see Figure 7a), the EPP was more suitable for a pedestrian demand higher than 750 ped/h and a vehicle demand higher than 800 pcu/h. When the yielding rate was 0.8, as shown in Figure 7d, few pedestrian–vehicle interactions emerged. In this case, the EPP setting was recommended when the pedestrian demand exceeded 1000 ped/h and the vehicle demand exceeded 900 pcu/h.
With the same yielding rate, the EPP setting criteria in the second condition was stricter than the criteria in the first condition, as compared with Figure 7 and Figure 8. In other words, the EPP is more suitable than the TWC at intersections with poor weather conditions for preventing potential pedestrian–vehicle conflicts. In Figure 7a and Figure 8a, with the yielding rate of 0.2, the EPP is suitable when pedestrian demand reaches 750 ped/h in the first condition. However, 880 ped/h is required in the second condition. Based on the results of the sensitivity analysis, this study concludes:
- When the vehicular volume is constant, the EPP setting has a better effect with high pedestrian volumes.
- With the same traffic demand, it is more suitable to set the EPP when the yielding rate is low. The analysis shows that the yielding rate has a significant impact on the EPP setting conditions at intersections.
- Environment factors have effects on the EPP setting condition. With the same traffic demand and yielding rate, the EPP is more suitable under wet conditions. It shows that incorporating the environment condition into the EPP setting criteria is essential.
6. Conclusions
This study established a bi-objective optimization model to determine the EPP setting criteria, with consideration for the tradeoff between transportation equity and cost. The equity model was established to minimize the individual differences under different environment conditions. The cost model considers the pedestrian–vehicle interaction and converts traffic safety and efficiency factors into monetary values, which minimize the delay and safety costs. A nonlinear programming model was formulated, and the optimal signal timing was obtained by solving the proposed model. To validate the optimization framework, this study conducted a numerical experiment based on the UAV datasets collected under two environment conditions. The algorithm performance of two evolutionary algorithms (i.e., the NSGA-II and the MOEA) were compared.
The results of the numerical experiment showed that transportation equity was inversely related to the cost, indicating that the decrease in transportation equity leads to an increased cost. The obtained Pareto front approximations corresponded to diverse pruning solutions and balance between optimizing either objective to different extents. The numerical analysis and field study validated the effectiveness of the proposed model in improving the comprehensive performance of the intersections. The results revealed the tradeoff between transportation equity and cost, indicating the necessity to optimize the pedestrian phase selection strategy, rather than having a one-sided consideration.
Considering the influence of vehicular/pedestrian demand, yielding rate, and environment conditions on the application domains of the EPP, the sensitivity analysis was conducted based on the numerical experiment. The results showed that the EPP was more suitable at intersections with a high pedestrian volume, especially in the first environment condition. Additionally, the application domains of the EPP change significantly with the yielding rate. Thus, it is essential to incorporate the yielding rate and the environment variable into the EPP setting criteria.
The research results provide operation guidance for decision-makers to better select pedestrian phase patterns at signalized intersections. In addition to the pedestrian–vehicle interaction and environment factors, traffic equity modeling can be further optimized by considering multimodal transportation and the accessibility of traffic participants. Extensive field studies should be conducted to further calibrate the cost values and environment variables under various traffic demand patterns and intersection configurations. Another possible extension is to study the pedestrian phase setting, with consideration for the linkage control of adjacent signalized intersections.
Author Contributions
Y.L. proposed the optimization framework and participated in its design and coordination. C.L. and T.W. led the manuscript preparation. Z.W. and Y.Z. contributed to the data collection and model solution. All authors have read and agreed to the published version of the manuscript.
Funding
The Science and Technology Commission of Shanghai Municipality (Grant No. 19DZ1208800, 20DZ1202900, 21DZ1200800, and 21692106700), the National Social Science Foundation of China (Grant No. 18BSH143), and APTSLAB (Grant No. 2020-APTS-04).
Data Availability Statement
The dataset presented in this article is not readily available because it is a part of the ongoing projects (The Science and Technology Commission of Shanghai Municipality); therefore, the dataset is confidential during this period.
Conflicts of Interest
None of the authors have a conflict of interest to declare.
Abbreviations
| EPP | Exclusive Pedestrian Phase |
| TWC | Traditional Two-way Control Phase |
| TEI | Transportation Equity Index |
| MOEA | Multiobjective Evolutionary Algorithm based on Decomposition |
| NSGA-II | Nondominated Sorting Genetic Algorithm II |
| MINLP | Mixed Integer Nonlinear Programming |
| UAV | Unmanned Aerial Vehicle |
Appendix A
In Section 3.3.1, under the EPP control, pedestrian crossing throughput () was divided into two parts by period. During the EPP period , is the corresponding pedestrian crossing throughput from all directions (including diagonal lines) in each cycle. is the pedestrian crossing throughput in each cycle during the non-EPP period .
is the number of pedestrians passing through the crosswalks in each cycle, with the crosswalk length of , , ; is the EPP period with the measured value of 26 s in the case study; is the length of green for pedestrians to cross the street; is the minimum time for pedestrians to cross the street, ; is the crosswalk length; is the diagonal crosswalk length; is the number of pedestrians in the first row at the initial stage of EPP, ; is the crosswalk width; is the reduction coefficient of straight vehicles affected by left-turn vehicles under the EPP control.
In Section 3.4.1, the vehicle delay consisted of uniform delay and incremental delay and is given as follows:
The pedestrian control delay () is given as follows:
where is pedestrian STOP intervals; denotes the average flow rate of turning vehicles i (veh/s); is the minimum length of the acceptable gap for crossing (s); is a binary variable representing the pedestrian phase pattern, . Noted that only signal delay exists under the EPP condition.
In Section 5.3, the two objectives in the proposed model were weighted by the pseudoweight vector approach proposed in [61] to choose a solution out of a solution set in the context of multiobjective optimization. The pseudoweight for the two corresponding objective functions (f1: equity, f2: cost) can be calculated by:
This equation calculates the normalized distance to the worst solution regarding each objective. Based on this, the bi-objective model was transformed into a single objective model.
Appendix B
Table A1.
Notation and parameter description.
Table A1.
Notation and parameter description.
| Parameter | Description |
|---|---|
| Environmental index of vehicles and pedestrians | |
| Vehicular flow on arm i in current cycle, (pcu/h) | |
| Pedestrian flow on arm i in current cycle, (ped/h) | |
| Vehicular throughput in this cycle, (pcu/h) | |
| Pedestrian throughput in this cycle, (ped/h) | |
| Length of green of pedestrian signal, (s) | |
| Pedestrian crosswalk length, (m) | |
| Diagonal crosswalk length, (m) | |
| Crosswalk width, (m) | |
| Distance between pedestrians, (m) | |
| Speed of crossing pedestrians, (m/s) | |
| Lost time due to pedestrian safety concerns at the end of the red light, (s) | |
| Cycle length, (s) | |
| Green time of EPP, (s) | |
| Time when the right-turning vehicle occupies the sidewalk, (s) | |
| Converted vehicle length, (m) | |
| Minimum safe distance between pedestrians and right-turning vehicles, (m) | |
| Speed of right-turning vehicles, (m/s) | |
| EPP period, (s) | |
| Length of green for pedestrians to cross the street, (s) | |
| Minimum time for pedestrians to cross the street, (s) | |
| , | Pedestrian–vehicle interaction time of pedestrian and vehicle, (s) |
| Number of pedestrians passing through the crosswalks in each cycle with the crosswalk length of , ; | |
| Number of pedestrians in the first row at the initial stage of EPP | |
| Signal period of left turn and straight in a cycle, respectively | |
| Average vehicle headway of left turn, straight, and right turn, respectively | |
| Vehicle yielding rate (%) | |
| Pedestrian yielding rate (%) | |
| Numbers of pedestrian–vehicle interactions before setting EPP | |
| Speed of vehicles, (m/s) | |
| Acceleration of vehicles, (m/s2) | |
| Total vehicular demand at corner i, (pcu/h) | |
| Total pedestrian crossing demand at corner i, (ped/h) | |
| the number of potential traffic accidents under TWC control | |
| Binary variable representing the pedestrian phase type, | |
| Average accident number to pedestrian noncompliance ratio | |
| Probability of pedestrian noncompliance | |
| Proportion of pedestrian volume from corner i to corner j in total pedestrian demand of corner i |
References
- Cheng, W.; Zhang, N.; Li, W.; Xi, J. Modeling and Application of Pedestrian Safety Conflict Index at Signalized Intersections. Discret. Dyn. Nat. Soc. 2014, 2014, 1–6. [Google Scholar] [CrossRef]
- Xin, X.; Jia, N.; Ma, S.; Mu, J. Empirical and simulation study of traffic delay at un-signalized crosswalks due to conflicts between pedestrians and vehicles. Transp. B Transp. Dyn. 2019, 7, 637–656. [Google Scholar] [CrossRef]
- Zhang, Y.; Mamun, S.A.; Ivan, J.; Ravishanker, N.; Haque, K. Safety effects of exclusive and concurrent signal phasing for pedestrian crossing. Accid. Anal. Prev. 2015, 83, 26–36. [Google Scholar] [CrossRef] [PubMed]
- Zegeer, C.V.; Opiela, K.S.; Cynecki, M.J. Effect of pedestrian signals and signal timing on pedestrian accidents. In Proceedings of the 61st Annual Meeting of the Transportation Research Board, Washington, DC, USA, 18–22 January 1982. [Google Scholar]
- Ivan, J.; McKernan, K.; Zhang, Y.; Ravishanker, N.; Mamun, S.A. A study of pedestrian compliance with traffic signals for exclusive and concurrent phasing. Accid. Anal. Prev. 2017, 98, 157–166. [Google Scholar] [CrossRef] [PubMed]
- Yang, X.; Ma, W.; Lin, Y. Criterion of setting exclusive pedestrian phases at two-phase signalized intersections. J. Highw. Transp. Res. Dev. 2005, 22, 127–131. [Google Scholar]
- Wang, J.; Yang, C.; Zhao, J. Conditions for Setting Exclusive Pedestrian Phases at Two-Phase Signalized Intersections considering Pedestrian-Vehicle Interaction. J. Adv. Transp. 2021, 2021, 1–14. [Google Scholar] [CrossRef]
- Al-Ghamdi, A.S. Pedestrian–vehicle crashes and analytical techniques for stratified contingency tables. Accid. Anal. Prev. 2002, 34, 205–214. [Google Scholar] [CrossRef]
- Ma, W.; Liao, D.; Liu, Y.; Lo, H.K. Optimization of pedestrian phase patterns and signal timings for isolated intersection. Transp. Res. Part C Emerg. Technol. 2015, 58, 502–514. [Google Scholar] [CrossRef]
- Ma, W.; Liu, Y.; Head, K.L. Optimization of pedestrian phase patterns at signalized intersections: A multi-objective approach. J. Adv. Transp. 2014, 48, 1138–1152. [Google Scholar] [CrossRef]
- Zheng, Y.; Elefteriadou, L. A model of pedestrian delay at unsignalized intersections in urban networks. Transp. Res. Part B Methodol. 2017, 100, 138–155. [Google Scholar] [CrossRef]
- Wei, D.; Xu, H.; Kumfer, W.; Liu, H.; Wang, Z. Vehicular Traffic Capacity at Unsignalized Crosswalks with Probabilistic Yielding Behavior. Transp. Res. Rec. 2015, 2483, 80–90. [Google Scholar] [CrossRef] [Green Version]
- Li, Y.; Yu, L.; Tao, S.; Chen, K. Multi-Objective Optimization of Traffic Signal Timing for Oversaturated Intersection. Math. Probl. Eng. 2013, 2013, 182643. [Google Scholar] [CrossRef]
- Zhang, L.; Zhu, J.; Shuai, B. Multi-objective optimization of signal timing at congestion intersection by considering pedestrian behavior. Comput. Eng. Appl. 2015, 2015, 223–227. [Google Scholar]
- Sucha, M.; Dostal, D.; Risser, R. Pedestrian-driver communication and decision strategies at marked crossings. Accid. Anal. Prev. 2017, 102, 41–50. [Google Scholar] [CrossRef] [Green Version]
- Hediyeh, H.; Sayed, T.; Zaki, M.H. The use of gait parameters to evaluate pedestrian behavior at scramble phase signalized intersections. J. Adv. Transp. 2015, 49, 523–534. [Google Scholar] [CrossRef]
- Ma, W.; Han, B.; An, K.; Zhang, N. Investigating the applicability of exclusive pedestrian phase at two-phase actuated controlled intersections. J. Adv. Transp. 2015, 49, 752–767. [Google Scholar] [CrossRef]
- Bourquin, E.A.; Emerson, R.W.; Sauerburger, D.; Barlow, J.M. Conditions that Influence Drivers’ Behaviors at Roundabouts: Increasing Yielding for Pedestrians who are Visually Impaired. J. Vis. Impair. Blind. 2018, 112, 61–71. [Google Scholar] [CrossRef]
- Kim, K.B. Time Separation Control Between Pedestrians and Turning Vehicles at Intersections. Ph.D. Thesis, Polytechnic University, New York, NY, USA, 2005. [Google Scholar]
- Kattan, L.; Acharjee, S.; Tay, R. Pedestrian scramble operations: Pilot study in Calgary, Alberta, Canada. Transp. Res. Rec. 2009, 2140, 79–84. [Google Scholar] [CrossRef]
- Torbic, D.; Elefteriadou, L. Effects of Driver Population on the Traffic Operational Performance of Signalized Intersections; Transportation Research Circular: Taipei, Taiwan, 2000. [Google Scholar]
- Stapleton, S.; Kirsch, T.; Gates, T.J.; Savolainen, P.T. Factors Affecting Driver Yielding Compliance at Uncontrolled Midblock Crosswalks on Low-Speed Roadways. Transp. Res. Rec. J. Transp. Res. Board 2017, 2661, 95–102. [Google Scholar] [CrossRef]
- Tanner, J.C. Effect of Weather on Traffic Flow. Nature 1952, 169, 107. [Google Scholar] [CrossRef]
- Prevedouros, P.D.; Chang, K.-C. Potential Effects of Wet Conditions on Signalized Intersection LOS. J. Transp. Eng. 2005, 131, 898–903. [Google Scholar] [CrossRef] [Green Version]
- Akin, D.; Sisiopiku, V.; Skabardonis, A. Impacts of Weather on Traffic Flow Characteristics of Urban Freeways in Istanbul. Procedia-Soc. Behav. Sci. 2011, 16, 89–99. [Google Scholar] [CrossRef] [Green Version]
- Cheng, C.; Du, Y.; Sun, L.; Ji, Y. Review on Theoretical Delay Estimation Model for Signalized Intersections. Transp. Rev. 2015, 36, 479–499. [Google Scholar] [CrossRef]
- Adams, W.F. Road Traffic Considered as a Random Series. (Includes Plates). J. Inst. Civ. Eng. 1936, 4, 121–130. [Google Scholar] [CrossRef]
- Webster, F.V. Traffic Signal Settings. Road Research Technical Paper; Road Research Laboratory: London, UK, 1958; p. 39. [Google Scholar]
- Akçelik, R. Time-Dependent Expressions for Delay, Stop Rate and Queue Length at Traffic Signals; Internal Report AIR 367–1; Australian Road Research Board: Vermont South, Australia, 1980. [Google Scholar]
- Council, N.R. Highway Capacity Manual (HCM); Transportation Research Board: Washington, DC, USA, 2010. [Google Scholar]
- Schroeder, B.; Rouphail, N.; Salamati, K.; Hunter, E.; Phillips, B.; Elefteriadou, L.; Thomas, C.; Yinan, Z.; Sisiopiku, V.P.; Mamidipalli, S. Empirically-Based Performance Assessment and Simulation of Pedestrian Behavior at Unsignalized Crossings; Southeastern Transportation Research, Innovation, Development and Education Center (STRIDE): Tampa, FL, USA, 2014. [Google Scholar]
- Sun, D.; Ukkusuri, S.V.S.K.; Benekohal, R.F.; Waller, S.T. Modeling of motorist-pedestrian interaction at uncontrolled mid-block crosswalks. In Proceedings of the Transportation Research Record, TRB Annual Meeting CD-ROM, Washington, DC, USA, 12–16 January 2003. [Google Scholar]
- Schroeder, B. A Behavior-Based Methodology for Evaluating Pedestrian-Vehicle Interaction at Crosswalks. Ph.D. Thesis, North Carolina State University, Raleigh, NC, USA, 2008. [Google Scholar]
- Yang, J.; Li, Q.; Wang, Z.; Wang, J. Estimating pedestrian delays at signalized intersections in developing cities by Monte Carlo method. Math. Comput. Simul. 2005, 68, 329–337. [Google Scholar] [CrossRef]
- Marisamynathan, S.; Vedagiri, P. Modeling Pedestrian Delay at Signalized Intersection Crosswalks Under Mixed Traffic Condition. Procedia-Soc. Behav. Sci. 2013, 104, 708–717. [Google Scholar] [CrossRef] [Green Version]
- Sanchez, T.W.; Stolz, R.; Ma, J.S. Moving to Equity: Addressing Inequitable Effects of Transportation Policies on Minorities; The Civil Rights Project at Harvard University: Cambridge, MA, USA, 2003. [Google Scholar]
- Cantilina, K.; Daly, S.R.; Reed, M.P.; Hampshire, R.C. Approaches and Barriers to Addressing Equity in Transportation: Experiences of Transportation Practitioners. Transp. Res. Rec. J. Transp. Res. Board 2021, 2675, 972–985. [Google Scholar] [CrossRef]
- Guo, Y.; Chen, Z.; Stuart, A.; Li, X.; Zhang, Y. A systematic overview of transportation equity in terms of accessibility, traffic emissions, and safety outcomes: From conventional to emerging technologies. Transp. Res. Interdiscip. Perspect. 2020, 4, 100091. [Google Scholar] [CrossRef]
- Litman, T. Evaluating Transportation Equity: Guidance for Incorporating Distributional Impacts in Transport Planning; Victoria Transport Policy Institute: Victoria, Australia, 2012. [Google Scholar]
- Martens, K.; Golub, A.; Robinson, G. A justice-theoretic approach to the distribution of transportation benefits: Implications for transportation planning practice in the United States. Transp. Res. Part A Policy Pract. 2012, 46, 684–695. [Google Scholar] [CrossRef] [Green Version]
- Karner, A.; London, J.; Rowangould, D.; Manaugh, K. From Transportation Equity to Transportation Justice: Within, Through, and Beyond the State. J. Plan. Lit. 2020, 35, 440–459. [Google Scholar] [CrossRef]
- Amekudzi, A.; Meyer, M.D. Considering the Environment in Transportation Planning: Review of Emerging Paradigms and Practice in the United States. J. Urban Plan. Dev. 2006, 132, 42–52. [Google Scholar] [CrossRef] [Green Version]
- Vossen, T.; Ball, M.; Hoffman, R.; Wambsganss, M. A General Approach to Equity in Traffic Flow Management and Its Application to Mitigating Exemption Bias in Ground Delay Programs. Air Traffic Control Q. 2003, 11, 277–292. [Google Scholar] [CrossRef] [Green Version]
- Ferguson, E.M.; Duthie, J.; Unnikrishnan, A.; Waller, S.T. Incorporating equity into the transit frequency-setting problem. Transp. Res. Part A Policy Pr. 2012, 46, 190–199. [Google Scholar] [CrossRef]
- Feng, T.; Timmermans, H.J. Trade-offs between mobility and equity maximization under environmental capacity constraints: A case study of an integrated multi-objective model. Transp. Res. Part C Emerg. Technol. 2014, 43, 267–279. [Google Scholar] [CrossRef]
- Chen, C.; Achtari, G.; Majkut, K.; Sheu, J.-B. Balancing equity and cost in rural transportation management with multi-objective utility analysis and data envelopment analysis: A case of Quinte West. Transp. Res. Part A Policy Pr. 2017, 95, 148–165. [Google Scholar] [CrossRef]
- Dong, J.; Bian, C.; Wang, J.; Lin, S.; Liu, W. A Method for Dynamic Setting Exclusive Pedestrian Phase of Data-driven Two-phase Signal Control Intersection. J. Highw. Transp. Res. Dev. 2020, 37, 85–95. [Google Scholar]
- Zheng, Z.; Li, K.; Xu, J. Modern Urban Transportation; The People’s Communication Publishing Company: Beijing, China, 1998. [Google Scholar]
- Yang, X.; Zhao, J.; Bai, Y. Review on Calculation Method for Signalized Intersection Capacity. Highw. Transp. Technol. 2010, 27, 112–121. [Google Scholar]
- Dion, F.; Rakha, H.; Kang, Y.-S. Comparison of delay estimates at under-saturated and over-saturated pre-timed signalized intersections. Transp. Res. Part B Methodol. 2004, 38, 99–122. [Google Scholar] [CrossRef]
- Nilsson, G. Riskmassor: Strukturering av Behov av Riskmassor för Trafikolycksanalys; Report No 144; State Road and Traffic Institute: Linkoping, Sweden, 1978. [Google Scholar]
- Lord, D. Analysis of pedestrian conflicts with left-turning traffic. Transp. Res. Rec. 1996, 1538, 61–67. [Google Scholar] [CrossRef]
- Gårder, P. Pedestrian safety at traffic signals: A study carried out with the help of a traffic conflicts technique. Accid. Anal. Prev. 1989, 21, 435–444. [Google Scholar] [CrossRef]
- Yuan, L.; Ge, X.; Lei, Z. Research on method for evaluating safety and efficiency of exclusive pedestrian phase. China Saf. Sci. J. 2014, 24, 85–90. [Google Scholar]
- Deb, K.; Pratap, A.; Agarwal, S.; Meyarivan, T. A fast and elitist multiobjective genetic algorithm: NSGA-II. IEEE Trans. Evol. Comput. 2002, 6, 182–197. [Google Scholar] [CrossRef] [Green Version]
- Sun, D.; Benekohal, R.F.; Waller, S.T. Multiobjective traffic signal timing optimization using non-dominated sorting genetic algorithm. In Proceedings of the IEEE IV2003 Intelligent Vehicles Symposium (Cat. No.03TH8683), Columbus, OH, USA, 9 June 2003. [Google Scholar]
- Trivedi, A.; Srinivasan, D.; Sanyal, K.; Ghosh, A. A Survey of Multiobjective Evolutionary Algorithms based on Decomposition. IEEE Trans. Evol. Comput. 2016, 21, 440–462. [Google Scholar] [CrossRef]
- Yang, Z. Signal Timing Optimization Based on Minimizing Vehicle and Pedestrian Delay by Genetic Algorithm. Master’s Thesis, University of Illinois at Urbana-Champaig, Urbana, IL, USA, 2010. [Google Scholar]
- Tang, L.; Liu, Y.; Li, J.; Qi, R.; Zheng, S.; Chen, B.; Yang, H. Pedestrian crossing design and analysis for symmetric intersections: Efficiency and safety. Transp. Res. Part A Policy Pract. 2020, 142, 187–206. [Google Scholar] [CrossRef]
- Strnad, D.; Kohek, Š.; Benes, B.; Kolmanič, S.; Žalik, B. A framework for multi-objective optimization of virtual tree pruning based on growth simulation. Expert Syst. Appl. 2020, 162, 113792. [Google Scholar] [CrossRef]
- Deb, K. Multi-objective optimisation using evolutionary algorithms: An introduction. In Multi-Objective Evolutionary Optimisation for Product Design and Manufacturing; Springer: Berlin/Heidelberg, Germany, 2011; pp. 3–34. [Google Scholar]
Publisher’s Note: MDPI stays neutral with regard to jurisdictional claims in published maps and institutional affiliations. |
© 2022 by the authors. Licensee MDPI, Basel, Switzerland. This article is an open access article distributed under the terms and conditions of the Creative Commons Attribution (CC BY) license (https://creativecommons.org/licenses/by/4.0/).