
Does Individuals’ Perception of Wastewater Pollution Decrease Their Self-Rated Health? Evidence from China

 ,
, 
Abstract
1. Introduction
2. Strategy
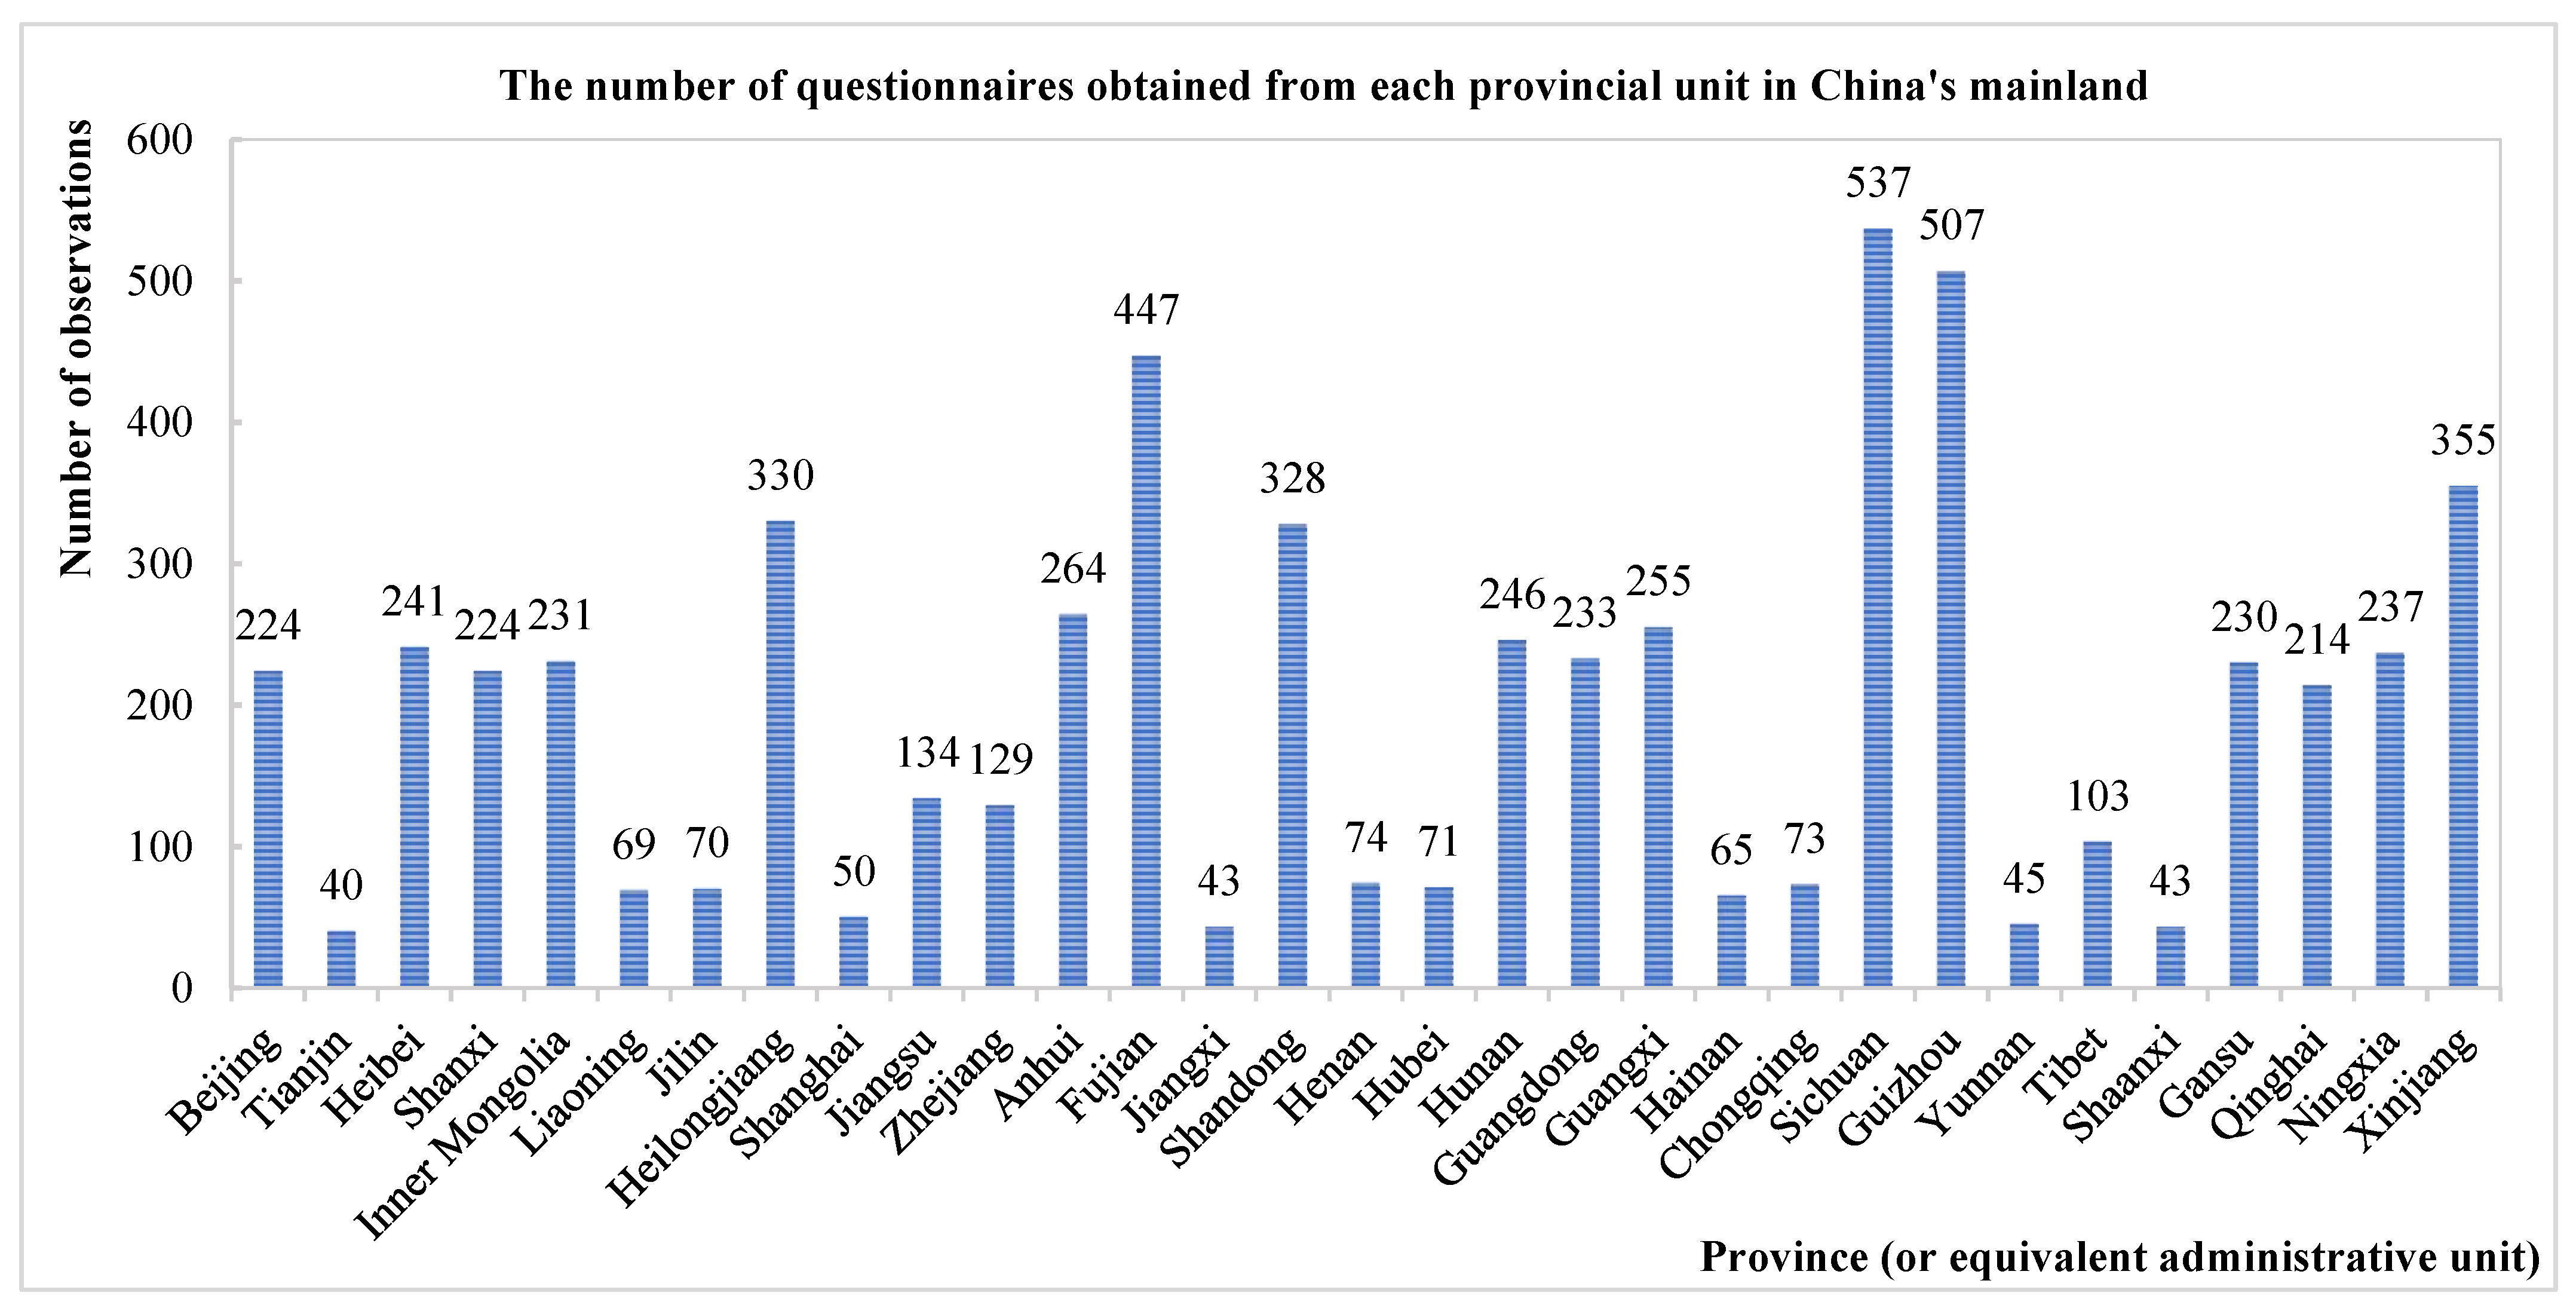
2.1. Data
2.2. Variables
2.2.1. Dependent Variables
2.2.2. Independent Variables
2.3. Methodology
3. Results
4. Discussion
5. Strengths and Limitations
6. Conclusions
Supplementary Materials
Author Contributions
Funding
Institutional Review Board Statement
Informed Consent Statement
Data Availability Statement
Acknowledgments
Conflicts of Interest
References
- Gambhir, R.; Kapoor, V.; Nirola, A.; Sohi, R.; Bansal, V. Water Pollution: Impact of Pollutants and New Promising Techniques in Purification Process. J. Hum. Ecol. 2012, 37, 103–109. [Google Scholar] [CrossRef]
- Juneja, T.; Chaudhary, A. Assessment of Water Quality and Its Effects on the Health of Residents of Jhunjhunu District, Rajasthan: A Cross Sectional Study. Acad. J. 2013, 5, 186–191. [Google Scholar]
- Sharma, J.; Srivastava, S. Quality of Potable Water and Water Borne Disease—A Review. Plant Arch. 2020, 20, 77–79. [Google Scholar]
- Halder, J.N.; Islam, M.N. Water Pollution and Its Impact on the Human Health. J. Environ. Hum. 2015, 2, 36–46. [Google Scholar] [CrossRef]
- Lu, Y.; Song, S.; Wang, R.; Liu, Z.; Meng, J.; Sweetman, A.; Jenkins, A.; Ferrier, R.C.; Li, H.; Luo, W.; et al. Impacts of Soil and Water Pollution on Food Safety and Health Risks in China. Environ. Int. 2015, 77, 5–15. [Google Scholar] [CrossRef]
- Liu, C.M.; Cao, Y.J. Water Pollution in China and Its Impact on Human Health and Main Countermeasures. Sci. Soc. 2009, 2, 16–22. [Google Scholar]
- Yang, J.J.; Liu, J. Influence and Harm of Water Pollution on Human Health. Jilin Water Resour. 2003, 11, 37–40. [Google Scholar]
- Li, W. Impact of Water Pollution on Human Health and Countermeasures. Agric. Technol. 2013, 33, 234. [Google Scholar]
- Dasgupta, P. Valuing Health Damages from Water Pollution in Urban Delhi, India: A Health Production Function Approach. Environ. Dev. Econ. 2004, 9, 83–106. [Google Scholar] [CrossRef]
- Shi, Z.; Wu, F.; Huang, H.; Sun, X.; Zhang, L. Comparing Economics, Environmental Pollution and Health Efficiency in China Int. J. Environ. Res. Public Health 2019, 16, 4827. [Google Scholar] [CrossRef]
- Shi, Z.; Huang, H.; Chiu, Y.; Zhang, B.; Zhang, C. Linkage Analysis of Water Resources, Wastewater Pollution, and Health for Regional Sustainable Development—Using Undesirable Three-stage Dynamic Data Envelopment Analysis. Environ. Sci. Pollut. Res. 2021, 28, 19325–19350. [Google Scholar] [CrossRef]
- Whelton, A.J.; McMillan, L.; Connell, M.; Kelley, K.M.; Gill, J.; White, K.D.; Gupta, R.; Dey, R.; Novy, C.L. Residential Tap Water Contamination Following the Freedom Industries Chemical Spill: Perceptions, Water Quality, and Health Impacts. Environ. Sci. Technol. 2015, 49, 813–823. [Google Scholar] [CrossRef] [PubMed]
- Chew, J.F.; Corlin, L.; Ona, F.F.; Pinto, S.; Fenyi-Baah, E.; Osei, B.; Gute, D.M. Water Source Preferences and Water Quality Perceptions among Women in the Eastern Region, Ghana: A Grounded Theory Study. Int. J. Environ. Res. Public Health 2019, 16, 3835. [Google Scholar] [CrossRef] [PubMed]
- Gevera, P.K.; Dowling, K.; Gikuma-Njuru, P.; Mouri, H. Public Knowledge and Perception of Drinking Water Quality and Its Health Implications: An Example from the Makueni County, South-Eastern Kenya. Int. J. Environ. Res. Public Health 2022, 19, 4530. [Google Scholar] [CrossRef] [PubMed]
- Slovic, P. Perception of Risk. Science 1987, 236, 280. [Google Scholar] [CrossRef]
- Eichelberger, L. Household Water Insecurity and Its Cultural Dimensions: Preliminary Results from Newtok, Alaska. Environ. Sci. Pollut. Res. 2017, 25, 32938–32951. [Google Scholar] [CrossRef]
- Seltenrich, N. Air Pollution and Suicide: Exploring a Potential Risk Factor. Environ. Health Perspect. 2018, 126, 074002. [Google Scholar]
- Zeng, J.; Jiang, M.; Yuan, M. Environmental Risk Perception, Risk Culture, and Pro-Environmental Behavior. Int. J. Environ. Res. Public Health 2020, 17, 1750. [Google Scholar] [CrossRef]
- Abir, T.; Kalimullah, N.A.; Osuagwu, U.L.; Yazdani, D.M.N.-A.; Mamun, A.A.; Husain, T.; Basak, P.; Permarupan, P.Y.; Agho, K.E. Factors Associated with the Perception of Risk and Knowledge of Contracting the SARS-CoV-2 among Adults in Bangladesh: Analysis of Online Surveys. Int. J. Environ. Res. Public Health 2020, 17, 5252. [Google Scholar]
- Yu, X.; Ho, P. Does Non-agricultural Hukou Increase Individual’s Happiness? Stat. Res. 2016, 10, 67–74. [Google Scholar]
- Zhang, M.; Sun, R.; Wang, W. Study on the Effect of Public Participation on Air Pollution Control Based on China’s Provincial Level Data. Environ. Dev. Sustain. 2021, 23, 12814–12827. [Google Scholar] [CrossRef]
- Krause, N.M.; Jay, G.M. What Do Global Self-Rated Health Items Measure? Med. Care 1994, 32, 930–942. [Google Scholar] [CrossRef] [PubMed]
- Idler, E.L.; Benyamini, Y. Self-Rated Health and Mortality: A Review of Twenty-Seven Community Studies. J. Health. Soc. Behav. 1997, 38, 21–37. [Google Scholar] [CrossRef] [PubMed]
- Idler, E.L.; Kasl, S.V. Self-Ratings of Health: Do They also Predict Change in Functional Ability? J. Gerontol. 1995, 50B, S344–S353. [Google Scholar] [CrossRef] [PubMed]
- Kananen, L.; Enroth, L.; Raitanen, J.; Jylhv, J.; Jylh, M. Self-Rated Health in Individuals with and without Disease is Associated with Multiple Biomarkers Representing Multiple Biological Domains. Sci. Rep. 2021, 11, 6139. [Google Scholar] [CrossRef] [PubMed]
- Fayers, P.M.; Sprangers, M.A. Understanding Self-Rated Health. Lancet 2002, 359, 187–188. [Google Scholar] [CrossRef]
- Silventoinen, K.; Posthuma, D.; Lahelma, E.; Rose, R.J.; Kaprio, J. Genetic and Environmental Factors Affecting Self-Rated Health from Age 16–25: A Longitudinal Study of Finnish Twins. Behav. Genet. 2006, 37, 326–333. [Google Scholar] [CrossRef]
- Hosoi, K.; Satoh, T.; Kudo, Y.; Tsunoda, M.; Kudo, Y.; Watanabe, M.; Miki, T.; Aizawa, Y. Factors Determining Self-Rated Health: Survey on Evaluation of Health Status. Kitasato Med. J. 2007, 37, 7–15. [Google Scholar]
- Mikolajczyk, R.T.; Brzoska, P.; Maier, C.; Ottova, V.; Meier, S.; Dudziak, U.; Ilieva, S.; Ansari, E.L. Factors Associated with Self-Rated Health Status in University Students: A Cross-Sectional Study in Three European Countries. BMC Public Health 2008, 8, 215. [Google Scholar] [CrossRef]
- Gao, P.; Li, H. An Analysis of Factors Influencing the Self-Rated Health of Elderly Chinese People. Open J. Soc. Sci. 2015, 03, 15–20. [Google Scholar] [CrossRef][Green Version]
- Damaskinos, P.; Koletsi-Kounari, C.; Mamai-Homata, H.; Papaioannou, W. Social, Clinical and Psychometric Factors Affecting Self-Rated Oral Health, Self-Rated Health and Wellbeing in Adults: A Cross-Sectional Survey. Health 2022, 14, 104–124. [Google Scholar] [CrossRef]
- Nada, O.; Yemi, L. New Report on Inequalities in Access to Water, Sanitation and Hygiene also Reveals More than Half of the World Does not Have Access to Safe Sanitation Services. Available online: https://www.who.int/news/item/18-06-2019-1-in-3-people-globally-do-not-have-access-to-safe-drinking-water-unicef-who (accessed on 25 May 2022).
- Geng, Y.N.; Dai, E.H.; Wang, G.L.; Jin, Z.H.; Zhang, J. Study on Temporal and Spatial Distribution, Evolution and Impact Mechanism of Water Pollution Events in China. Environ. Pollut. Control. 2022, 44, 413–419. [Google Scholar]
- Hong, D.Y.; Fan, Y.C.; Xiao, C.Y. Testing the Chinese Version of Environmental Concern Scale (CNEP): Reanalysis Based on CGSS 2010 Data. Sociol. Stud. 2014, 4, 49–72. [Google Scholar]
- Kostka, G.; Nahm, J. Central–Local Relations: Recentralization and Environmental Governance in China. China Q. 2017, 231, 567–582. [Google Scholar] [CrossRef]
- Díaz, E.; Bruce, N.; Pope, D.; Díaz, A.; Smith, K.R.; Smith-Sivertsen, T. Self-rated Health among Mayan Women Participating in a Randomised Intervention Trial Reducing Indoor Air Pollution in Guatemala. BMC Int. Health Hum. Rights 2008, 8, 1–8. [Google Scholar] [CrossRef]
- Kerry, A.; Cynthia, C.; Marisol, B.; Thelma, V. Two Mechanisms: The Role of Social Capital and Industrial Pollution Exposure in Explaining Racial Disparities in Self-rated Health. Int. J. Environ. Res. Public Health 2016, 13, 1–16. [Google Scholar]
- Li, Z.; Folmer, H.; Xue, J. Perception of Air Pollution in the Jinchuan Mining Area, China: A Structural Equation Modeling Approach. Int. J. Environ. Res. Public Health 2016, 13, 735. [Google Scholar] [CrossRef]
- Qian, X.; Xu, G.; Li, L.; Shen, Y.; He, T.; Liang, Y.; Yang, Z.; Zhou, W.W.; Xu, J. Knowledge and perceptions of air pollution in Ningbo, China. BMC Public Health 2016, 16, 1138. [Google Scholar] [CrossRef]
- Chakraborty, J.; Collins, T.W.; Grineski, S.E. Maldonado, A. Racial Differences in Perceptions of Air Pollution Health Risk: Does Environmental Exposure Matter? Int. J. Environ. Res. Public Health 2017, 14, 116. [Google Scholar] [CrossRef]
- State Council of China. Outline of “Healthy China 2030” Plan. Available online: http://www.xinhuanet.com/politics/2016-10/25/c_1119785867_2.htm (accessed on 25 March 2022).
- Bernard, H.R. Research Methods in Anthropology: Qualitative and Quantitative Approaches; Altamira: Oxford, UK, 2006; pp. 191–192. [Google Scholar]
- Ocampo, J.M. Self-rated Health: Importance of Use in Elderly Adults. Col. Médica 2010, 41, 275–289. [Google Scholar] [CrossRef]
- Koelmans, A.; Nor, M.; Hermsen, E.; Kooi, M.; Mintenig, M.; De France, J. Microplastics in Freshwaters and DWater: Critical Review and Assessment of Data Quality. Water Res. 2019, 155, 410–422. [Google Scholar] [CrossRef] [PubMed]
- Lin, H.-H.; Chen, I.-Y.; Tseng, C.-H.; Lee, Y.-S.; Lin, J.-C. A Study of the Impact of River Improvement and Greening on Public Reassurance and the Urban Well-Being Index during the COVID-19 Pandemic. Int. J. Environ. Res. Public Health 2022, 19, 3958. [Google Scholar] [CrossRef] [PubMed]
- Fu, Q.; Ren, Q. Educational Inequality under China’s Rural–urban Divide: The Hukou System and Return to Education. Environ. Pla. A 2010, 42, 592–610. [Google Scholar] [CrossRef]
- Zhang, J.; Zhang, H.W.; Zhang, C.G. Effect of Groundwater Irrigation on Soil PAHs Pollution Abatement and Soil Microbial Characteristics: A Case Study in Northeast China. Pedosphere 2010, 20, 557–567. [Google Scholar] [CrossRef]
- Yang, B.J.; Shang, J.; Yu, F.W. Difficulty, Problems and Countermeasures of Agricultural Non-point Sources Pollution Control in China. Chin. J. Eco-Agric. 2019, 27, 236–245. [Google Scholar]
- Fleisher, J.; Kay, D. Risk Perception Bias, Self-reporting of Illness, and the Validity of Reported Results in an Epidemiologic Study of Recreational Water Associated Illnesses. Mar. Pollut. Bull. 2006, 52, 264–268. [Google Scholar] [CrossRef]
- Feng, X.N.; Zhang, G.; Wang, Y. Agricultural Non-point Source Pollution Prevention Measures. Environ. Sci. Manag. 2017, 42, 89–93. [Google Scholar]
- Ahmed, A.; Shafique, I. Perception of Household in Regards to Water Pollution: An Empirical Evidence from Pakistan. Environ. Sci. Pollut. Res. 2019, 26, 8543–8551. [Google Scholar] [CrossRef]
- Brewer, N.T.; Chapman, G.B.; Gibbons, F.X.; Gerrard, M.; Mccaul, K.; Weinstein, N.D. Meta-analysis of the Relationship between Risk Perception and Health Behavior: The Example of Vaccination. Health Psychol. Off. J. Div. Health Psychol. Am. Psychol. Assoc. 2007, 26, 136–145. [Google Scholar] [CrossRef]
- Mayer, B.; Joshweseoma, L.; Sehongva, G. Environmental Risk Perceptions and Community Health: Arsenic, Air Pollution, and Threats to Traditional Values of the Hopi Tribe. J. Community Health 2019, 44, 896–902. [Google Scholar] [CrossRef]
- Yamashita, T.; Kim, G.; Liu, D.; Bardo, A.R. Associations Between Perceived Environmental Pollution and Mental Health in Middle-Aged and Older Adults in East Asia. Asia Pac. J. Public Health 2020, 33, 109–112. [Google Scholar] [CrossRef] [PubMed]
- Nriagu, J.; Udofia, E.A.; Ekong, I.; Ebuk, G. Health Risks Associated with Oil Pollution in the Niger Delta, Nigeria. Int. J. Environ. Res. Public Health 2016, 13, 346. [Google Scholar] [CrossRef] [PubMed]
- Ou, J.Y.; Peters, J.L.; Levy, J.I.; Bongiovanni, R.; Rossini, A.; Scammell, M.K. Self-rated Health and Its Association with Perceived Environmental Hazards, the Social Environment, and Cultural Stressors in an Environmental Justice Population. BMC Public Health 2018, 18, 970. [Google Scholar] [CrossRef] [PubMed]
- Jiang, Y.; Luo, H.; Yang, F. Influences of Migrant Construction Workers’ Environmental Risk Perception on Their Physical and Mental Health: Evidence from China. Int. J. Environ. Res. Public Health 2020, 17, 7424. [Google Scholar] [CrossRef] [PubMed]
- Dzhambov, A.M.; Lercher, P.; Stoyanov, D.; Petrova, N.; Novakov, S.; Dimitrova, D.D. University Students’ Self-Rated Health in Relation to Perceived Acoustic Environment during the COVID-19 Home Quarantine. Int. J. Environ. Res. Public Health 2021, 18, 2538. [Google Scholar] [CrossRef] [PubMed]
- Ding, F.; Huang, L.Y.; Wang, R.; Gao, Y.J.; Yao, J.Y.; Wang, X.Y.; Li, Q. Analysis of Monitoring Data of Water Pollution Emergencies in China from 2004 to 2015. China Public Health 2017, 33, 59–62. [Google Scholar]
- Xu, M.; Zhang, T.; Wang, D.; Zhao, Y.; Xie, Y.C.; Ma, L.K. Review and Prospect of Water Pollution Prevention and Control in China in the Past 40 Years. China Environ. Manag. 2019, 11, 65–71. [Google Scholar]
- Gu, H.; Cao, Y.; Elahi, E. Human Health Damages Related to Air Pollution in China. Environ. Sci. Pollut. Res. 2019, 26, 13115–13125. [Google Scholar] [CrossRef]
- Zhang, K.; Pei, J.P.; Wang, S.; Karlis, R.; Yu, X. Life Satisfaction in China, 2010-2018: Trends and Unique Determinants. Appl. Res. Qual. Life, 2022; in press. [Google Scholar] [CrossRef]
- Fu, S.; Viard, V.B.; Zhang, P. Air Pollution and Manufacturing Firm Productivity: Nationwide Estimates for China. SSRN Work. Pap. 2018, 131, 2956505. [Google Scholar] [CrossRef]
- Covert, H.H.; Sherman, M.; Le, D.; Lichtveld, M.Y. Environmental Health Risk Relationships, Responsibility, and Sources of Information among Vietnamese Americans in Coastal Mississippi. Health Risk Soc. 2020, 22, 362–376. [Google Scholar] [CrossRef] [PubMed]
- Merkel, L.; Bicking, C.; Sekhar, D.L. Parents’ Perceptions of Water Safety and Quality. J. Community Health 2011, 37, 195–201. [Google Scholar] [CrossRef] [PubMed]
- Ford, L.; Waldner, C.; Sanchez, J.; Bharadwaj, L. Risk Perception and Human Health Risk in Rural Communities Consuming Unregulated Well Water in Saskatchewan, Canada. Risk Anal. 2019, 39, 2559–2575. [Google Scholar] [CrossRef] [PubMed]
- Caputo, A.; Tomai, M.; Lai, C.; Desideri, A.; Pomoni, E.; Méndez, H.C.; Castellanos, B.A.; La Longa, F.; Crescimbene, M.; On Behalf of the “Agua Futura” Consortium; et al. The Perception of Water Contamination and Risky Consumption in El Salvador from a Community Clinical Psychology Perspective. Int. J. Environ. Res. Public Health 2022, 19, 1109. [Google Scholar] [CrossRef]
- Benameur, T.; Benameur, N.; Saidi, N.; Tartag, S.; Sayad, H.; Agouni, A. Predicting Factors of Public Awareness and Perception about the Quality, Safety of Drinking Water, and Pollution Incidents. Environ. Monit. Assess. 2021, 194, 1–26. [Google Scholar] [CrossRef] [PubMed]
- Kangmennaang, J.; Bisung, E.; Elliott, S.J. ‘We Are Drinking Diseases’: Perception of Water Insecurity and Emotional Distress in Urban Slums in Accra, Ghana. Int. J. Environ. Res. Public Health 2020, 17, 890. [Google Scholar] [CrossRef]
- De França Doria, M.; Pidgeon, N.F.; Hunter, P. Perception of Tap Water Risks and Quality: A Structural Equation Model Approach. Water Sci. Technol. A J. Int. Assoc. Water Pollut. Res. 2005, 52, 143–149. [Google Scholar] [CrossRef]


| Variables | Category | N | Ratio (%) |
|---|---|---|---|
| Health-present | Very Healthy | 887 | 14.51 |
| Healthy | 2818 | 46.10 | |
| General | 1446 | 23.65 | |
| Unhealthy | 472 | 7.72 | |
| Very unhealthy | 95 | 1.55 | |
| Missing value | 395 | 6.46 | |
| Health-past | Better | 1050 | 17.18 |
| Same | 3389 | 55.44 | |
| Worse | 1273 | 20.82 | |
| Missing value | 401 | 6.56 | |
| Health-peers | Better | 1178 | 19.27 |
| Same | 3812 | 62.36 | |
| Worse | 727 | 11.89 | |
| Missing value | 396 | 6.48 | |
| Fatigue | Always | 189 | 3.09 |
| Usually | 493 | 8.06 | |
| Sometimes | 1069 | 17.49 | |
| Seldom | 983 | 16.08 | |
| Never | 331 | 5.41 | |
| Missing value | 3048 | 49.86 | |
| Upset | Always | 124 | 2.03 |
| Usually | 304 | 4.97 | |
| Sometimes | 1029 | 16.83 | |
| Seldom | 1131 | 18.50 | |
| Never | 476 | 7.79 | |
| Missing value | 3049 | 49.88 | |
| Industrial | No | 3131 | 51.22 |
| Yes | 2434 | 39.82 | |
| Missing value | 548 | 8.96 | |
| Agricultural | No | 3972 | 64.98 |
| Yes | 1593 | 26.06 | |
| Missing value | 548 | 8.96 | |
| Domestic | No | 1717 | 28.09 |
| Yes | 3848 | 62.95 | |
| Missing value | 548 | 8.96 | |
| Gender | Male | 2818 | 46.10 |
| Female | 2990 | 48.91 | |
| Missing value | 305 | 4.99 | |
| Hukou | Agricultural Hukou | 2655 | 43.43 |
| Non-agricultural Hukou | 2802 | 45.84 | |
| Missing value | 656 | 10.73 | |
| Age | 0–30 | 3876 | 63.41 |
| 31–50 | 1561 | 25.54 | |
| ≥51 | 389 | 6.36 | |
| Missing value | 0 | 0 | |
| Education | Primary school and lower | 242 | 3.96 |
| Middle school | 925 | 15.13 | |
| High school | 1434 | 23.46 | |
| University (or college) | 2894 | 47.34 | |
| Master’s degree (or higher) | 348 | 5.69 | |
| Missing value | 0 | 0 |
| Health-present | Very Healthy | Healthy | General | Unhealthy | Very Unhealthy | |
| 15.24 | 49.34 | 25.40 | 8.30 | 1.71 | ||
| Industrial | Yes | 14.06 | 48.00 | 26.80 | 9.07 | 2.06 |
| No | 16.16 | 50.38 | 24.30 | 7.70 | 1.44 | |
| Agricultural | Yes | 15.69 | 47.39 | 25.27 | 9.14 | 2.52 |
| No | 15.07 | 50.13 | 25.46 | 7.96 | 1.39 | |
| Domestic | Yes | 14.61 | 50.14 | 25.29 | 8.36 | 1.59 |
| No | 16.67 | 47.54 | 25.65 | 8.16 | 2.00 | |
| Health-past | Better | Same | Worse | |||
| 18.33 | 59.22 | 22.45 | ||||
| Industrial | Yes | 17.41 | 57.01 | 25.58 | ||
| No | 19.05 | 60.94 | 20.01 | |||
| Agricultural | Yes | 19.50 | 59.56 | 20.95 | ||
| No | 17.86 | 59.08 | 23.05 | |||
| Domestic | Yes | 18.02 | 59.17 | 22.82 | ||
| No | 19.04 | 59.34 | 21.62 | |||
| Health-peers | Better | Same | Worse | |||
| 20.43 | 66.88 | 12.69 | ||||
| Industrial | Yes | 20.54 | 65.68 | 13.78 | ||
| No | 20.34 | 67.82 | 11.84 | |||
| Agricultural | Yes | 21.06 | 66.14 | 12.80 | ||
| No | 20.18 | 67.18 | 12.64 | |||
| Domestic | Yes | 19.74 | 66.77 | 13.49 | ||
| No | 21.99 | 67.14 | 10.88 | |||
| Fatigue | Always | Usually | Sometimes | Seldom | Never | |
| 6.05 | 16.07 | 35.12 | 32.04 | 10.72 | ||
| Industrial | Yes | 7.09 | 16.19 | 36.05 | 31.04 | 9.63 |
| No | 4.94 | 15.95 | 34.12 | 33.12 | 11.87 | |
| Agricultural | Yes | 5.52 | 17.17 | 35.41 | 31.45 | 10.44 |
| No | 6.26 | 15.63 | 35.00 | 32.28 | 10.83 | |
| Domestic | Yes | 5.55 | 16.40 | 34.34 | 33.21 | 10.49 |
| No | 7.07 | 15.40 | 36.71 | 29.64 | 11.18 | |
| Upset | Always | Usually | Sometimes | Seldom | Never | |
| 3.91 | 9.79 | 33.71 | 37.21 | 15.39 | ||
| Industrial | Yes | 4.42 | 9.58 | 35.10 | 35.23 | 15.67 |
| No | 3.36 | 10.01 | 32.24 | 39.31 | 15.08 | |
| Agricultural | Yes | 3.96 | 11.28 | 33.49 | 36.25 | 15.01 |
| No | 3.89 | 9.18 | 33.80 | 37.59 | 15.54 | |
| Domestic | Yes | 3.19 | 9.62 | 33.38 | 39.51 | 14.30 |
| No | 5.38 | 10.13 | 34.39 | 32.49 | 17.62 | |
| Variable | Category | Model 1 Health-Present | Model 2 Health-Past | Model 3 Health-Peers | |||
|---|---|---|---|---|---|---|---|
| OR (95% CI) | p | OR (95% CI) | p | OR (95% CI) | p | ||
| Industrial (wastewater) | 1.26 (1.12–1.42) | <0.001 | 1.23 (1.06–1.42) | 0.005 | 1.18 (1.05–1.32) | 0.006 | |
| Agricultural (wastewater) | 1.08 (0.93–1.26) | 0.334 | 0.92 (0.81–1.04) | 0.165 | 0.97 (0.81–1.17) | 0.783 | |
| Domestic (wastewater) | 1.21 (1.04–1.41) | 0.012 | 1.17 (1.01–1.35) | 0.034 | 1.33 (1.14–1.55) | 0.000 | |
| Gender | Female | 0.98 (0.85–1.14) | 0.816 | 1.27 (1.10–1.48) | 0.001 | 1.28 (1.09–1.50) | 0.002 |
| Hukou | Non-Agricultural | 1.61 (0.63–4.11) | 0.319 | 1.18 (0.41–3.39) | 0.761 | 2.89 (1.16–7.20) | 0.022 |
| Age | 31–50 | 1.40 (1.18–1.68) | <0.001 | 1.22 (1.00–1.49) | 0.056 | 1.14 (0.91–1.43) | 0.245 |
| ≥51 | 1.35 (1.06–1.72) | 0.015 | 1.12 (0.96–1.32) | 0.154 | 0.87 (0.63–1.19) | 0.371 | |
| Education | Middle school | 0.85 (0.71–1.01) | 0.067 | 0.94 (0.68–1.31) | 0.719 | 0.85 (0.67–1.08) | 0.174 |
| High school | 0.77 (0.61–0.97) | 0.025 | 0.88 (0.59–1.31) | 0.522 | 0.70 (0.54–0.91) | 0.007 | |
| University | 0.76 (0.61–0.97) | 0.027 | 1.08 (0.73–1.60) | 0.700 | 0.66 (0.51–0.86) | 0.002 | |
| Master’s and higher | 0.68 (0.52–0.88) | 0.004 | 1.08 (0.67–1.75) | 0.747 | 0.62 (0.45–0.85) | 0.003 | |
| Income | Local | 0.70 (0.25–1.93) | 0.489 | 0.79 (0.25–2.47) | 0.682 | 0.30 (0.11–0.84) | 0.003 |
| FE | Province | Yes | Yes | Yes | |||
| Cluster | Province | Yes | Yes | Yes | |||
| Variable | Category | Model 4 Fatigue | Model 5 Upset | ||
|---|---|---|---|---|---|
| OR (95% CI) | p | OR (95% CI) | p | ||
| Industrial (wastewater) | 0.78 (0.68–0.90) | 0.001 | 0.82 (0.73–0.93) | 0.001 | |
| Agricultural (wastewater) | 0.93 (0.78–1.11) | 0.417 | 0.97 (0.82–1.15) | 0.730 | |
| Domestic (wastewater) | 1.08 (0.93–1.24) | 0.306 | 1.09 (0.91–1.31) | 0.349 | |
| Gender | Female | 1.08 (0.93–1.25) | 0.306 | 1.15 (0.97–1.35) | 0.103 |
| Hukou | Non-Agricultural | 1.25 (0.35–4.44) | 0.731 | 1.19 (0.36–3.88) | 0.777 |
| Age | 31–50 | 1.02 (0.81–1.29) | 0.845 | 1.24 (1.01–1.53) | 0.044 |
| ≥51 | 2.02 (1.43–2.83) | <0.001 | 1.66 (1.13–2.43) | 0.010 | |
| Education | Middle school | 0.81 (0.58–1.13) | 0.219 | 0.86 (0.59–1.25) | 0.415 |
| High school | 0.90 (0.59–1.37) | 0.631 | 0.84 (0.49–1.44) | 0.538 | |
| University | 1.18 (0.80–1.75) | 0.399 | 1.10 (0.68–1.78) | 0.695 | |
| Master’s and higher | 1.29 (0.82–2.02) | 0.271 | 1.19 (0.73–1.96) | 0.483 | |
| Income | Local | 0.65 (0.15–2.87) | 0.572 | 0.76 (0.20–2.91) | 0.691 |
| FE | Province | Yes | Yes | ||
| Cluster | Province | Yes | Yes | ||
| Continent | Country | Authors | Main Point |
|---|---|---|---|
| America | USA | Covert et al. (2020) [64] | Paricapants’ concerns with water quality has important role in acting on their environmental health risk. |
| USA | Merkel et al. (2012) [65] | Due to the pediatric health concerns, parents tended to worry about potential contamination of tap water. | |
| Canada | Ford et al. (2019) [66] | Households contradicted their perception and consumed water perceived as unsafe, while integration of risk perception lowered the adult incremental lifetime cancer risk. | |
| Brazil | Caputo (2022) [67] | There is a wide range of subjective perceptions and beliefs about drinking water quality and its impact on health that can diversely affect human behavior. | |
| Africa | Kenya | Gevera et al. (2022) [14] | The increased health risks associated with high salinity and high F− in drinking water in Makueni County are poorly understood by most residents. |
| Algeria | Benameur et al. (2021) [68] | The public knowledge about water pollution-related issues remains low, which affects policy maker’s actions for water contamination prevention and public health protection. | |
| Ghana | Kangmennaang et al. (2020) [69] | Participants not only hold various perceptions regarding the safety and quality of vended water but expressed emotional distresses such as discomfort, and anxiety. | |
| Europe | Portugal | De França Doria et al. (2005) [70] | Perceived water quality, which is a risk indicator, seems to be mainly a result of external information, past health problems, and water colour. |
| Asia | Pakistan | Ahmed and Shafique (2019) [51] | There is a strong connection beween the risk perception of households regarding water pollution in Pakistan and its potential effect on human health. |
| Year | Total Amount of Discharge (2011–2020) | ||||||
|---|---|---|---|---|---|---|---|
| Wastewater | COD | NH3-N | TN | TP | Petroleum | Volatile Phenol | |
| (Unit: 10,000 tons) | (Unit: 10,000 tons) | (Unit: 10,000 tons) | (Unit: 10,000 tons) | (Unit: 10,000 tons) | (Unit: tons) | (Unit: tons) | |
| 2011 | 6,591,922 | 2499.9 | 260.4 | 447.1 | 55.4 | 21,012.1 | 2430.6 |
| 2012 | 6,847,612 | 2423.7 | 253.6 | 451.4 | 48.9 | 17,493.9 | 1501.3 |
| 2013 | 6,954,433 | 2352.7 | 245.7 | 448.1 | 48.7 | 18,385.3 | 1277.3 |
| 2014 | 7,161,751 | 2294.6 | 238.5 | 456.1 | 53.5 | 16,203.6 | 1378.4 |
| 2015 | 7,353,227 | 2223.5 | 229.9 | 461.3 | 54.7 | 15,192.0 | 988.2 |
| 2016 | 7,110,954 | 658.1 | 56.8 | 123.6 | 9.0 | 11,599.4 | 272.1 |
| 2017 | 6,996,610 | 608.9 | 50.9 | 120.3 | 7.0 | 7639.3 | 244.1 |
| 2018 | —— | 584.2 | 49.4 | 120.2 | 6.4 | 7157.7 | 174.5 |
| 2019 | —— | 567.1 | 46.3 | 117.7 | 5.9 | 6293.0 | 147.1 |
| 2020 | —— | 2564.8 | 98.4 | 322.3 | 33.7 | 3734.0 | 59.8 |
| Country/Region | Maximum Permissible Limit | ||||||
| COD | NH3-N | TN | TP | Petroleum | Volatile Phenol | ||
| (Unit: mg/L) | (Unit: mg/L) | (Unit: mg/L) | (Unit: mg/L) | (Unit: mg/L) | (Unit: mg/L) | ||
| China | 120 | 25 (30) | 20 | 5 | 15 | 0.5 | |
| USA | —— | —— | 8 | 1 | —— | —— | |
| European Union | 125 | —— | 15 | 2 | —— | —— | |
| Japan | 160 (120) | —— | 120 (60) | 16 (8) | 30 | 5 | |
| Singapore | 100 | —— | —— | —— | 10 | 0.2 | |
| Malaysia | 200 | 50 | —— | 10 | 10 | —— | |
Publisher’s Note: MDPI stays neutral with regard to jurisdictional claims in published maps and institutional affiliations. |
© 2022 by the authors. Licensee MDPI, Basel, Switzerland. This article is an open access article distributed under the terms and conditions of the Creative Commons Attribution (CC BY) license (https://creativecommons.org/licenses/by/4.0/).
Share and Cite
Wang, S.; Pei, J.; Zhang, K.; Gong, D.; Rokpelnis, K.; Yang, W.; Yu, X. Does Individuals’ Perception of Wastewater Pollution Decrease Their Self-Rated Health? Evidence from China. Int. J. Environ. Res. Public Health 2022, 19, 7291. https://doi.org/10.3390/ijerph19127291
Wang S, Pei J, Zhang K, Gong D, Rokpelnis K, Yang W, Yu X. Does Individuals’ Perception of Wastewater Pollution Decrease Their Self-Rated Health? Evidence from China. International Journal of Environmental Research and Public Health. 2022; 19(12):7291. https://doi.org/10.3390/ijerph19127291
Chicago/Turabian StyleWang, Shu, Jipeng Pei, Kuo Zhang, Dawei Gong, Karlis Rokpelnis, Weicheng Yang, and Xiao Yu. 2022. "Does Individuals’ Perception of Wastewater Pollution Decrease Their Self-Rated Health? Evidence from China" International Journal of Environmental Research and Public Health 19, no. 12: 7291. https://doi.org/10.3390/ijerph19127291
APA StyleWang, S., Pei, J., Zhang, K., Gong, D., Rokpelnis, K., Yang, W., & Yu, X. (2022). Does Individuals’ Perception of Wastewater Pollution Decrease Their Self-Rated Health? Evidence from China. International Journal of Environmental Research and Public Health, 19(12), 7291. https://doi.org/10.3390/ijerph19127291