Article

How Do Environmental Regulation and Environmental Decentralization Affect Regional Green Innovation? Empirical Research from China

1
School of Management Science and Real Estate, Chongqing University, Chongqing 400044, China
2
Center for Construction Economy and Management, Chongqing University, Chongqing 400044, China
*
Author to whom correspondence should be addressed.
Int. J. Environ. Res. Public Health 2022, 19(12), 7074; https://doi.org/10.3390/ijerph19127074
Submission received: 9 May 2022 / Revised: 6 June 2022 / Accepted: 8 June 2022 / Published: 9 June 2022

Abstract

:
Green innovation is vital in transforming China’s economic development from high speed to high quality. Environmental regulation plays an important role in stimulating regional green innovation, and appropriate environmental decentralization is the institutional basis to consolidate the innovation compensation of environmental regulation. Clarifying the relationship among environmental regulation, environmental decentralization, and green innovation is of great theoretical and practical significance for regional environmental management and green innovation development. This paper incorporates environmental regulation, environmental decentralization, and regional green innovation into the same analytical framework and constructs a fixed-effects model and a threshold panel model to empirically examine the intrinsic relationship between them based on panel data of 30 Chinese provinces from 2006 to 2015. The estimation results indicate that environmental regulation has a positive impact on regional green innovation, which is greater in developed regions than in underdeveloped regions. Environmental decentralization plays a negative role in regional green innovation, with underdeveloped regions being affected to a greater extent. The impact of environmental regulation on regional green innovation shows a threshold characteristic with the change of the degree of environmental decentralization, while the green innovation utility of environmental regulation gradually decreases with the increase of the degree of environmental decentralization.

1. Introduction

China’s economic development has been soaring since its reform and opening up, creating a world-renowned growth miracle. However, the long-standing extensive and high-speed economic development model has exacerbated energy consumption and environmental pollution and become a bottleneck in limiting the green and coordinated development of the economy and society [1,2]. According to the British Petroleum World Energy Statistical Yearbook (2021), global energy consumption fell by 4.5% in 2020 compared to the previous year, creating the largest decline since the end of World War II. However, China’s consumption of fossil fuels and renewable energy had inverse growth, with natural gas use increasing by almost 7% and oil demand increasing by 220,000 bpd, making it one of the few major economies to see an increase in energy demand. Facing the growing exacerbation of both energy demand and ecological damage, it has become increasingly vocal about accelerating the transformation of the economy from high speed and extensive development to high quality and green development [3,4,5]. Served as an important driving force to improve energy utilization and mitigate environmental pollution, the green innovation has become an inevitable choice for “win-win” economic and environmental development [6,7].
The negative externality of environmental pollution and the positive externality of green innovation lead to an increase in the inertia of local enterprises to undertake environmental management and green innovation [8]. On the one hand, local enterprises pay no cost for the extraction of natural resources; on the other hand, the benefits of environmental management and green innovation undertaken by local enterprises are shared by all economic parties, while the costs are borne alone. Therefore, internalizing the externality problem is the key to incentivizing local enterprises to undertake pollution prevention and green innovation [9,10]. Serving as the primary instrument to internalize pollution externalities, the mechanism of influence of environmental regulation on regional green innovation is receiving widespread attention from scholars [11,12,13,14]. The Chinese government has also issued a series of environmental regulatory policies in recent years, such as the Environmental Protection Law of the People’s Republic of China, the Environmental Protection Tax Law of the People’s Republic of China, and the Regulations on the Administration of Emission Permits, with a view to promoting regional environmental governance and green and innovative development [15]. The core of the environmental management system lies in the allocation of authority over environmental management affairs among different levels of government, that is, the problem of environmental decentralization. This context indicates that environmental decentralization may be a key factor affecting the effect of environmental regulation on green innovation [16,17,18]. So, what is the relationship between environmental decentralization, environmental regulation, and regional green innovation? Does the environmental decentralization really weaken the green innovation effect of environmental regulation? If so, under what conditions does environmental decentralization have a dampening effect? Clarifying the above questions will not only help to optimize the environmental decentralization system, but also has important practical implications for the realization of regional environmental governance and high-quality green development.
Based on the institutional environment during China’s market economy transition period, this study explores the mechanisms of environmental regulation and environmental decentralization on regional green innovation at the regional level. There are three main contributions of this study to the literature. First, environmental regulation, environmental decentralization and regional green innovation are analyzed under the same framework. Thus, the research conclusions contribute to a more comprehensive understanding of the internal mechanisms by which environmental regulation plays a role in green innovation. Second, this study extends the theoretical extension of Porter’s hypothesis and uses a fixed-effects model to analyze the impact of various types of environmental decentralization on green innovation in different regions, providing a theoretical basis for different regions to develop differentiated environmental decentralization strategies. Finally, the moderating effect of environmental decentralization on the green innovation effect of environmental regulation is explored, and the effective range of its role is determined and tested based on the threshold model, thus contributing to the high-quality and green development of the regional economy.
The rest of the paper is organized as follows. Section 2 provides a brief literature review. Section 3 performs a mechanism analysis of environmental regulation, environmental decentralization, and regional green innovation. Section 4 explains the estimation model and data used in this study. Section 5 presents empirical results and discussion. Section 6 provides conclusions and related policy implications.

2. Literature Review

Current and expected government regulation is particularly important with regard to pushing firms to engage in green innovation [19,20], and its green innovation effect has led to a debate between the “facilitation” and “disincentive” arguments, i.e., whether the “innovation compensation” effect of environmental regulation prevails. The “promotion theory” studies the effect of environmental regulation on green innovation from a dynamic perspective, and the most central explanatory theory is the “Porter hypothesis” [21]. It suggests that under free trade and economic globalization, companies in developed countries, which have stricter environmental regulations than developing countries, are at a disadvantage in price competition. Here, firms that successfully innovate to reduce polluting emissions can reduce the burden of regulatory costs and thus compete on price favorably with other firms [22,23]. The promotion effect of environmental regulation on green innovation has been empirically tested by many scholars based on this hypothesis [24,25,26,27]. The “disincentive theory”, based on neoclassical economics, states that increasing the environmental regulation intensity will lead to an increase in the pollution control cost for producers, resulting in their reduction on green innovation inputs, thus inhibiting the development of regional green innovation [28,29]. In addition, some scholars have also suggested that the green innovation effect of environmental regulation has non-linear characteristics [30,31,32], which are influenced by factors such as government subsidies [33], R&D investment [34], industrial structure [35], and foreign investment [36].
Although the conclusions of the above studies are mixed, they are mostly based on the theoretical perspective of welfare economics, which assumes that local governments always seek to maximize social welfare. However, environmental federalism and public choice theory reject the assumption of “welfare government” and propose the assumption of “economic man” in the political market, arguing that local governments have the characteristic of maximizing their own interests [37]. The incentive incompatibility between local governments’ behavioral preferences and environmental governance goals often leads to selective enforcement of regulations [38], and environmental decentralization reforms are the main cause of local government behavioral alienation. Accordingly, plenty of studies have explored the impact mechanisms of environmental decentralization on regional green innovation. Some scholars have argued that environmental decentralization is conducive for local governments to strengthen environmental regulation and force enterprises to engage in green technological innovation, thus promoting the development of regional green innovation [39,40,41]. While others have suggested that excessive environmental decentralization can lead to strategic interactions and a “race to the bottom” in the environmental regulation behavior of local governments, weakening the incentive to internalize pollution and thus inhibiting regional green innovation [42].
There are diversity characteristics in environmental affairs management, and scholars have classified environmental decentralization into environmental administration decentralization, environmental supervision decentralization, and environmental monitoring decentralization according to their functions [43]. Different types of environmental decentralization have differential effects on green innovation in different regions [44,45,46]. Mohamed et al. used panel quantile regression to confirm the U-shaped effect of environmental decentralization on regional green growth [47]. Wu, H. et al. suggested that environmental decentralization and environmental administrative decentralization have a facilitating effect on regional green development, while environmental supervision and monitoring decentralization have a negative effect [48]. Zhang, W. et al. found that environmental decentralization promotes green technology innovation after inhibition, and in the long run, environmental decentralization in developed regions and low-emission regions is more conducive to green technology innovation [49].
Despite the increasing literature on environmental regulation, environmental decentralization, and green innovation, research in this area still has some limitations. First, the previous literature did not incorporate environmental regulation, environmental decentralization, and green innovation into the same analytical framework for theoretical and empirical research. Second, previous studies ignored the differential impact of different environmental decentralization on green innovation in different regions, which is not conducive to the development of differentiated environmental decentralization strategies. Finally, previous literature neglected the moderating effect of environmental decentralization on the green innovation effect of environmental regulation.

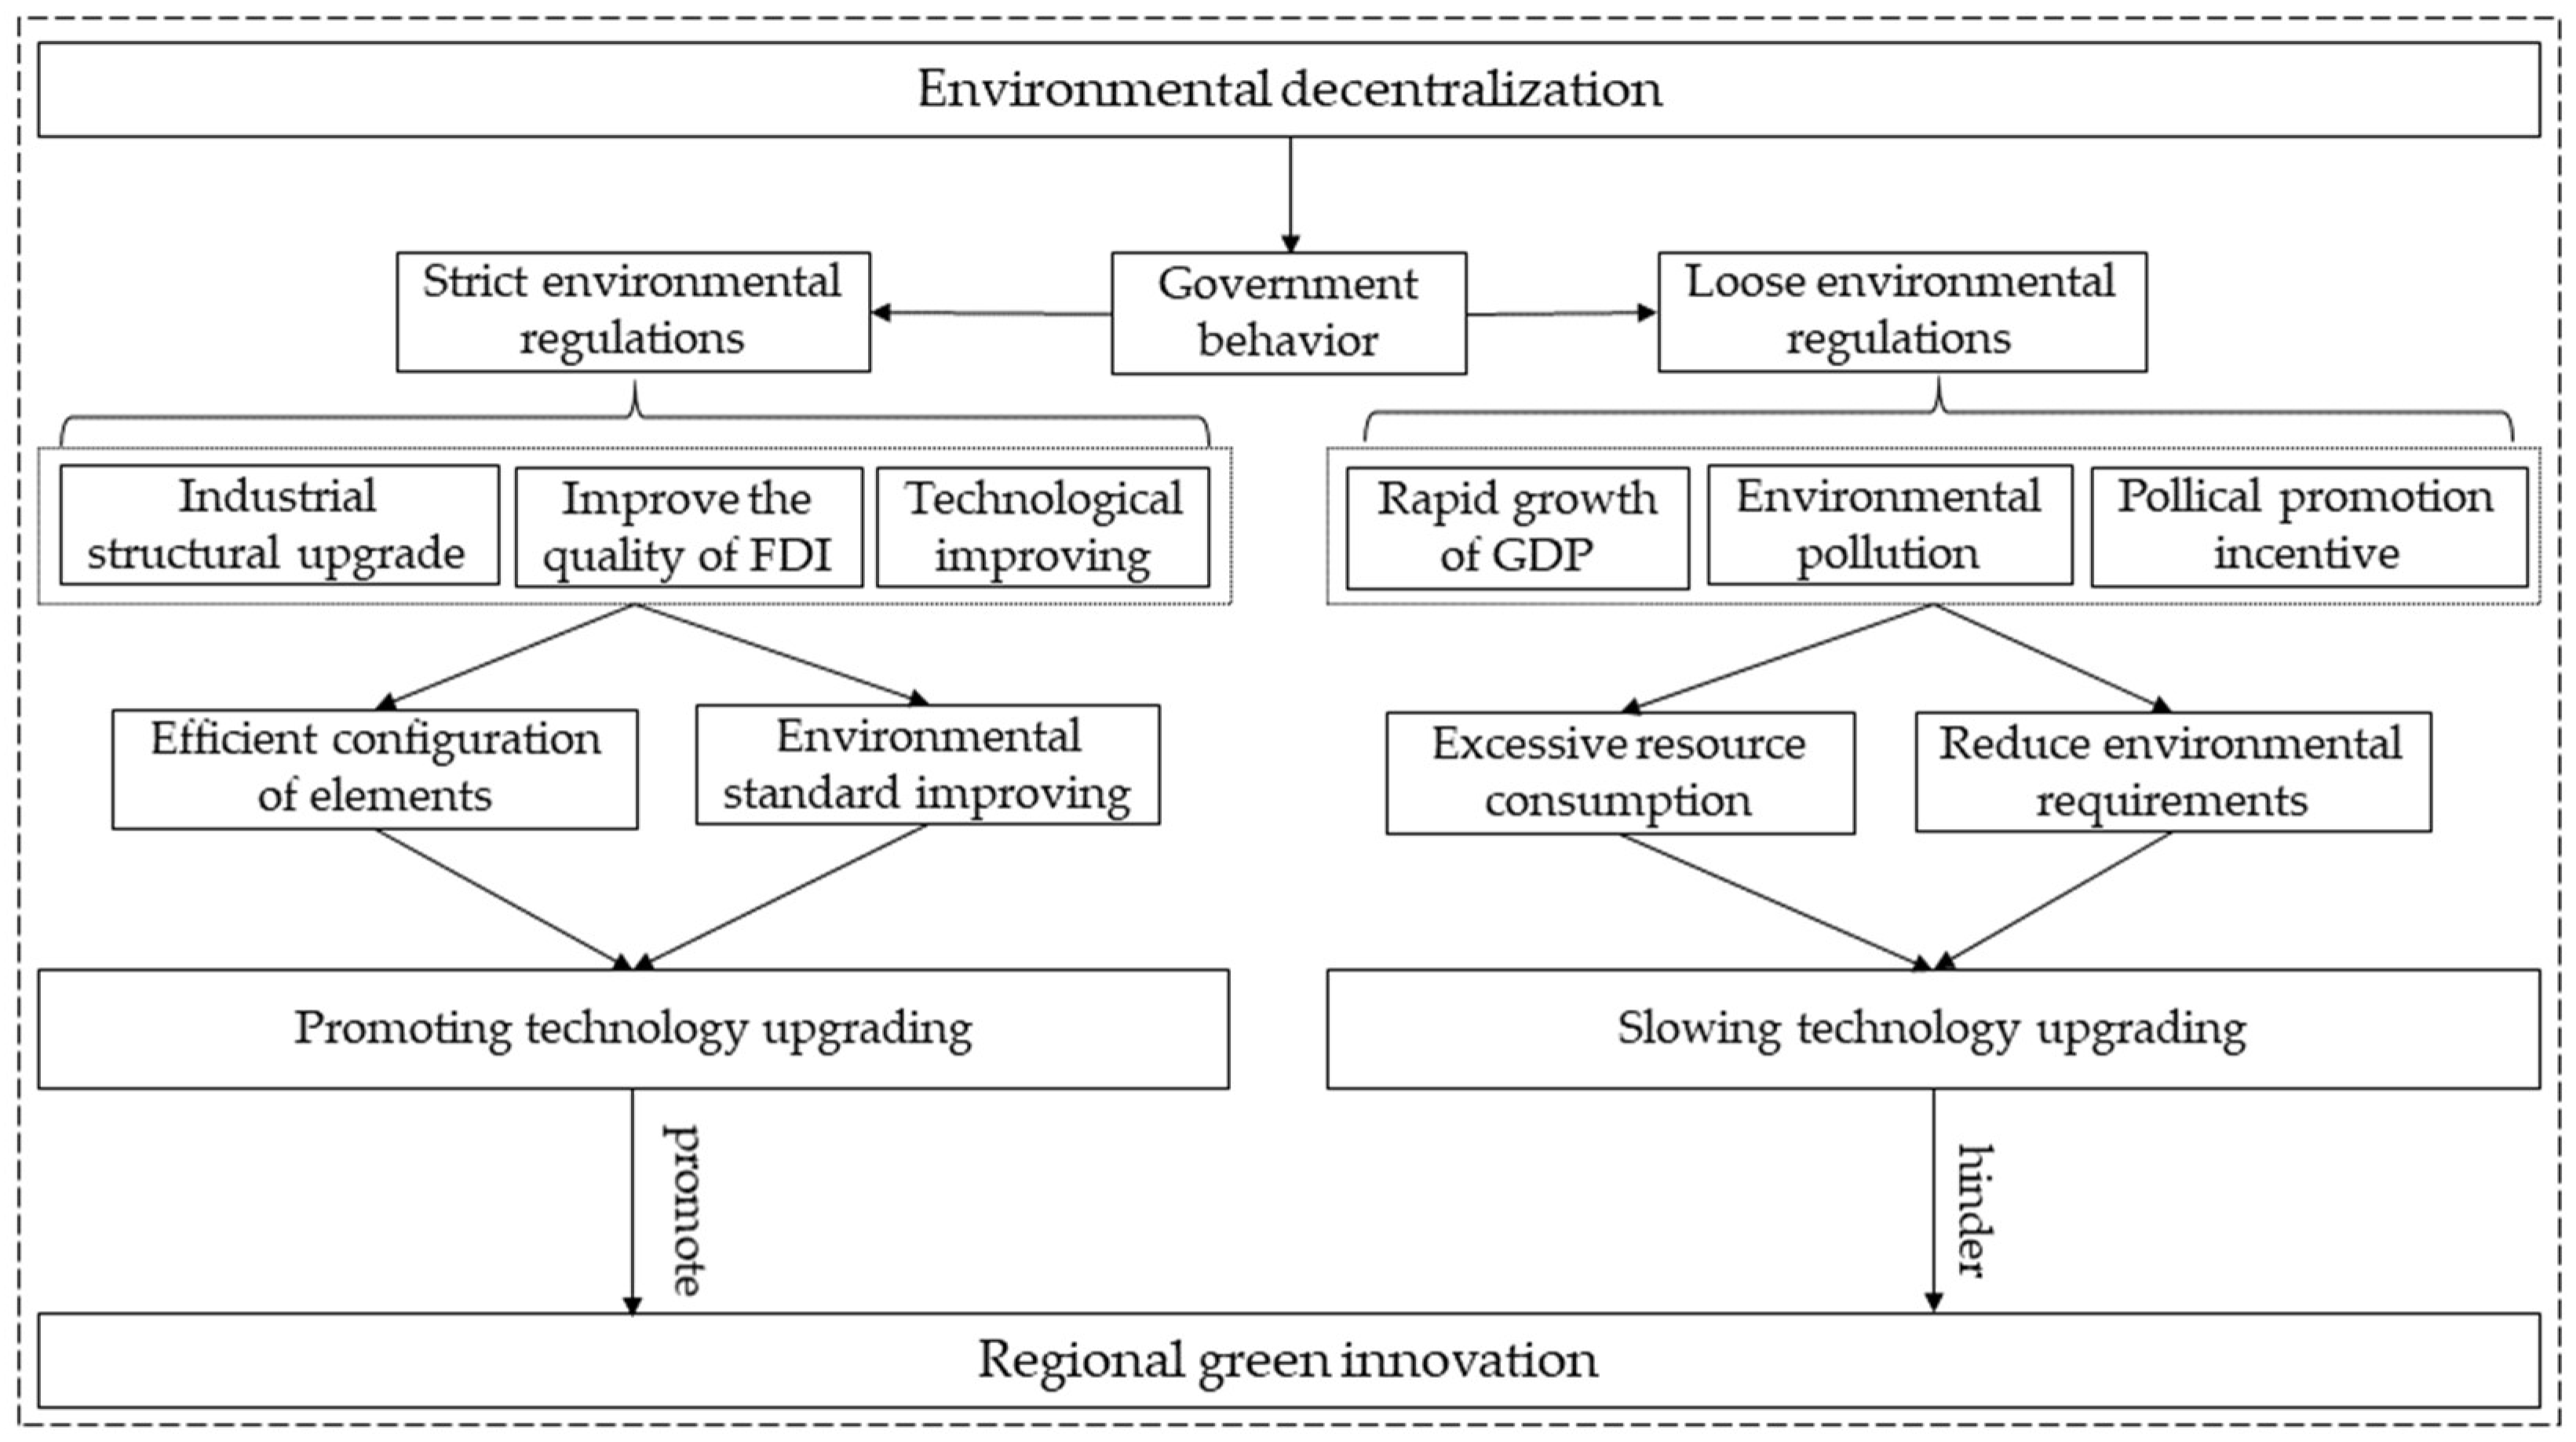
3. Mechanism Analysis and Hypothesis

3.1. Environmental Regulation and Green Innovation

As an essential tool for governments to combat environmental pollution, the impact of environmental regulation on green innovation can be divided into two aspects: macro regulation and micro autonomy. At the macro level, strict environmental regulation policies help to raise people’s awareness of green consumption as well as increase enterprises’ demand for green production, thus promoting the development of regional clean industries and realizing a regional green industrial structure. In addition, environmental regulation raises the barriers to entry for foreign investment and enhances the quality of foreign investment through market access, pollution taxes, and green product certification [50], which in turn brings advanced production management technologies to the investing region and promotes local green innovation development. At the micro level, firms are forced to pay more attention to the development of green innovation to reduce the long-term costs of pollutant emissions and improve core competitiveness, thus generating an “innovation compensation effect” and driving the development of regional green innovation. From this Hypothesis 1 is proposed:
Hypothesis 1.
Environmental regulation may promote regional green innovation.

3.2. Environmental Decentralization and Green Innovation

Fiscal decentralization theory states that the decentralization of environmental management affairs facilitates local governments to develop and implement locally adapted environmental policies, thereby improving the performance of regional environmental governance and innovation [51]. However, China’s unique government management model and GDP-focused promotion assessment mechanism have reshaped the incentives of local government officials. As the marginal value generated by productive investments outweighs the social benefits of environmental expenditures, local governments are driven by promotion incentives to pursue rapid economic growth at the cost of environmental pollution and excessive energy consumption. This unsustainable growth model leads to serious negative externalities of environmental pollution, further hindering the development of regional green innovation.
Market fragmentation due to environmental decentralization may trigger distortions in resource allocation and homogeneous industrial structure, which makes economies of scale difficult to achieve and leads to energy efficiency losses [52]. In addition, local protectionism induced by environmental decentralization inhibits the development of regional green innovation. First, local protectionism discourages the free flow of production factors and the introduction of technology-intensive foreign investment, which in turn hinders the rational allocation of resources and the diffusion of technology [53]. Second, the existence of local protectionism may affect the functioning of market mechanisms and lead to the slow development of high-productivity, low-energy consuming industries. Thus, Hypotheses 2a and 2b are proposed:
Hypothesis 2a.
Environmental decentralization may hinder regional green innovation.
Hypothesis 2b.
The inhibitory effect of Environmental decentralization in underdeveloped regions may be larger due to the local protectionism.

3.3. Environmental Regulation, Environmental Decentralization and Green Innovation

Environmental decentralization reflects the delegated relationship of environmental affairs between central and local governments. Local governments are the main agent carrying out environmental regulation functions, and their behavior under the environmental decentralization system is the decisive factor influencing the effectiveness of environmental regulation, and its specific mechanism of action is shown in Figure 1. Remarkable differences can be found among the impacts of different types of environmental decentralization on environmental regulation effect. Environmental monitoring decentralization can give full play to the information advantages of local governments, enabling them to formulate and implement appropriate environmental regulation policies, which helps to achieve the effective allocation of regional resource factors by promoting industrial structure upgrading and improving foreign investment quality, thus ultimately promoting green innovation development. Environmental administration and supervision decentralization gives local governments more power to determine the level of environmental regulation. In pursuit of sustained and stable economic growth, local government officials may gradually relax the level of environmental regulations on highly polluting and profitable tax enterprises [54]. Under this context, energy waste and environmental pollution have become the norm for companies to reduce operating costs and increase production revenue. The incentive for enterprises to engage in green innovation will gradually weaken, leading to the development of regional green innovation being hindered. Hypotheses 3a and 3b are proposed:
Hypothesis 3a.
Environmental administration and supervision decentralization may weaken the green effect of environmental regulation.
Hypothesis 3b.
Environmental monitoring decentralization may strengthen the green effect of environmental regulation.

4. Research Design

4.1. Model Construction

4.1.1. Benchmark Model Construction

Fixed-effects and random-effects models are suitable for analyzing panel data [55,56]. In order to investigate the impact mechanism of environmental regulation and environmental decentralization on regional green innovation, this study selects fixed-effects model based on the Hausman test results. Model (1) was constructed to test the relationship between control variables and regional green innovation, and model (2) was constructed to test the relationship between environmental regulation and regional green innovation. Model (3) was constructed to test the relationship between environmental decentralization and regional green innovation.
G I i , t = α 0 + α 1 C o n t r o l i , t + μ i + δ t + ε i , t
G I i , t = α 0 + α 1 E R i , t + α 2 C o n t r o l i , t + μ i + δ t + ε i , t
G I i , t = α 0 + α 1 E D i , t + α 2 C o n t r o l i , t + μ i + δ t + ε i , t
where G I i , t is the logarithm of the number of regional green patent applications, E R i , t is the intensity of environmental regulation, E D i , t is the intensity of environmental decentralization, C o n t r o l i , t are a set of control variables, α 0 is the constant term, α 1 and α 2 are the correlation coefficients of the explanatory and control variables respectively, μ i and δ t are the dummy variables for individual fixed effects and time fixed effects respectively, and ε i , t is a random disturbance term.

4.1.2. Moderating Effect Model Construction

Environmental decentralization is introduced as a moderating variable in the baseline model to test whether the relationship between environmental regulation and regional green innovation differs according to the intensity of environmental decentralization. To this end, model (4) was constructed by adding environmental decentralization ( E D i , t ) and the cross product of environmental regulation and environmental decentralization ( E D i , t × E R i , t ) to model (2) to test the moderating role of environmental decentralization in environmental regulation and regional green innovation.
G I i , t = α 0 + α 1 E R i , t + α 2 E D i , t + α 3 E D i , t × E R i , t + α 4 C o n t r o l i , t + μ i + δ t + ε i , t
On the basis of Equation (2), a double-threshold regression model with regional green innovation as the explained variable, environmental regulation as the core explanatory variable, and environmental decentralization as the threshold variable is developed in this paper, to explore the non-linear effects of environmental regulation on regional green innovation when environmental decentralization is at different thresholds. The model is set out as follows:
G I i , t = α 0 + α 1 E R i , t I ( E D i , t γ 1 ) + α 2 E R i , t I ( γ 1 E D i , t γ 2 ) + α 3 E R i , t I ( E D i , t γ 2 ) + β m C o n t r o l i , t + ε i , t
where i and t denote province and time, respectively; I(.) is the indicator function; E D i , t is the threshold variable; γ 1 , γ 2 are the thresholds to be estimated; α 1 , α 2 , α 3 are the impact coefficients of the explanatory variables in different intervals; β m is the parameter to be estimated for each control variable, and ε i , t is the random disturbance term.

4.2. Variable Selection

4.2.1. Green Innovation (GI)

There are three main types of methods for measuring green innovation: first, adopting data envelopment analysis (DEA) and the principal component method to measure green innovation efficiency [57,58], second, using green patent statistics to measure [59,60,61], and third, measuring from both process and product levels [62,63]. Since green patent statistics mainly reflect the innovation in resource conservation, energy efficiency, pollution prevention and control, and cleaner production, they can more intuitively measure the overall level and scale of green innovation activities in a region compared to other analysis methods [64]. This study takes reference from Wurlod et al. and adopts the logarithm of green patent applications to characterize green innovation.

4.2.2. Environmental Decentralization (ED)

Environmental decentralization is a mechanism for the division of environmental management and affairs based on the separation of powers. Qi et al. [65] have pointed out that institutions and staffing are the carriers through which governments realize their public services and functions, and the staffing of environmental agencies at different levels of government reflects, to a certain extent, the distribution of power over environmental affairs at different levels of government. Moreover, the changes of the staff proportion in environmental agencies at different levels of government better reflect changes in the environmental management system. Therefore, this study draws on the indicator selection method of Ran et al. [66] and utilizes the staff distribution characteristics of environmental protection departments at different levels of government to portray environmental decentralization intensity. The specific environmental decentralization measurement formula is as follows:
E D i , t = [ L e p i , t / P o p i , t N e p t / P o p t ] × [ 1 ( G D P i , t / G D P t ) ]
where L e p i , t , P o p i , t and G D P i , t denote the number of personnel in the environmental protection system, the size of the regional population, and the gross domestic product in province i and in year t, respectively. and N e p t , P o p t , and G D P t denote the number of personnel in the national environmental protection system, the size of the national population, and the national gross domestic product in year t, respectively. The environmental decentralization indicators are effectively deflated by adding the economic scale reduction factor [ 1 ( G D P i , t / G D P t ) ]. In addition, this study further subdivides environmental decentralization into environmental administrative decentralization, environmental supervision decentralization, and environmental monitoring decentralization, and the three subdivided indicators are measured similar to Equation (5) by simply replacing the number of personnel in the environmental protection system with the corresponding number of personnel in the subdivided indicators.

4.2.3. Environmental Regulation (ER)

At present, there are several approaches to measuring environmental regulation in academic circles: The first is the single indicator approach, which classifies environmental regulation into command-and-control, market-incentive, and public-participation types according to different participants and measures them by indicators such as the number of environmental administrative penalties, the amount of pollution control, and the number of environmental petitions, respectively [67,68]. The second is the composite indicator method, which uses the entropy method or linear weighting method to construct environmental regulation intensity indicators to reflect the regional environmental regulation level [69,70]. However, single indicators do not provide a comprehensive measure of the overall intensity of environmental regulation and there is a large margin of error in the statistical caliber of the composite indicator or in the process of normalization and calculation. Therefore, this study draws on the approach of Kheder, S. B. et al. [71] to measure the intensity of regional environmental regulation by using GDP/energy, where GDP represents regional gross domestic product and is deflated using 2006 as the base period, energy represents total regional energy consumption. This indicator measures the true effect of a range of environmental laws and regulations.

4.2.4. Control Variables

Regions with high level of economic development tend to have strong innovation capacity. Urbanization and industrial structure upgrading accelerate the concentration of capital and technology in the region, and foreign investment provides a source of funding for regional green innovation. In this study, with reference to relevant literature, the following indicators are selected to control for the above variables: Regional economic development (RGDP), expressed as the logarithm of GNP per capita by province and deflated using 2006 as the base period; the regional urbanization rate (UR), measured by the proportion of urban population in each province; the industrial structure (IND), expressed as the logarithm of the value added of tertiary industries in each province; and the total foreign investment (TFI), expressed as the logarithm of the total investment by foreign enterprises in each province, and deflated using 2006 as the base period.

4.3. Variables Description and Data Source

The descriptive statistics for the relevant variables in this study are shown in Table 1. The mean value of GI is 2785 and the standard deviation is 4180, which indicates that the level of green innovation varies greatly from region to region. The minimum value of GI is 14 and the maximum value is 28,049, indicating that there is regional heterogeneity in the level of green innovation, with developed regions likely to develop faster than underdeveloped regions. RGDP has the largest standard deviation among other variables, which is due to the great differences in the level of economic development of the provinces. The range of values for all variables is within the normal range, which confirms the reliability of the data.
In this study, 30 provincial administrative units (excluding Tibet and Hong Kong, Macao and Taiwan) in China from 2006–2015 were selected as the sample for examination by considering the following reasons. First, in 2006, the State Environmental Protection Administration (SEPA) established five direct inspection centers and eleven direct enforcement and supervision agencies to inspect local governments’ interference with environmental enforcement, thereby increasing the central government’s authority in environmental regulation. This has contributed to a change in the distribution of regulatory authority between central government and local governments, and to a certain extent has increased central government’s regulatory powers, especially its power to monitor and enforce the law. Second, it has been only about five years since the launch of vertical management reform of sub-provincial environmental protection agencies for monitoring and supervising in 2016. The empirical material does not yet support testing the impact of this reform on the distribution of the regulatory authority between central government and the local authorities and the impact on green innovation. Thus, selecting the data from 2006 to 2015 can better reflect the impact of China’s environmental decentralization system on green innovation, which is not only a summary of previous policies, but also provides a theoretical basis for future policy formulation. The data related to environmental decentralization come from the China Environment Yearbook, the data related to R&D investment and personnel come from the China Science and Technology Statistical Yearbook, the data related to green patents come from the CNRDS database, and the data related to other variables involved in this paper come from the China Environment Statistical Yearbook, the China Statistical Yearbook, and the China Energy Statistical Yearbook. For the problem occurring where some of the data were missing, they were smoothed out according to the trend presented by the data in this study.

5. Empirical Results and Discussion

5.1. Overall Estimated Results

This study uses Stata 16.0 to estimate Models (1), (2) and (3) by using robust standard errors, and the regression results are shown in Table 2. It can be seen that the estimated coefficient of environmental regulation is positive and passes the 1% significance level, indicating that environmental regulation has a significant positive impact on regional green innovation, and the green innovation promotion effect of environmental regulation is prominent. This is consistent with Hamamoto‘s findings [72] and validates Hypothesis 1. The estimated coefficients for environmental decentralization, environmental administrative decentralization, and environmental supervision decentralization are all significantly negative and pass the robustness test, confirming the truth of Hypothesis 2a. Comparing the coefficients of each type of environmental decentralization, it is observed that the negative effect of environmental administrative decentralization on regional green innovation is greater, with an impact coefficient of −0.147. The reason for this is that environmental administration mainly involves the formulation of relevant environmental protection plans and the approval of administrative permits. It has given local governments more power to determine the level of regional green development. Local governments may relax their requirements for green innovation to pursue high economic growth [73], thus hindering the development of regional green innovation.
By observing the regression results of other control variables, it can be seen that the estimated coefficients of the economic development (RGDP), the urbanization rate (UR), and the advanced industrial structure (IND) are all significantly positive. The increase in the level of economic development provides good material foundation for regional green innovation; rapid urbanization creates a gathering effect of labor and technical personnel [74], which provides manpower for regional green innovation; the rapid upgrading of industrial structure puts forward higher requirements for green development for local enterprises [75], thus accelerating the green innovation by local enterprises. The estimated coefficient of total foreign investment (TFI) is significantly negative, indicating that foreign investment has a suppressive effect on regional green innovation, confirming the findings of HARRISON A et al. [76]. Although foreign investment has shown a gradual increase every year, most foreign investors tend to transfer low-tech industries with high pollution and energy consumption to the host country, further deteriorating the host country’s environment and creating a “pollution paradise” effect, which is not conducive to enhancing the development of green innovation in the host country [77].

5.2. Regional Estimated Results

Due to the large differences in economic strength and policy conditions across regions in China, in order to verify whether there is regional heterogeneity in the empirical results, most previous studies have divided the classical economic regions based on the geographical location of each province, which in turn splits China into three major regions: the east, the center, and the west [78]. However, such division does not effectively reflect the economic differences among provinces. This study draws on the approach of Zhang, W. et al. [49], and uses the GDP per capita of each province in 2020 as a classification criterion, those greater than the national average are classified as developed regions, while those less than the national average are classified as underdeveloped regions. It then discusses in depth the impact of environmental decentralization on the regional heterogeneity of green innovation.
The empirical results in Table 3 show that the estimated coefficient of environmental regulation is significantly positive in both developed and underdeveloped regions. Notably, the estimated coefficient is much larger in developed regions than in underdeveloped regions, indicating that the “push-back” effect of environmental regulation on green innovation is more pronounced in developed regions. It follows that compared to developed regions, underdeveloped regions have limited economic power, and when the intensity of environmental regulation increases, local governments are unable to balance the effective synergy between economic development and green innovation, thus reducing their investment in green patent research and development, resulting in slower development of green innovation. The estimated coefficient of environmental decentralization is significantly negative across regions, with a larger level in underdeveloped regions, Hypothesis 2b is accepted. The deeper reason may be that underdeveloped regions view environmental decentralization as an umbrella for economic development and tend to invest in non-green innovation areas that contribute more to GDP growth, thus curbing the development of green innovation in the region.

5.3. The Moderating Effect of Environmental Decentralization

In order to inspect whether environmental decentralization affects the regional green innovation promotion effect of environmental regulation, this study adopts Stata 16.0 to centralize the environmental regulation and environmental decentralization variables, and then substitutes them into model (4) for regression estimation; the results are shown in Table 4. The estimated coefficient of the interaction term between environmental regulation and environmental administration and supervision decentralization are significantly negative, indicating Hypothesis 3a is correct, which is similar to the findings of Lipscomb, M. et al. [79]. The interaction term between environmental monitoring decentralization and environmental regulation is significantly positive, suggesting Hypothesis 3b is not rejected. Under the increasing economic level, the technology and funding for environmental monitoring under environmental monitoring decentralization have been effectively secured, the authenticity of monitoring data has been greatly improved, and the focus of environmental regulation has been adjusted in a timely manner, thus improving the performance of regulation.

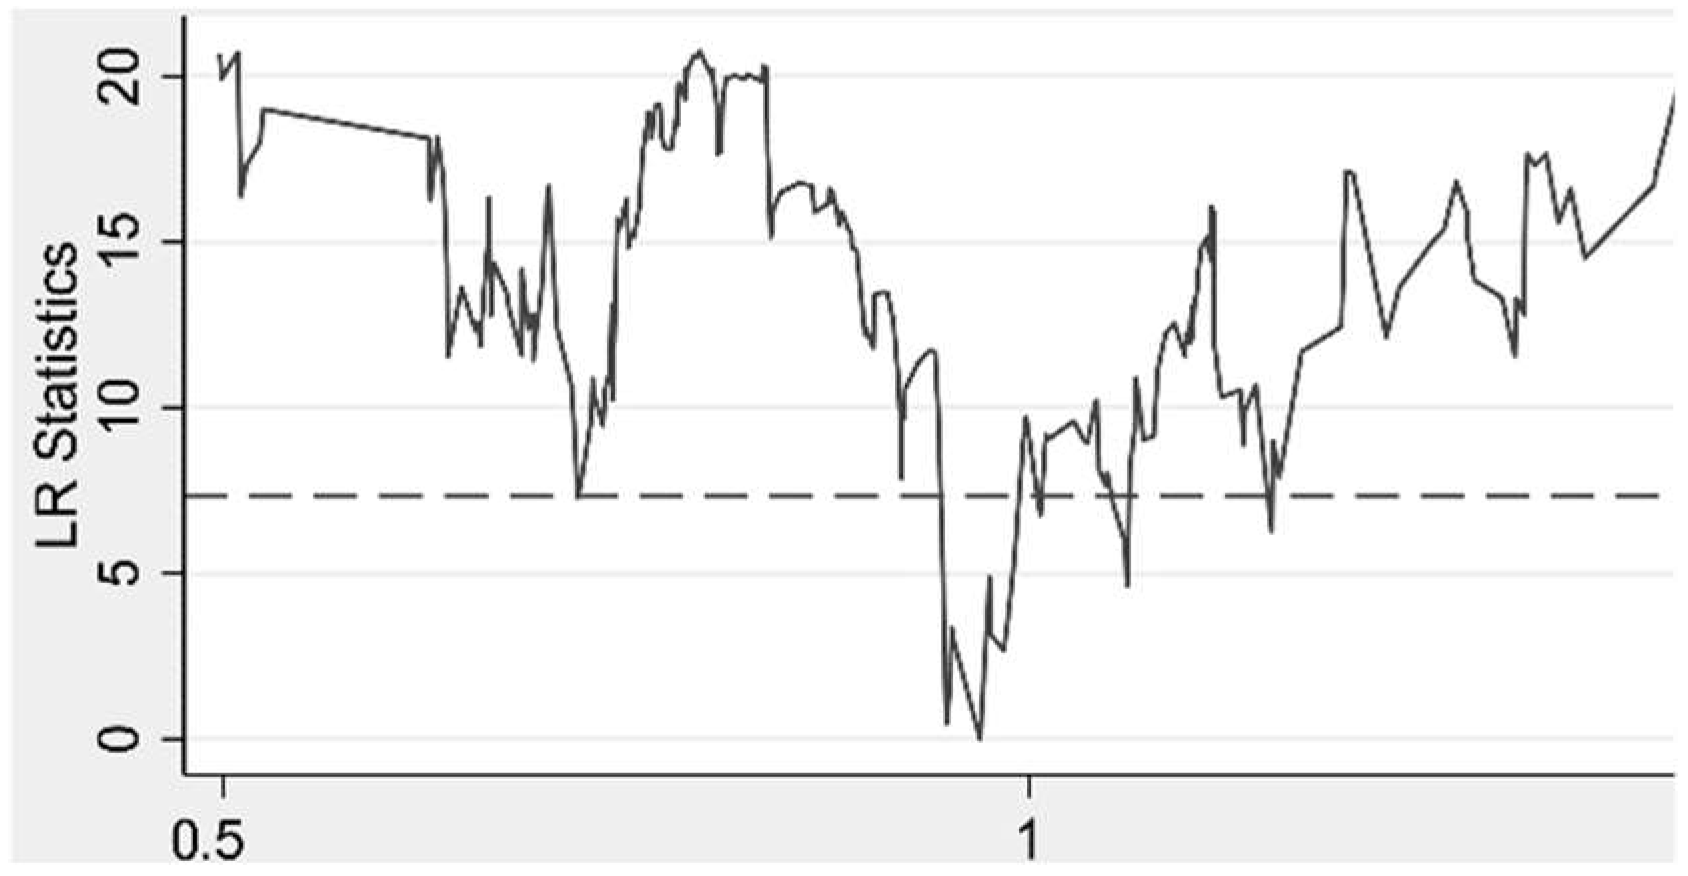
5.4. Further Analysis: Threshold Effect Test

5.4.1. Number of Thresholds

Before using the panel threshold model, the sample needs to be tested for the presence of threshold effects to determine the number of thresholds. The model is estimated, the F-test statistic is obtained, and the probability values p and threshold values are calculated using a bootstrap method with 300 replicate samples as shown in Table 5. It can be seen that the results of the double threshold test pass the significance test with environmental decentralization as the threshold variable, and the two thresholds are 0.5941 and 0.9694 respectively.

5.4.2. Threshold Regression Analysis

In order to determine whether the thresholds for environmental decentralization truly exist, the LR test was performed in this study and the results are shown in Figure 2 and Figure 3. It can be seen that both thresholds pass the LR test, i.e., both thresholds truly exist.
After the threshold values were determined, the parameters of the double threshold model were estimated according to Equation (5) and the estimation results are shown in Table 6. It can be seen that the impact of environmental regulation on green innovation indicates a nonlinear feature due to the environmental decentralization. Specifically, When ED ≤ 0.5941, the coefficient of environmental regulation on regional green innovation is 1.340, indicating that environmental regulation has a significant contribution to regional green innovation in this interval. When 0.5941 < ED ≤ 0.9694, the coefficient of environmental regulation on regional green innovation is 1.023, indicating that the environmental decentralization in this interval weakens the promotion of environmental regulation on regional green innovation to some extent. When 0.9694 < ED, the coefficient of environmental regulation on regional green innovation is 0.606, showing that excessive environmental decentralization significantly inhibits the regional green innovation effect of environmental regulation, which is similar to the findings of Yang et al. [80].
One possible reason for this finding is that when the environmental decentralization level is suitable, the decentralization of environmental power could help local governments to exert their information advantages and coordinate the allocation of funds and personnel in the process of environmental governance, thereby enhancing the green innovation of local enterprises [81,82]. When the environmental decentralization level is higher than the second threshold (0.9694), local governments have greater randomness in self-evaluation of regional environmental conditions [83,84]. To some extent, it provides an opportunity for collusion between local government and enterprises, which may reduce the enterprises’ incentives of technological innovation, energy saving, and emission reduction [85].

6. Conclusions and Policy Recommendations

Building a scientific and rational modern environmental management system is an institutional guarantee to achieve green development. How environmental management affairs are appropriately divided between the central and local governments closely affects the efficiency and quality of regional green innovation. Therefore, this paper analyzed environmental regulation, environmental decentralization, and regional green innovation under the same framework by constructing a fixed-effects model and a panel threshold model. The research draws the following conclusions. First, environmental regulation significantly promotes regional green innovation while environmental decentralization exacerbated regional innovation, and their effect coefficients are 1.112 and −0.761 respectively. Second, the impact of environmental regulation and environmental decentralization on green innovation is heterogeneous, with the level of economic development and the type of environmental decentralization being key factors influencing the role of environmental regulation. The result confirms that green innovation utility of environmental regulation increases with the improvement of regional economic level [86]. Finally, excessive environmental decentralization inhibits green innovation by hindering the effective implementation of environmental regulatory policies, and the biggest threshold of environmental decentralization is 0.9694. According to the conclusions, some policy implications can be obtained as follows.
First, the central government can appropriately increase the intensity of environmental regulations to increase the motivation of local governments to engage in green innovation. Currently, Chinese enterprises have the strength to withstand high standards of environmental regulations. The government should not only increase emission charges for heavy polluters, but also actively encourage enterprises to engage in green innovation activities such as clean technology research and development.
Second, under China’s environmental decentralization system, the local government’s attitude of sacrificing the environment for the economy is rooted in the imperfection of the performance appraisal system. Therefore, it is necessary to accelerate improving the good performance evaluation system, combining economic and environmental indicators. The setting of performance evaluation indicators should coordinate the relationship between economic growth and environmental governance. The government cannot sacrifice the environment for rapid growth, nor can it excessively pursue environmental quality at an economical cost [87].
Third, differentiated environmental decentralization strategies need to be developed for different regions. Since developed regions have stronger economic and technological strength, local environmental autonomy can be moderately relaxed to make full use of the information advantages of local governments so as to improve regional green innovation performance. For underdeveloped regions, the central government should reduce the environmental administrative and monitoring powers of local governments, while increasing environmental assessment and supervision, as well as setting environmental bottom-line standards and incentives to motivate local governments to conduct green innovation.
Although this study for the first time quantitatively investigates the relationship between environmental regulation, environmental decentralization, and regional green innovation, there are still some limitations, which could also be possible future research directions. For instance, the provincial panel data utilized in this study is not large due to the data availability, which may be prone to some small sample size bias. Moreover, the effect of environmental decentralization is closely related to the game and competition between local governments. In particular, environmental governance in neighboring areas may affect one another, thus the spatial spillover of environmental effects of environmental decentralization caused by local competition can be considered in future research.

Author Contributions

Conceptualization, J.T. and S.L.; methodology, J.T. and S.L.; software, J.T.; formal analysis, J.T. and S.L.; writing—original draft preparation, J.T.; writing—review and editing, S.L. All authors have read and agreed to the published version of the manuscript.

Funding

This research was funded by Fundamental Research Funds for the Central Universities, China (Project No. 2019CDJSK03XK20), and jointly supported by the Fundamental Research Funds for the Central Universities (Project No. 2017CDJXY, Project No. 2020CDJSK03PT08).

Institutional Review Board Statement

Not applicable.

Informed Consent Statement

Not applicable.

Data Availability Statement

The data presented in this study are available on request from the corresponding author. The data are not publicly available due to data management.

Conflicts of Interest

The authors declare no conflict of interest.

References

  1. Nguyen, D.K.; Huynh, T.; Nasir, M.A. Carbon emissions determinants and forecasting: Evidence from G6 countries. J. Environ. Manag. 2021, 285, 111988. [Google Scholar] [CrossRef] [PubMed]
  2. Zhao, J.; Zhao, Z.; Zhang, H. The impact of growth, energy and financial development on environmental pollution in China: New evidence from a spatial econometric analysis. Energy Econ. 2021, 93, 104506. [Google Scholar] [CrossRef]
  3. Li, J.; Lin, B. Ecological total-factor energy efficiency of China’s heavy and light industries: Which performs better? Renew. Sustain. Energy Rev. 2017, 72, 83–94. [Google Scholar] [CrossRef]
  4. Li, X.; Lu, Y.; Huang, R. Whether foreign direct investment can promote high-quality economic development under environmental regulation: Evidence from the Yangtze River Economic Belt, China. Environ. Sci. Pollut. Res. 2021, 28, 21674–21683. [Google Scholar] [CrossRef]
  5. Yu, X.; Wang, P. Economic effects analysis of environmental regulation policy in the process of industrial structure upgrading: Evidence from Chinese provincial panel data. Sci. Total Environ. 2021, 753, 142004. [Google Scholar] [CrossRef]
  6. Wang, M.; Li, Y.; Li, J.; Wang, Z. Green process innovation, green product innovation and its economic performance improvement paths: A survey and structural model. J. Environ. Manag. 2021, 297, 142004. [Google Scholar] [CrossRef]
  7. Song, W.; Yu, H. Green Innovation Strategy and Green Innovation: The Roles of Green Creativity and Green Organizational Identity. Corp. Soc. Responsib. Environ. Manag. 2018, 25, 135–150. [Google Scholar] [CrossRef]
  8. Wang, Y.; Woodward, R.T.; Liu, J.Y. The Impact of Exogenous Pollution on Green Innovation. Environ. Resour. Econ. 2022, 81, 1–24. [Google Scholar] [CrossRef]
  9. Harford, J.D. Firm behavior under imperfectly enforceable pollution standards and taxes. J. Environ. Econ. Manag. 1978, 5, 26–43. [Google Scholar] [CrossRef]
  10. Chu, H.; Lai, C. Abatement R&D, market imperfections, and environmental policy in an endogenous growth model. J. Econ. Dyn. Contro 2014, 41, 20–37. [Google Scholar]
  11. Costantini, V.; Crespi, F. Environmental regulation and the export dynamics of energy technologies. Ecol. Econ. 2008, 66, 447–460. [Google Scholar]
  12. Li, B.; Wu, S. Effects of local and civil environmental regulation on green total factor productivity in China: A spatial Durbin econometric analysis. J. Clean. Prod. 2016, 153, 342–353. [Google Scholar] [CrossRef]
  13. Zhang, J.; Liang, G.; Feng, T.; Yuan CJiang, W. Green innovation to respond to environmental regulation: How external knowledge adoption and green absorptive capacity matter? Bus. Strategy Environ. 2020, 29, 39–53. [Google Scholar] [CrossRef]
  14. Zhang, J.; Kang, L.; Li, H.; Ballesteros-Pérez, P.; Skitmore, M.; Zuo, J. The Impact of Environmental Regulations on Urban Green Innovation Efficiency: The Case of Xi’an. Sustain. Cities Soc. 2020, 57, 102–123. [Google Scholar] [CrossRef]
  15. Sun, C.; Zhan, Y.; Du, G. Can value-added tax incentives of new energy industry increase firm’s profitability? Evidence from financial data of China’s listed companies. Energy Econ. 2020, 86, 104654. [Google Scholar] [CrossRef]
  16. Silva, E.; Caplan, A.J. Transboundary Pollution Control in Federal Systems. J. Environ. Econ. Manag. 1997, 34, 173–186. [Google Scholar] [CrossRef]
  17. Fredriksson, P.G.; Wollscheid, J.R. Environmental decentralization and political centralization. Ecol. Econ. 2014, 107, 402–410. [Google Scholar] [CrossRef]
  18. Zhang, K.; Zhang, Z.Y.; Liang, Q.M. An empirical analysis of the green paradox in china: From the perspective of fiscal decentralization. Energy Policy 2017, 103, 203–211. [Google Scholar] [CrossRef]
  19. Horbach, J.; Rammer, C.; Rennings, K. Determinants of eco-innovations by type of environmental impact—The role of regulatory push/pull, technology push and market pull. Ecol. Econ. 2012, 78, 112–122. [Google Scholar] [CrossRef] [Green Version]
  20. Leitão, J.; de Brito, S.; Cubico, S. Eco-Innovation Influencers: Unveiling the Role of Lean Management Principles Adoption. Sustainability 2019, 11, 2225. [Google Scholar] [CrossRef] [Green Version]
  21. Porter, M.E.; van der Linde, C. Toward a New Conception of the Environment-Competitiveness Relationship. J. Econ. Perspect. 1995, 9, 97–118. [Google Scholar] [CrossRef] [Green Version]
  22. Amigues, J.P.; Durmaz, T. A Two-Sector Model of Economic Growth with Endogenous Technical Change and Pollution Abatement. Environ. Model. Assess. 2019, 24, 703–725. [Google Scholar] [CrossRef]
  23. Grimaud, A.; Tournemaine, F. Why can an environmental policy tax promote growth through the channel of education? Ecol. Econ. 2007, 62, 27–36. [Google Scholar] [CrossRef] [Green Version]
  24. Nakada, M. Environmental tax reform and growth: Income tax cuts or profits tax reduction. Environ. Resour. Econ. 2010, 47, 549–565. [Google Scholar] [CrossRef]
  25. Wang, Y.; Sun, X.; Guo, X. Environmental regulation and green productivity growth: Empirical evidence on the Porter Hypothesis from OECD industrial sectors. Energy Policy 2019, 132, 611–619. [Google Scholar] [CrossRef]
  26. Hamaguchi, Y. Environmental policy effects: An R&D-based economic growth model with endogenous labour supply. J. Econ. Policy Reform 2021, 24, 236–252. [Google Scholar]
  27. Nakada, M. Does environmental policy necessarily discourage growth? J. Econ. 2004, 81, 249–275. [Google Scholar] [CrossRef]
  28. Albrizio, S.; Kozluk, T.; Zipperer, V. Environmental policies and productivity growth: Evidence across industries and firms. J. Environ. Econ. Manag. 2017, 81, 209–226. [Google Scholar] [CrossRef]
  29. Grimaud, A.; Rouge, L. Environment, directed technical change and economic policy. Environ. Resour. Econ. 2008, 41, 439–463. [Google Scholar] [CrossRef]
  30. Ouyang, X.; Li, Q.; Du, K. How does environmental regulation promote technological innovations in the industrial sector? Evidence from Chinese provincial panel data. Energy Policy 2020, 139, 111310. [Google Scholar] [CrossRef]
  31. Shao, S.; Hu, Z.; Cao, J.; Yang, L.; Guan, D. Environmental Regulation and Enterprise Innovation: A Review. Bus. Strategy Environ. 2020, 29, 1465–1478. [Google Scholar] [CrossRef]
  32. Shang, L.; Tan, D.; Feng, S.; Zhou, W. Environmental regulation, import trade, and green technology innovation. Environ. Sci. Pollut. Res. 2022, 29, 12864–12874. [Google Scholar] [CrossRef] [PubMed]
  33. Wang, P.; Dong, C.; Chen, N.; Qi, M.; Yang, S.; Nnenna, A.B.; Li, W. Environmental Regulation, Government Subsidies, and Green Technology Innovation—A Provincial Panel Data Analysis from China. Int. J. Environ. Res. Public Health 2021, 18, 11991. [Google Scholar] [CrossRef] [PubMed]
  34. Guo, Y.; Xia, X.; Zhang, S.; Zhang, D. Environmental Regulation, Government R&D Funding and Green Technology Innovation: Evidence from China Provincial Data. Sustainability 2018, 10, 940. [Google Scholar]
  35. Peng, H.; Shen, N.; Ying, H.; Wang, Q. Can environmental regulation directly promote green innovation behavior?—Based on situation of industrial agglomeration. J. Clean. Prod. 2021, 314, 128044. [Google Scholar] [CrossRef]
  36. Luo, Y.; Salman, M.; Lu, Z. Heterogeneous impacts of environmental regulations and foreign direct investment on green innovation across different regions in China. Sci. Total Environ. 2021, 759, 143744. [Google Scholar] [CrossRef]
  37. Brennan, G.R.; Buchanan, J.M. The Power to Tax: Analytical Foundations of a Fiscal Constitution. South. Econ. J. 1980, 48, 518. [Google Scholar]
  38. Qian, Y.; Roland, G. Federalism and the soft budget constraint. Am. Econ. Rev. 1998, 88, 1143–1162. [Google Scholar] [CrossRef] [Green Version]
  39. Ramanathan, R.; Black, A.; Nath, P.; Muyldermans, L. Impact of environmental regulations on innovation and performance in the UK industrial sector. Manag. Decis. 2010, 48, 1493–1513. [Google Scholar] [CrossRef]
  40. Manello, A. Productivity growth, environmental regulation and win–win opportunities: The case of chemical industry in Italy and Germany. Eur. J. Oper. Res. 2017, 262, 733–743. [Google Scholar] [CrossRef]
  41. Li, G.; Guo, F.; Di, D. Regional competition, environmental decentralization, and target selection of local governments. Sci. Total Environ. 2020, 755, 142536. [Google Scholar] [CrossRef] [PubMed]
  42. Song, M.; Du, J.; Tan, K.H. Impact of fiscal decentralization on green total factor productivity. Int. J. Prod. Econ. 2018, 205, 359–367. [Google Scholar] [CrossRef]
  43. Hao, Y.; Xu, L.; Guo, Y.; Wu, H. The inducing factors of environmental emergencies: Do environmental decentralization and regional corruption matter? J. Environ. Manag. 2022, 302, 114098. [Google Scholar] [CrossRef] [PubMed]
  44. Lovo, S. The Effect of Environmental Decentralization on Polluting Industries in India; Grantham Research Institute on Climate Change and the Environment: London, UK, 2014. [Google Scholar]
  45. Zou, X.; Lei, C.; Gao, K.; Hu, C. Impact of Environmental Decentralization on Regional Green Development. J. Environ. Dev. 2019, 28, 412–441. [Google Scholar] [CrossRef]
  46. Feng, S.; Sui, B.; Liu, H.; Li, G. Environmental decentralization and innovation in China. Econ. Model. 2020, 93, 660–674. [Google Scholar] [CrossRef]
  47. Elheddad, M.; Djellouli, N.; Tiwari, A.K.; Hammoudeh, S. The relationship between energy consumption and fiscal decentralization and the importance of urbanization: Evidence from Chinese provinces. J. Environ. Manag. 2020, 264, 110474. [Google Scholar] [CrossRef]
  48. Wu, H.; Li, Y.; Hao, Y.; Ren, S.; Zhang, P. Environmental decentralization, local government competition, and regional green development: Evidence from China. Sci. Total Environ. 2020, 70, 135085.1–135085.15. [Google Scholar] [CrossRef]
  49. Zhang, W.; Li, G. Environmental decentralization, environmental protection investment, and green technology innovation. Environ. Sci. Pollut. Res. 2020, 24, 12740–12755. [Google Scholar] [CrossRef]
  50. List, J.A.; Co, C.Y. The Effects of Environmental Regulations on Foreign Direct Investment. J. Environ. Econ. Manag. 2000, 40, 1–20. [Google Scholar] [CrossRef] [Green Version]
  51. Wright, D.S.; Oates, W.E. Fiscal Federalism. Am. Polit. Sci. Assoc. 1974, 68, 1777. [Google Scholar] [CrossRef]
  52. Grooms, K.K. Enforcing the Clean Water Act: The effect of state-level corruption on compliance. J. Environ. Econ. Manag. 2015, 73, 50–78. [Google Scholar] [CrossRef]
  53. Sigman, H. Transboundary spillovers and decentralization of environmental policies. J. Environ. Econ. Manag. 2005, 50, 82–101. [Google Scholar] [CrossRef] [Green Version]
  54. Farzanegan, M.R.; Mennel, T. Fiscal Decentralization and Pollution: Institutions Matter; MAGKS Joint Discussion Paper Series in Economics No. 22-2012; Philipps-University Marburg, Faculty of Business Administration and Economics: Marburg, Germany, 2012. [Google Scholar]
  55. Zhang, N.; Yu, K.; Chen, Z. How does urbanization affect carbon dioxide emissions? a cross-country panel data analysis. Energy Policy 2017, 107, 678–687. [Google Scholar] [CrossRef]
  56. Isik, C.; Ongan, S.; Ozdemir, D.; Ahmad, M.; Irfan, M.; Alvarado, R.; Ongan, A. The increases and decreases of the environment Kuznets curve (EKC) for 8 OECD countries. Environ. Sci. Pollut. Res. 2021, 28, 28535–28543. [Google Scholar] [CrossRef]
  57. Du, J.-L.; Liu, Y.; Diao, W.-X. Assessing Regional Differences in Green Innovation Efficiency of Industrial Enterprises in China. Int. J. Environ. Res. Public Health 2019, 16, 940. [Google Scholar] [CrossRef] [Green Version]
  58. Kofi, E.B. Institutional quality, green innovation and energy efficiency. Energy Policy 2019, 135, 111002. [Google Scholar]
  59. Wurlod, J.D.; Noailly, J. The impact of green innovation on energy intensity: An empirical analysis for 14 industrial sectors in OECD countries. Energy Econ. 2018, 71, 47–61. [Google Scholar] [CrossRef] [Green Version]
  60. Zhang, D.; Rong, Z.; Ji, Q. Green innovation and firm performance: Evidence from listed companies in china. Resour. Conserv. Recycl. 2019, 144, 48–55. [Google Scholar] [CrossRef]
  61. Hong, M.; Li, Z.; Drakeford, B. Do the Green Credit Guidelines Affect Corporate Green Technology Innovation? Empirical Research from China. Int. J. Environ. Res. Public Health 2021, 18, 1682. [Google Scholar] [CrossRef]
  62. Xie, X.; Huo, J.; Zou, H. Green process innovation, green product innovation, and corporate financial performance: A content analysis method. J. Bus. Res. 2019, 101, 697–706. [Google Scholar] [CrossRef]
  63. Wu, H.; Qu, Y. How Do Firms Promote Green Innovation through International Mergers and Acquisitions: The Moderating Role of Green Image and Green Subsidy? Int. J. Environ. Res. Public Health 2021, 18, 7333. [Google Scholar] [CrossRef] [PubMed]
  64. Zhang, Q. An Empirical Study of Environmental Regulations Influence on Green Technology Innovation--Based on Different Regulation Policies and 30 Provinces Data in China. J. Ind. Technol. Econ. 2015, 34, 10–18. [Google Scholar]
  65. Qi, Y.; Lu, H.; Xu, Y. Study on the reform of China’s environmental decentralization system: Institutional change, quantitative measurement and effect evaluation. China Ind. Econ. 2014, 1, 31–43. [Google Scholar]
  66. Ran, Q.; Zhang, J.; Hao, Y. Does environmental decentralization exacerbate china’s carbon emissions? evidence based on dynamic threshold effect analysis. Sci. Total Environ. 2020, 721, 137656. [Google Scholar] [CrossRef]
  67. Ren, S.; Li, X.; Yuan, B.; Li, D.; Chen, X. The effects of three types of environmental regulation on eco-efficiency: A cross-region analysis in China. J. Clean. Prod. 2016, 173, 245–255. [Google Scholar] [CrossRef]
  68. Wang, Z.; NWang Hu, X.; Wang, H. Threshold effects of environmental regulation types on green investment by heavily polluting enterprises. Environ. Sci. Eur. 2022, 34, 26. [Google Scholar] [CrossRef]
  69. Jiang, X.; Lu, W.X.; Zhao, H.Q.; Yang, Q.C.; Chen, M. Quantitative evaluation of mining geo-environmental quality in northeast china: Comprehensive index method and support vector machine models. Environ. Earth Sci. 2015, 73, 7945–7955. [Google Scholar] [CrossRef]
  70. Li, M.; Du, W.; Tang, S. Assessing the impact of environmental regulation and environmental co- governance on pollution transfer: Micro-evidence from china. Environ. Impact Assess. Rev. 2021, 86, 106467. [Google Scholar] [CrossRef]
  71. Zugravu, N.; Kheder, S.B. The Pollution Haven Hypothesis: A Geographic Economy Model in a Comparative Study. Soc. Sci. Electron. Publ. 2008, 73, 4223. [Google Scholar]
  72. Hamamoto, M. Environmental regulation and the productivity of japanese manufacturing industries. Resour. Energy Econ. 2006, 28, 299–312. [Google Scholar] [CrossRef]
  73. Sjoberg, E.; Xu, J. An empirical study of us environmental federalism: Rcra enforcement from 1998 to 2011. Ecol. Econ. 2018, 147, 253–263. [Google Scholar] [CrossRef]
  74. Xie, W.; Li, X. Can Industrial Agglomeration Facilitate Green Development? Evidence from China. Front. Environ. Sci. 2021, 9, 745465. [Google Scholar] [CrossRef]
  75. Lu, X.-H.; Jiang, X.; Gong, M. How land transfer marketization influence on green total factor productivity from the approach of industrial structure? Evidence from China. Land Use Policy 2020, 95, 104610. [Google Scholar] [CrossRef]
  76. Harrison, A. Do domestic firms benefit from direct foreign investment? evidence from Venezuela. Am. Econ. Rev. 1999, 89, 1369–1401. [Google Scholar]
  77. Behera, P.; Sethi, N. Nexus between environment regulation, FDI, and green technology innovation in OECD countries. Environ. Sci. Pollut. Res. 2022. [Google Scholar] [CrossRef]
  78. Wu, Y.-Q.; Lu, H.-X.; Liao, X.-L.; Liu, J.-B.; Zhu, J.-M. Foreign Direct Investment, Regional Innovation, and Green Economic Efficiency: An Empirical Test Based on the Investigation of Intermediary Effect and Threshold Effect. Comput. Intell. Neurosci. 2021, 2021, 7348599. [Google Scholar] [CrossRef]
  79. Lipscomb, M.; Mobarak, A.M. Decentralization and Pollution Spillovers: Evidence from the Re-drawing of County Borders in Brazil. Rev. Econ. Stud. 2016, 84, rdw023. [Google Scholar] [CrossRef] [Green Version]
  80. Yang, Y.; Yang, X.; Tang, D. Environmental regulations, Chinese-style fiscal decentralization, and carbon emissions: From the perspective of moderating effect. Stoch. Environ. Res. Risk Assess. 2021, 35, 1985–1998. [Google Scholar] [CrossRef]
  81. Saveyn, B.; Proost, S. Energy-tax reform with vertical tax externalities. FinanzArchiv/Public Financ. Anal. 2008, 64, 63–86. [Google Scholar] [CrossRef]
  82. Jacobsen, G.D.; Kotchen, M.J.; Vandenbergh, M.P. The behavioral response to voluntary provision of an environmental public good: Evidence from residential electricity demand. Eur. Econ. Rev. 2012, 56, 946–960. [Google Scholar] [CrossRef]
  83. Stewart, R.B. Pyramids of Sacrifice—Problems of Federalism in Mandating State Implementations of National Environmental Policy. Yale L 1976, 86, 1196. [Google Scholar] [CrossRef] [Green Version]
  84. Kunce, M.; Shogren, J.F. Destructive interjurisdictional competition: Firm, capital and labor mobility in a model of direct emission control. Ecol. Econ. 2007, 60, 543–549. [Google Scholar] [CrossRef]
  85. Lockwood, B. Distributive politics and the costs of centralization. Rev. Econ. Stud. 2002, 69, 313–337. [Google Scholar] [CrossRef]
  86. Du, K.; Cheng, Y.; Yao, X. Environmental regulation, green technology innovation, and industrial structure upgrading: The road to the green transformation of Chinese cities. Energy Econ. 2021, 98, 105247. [Google Scholar] [CrossRef]
  87. Tian, Z.; Tian, Y.; Chen, Y.; Shao, S. The economic consequences of environmental regulation in China: From a perspective of the environmental protection admonishing talk policy. Bus. Strategy Environ. 2020, 29, 1723–1733. [Google Scholar] [CrossRef]
Figure 1. The mechanism analysis of environmental regulation, environmental decentralization, and green innovation.
Ijerph 19 07074 g001
Figure 2. First Threshold.
Ijerph 19 07074 g002
Figure 3. Second Threshold.
Ijerph 19 07074 g003
Table 1. Descriptive statistics for key variables.
VariablesDefinitionMeanStd. Dev.MinMaxObservations
GIGreen patent applications278541801428,049300
EREnvironmental regulation0.920.420.242.51300
EDEnvironmental decentralization0.970.350.482.29300
EADEnvironmental administrative decentralization1.371.220.266.15300
ESDEnvironmental supervision decentralization1.351.460.108.10300
EMDEnvironmental monitoring decentralization1.531.490.227.75300
RGDPGross National Product per capita22,09913,084578766,036300
URUrbanization rate 52.5013.9427.4689.6300
TFITotal foreign investment5224738513933,127300
INDAdvanced industrial structure41.578.6828.379.7300
Table 2. National level regression results.
VariablesEDEADESDEMD
ER1.112 ***1.060 ***1.027 ***1.123 ***
(0.142)(0.142)(0.145)(0.148)
ED−0.761 ***−0.147 ***−0.0983 ***0.00758
(0.164)(0.0309)(0.0231)(0.0326)
lnRGDP1.298 ***0.920 ***1.021 ***1.208 ***
(0.316)(0.320)(0.320)(0.329)
lnUR4.864 ***5.226 ***5.101 ***4.824 ***
(0.379)(0.387)(0.386)(0.401)
lnIND1.536 ***1.385 ***1.443 ***1.604 ***
(0.249)(0.252)(0.253)(0.262)
lnTFI−0.167 ***−0.304 ***−0.194 ***−0.230 ***
(0.0621)(0.0632)(0.0617)(0.0719)
Constant−29.66 ***−26.27 ***−27.84 ***−29.16 ***
(2.743)(2.801)(2.775)(2.850)
Observations300300300300
R-squared0.9150.9150.9140.908
Note: *** indicates significance at the 1% level.
Table 3. Regional level regression results.
VariablesDeveloped RegionsUnderdeveloped Regions
EDEADESDEMDEDEADESDEMD
ER0.902 ***0.902 ***0.978 ***1.042 ***0.484 *0.489 *0.527 *0.574 **
(0.207)(0.199)(0.209)(0.221)(0.267)(0.269)(0.272)(0.275)
ED−0.646 ***−0.275 ***−0.109 ***−0.124 *−0.847 ***−0.0865 **−0.04780.0558
(0.191)(0.0629)(0.0355)(0.0634)(0.289)(0.0364)(0.0322)(0.0372)
ControlYESYESYESYESYESYESYESYES
Constant−40.58 ***−33.04 ***−29.94 ***−33.43 ***−25.41 ***−23.94 ***−25.67 ***−25.11 ***
(5.920)(5.757)(6.475)(6.539)(3.034)(3.130)(3.089)(3.100)
Observations100100100100200200200200
R-squared0.9370.9420.9360.9320.9150.9140.9120.912
Number1010101020202020
Note: ***, **, and * indicate significance at the 1%, 5%, and 10% levels, respectively.
Table 4. Regression results for moderating effects.
VariablesEDEADESDEMD
c_ER0.942 ***1.030 ***0.818 ***1.045 ***
(0.154)(0.143)(0.155)(0.151)
c_ED−0.807 ***−0.160 ***−0.163 ***0.00134
(0.164)(0.0315)(0.0298)(0.0325)
c_EDER−0.858 ***−0.132*−0.245 ***0.183 **
(0.323)(0.0705)(0.0727)(0.0779)
ControlYESYESYESYES
Constant−29.94 ***−25.85 ***−26.27 ***−27.86 ***
(2.800)(2.851)(2.794)(2.900)
Observations300300300300
R-squared0.9170.9160.9170.910
Note: *** and ** indicate significance at the 1% and 5% levels, respectively.
Table 5. Threshold quantity test and threshold estimation.
VariablesThreshold NumberF-Valuep-ValueThreshold95% Confidence Interval
EDSingle threshold30.980.01000.5941(1.0656, 1.6146)
Double Threshold21.260.07670.9694(0.7426, 1.3043)
EADSingle threshold22.930.09673.8584(0.8714, 1.4276)
Double Threshold7.170.74332.3283(0.6477, 1.2827)
ESDSingle threshold14.640.38003.0288(0.6340, 1.2633)
Double Threshold19.680.12330.6851(0.4037, 1.0421)
EMDSingle threshold12.430.40332.3724(0.7500, 1.3437)
Double Threshold8.600.63671.0269(0.5801, 1.1841)
Table 6. Coefficient estimation results of the threshold model.
VariableslnRGDPlnURlnINDlnTFI α 1 α 2 α 3
(5)1.471 ***−0.174 ***1.629 ***4.804 ***1.340 ***1.023 ***0.606 ***
(0.306)(0.0587)(0.238)(0.363)(0.139)(0.143)(0.158)
Note: *** indicates significance at the 1% level.
Publisher’s Note: MDPI stays neutral with regard to jurisdictional claims in published maps and institutional affiliations.

