Article

Effect of Precipitation Variation on Soil Respiration in Rain-Fed Winter Wheat Systems on the Loess Plateau, China

1
State Key Laboratory of Grassland Agro-Ecosystem, Lanzhou University, Lanzhou 730020, China
2
College of Pastoral Agricultural Science and Technology, Lanzhou University, Lanzhou 730020, China
3
National Field Scientific Observation and Research Station of Grassland Agro-Ecosystems, Qingyang 745004, China
*
Author to whom correspondence should be addressed.
Int. J. Environ. Res. Public Health 2022, 19(11), 6915; https://doi.org/10.3390/ijerph19116915
Submission received: 7 May 2022 / Revised: 2 June 2022 / Accepted: 2 June 2022 / Published: 5 June 2022

Abstract

:
Global climate change has aggravated the hydrological cycle by changing both the amount and distribution of precipitation, and this is especially notable in the semiarid Loess Plateau. How these precipitation variations have affected soil carbon (C) emission by the agroecosystems is still unclear. Here, to evaluate the effects of precipitation variation on soil respiration (Rs), a field experiment (from 2019 to 2020) was conducted with 3 levels of manipulation, including ambient precipitation (CK), 30% decreased precipitation (P−30), and 30% increased precipitation (P+30) in rain-fed winter wheat (Triticum aestivum L.) agroecosystems on the Loess Plateau, China. The results showed that the average Rs in P−30 treatment was significantly higher than those in the CK and P+30 treatments (p < 0.05), and the cumulative CO2 emissions were 406.37, 372.58 and 383.59 g C m−2, respectively. Seasonal responses of Rs to the soil volumetric moisture content (VWC) were affected by the different precipitation treatments. Rs was quadratically correlated with the VWC in the CK and P+30 treatments, and the threshold of the optimal VWC for Rs was approximately 16.06–17.07%. However, Rs was a piecewise linear function of the VWC in the P−30 treatment. The synergism of soil temperature (Ts) and VWC can better explain the variation in soil respiration in the CK and P−30 treatments. However, an increase in precipitation led to the decoupling of the Rs responses to Ts. The temperature sensitivity of respiration (Q10) varied with precipitation variation. Q10 was positive correlated with seasonal Ts in the CK and P+30 treatments, but exhibited a negative polynomial correlation with seasonal Ts in the P−30 treatment. Rs also exhibited diurnal clockwise hysteresis loops with Ts in the three precipitation treatments, and the seasonal dynamics of the diurnal lag time were significantly negatively correlated with the VWC. Our study highlighted that understanding the synergistic and decoupled responses of Rs and Q10 to Ts and VWC and the threshold of the change in response to the VWC under precipitation variation scenarios can benefit the prediction of future C balances in agroecosystems in semiarid regions under climate change.

1. Introduction

Global climate change has aggravated the hydrological cycle, causing changes in both the amount and distribution of precipitation [1,2]. Projections from climate models show that the probability of extreme precipitation will continue to increase in the future due to the aggravation of global warming [3], which will seriously affect the process of the global carbon (C) cycle [4]. This is particularly true for arid and semiarid regions, where terrestrial C sinks are especially sensitive to precipitation variation [5]. As a vital process in the global C cycle in terrestrial ecosystems, soil respiration (Rs) is a critical contributor to the transport of terrestrial C to the atmosphere, and small changes in Rs have great impacts on the global C cycle [6]. Thus, exploring how Rs responds to precipitation variation will enhance our predictions of the global C cycle in the context of climate change.
Soil respiration (Rs) is the second largest terrestrial C flux, accounting for 60–90% of total ecosystem respiration [7,8]. Rs is composed of autotrophic respiration (Ra) and heterotrophic respiration (Rh) [4]. Variations in Rs are attributed to changes in biotic and abiotic factors, especially soil temperature (Ts) and soil volumetric water content (VWC) [9,10]. Precipitation is the primary driver of biological activity in arid and semiarid areas, and it further regulates the dynamics of Rs by affecting the synergistic and decoupling effect of Ts and VWC [5,11]. It has been reported that when the VWC is sufficient, increasing Ts will improve Rs by increasing the net photosynthesis rate [12], substrate concentration [13], and microbial biomass [14]. However, when water stress occurs, the VWC may be decoupled from the Ts and become the primary factor affecting Rs [11]. This indicates that there is a threshold of the Rs response to Ts and VWC and that a change in this threshold may suddenly change the function of the C cycle in the world’s major terrestrial ecosystems [15,16]. However, the response pattern of this threshold to precipitation variation is not clear. Hence, how the responses of the decoupling or synergistic effects between VWC and Ts to precipitation variation affect Rs, particularly in arid and semiarid regions, needs to be addressed.
Temperature sensitivity (Q10) is a critical metric for characterizing the relationship between Ts and Rs [17,18,19], and may be influenced by other biotic and abiotic factors, such as precipitation [18,20], VWC [13], root biomass [17], and microorganisms [19]; Q10 can also lead to hysteresis (between Ts and Rs) at multiple scales [21]. Previous studies have shown that the VWC may indirectly affect Q10 because the diffusion of extracellular enzymes produced and the available substrates must occur in the liquid phase [13,22]. Moreover, because the thermal conductivity in the liquid phase is higher than that in the solid phase, the elevated VWC caused by precipitation promotes the C transport rate of plants, which further affects the hysteresis relationship [23,24]. However, due to the spatiotemporal variability in Rs and the differences among ecosystems, there is still no consensus on how Q10 and the hysteresis relationship respond to precipitation variation. Clarifying the responses of Q10 and the hysteresis relationship to precipitation variation is crucial for understanding the relationship between soil C pool dynamics and climate change in arid and semiarid areas.
The Loess Plateau (LP) of China is one of the most severely eroded arid and semiarid regions in the world and plays a vital role in global C cycle and climate change research [25]. The LP is also one of the most important winter wheat (Triticum aestivum L.)-producing regions in China, and its winter wheat planting area accounts for 44% of the cultivated land area on the LP [26]. Conventional wheat cultivation practices on the LP are relatively vulnerable to climate change, increase the unstable carbon fraction, and lower soil organic C stocks, which in turn aggravate the global C cycle [27]. Moreover, the projections have shown that extreme precipitation events on the LP may increase in the future, which is one of the uncertainty factors in measuring C flux emissions [5]. To date, studies on Rs of winter wheat have actively focused on natural precipitation and irrigation [27,28,29]. In contrast, the response of Rs to natural precipitation variation has been of less concern, especially the lack of understanding of the threshold change patterns of coupling and decoupling effects among the factors affecting Rs, which is not conducive to our predictions on the C cycle of farmland systems in the context of climate change. It is urgently necessary to investigate the response of Rs to precipitation variation in winter wheat farmland systems through high-frequency Rs measurements combined with multi-stage precipitation experiments.
To evaluate the effects of precipitation variation on the Rs of winter wheat farmland ecosystems on the Loess Plateau, Rs was continuously measured with an automatic soil CO2 flux system during the whole growth period from 2019 to 2020, and field simulation experiments with three precipitation levels (P−30 = 30% decreased precipitation, CK = ambient precipitation, P+30 = 30% increased precipitation) were carried out with a rainfall shelter. The purpose of this study was (1) to quantify the responses of seasonal Rs to precipitation variation; (2) to clarify the responses of seasonal Rs to Ts and VWC under precipitation variation; and (3) to explore the responses of seasonal lag times and Q10 to precipitation variation. We hypothesized that (1) precipitation variation would cause significant differences in the VWC, which would significantly affect the seasonal dynamics of the Rs and lag time and (2) the synergistic or decoupling response of seasonal Rs and Q10 to Ts and VWC would be dominated by precipitation.

2. Materials and Methods

2.1. Experimental site Description and Design

The study was conducted from 2019 to 2020 at the Loess Plateau Research Station of Lanzhou University, located in the township of Shishe, Qingyang city, Gansu, China (35°40 N, 107°51 E, with an altitude of 1297 m). This site has a typical semiarid continental monsoon climate, and rainwater is the only water source for crop growth. The mean annual precipitation and temperature are 541 mm and 9.2 °C (1961–2019), respectively, and more than 60% of the precipitation is concentrated in the summer fallow period of winter wheat (from July to September). The average annual pan evaporation is 1504 mm, and the average annual sunshine duration is 2415 h. The soil at the site is silty loam. The average soil bulk density is 1.3 g cm−3, the pH is 8.4, the soil organic carbon content is 9.3 g kg−1, and the total N content is 0.64 g kg−1 in the 0–20 cm soil layer.
The experimental field for the study of the continuous wheat crop under precipitation variation started in September 2018. We used a randomized block design with four replications and three precipitation treatments including 30% decreased precipitation (P−30), ambient control (CK), and 30% increased precipitation (P+30) treatments. The variation in precipitation in the experimental plots was achieved using rainfall shelters [30], which trapped 30% of the precipitation (P−30). The trapped rainfall was channeled to the P+30 sites. Each plot was 3 m × 4 m, with a 1 m spacing between plots. We inserted stainless-steel sheets into the ground (40 cm in depth, 10 cm above the ground surface) to prevent lateral water movement. All measurements were conducted in the central area of each plot (2 m × 3 m) to avoid edge effects. In this study, the winter wheat cultivar Longyu 4 was planted in 20 rows of 13.5 g seeds that were sown at a 15 cm spacing on September 25 in 2019 and hand-harvested on June 25 in 2020. Fertilization consisted of 225 kg hm−2 of triple superphosphate and 150 kg hm−2 of urea (36% was applied as base fertilizer before sowing the winter wheat, and the remaining 64% was applied at the jointing stage).

2.2. Measurement of Rs, Ts, and VWC

One permanent polyvinyl chloride (PVC) collar (20.3 cm inner diameter, 10 cm height) was installed 6 cm into the soil in the central area of each plot in July 2019. In October 2019, the hourly soil respiration rate of winter wheat in the whole growth period was continuously measured by using an automatic soil carbon dioxide flux system (model LI-8100A fitted with an LI-8150 multiplexer, LI-COR, Lincoln, NE, USA) with LI-104 long-term measurement opaque chambers. The measurement time for each chamber was 3 min and 15 s, comprising a 30 s pre-purge, a 120 s observation period (including a 20 s dead band), and a 45 s post-purge. Any plant re-growth within the measurement collar was manually removed. The hourly Ts and VWC at 10 cm depth were measured simultaneously with the soil respiration rates using the 8150-203 soil temperature probe and GS1 soil moisture sensor (LI-COR, Lincoln, NE, USA), respectively. Meteorological data (air temperature and precipitation) were recorded half-hourly using a PC200W automatic meteorological station (Campbell Scientific) placed within 50 m of the experimental field.

2.3. Measurements of Soil Profile Moisture and Net Photosynthetic Rate (Pn)

The soil gravimetric water content in the 0–300 cm (each gradient 20 cm) soil profile of the soil column was determined by the oven drying method at winter wheat sowing and at harvesting. The net photosynthetic rates (Pn) of winter wheat flag leaves were measured every seven days from anthesis with a portable open gas exchange system (Li-6800-01A, Li-Cor Biosciences Inc., Lincoln, NE, USA) at 9:30–11:00 a.m. on sunny days. The leaves of three plants were measured in each plot.

2.4. The Dependence of Rs on Ts and VWC

The Rs was fitted to Ts and VWC with empirical exponential and quadratic functions [10,13], respectively:
R s = a × e b × T s
R s = a × VWC 2 + b × VWC + c
where Rs, VWC, and Ts represent the soil respiration, soil volume water content, and soil temperature, respectively, and a, b, and c are fitting coefficients. Then, the following nonlinear models were used to express the relationships between VWC and Ts and Rs [31,32]:
R s = T s × VWC / ( a × T s + b × VWC + c )
R s = a × T s 2 + b × VWC 2 + c
R s = a × T s + b × VWC + c
R s = a × T s b × VWC c
R s = a + b × ( T s × VWC )
The Q10 of Rs based on Equation (1) was calculated as:
Q 10 = e 10 × b

2.5. Statistical Analysis

Due to instrument failure of the LI-8100A during the measurement period (from 5 to 19 October 1 to 11 December 2019 and 1 to 6 March 2020), 12% of CO2 flux data were missing. We calculated the cumulative CO2 emissions using Matlab’s trapz function with hourly data during the winter wheat whole growth period. The missing data were replaced by the hourly Ts and VWC fitted values with Equation (3) mentioned above. The monthly Q10 was analyzed using the short-term Q10 derived from fitting the Q10 model to synchronized data from a three-day moving window with a one-day step. One-way analysis of variance (ANOVA) followed by Duncan’s post hoc tests was used to perform multiple comparisons of the effect of precipitation on the monthly Rs and Q10. A linear model (y = ax + b) was used to determine the relationship between VWC and the monthly average diurnal dynamic lag time between Rs and Ts. A level of p < 0.05 was accepted as significant. To succinctly describe the monthly lag time between the diurnal average Ts and Rs during the whole growth period of winter wheat in the three precipitation treatments, we chose November 2019 and January, April, and June 2020 to represent the whole growth period, in intervals of 1–2 months, due to the fact that these months contain the key phenological periods of winter wheat, such as seedling, overwintering, jointing, booting, and harvest. All analyses were processed with a combination of MATLAB ver. R2019b (Mathworks Inc., Natick, MA, USA) and SPSS 25 (IBM Corp., Armonk, NY, USA).

3. Results

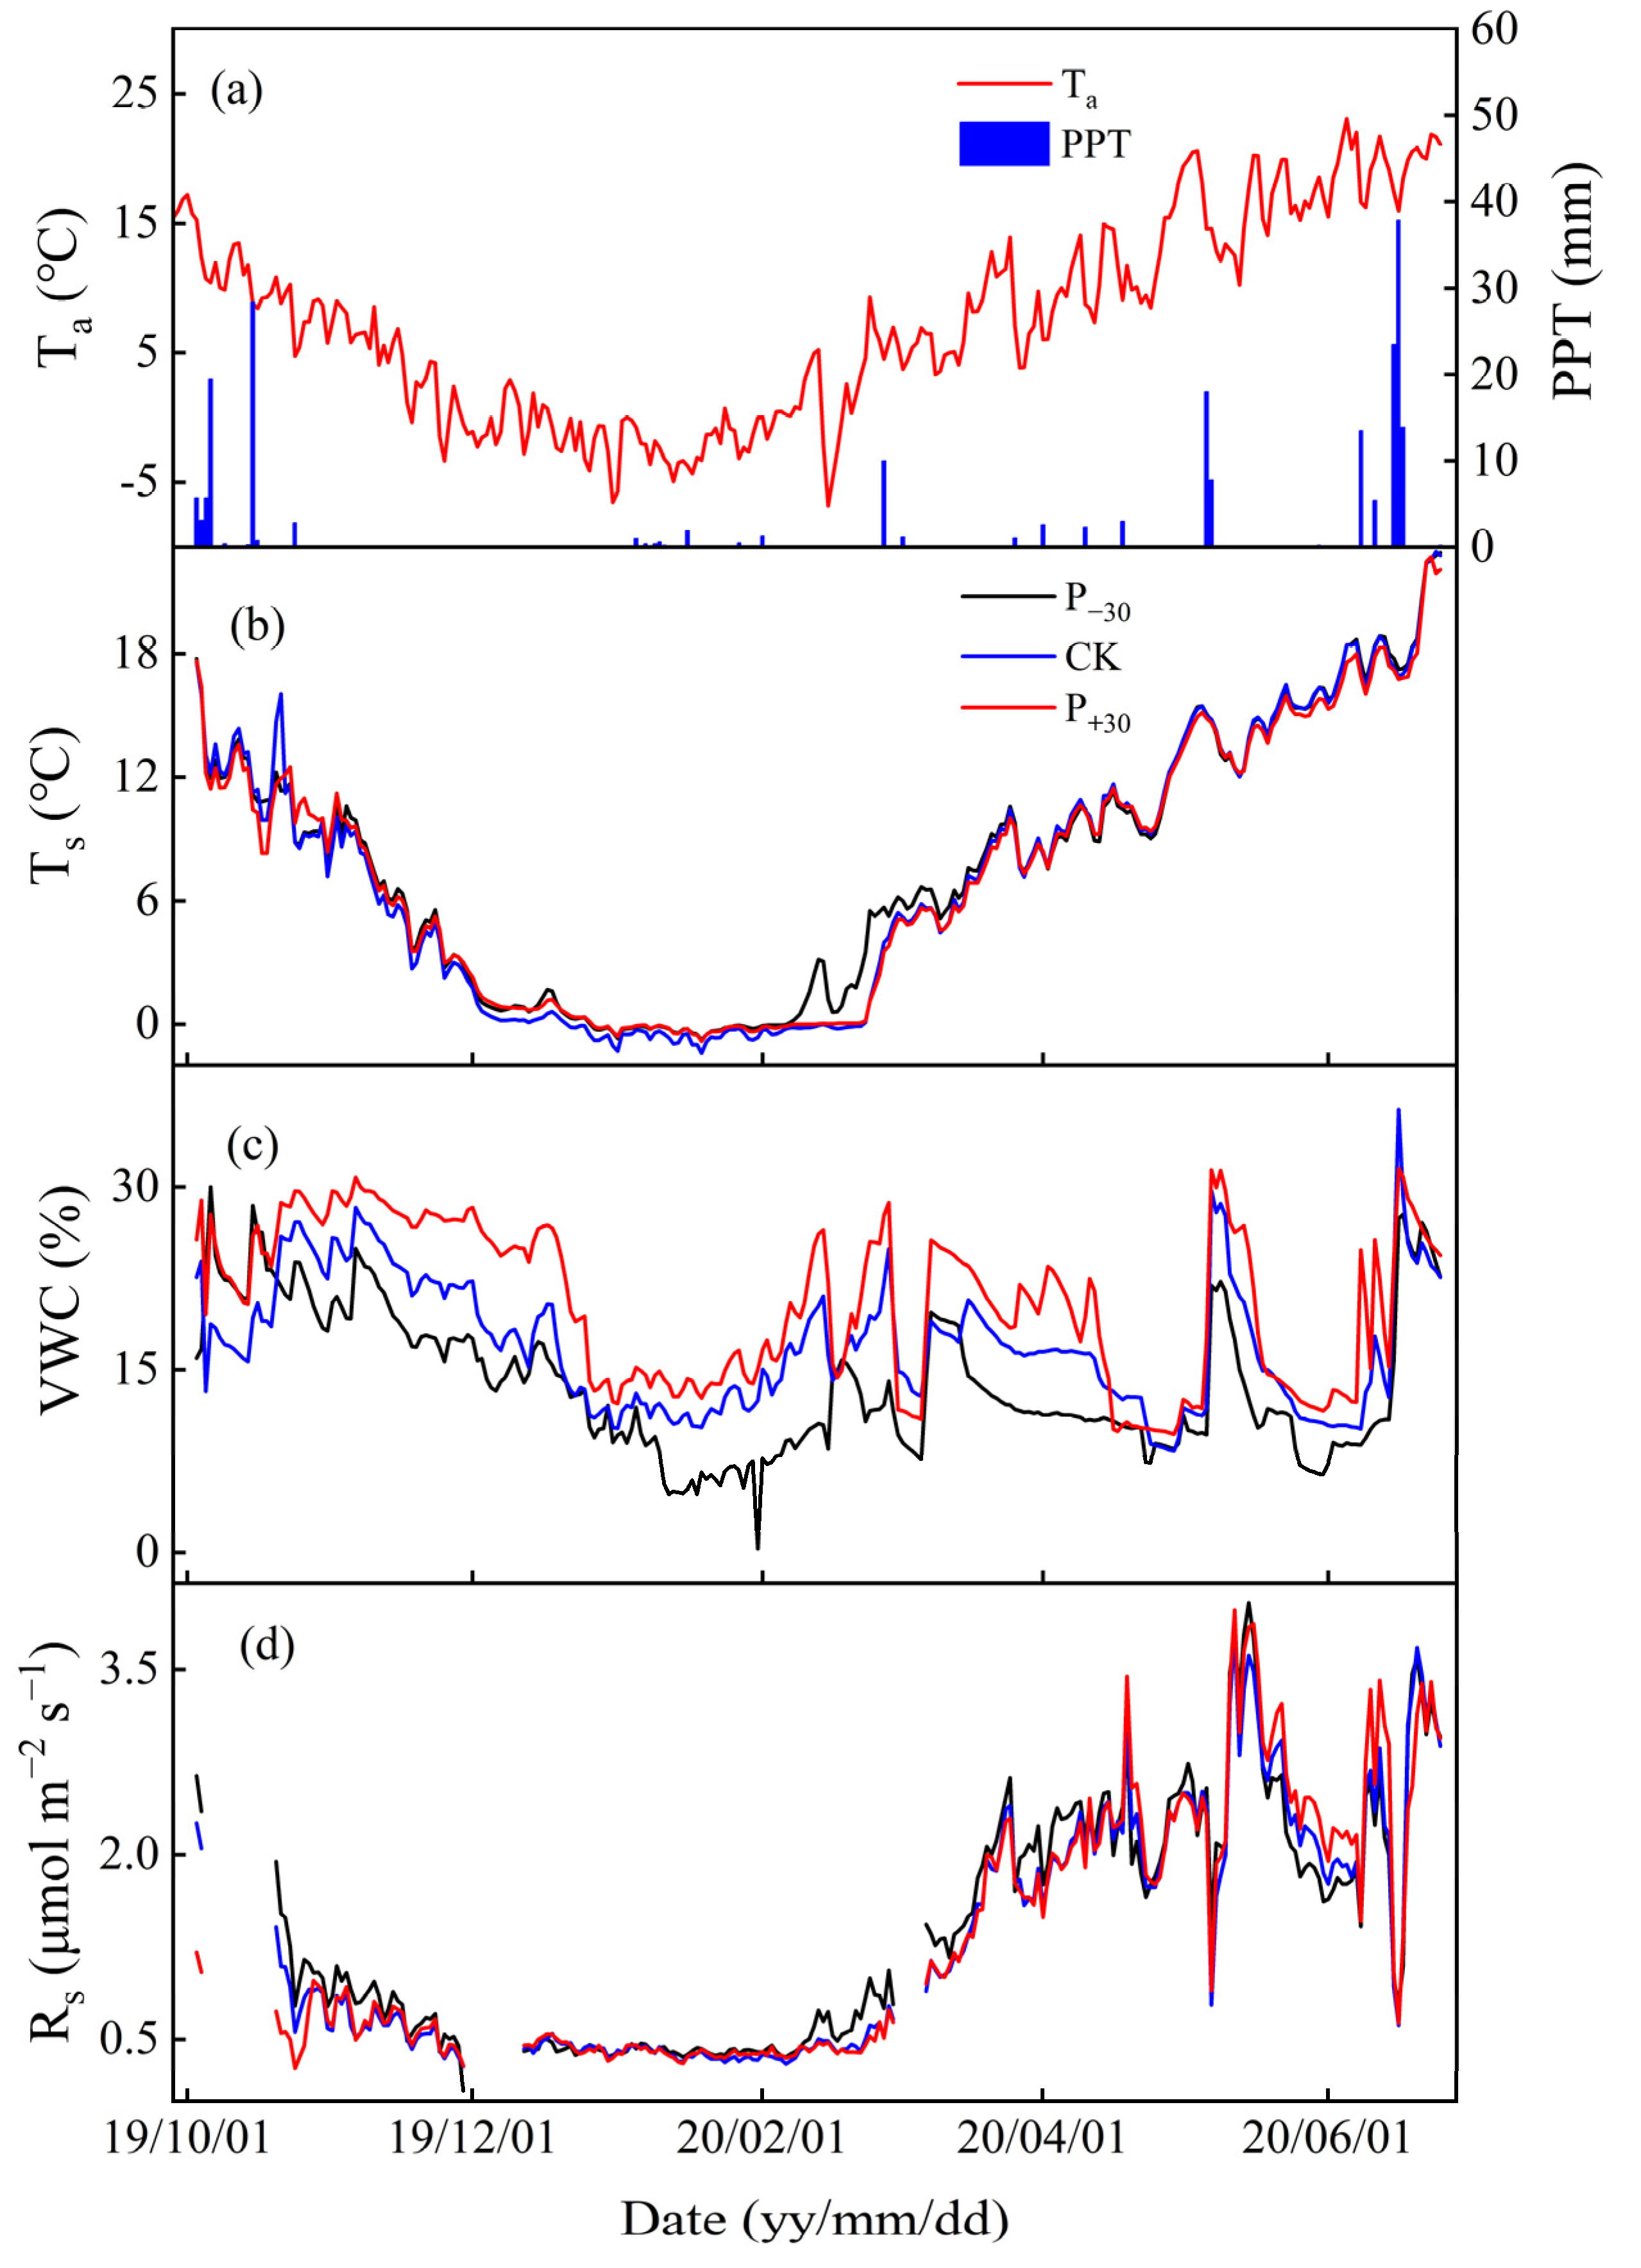
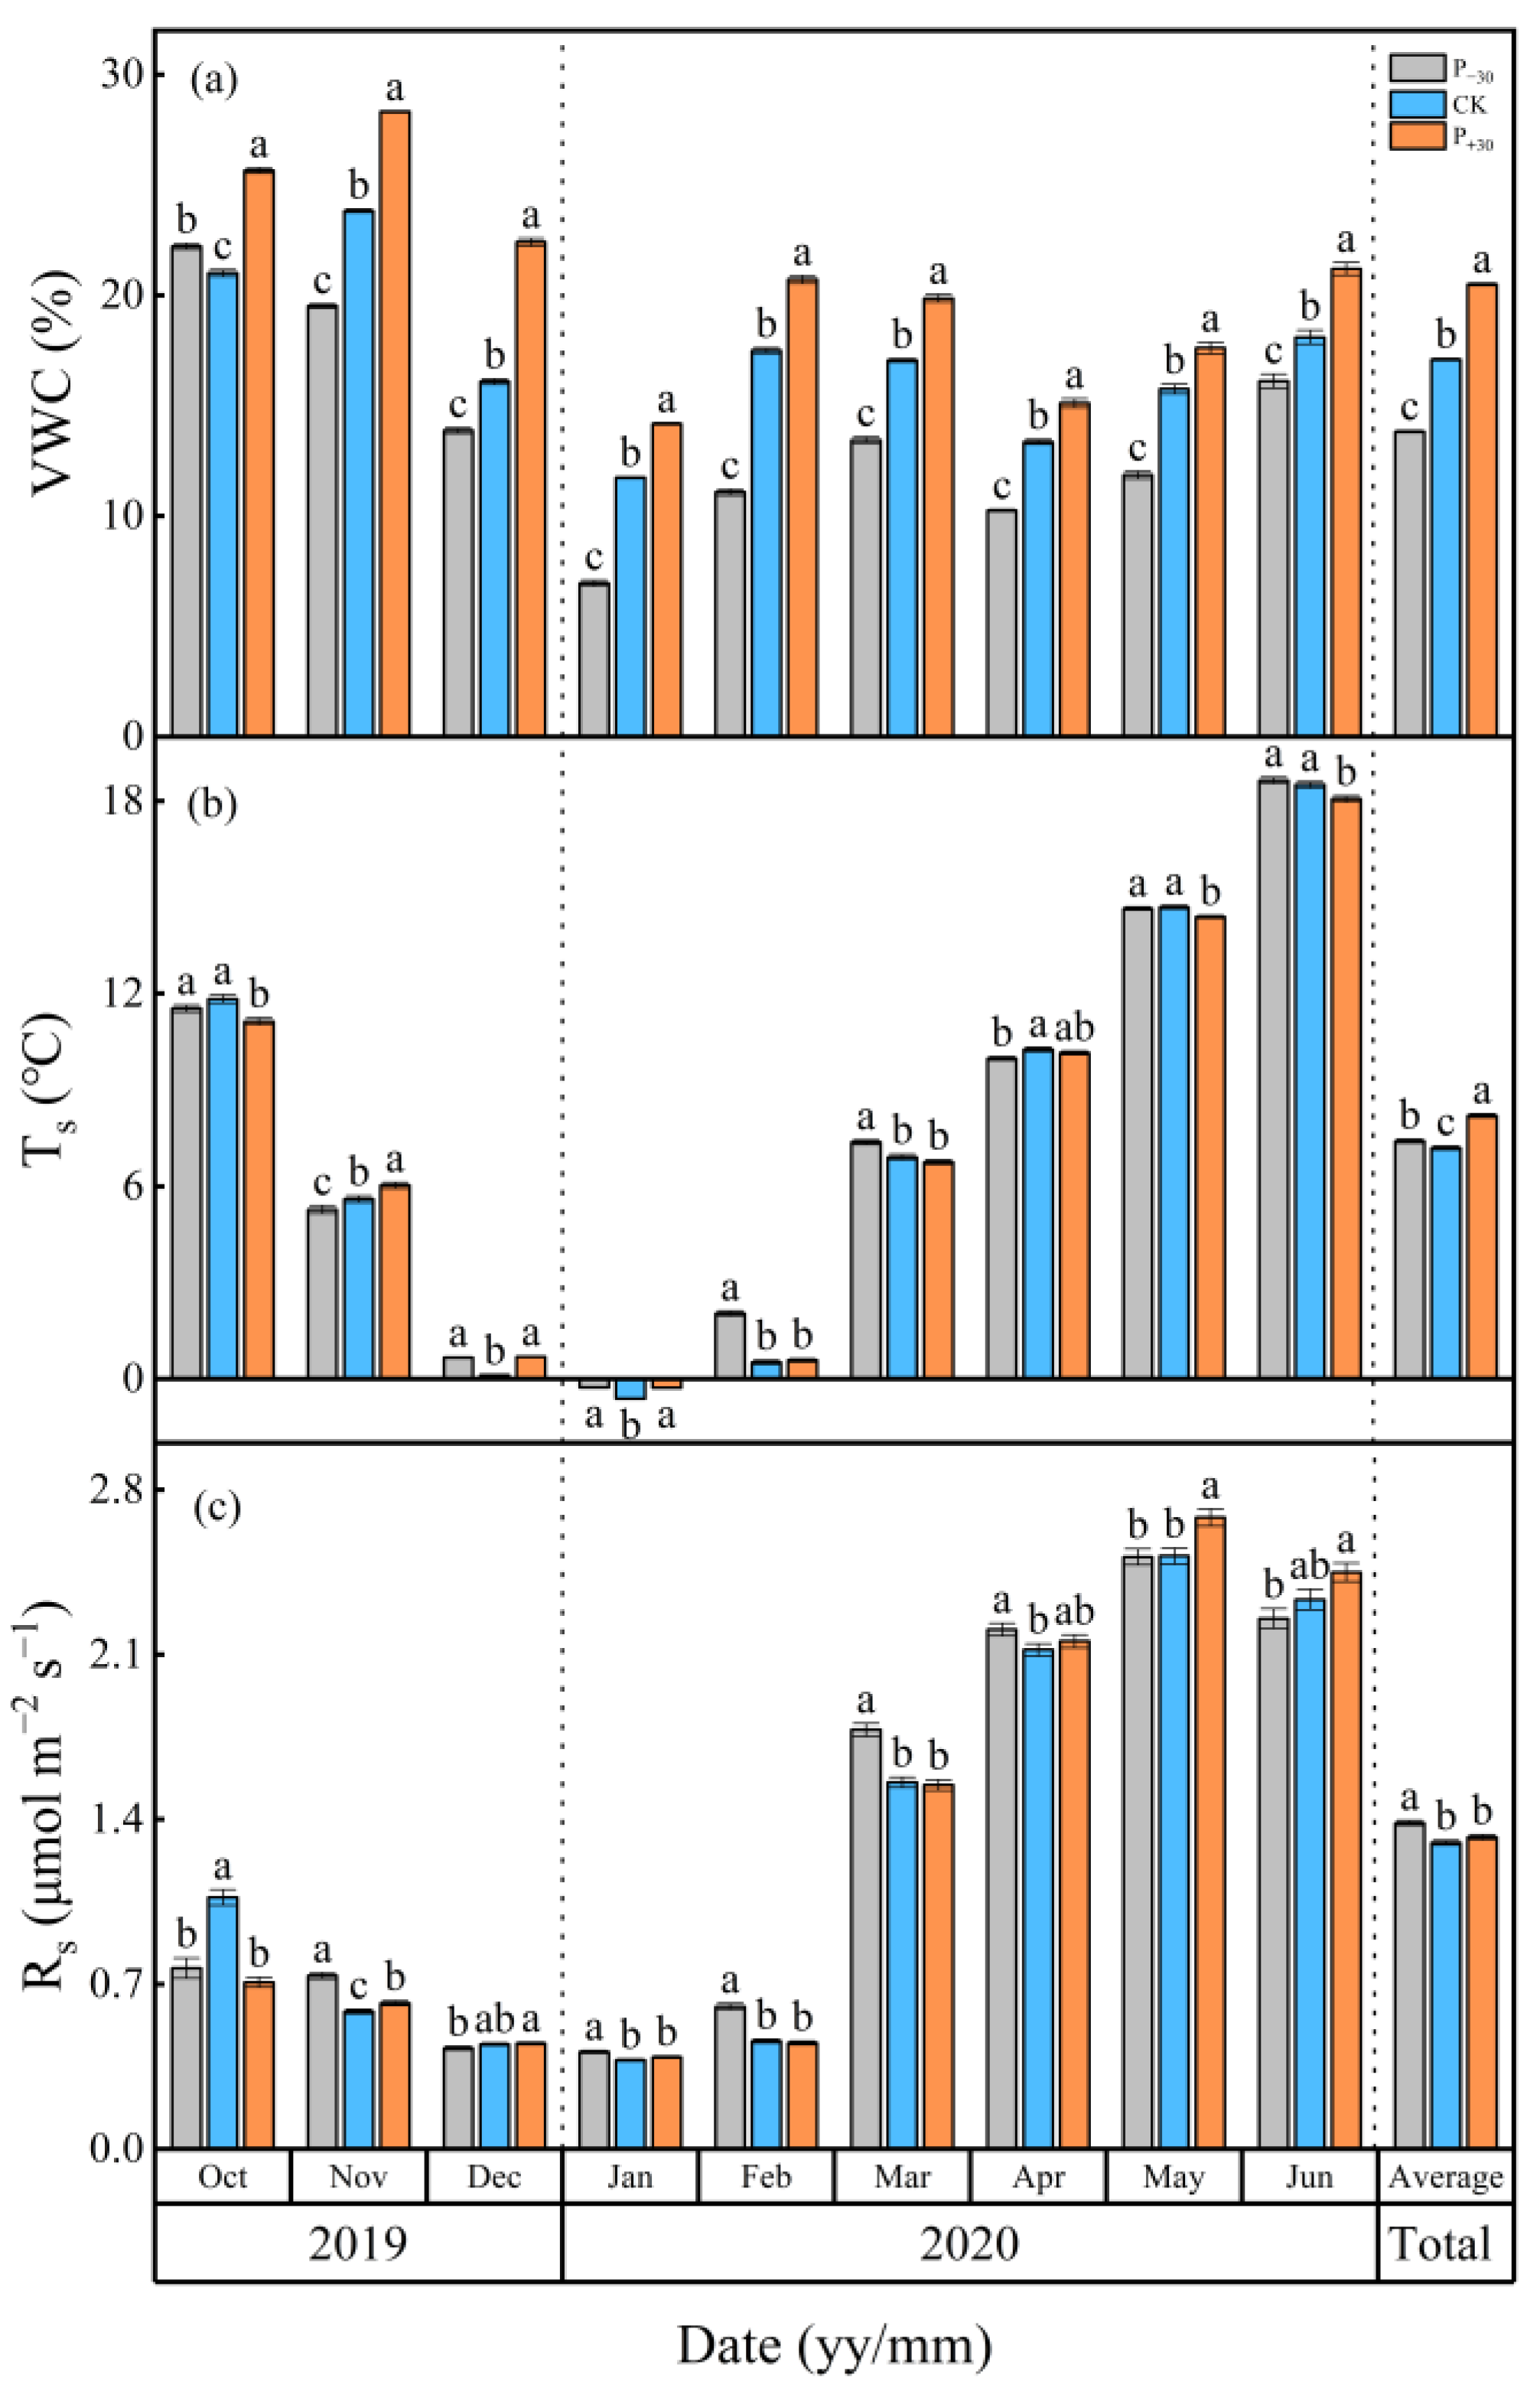
3.1. Environmental Conditions and Rs

The soil temperature (Ts) exhibited the same temporal pattern as air temperature, and the mean air temperature was 7.43 °C during the winter wheat whole growth period (Figure 1a,b and Figure 2b). The highest and lowest monthly mean Ts values occurred in Jun (P−30 treatment, 18.64 °C) and Jan 2020 (CK treatment, −0.62 °C), respectively. The Ts in the different precipitation treatments showed very similar seasonal variations. The average Ts was highest in P+30 treatment (8.19 °C), which was 13.9% and 7.2% higher than those in the CK and P−30 treatments (p < 0.05), respectively (Figure 2b). The variation in VWC was controlled mostly by precipitation events, and the total precipitation was 214.3 mm during the winter wheat whole growth period (Figure 1a,c). There were significant differences in the average VWC throughout the growth period, and the highest VWC, observed in the P+30 treatment, was 20.50%, which was 16.6% and 32.5% higher than those in the CK and P30 treatments (p < 0.05), respectively (Figure 2a).
Soil respiration (Rs) exhibited the same temporal pattern as Ts and was also affected by the rainfall pulse (Figure 1a,b,d). The highest Rs (from 0.38 to 0.41 μmol m−2 s−1) and the lowest Rs (from 2.51 to 2.68 μmol m−2 s−1) in the three treatments during the winter wheat whole growth period occurred in May and Jan 2020, respectively (Figure 2c). The average Rs of the P−30 treatment (1.38 μmol m−2 s1) was significantly higher than those of the other treatments during the whole growth period and was 6.5% and 3.8% higher than those of the CK (1.30 μmol m−2 s−1) and P+30 (1.32 μmol m−2 s−1) treatments (p < 0.05), respectively. The cumulative CO2 emission is similar to the monthly average dynamic of Rs, and the cumulative CO2 emissions under P−30, CK, and P+30 treatments during the winter wheat whole growth period were 406.37, 372.58, and 383.59 g C m−2, respectively (Table 1).

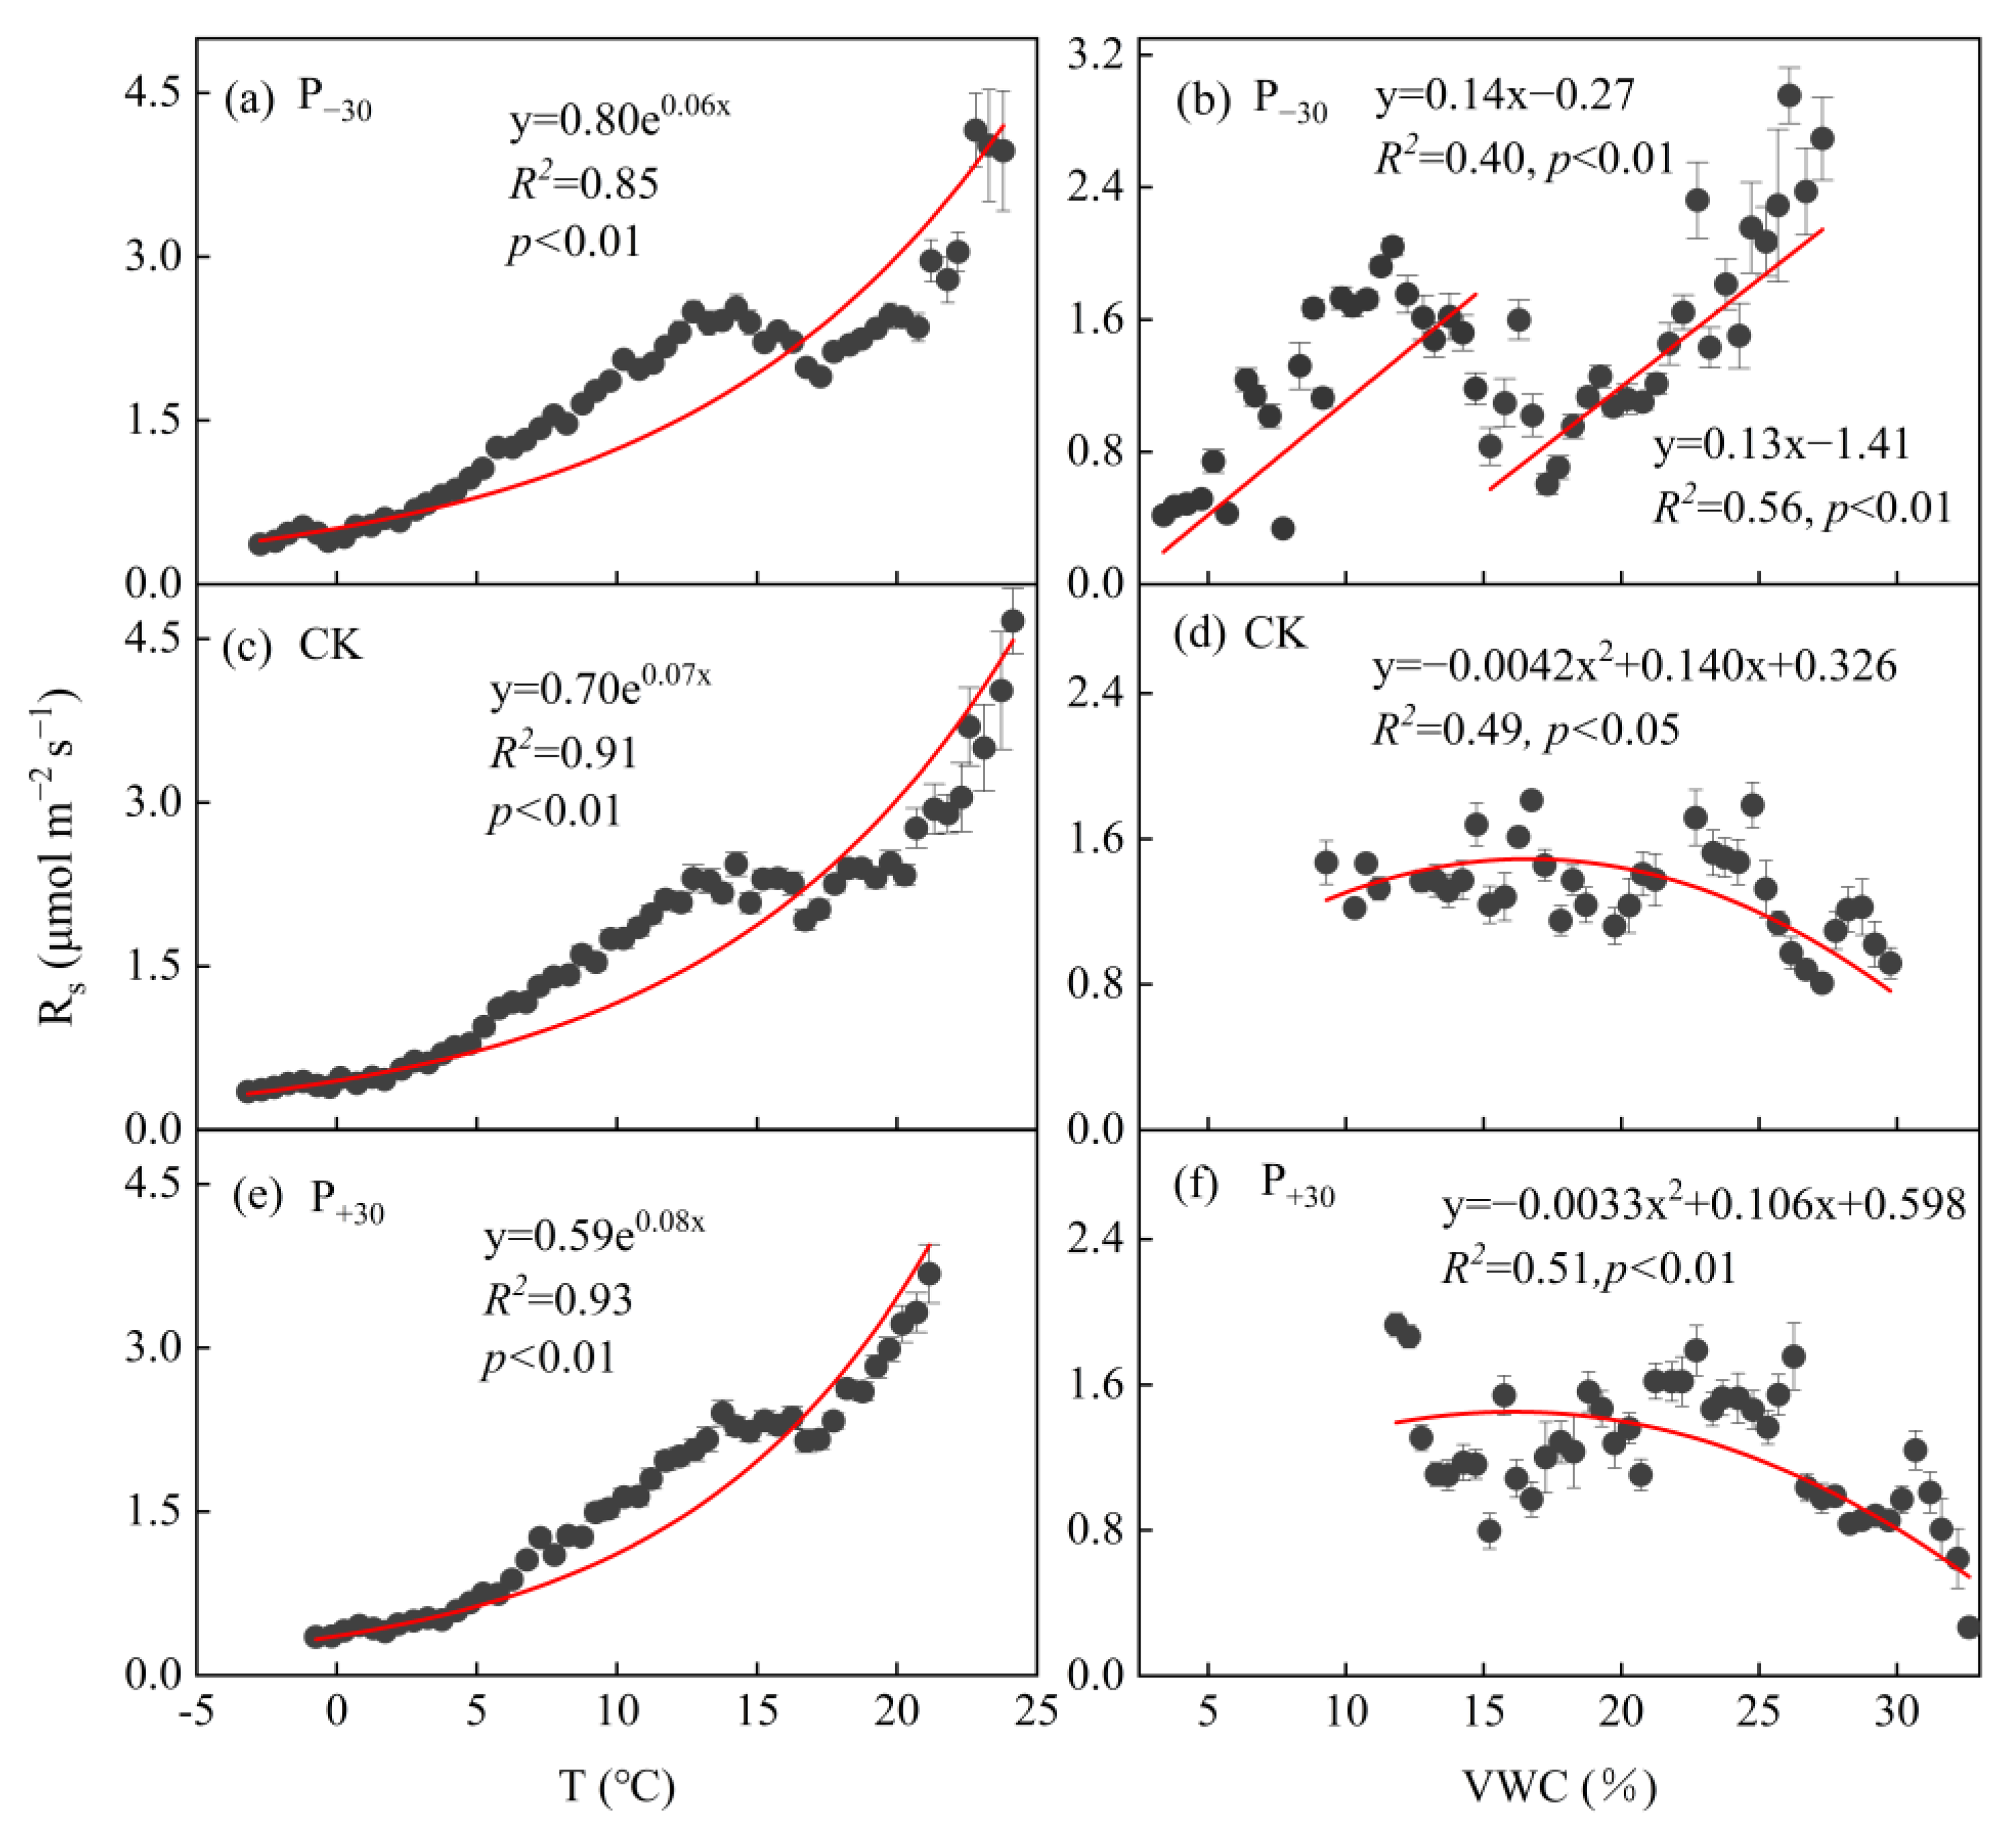
3.2. Relationships between Rs and Ts, VWC

The exponential model described well the relationship between Rs and Ts (Figure 3a,c,e). Ts explained 85–93% of the seasonal variation in Rs (p < 0.01), and the R2 values increased with an increase in precipitation. Meanwhile, a quadratic model fit the relationship between soil Rs and VWC well in the CK and P+30 treatments (Figure 3d,f); VWC explained 49–51% of the seasonal variation in Rs (p < 0.05), and the response of Rs to VWC first increased and then decreased. However, the piecewise linear function described well the relationship between Rs and VWC when 15% VWC was used as the boundary in the P30 treatment (Figure 3b), and VWC explained 40% and 56% of the seasonal variation in Rs, respectively (p < 0.01). The estimated threshold of optimal soil moisture for Rs was in the range of 15.00–17.07% in the three treatments during the winter wheat whole growth period.
The application of the interactive functions for Ts and VWC explained 72–93% of the variation in seasonal Rs in the three precipitation treatments (p < 0.01, Table 2, Equations (3)–(7)). Equations (3), (4), and (6) exhibited a better representation (R2 = 85–93%) of the relationship than the single-factor functions (R2 = 84–88%) using either seasonal Ts or VWC in the P−30 and CK treatments (Figure 3 and Table 2). However, the inclusion of the VWC functions in Equations (3)–(7) did not improve the determination coefficients for seasonal Rs (R2 = 72–90%) compared with the single-factor functions using Ts (R2 = 92%).

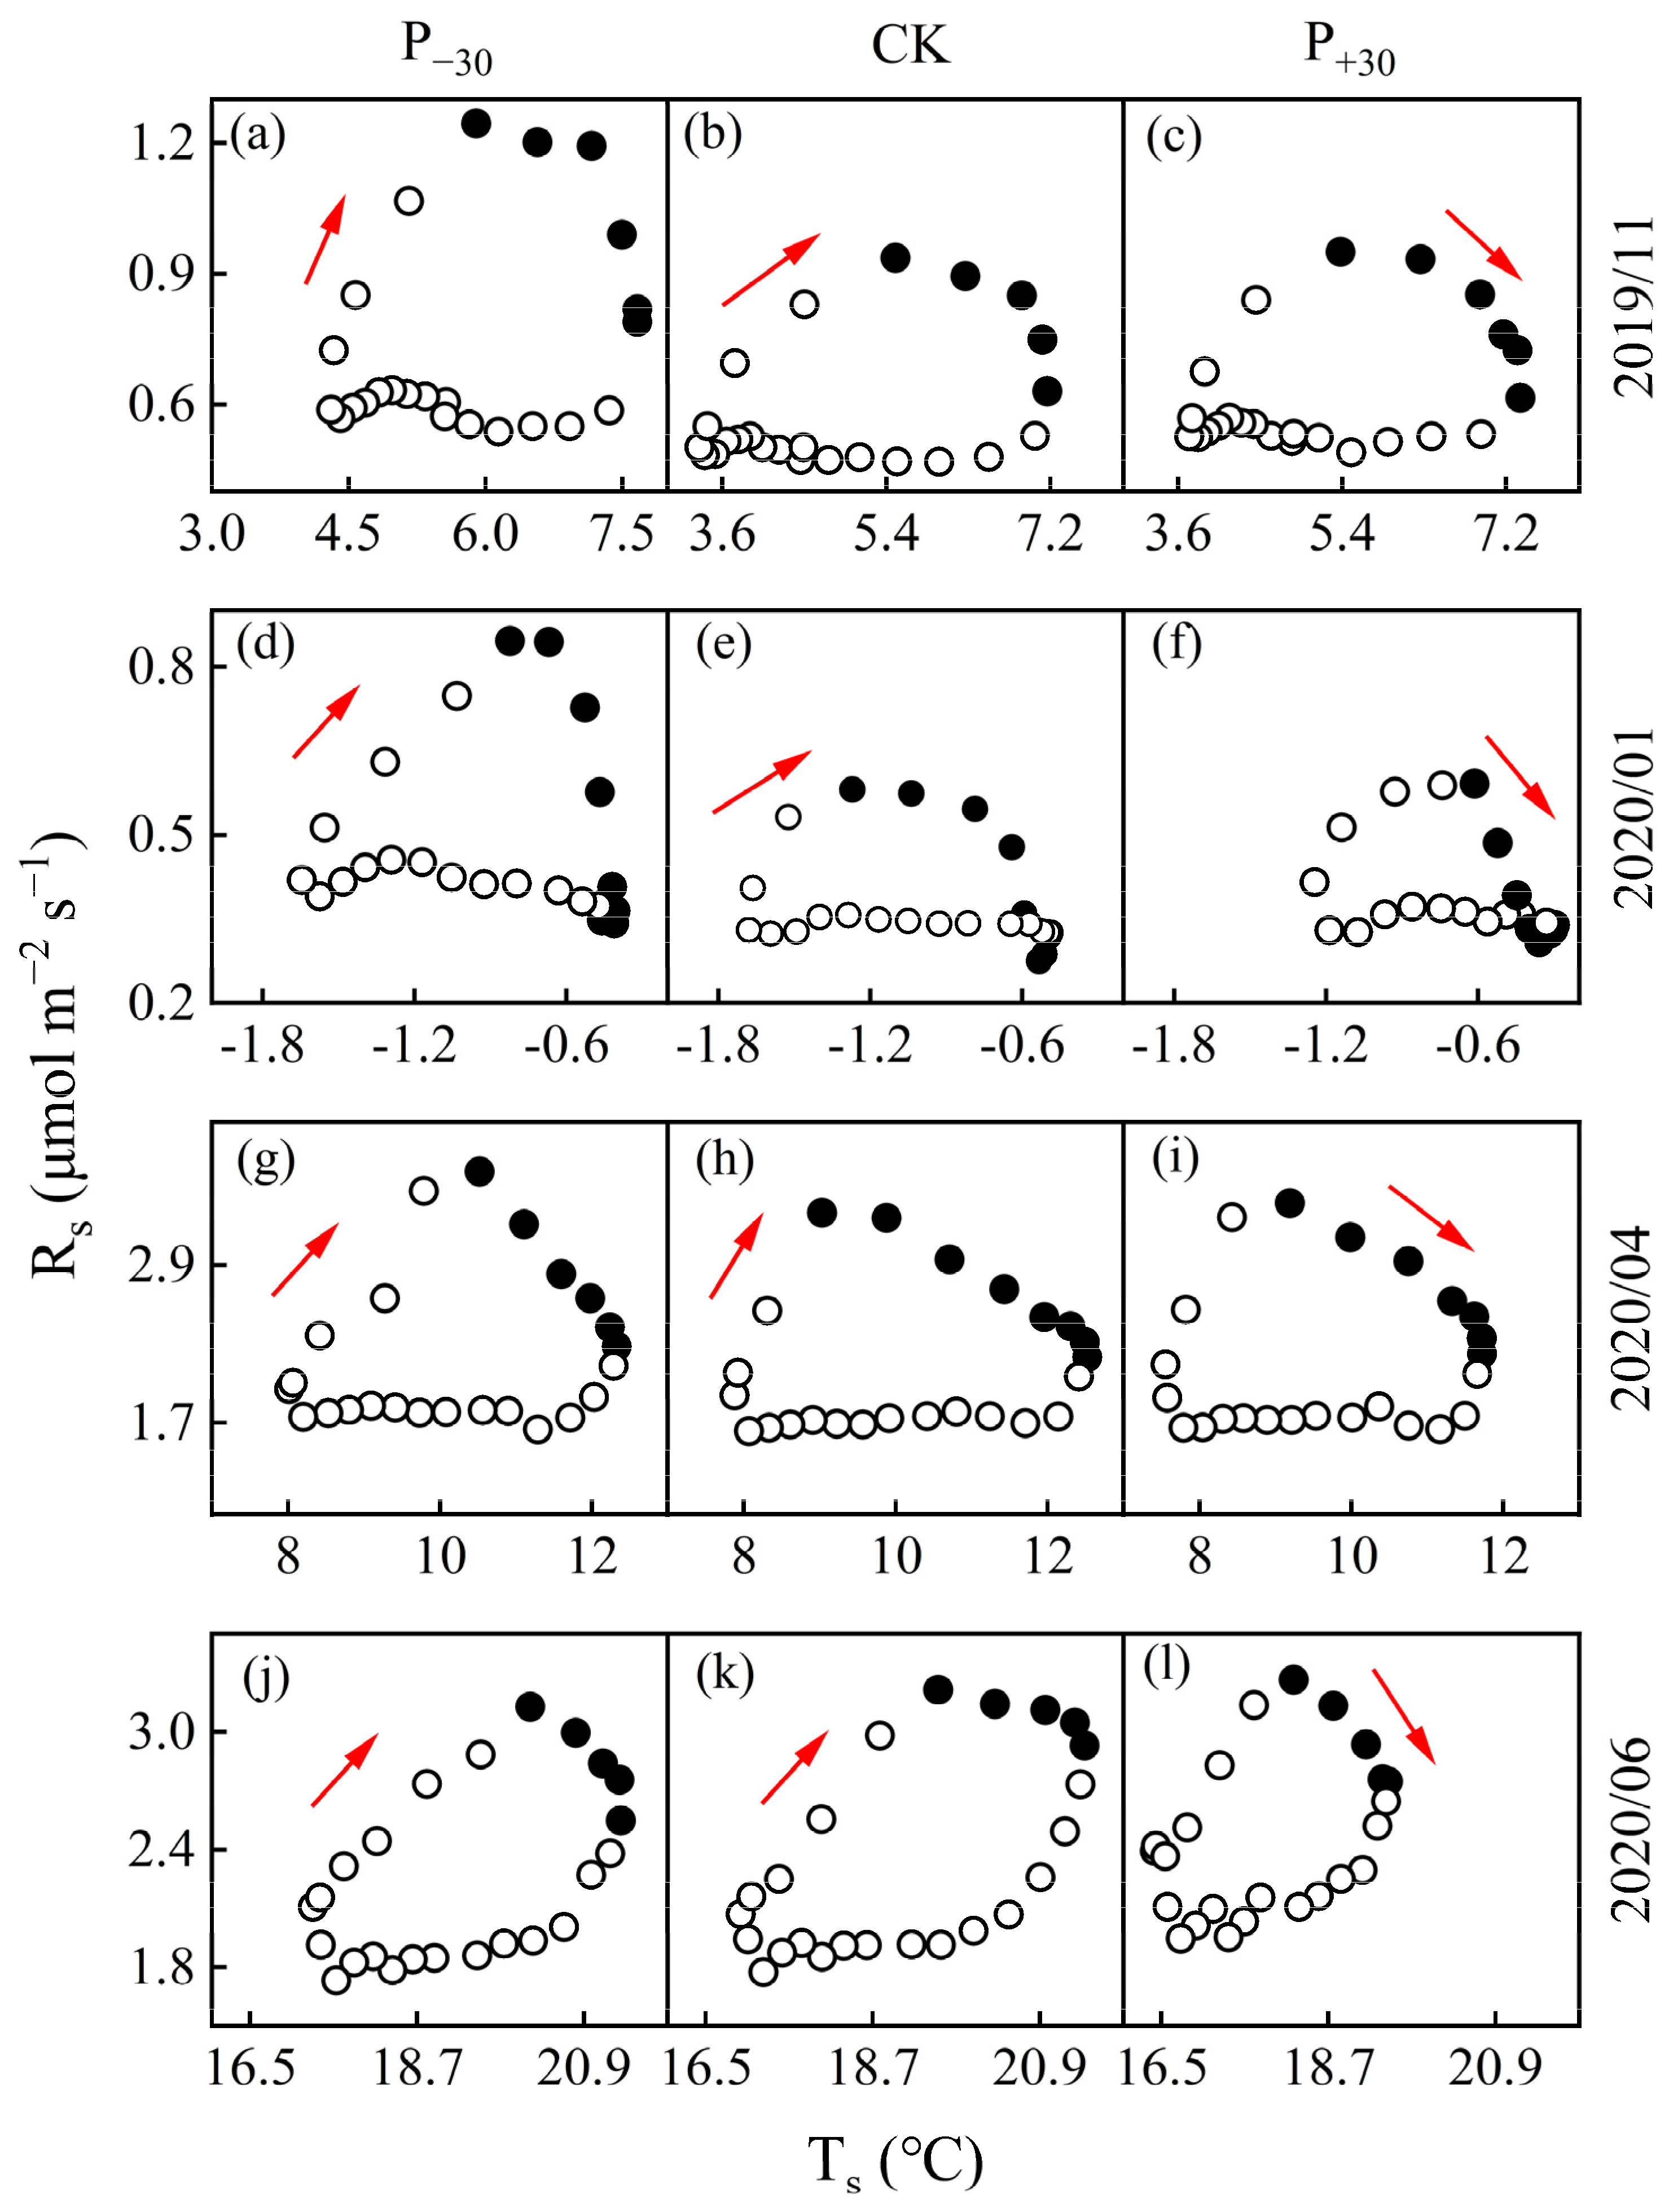
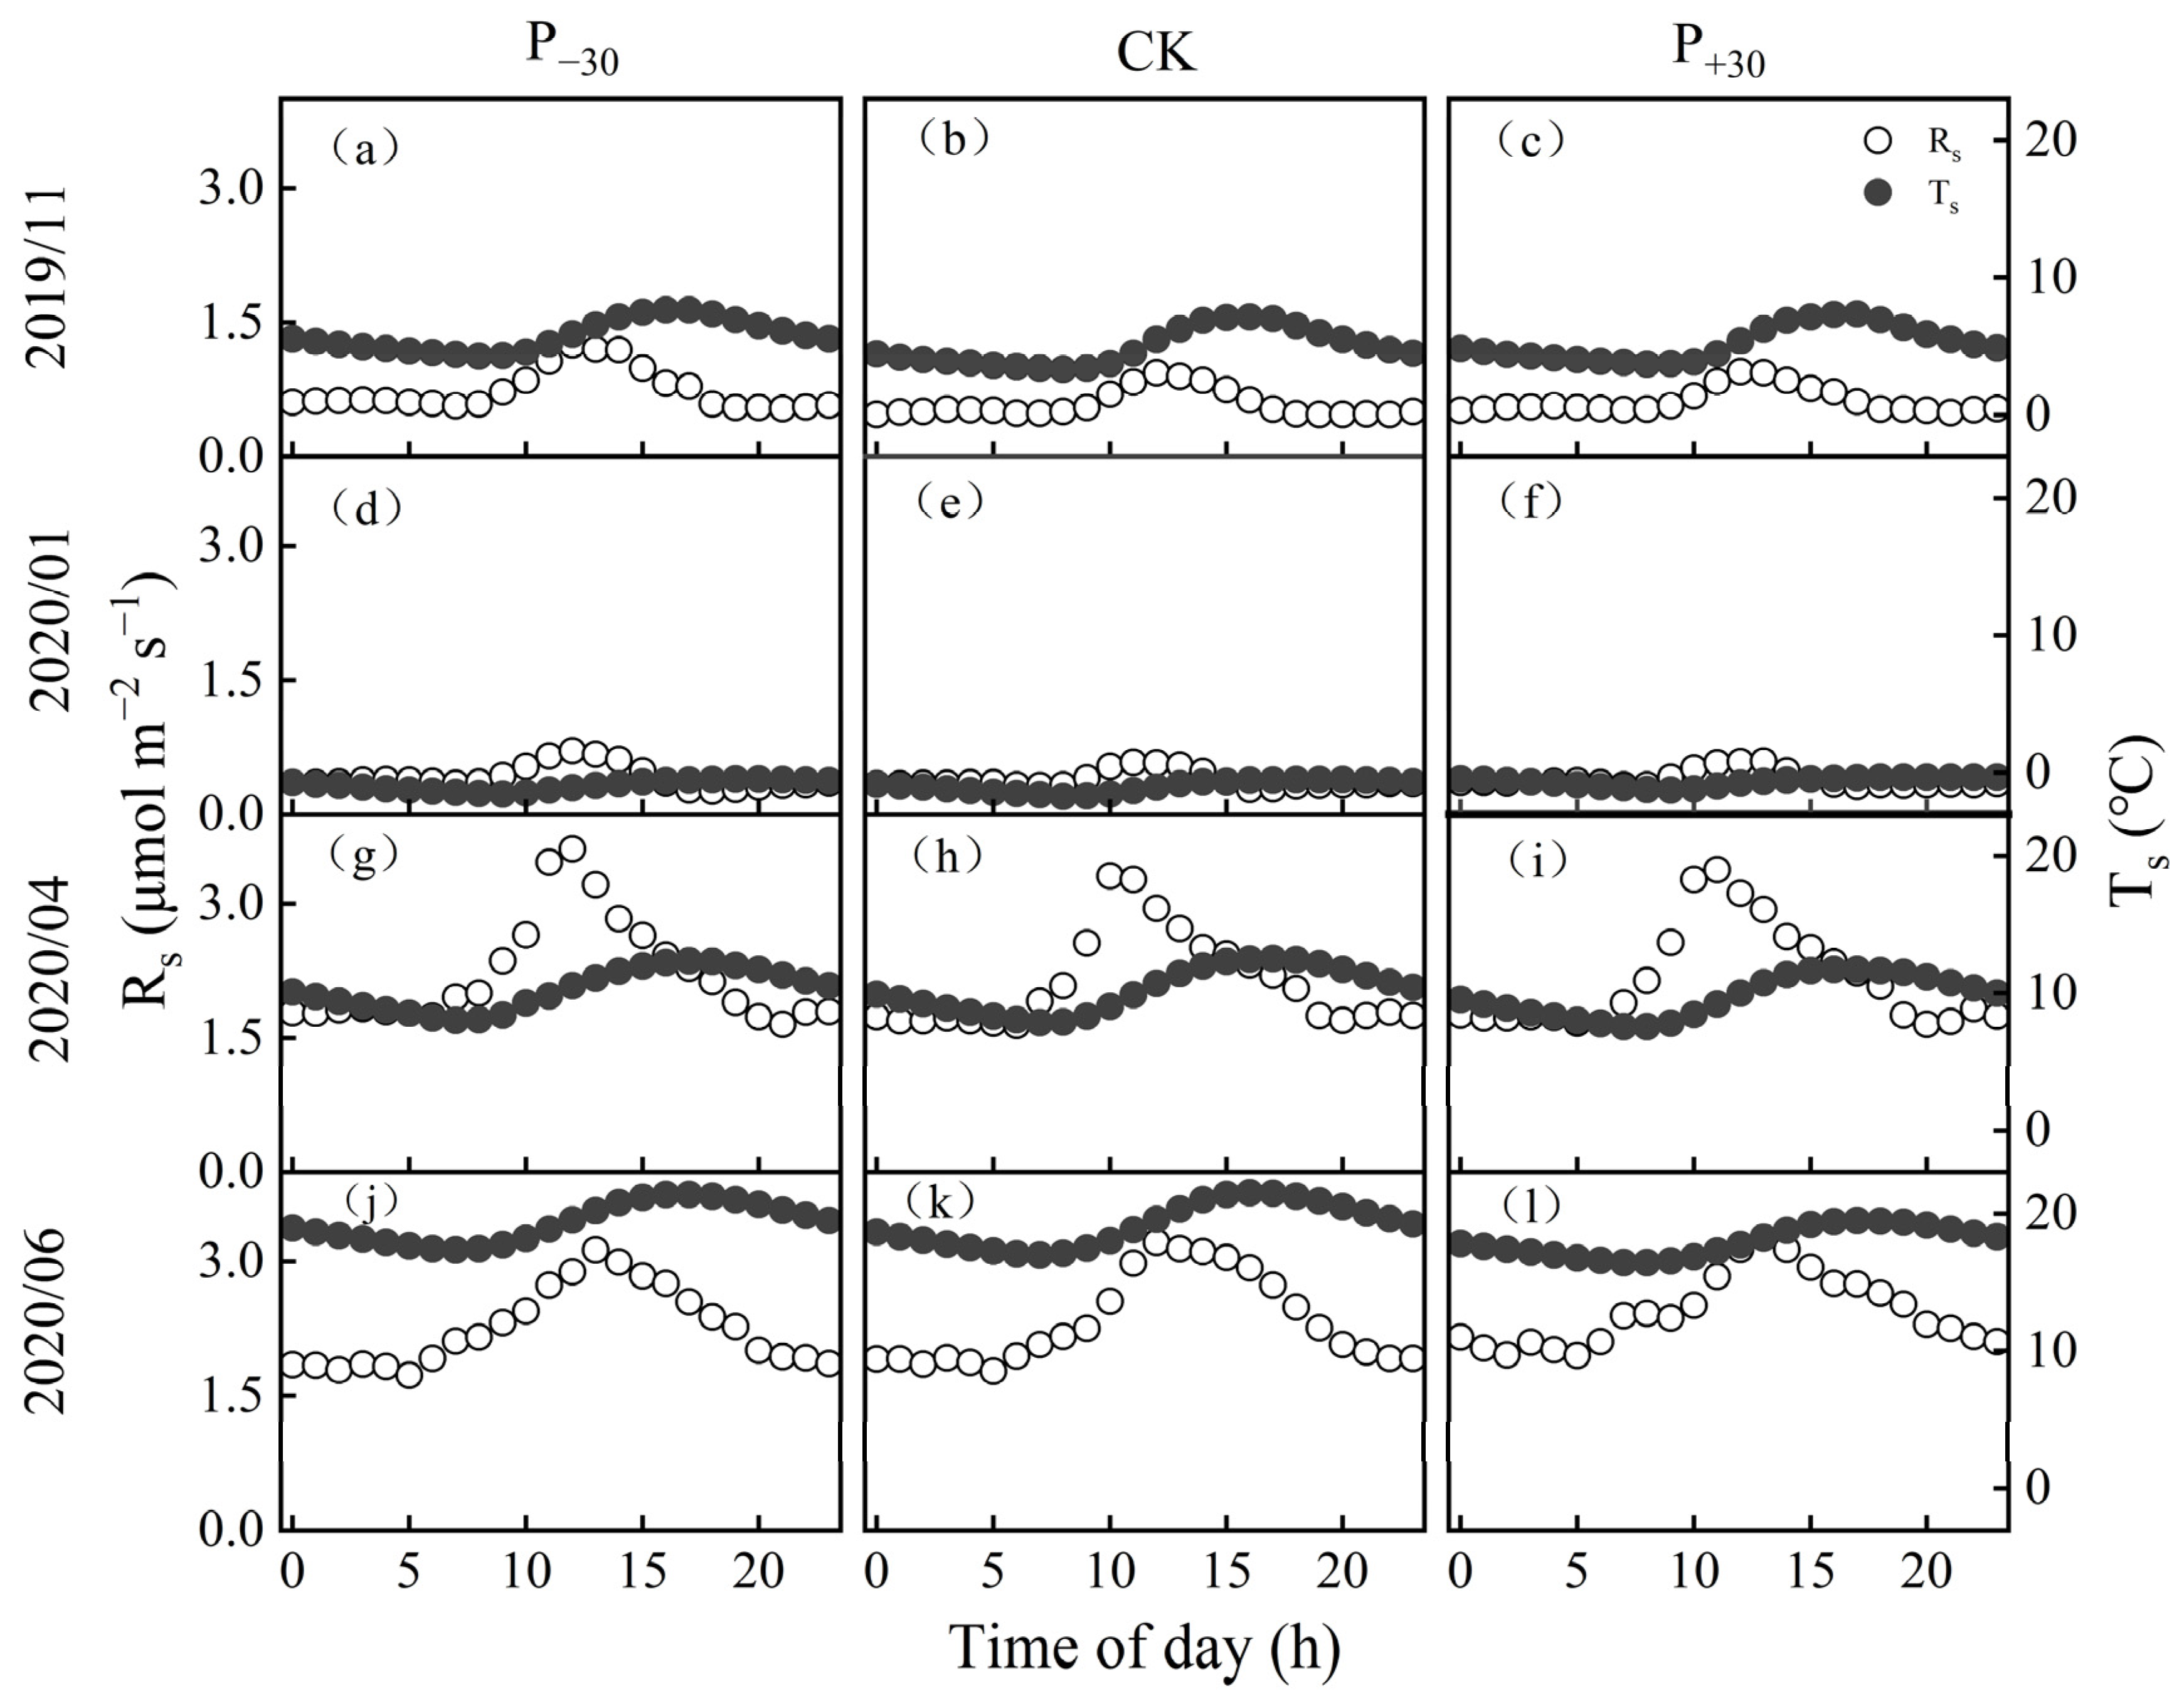
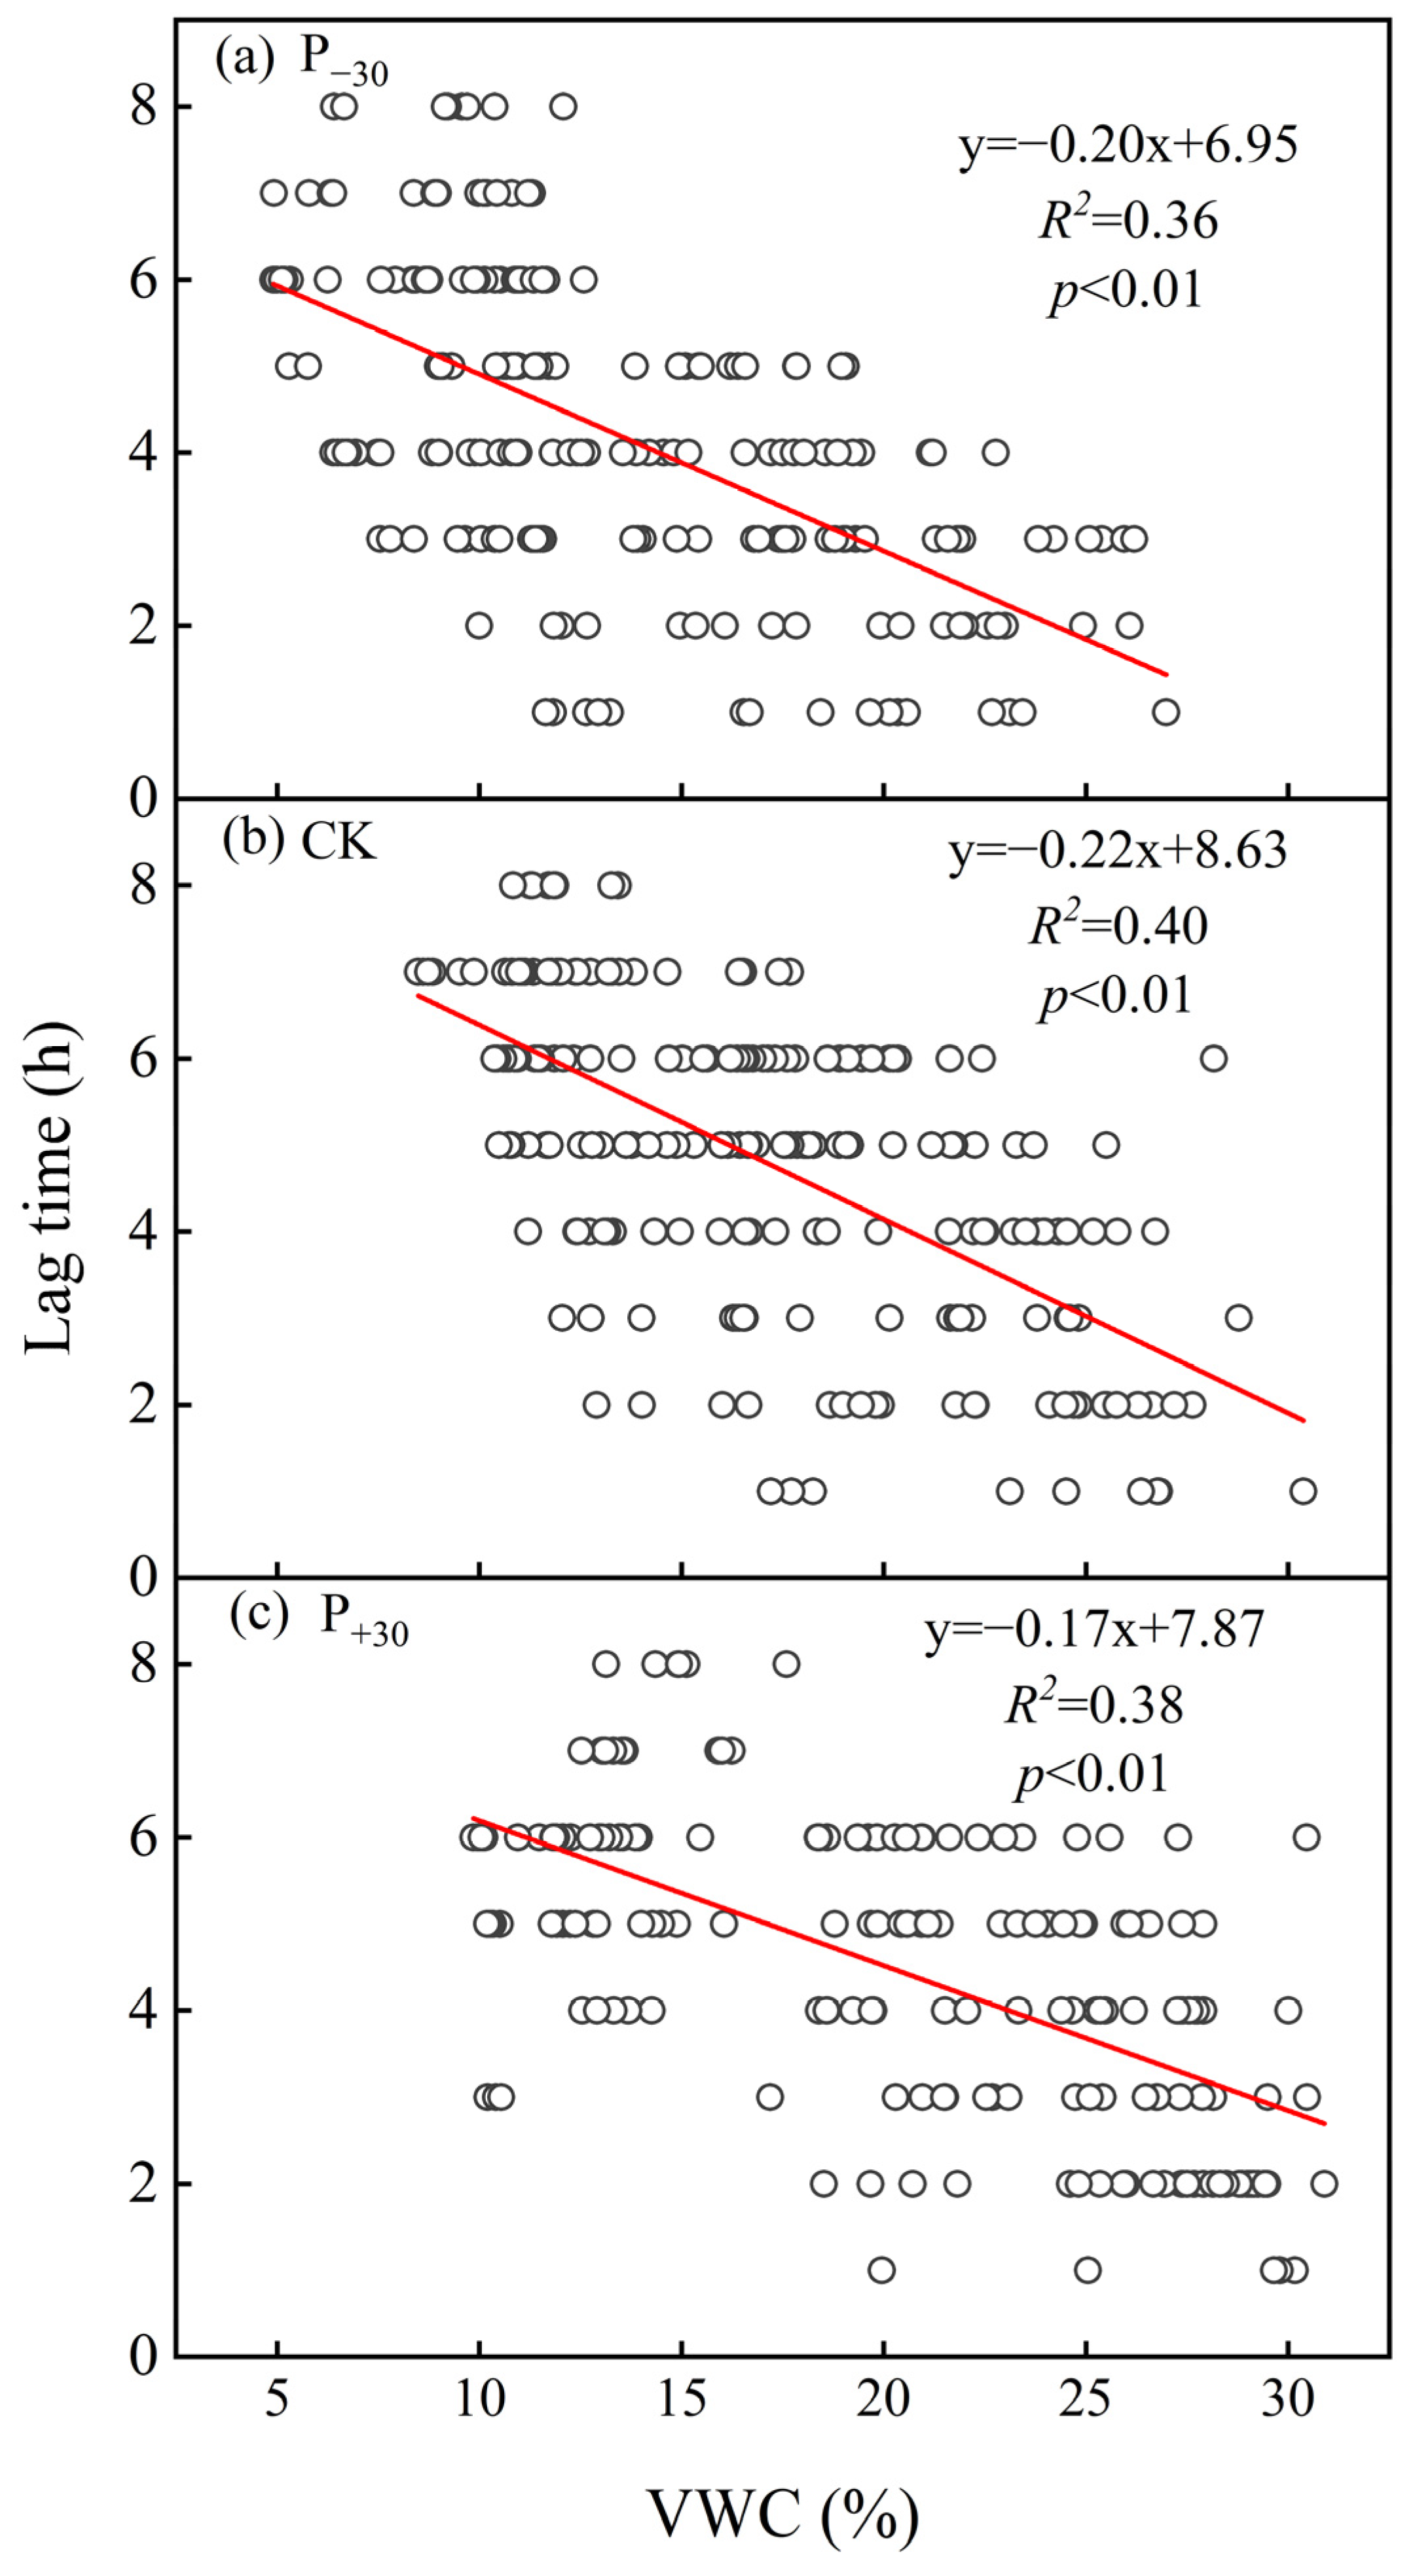
3.3. Hysteresis between Rs and Ts

There were obvious phase differences in the diurnal dynamics of the monthly average Ts and Rs of winter wheat in the three precipitation treatments. Rs consistently peaked earlier than Ts (Figure 4), as shown by the lag in the Rs-Ts relationship. In the winter wheat whole growth period, the monthly lag time increased at first and then decreased (Figure 5); it was lowest in Oct 2019 (at 1 h, 2 h, and 2 h in the P30, CK, and P+30 treatments, respectively) and highest in Jan 2020 (8 h in three treatments).
The diurnal dynamics of the monthly average Ts and Rs showed an elliptical trajectory with a rotated clockwise direction in the three treatments (Figure 5). The peak temperature difference in Rs and Ts was lowest in the P−30 treatment, which was significantly lower than those in the other treatments (p < 0.05). The seasonal lag time (between diel Rs and Ts) was negatively and linearly correlated with VWC in the three treatments during the winter wheat whole growth period (p < 0.01, Figure 6).

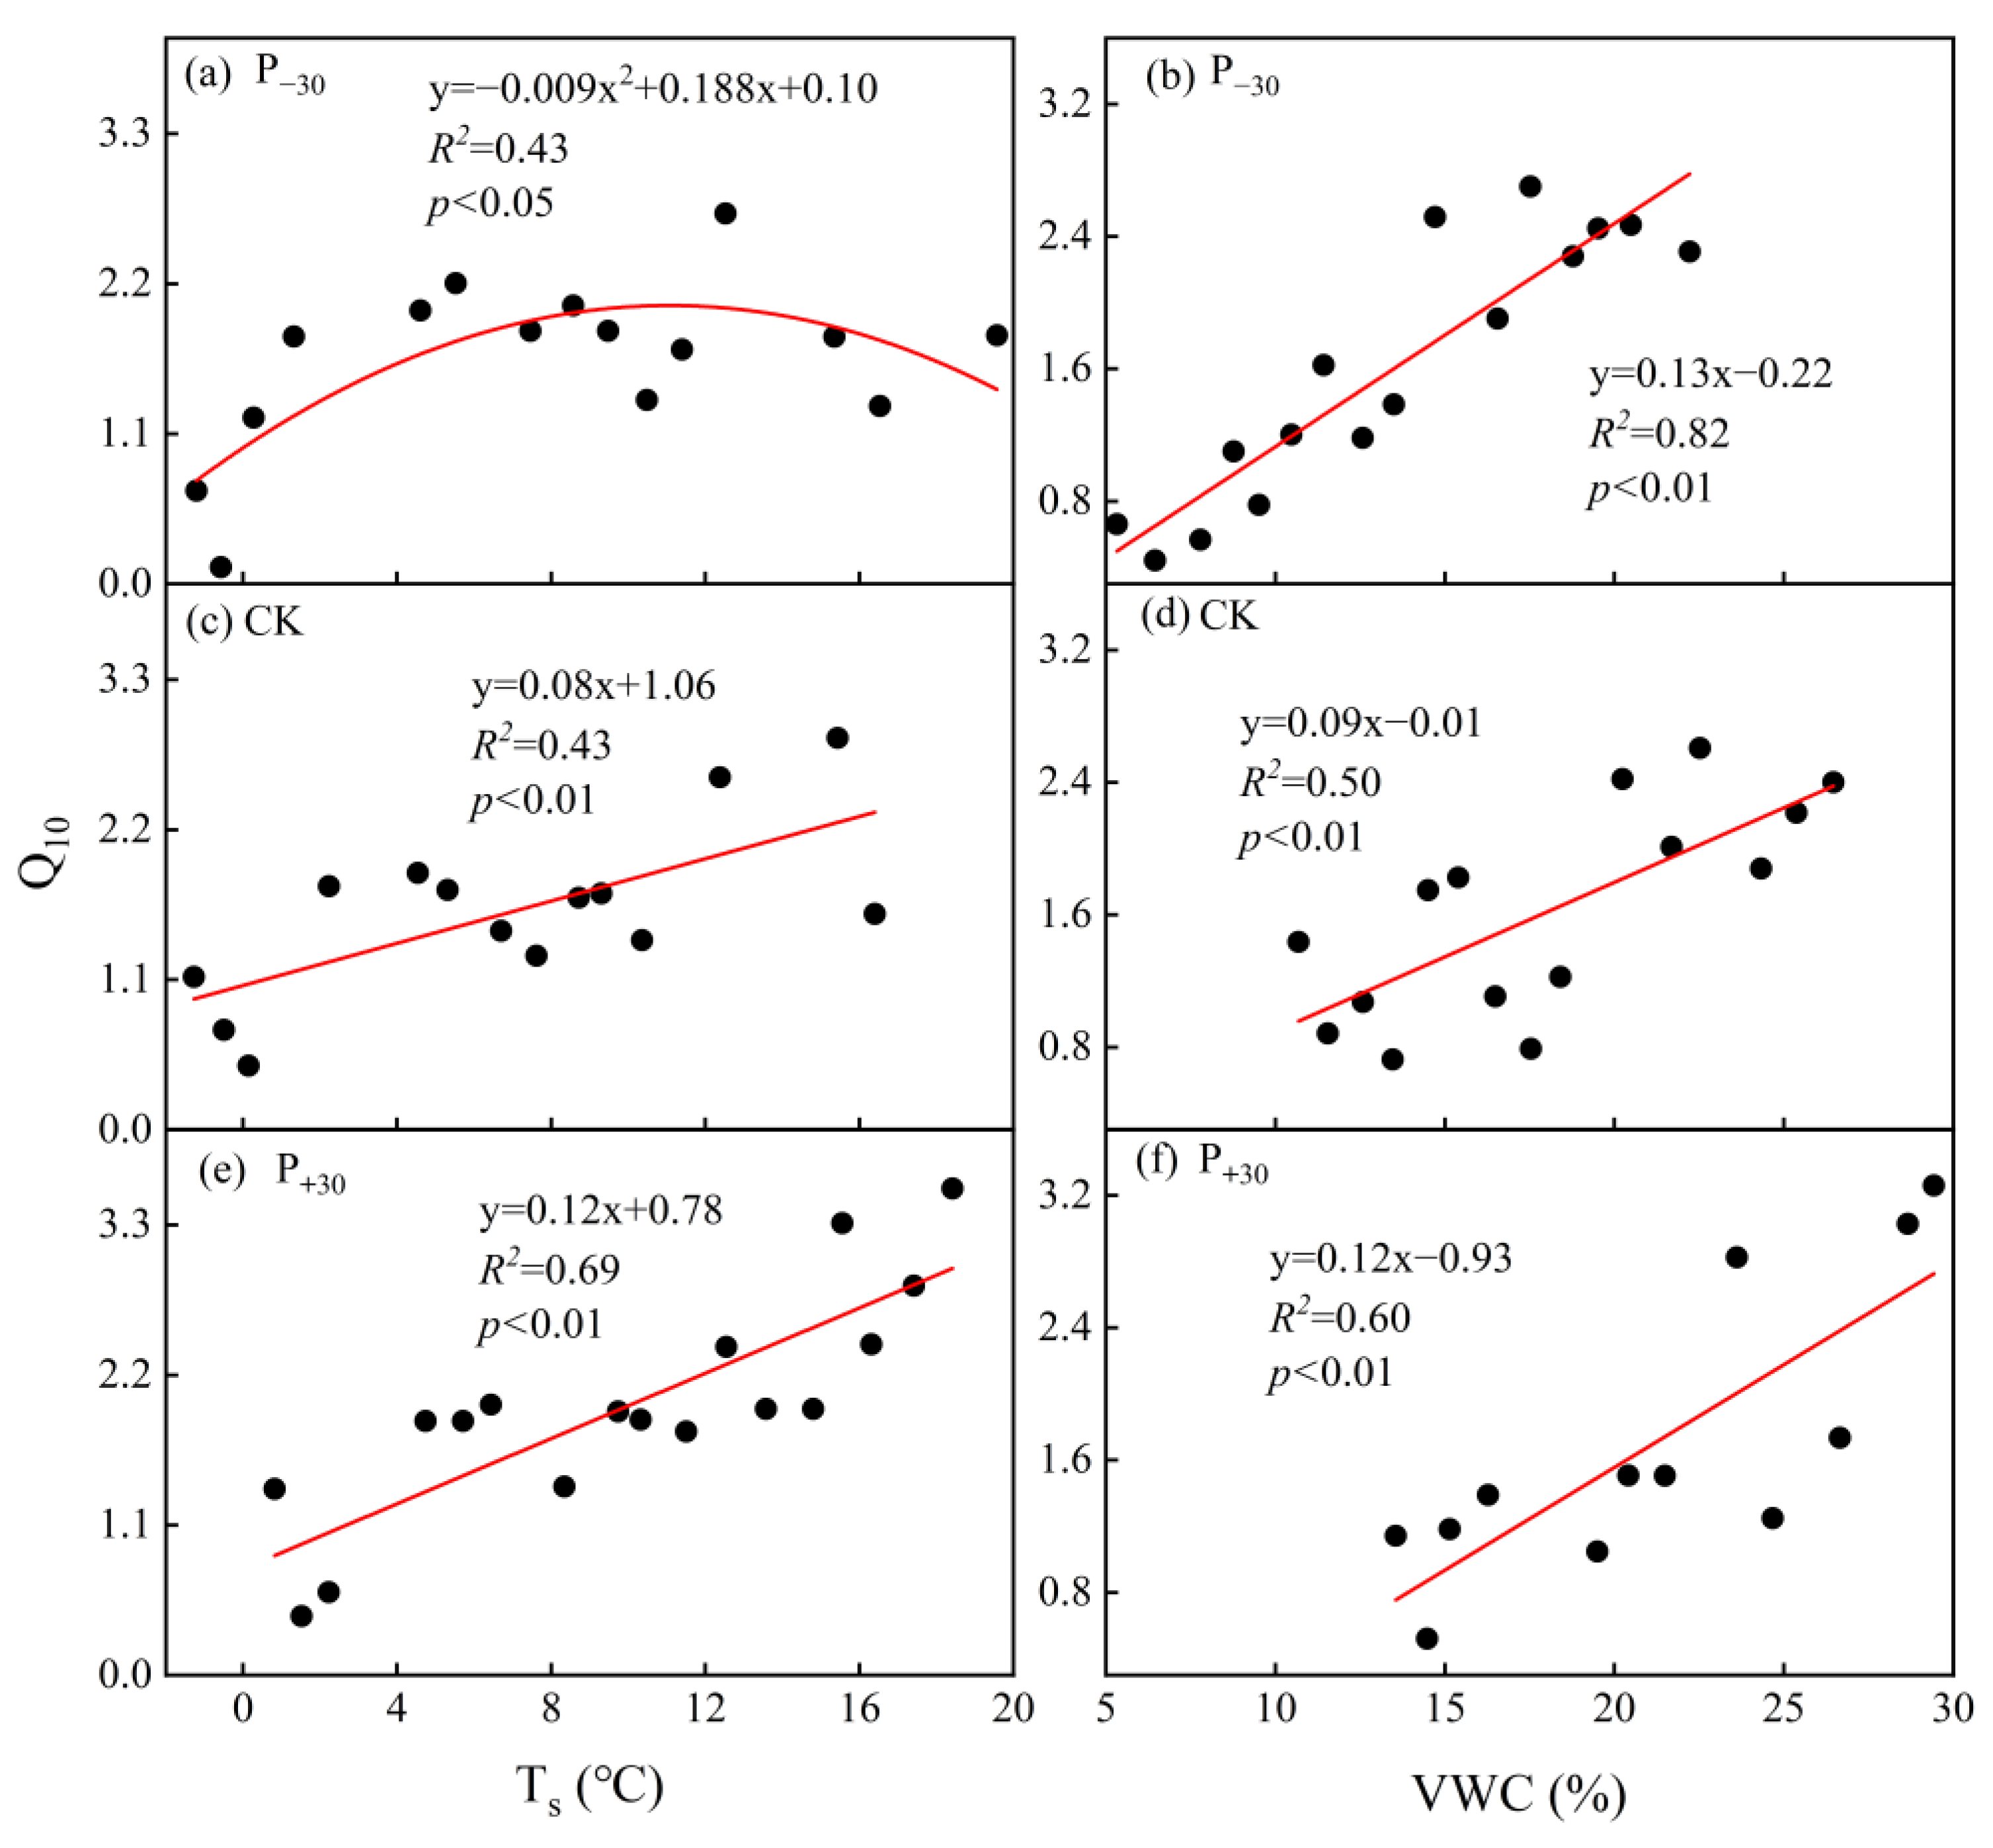
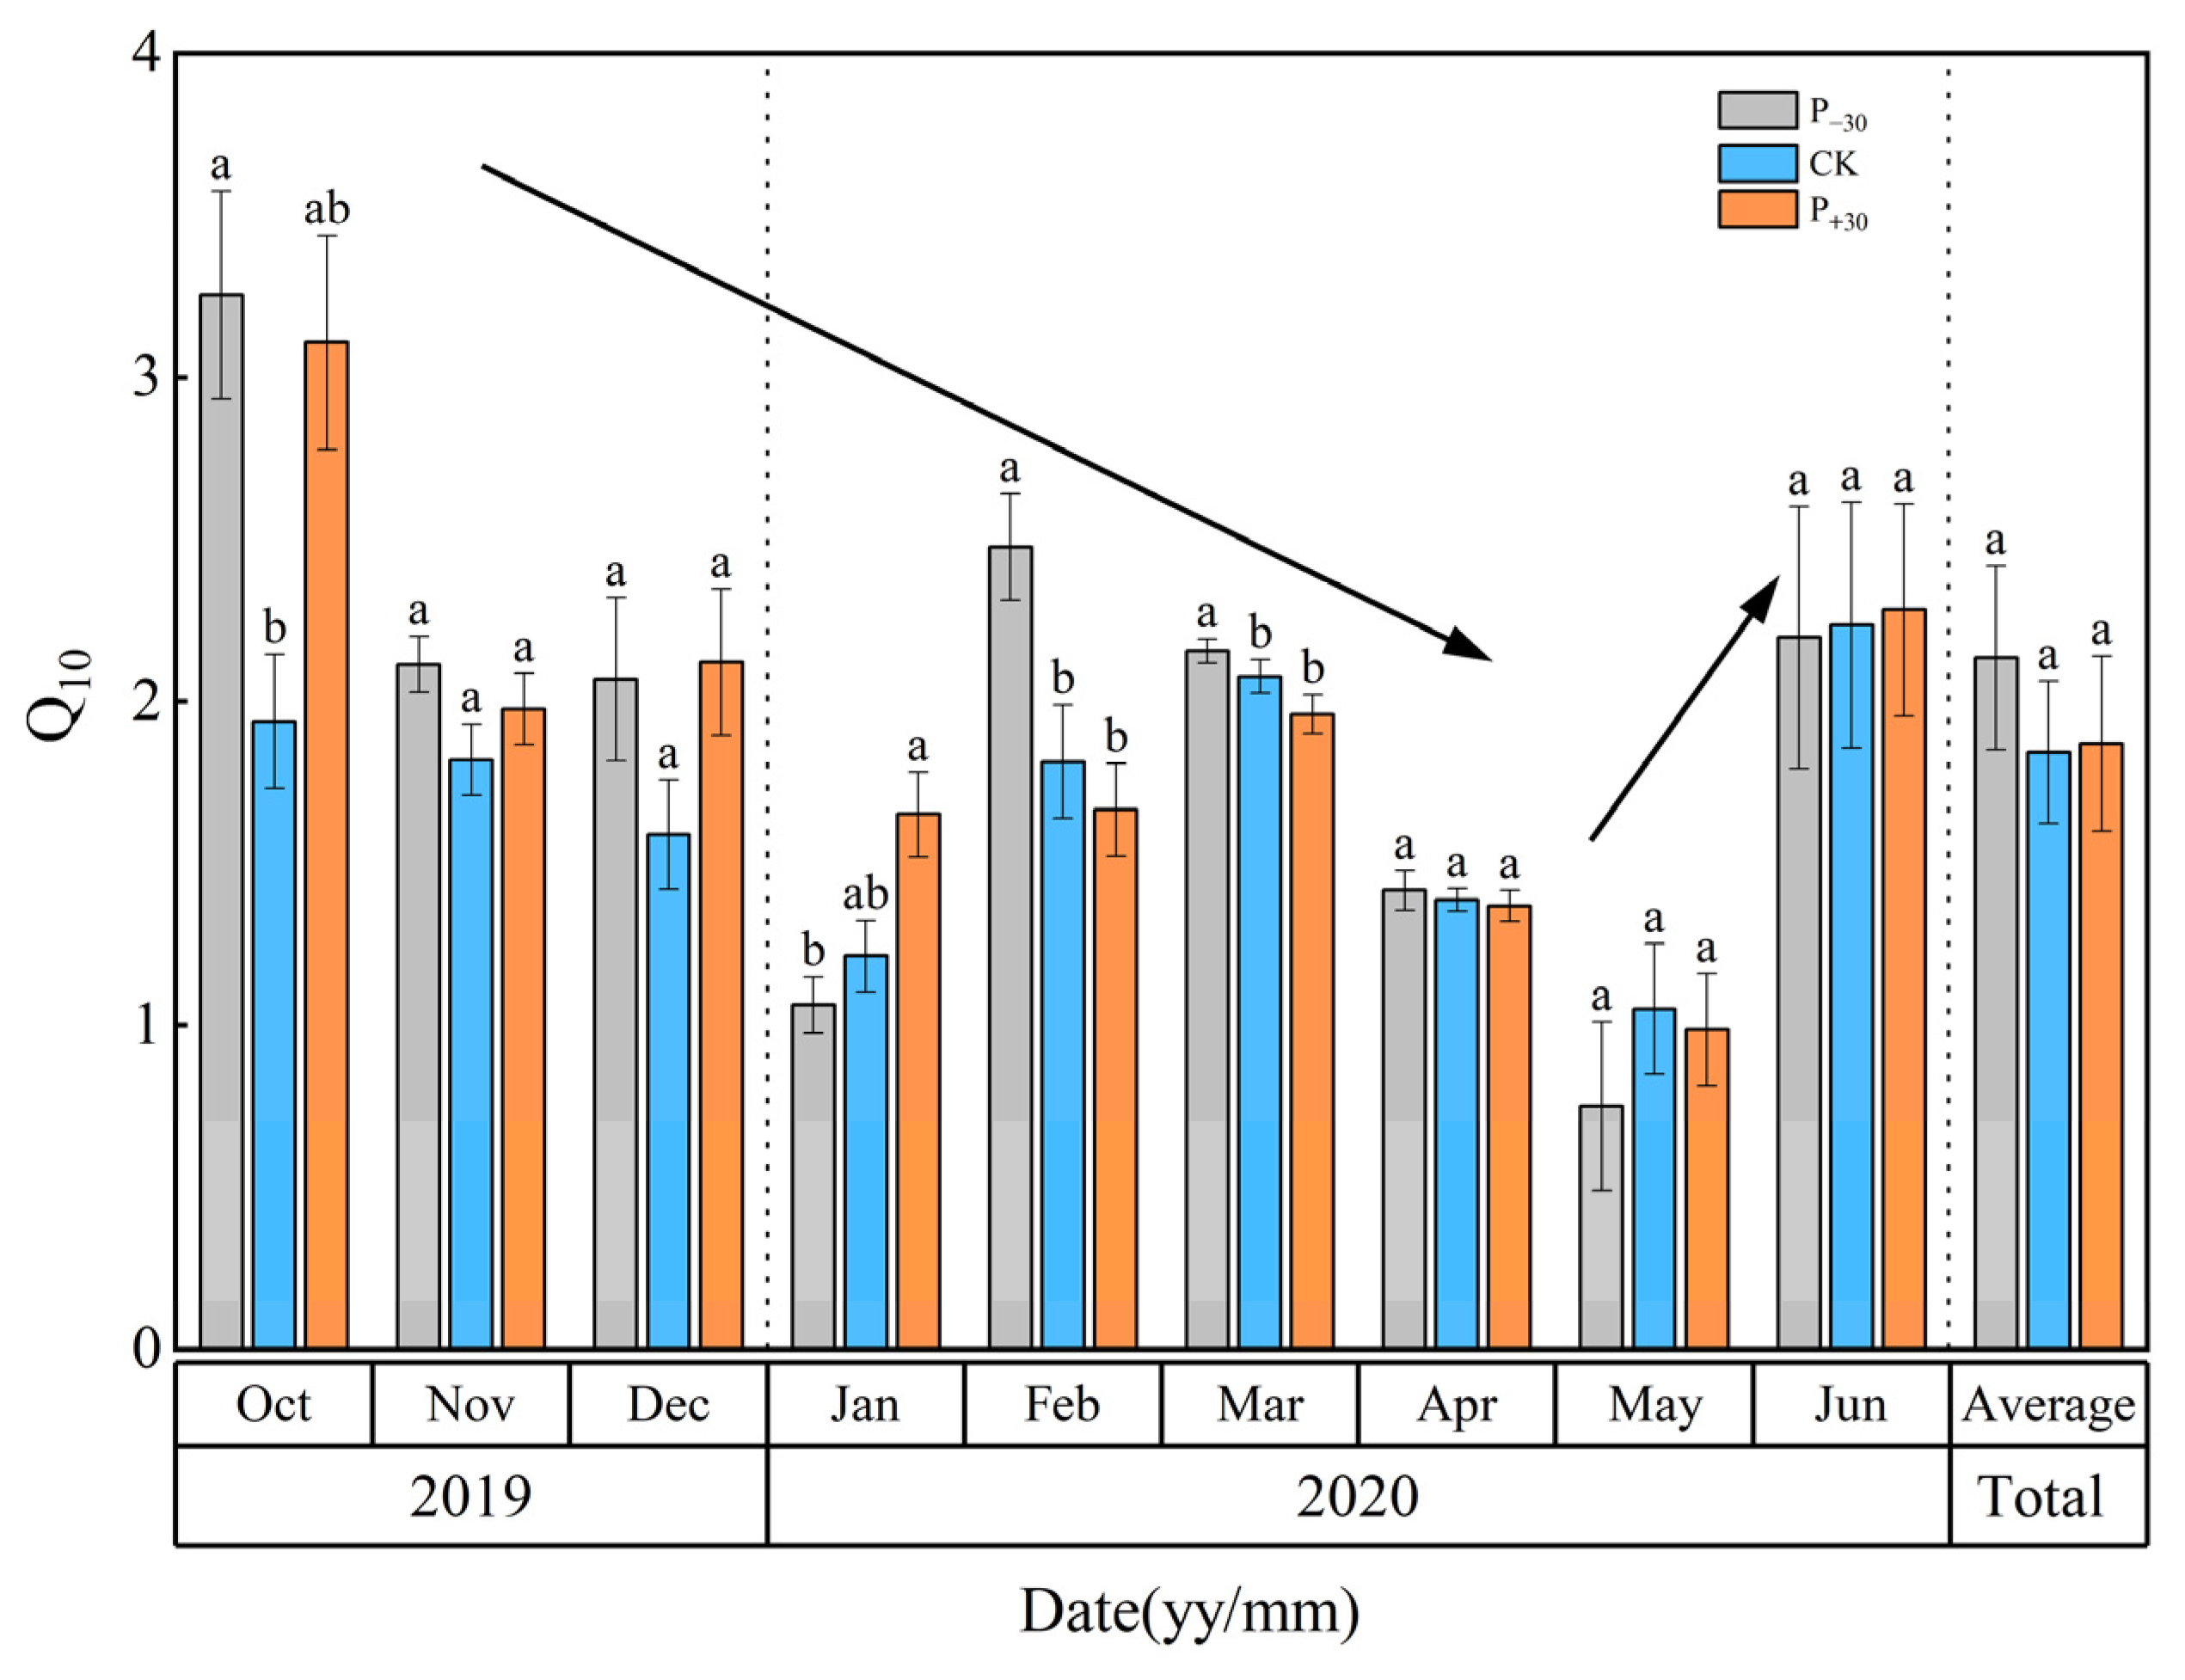
3.4. Temperature Sensitivity (Q10) of Rs

The ranges of monthly Q10 under the P−30, CK, and P+30 treatments were 0.75–3.25, 1.05–2.08, and 0.99–3.11 during the whole growth period, respectively (Figure 7). The seasonal difference in Q10 (from 1.84 to 2.14) was not significant (p > 0.05, Figure 7). The monthly Q10 decreased at first and then increased, and the lowest values (in May 2020) were 0.75, 1.05, and 0.99 in P−30, CK, and P+30 treatments, respectively.
The seasonal Q10 exhibited a negative polynomial correlation with the seasonal average Ts in the P−30 treatment, and Q10 initially increased and then decreased with Ts (Figure 8a). However, the seasonal Q10 increased with the increase in Ts in the CK and P+30 treatments (Figure 8c,e), as did the relationship between the seasonal Q10 and the VWC in the three precipitation treatments (Figure 8b,d,f).

4. Discussion

4.1. Effects of Precipitation on Rs in Winter Wheat Systems

Changes in both the distribution and amount of precipitation have significant effects on soil CO2 emissions by regulating VWC; this is especially true in rain-fed agricultural areas, where precipitation is the primary driver of biological activity [26]. Generally, an increase in VWC will increase the aboveground and underground biomass, as well as substrate concentrations of plants [5,13], thereby enhancing Rs [14]. However, a previous study also found that a decrease in VWC increased Ts and then increased Rs [33]. In our study, the average Rs of the P−30 treatment was significantly higher than those of the CK and P+30 treatments during the whole growth period (Figure 2c, p < 0.05). This was mainly due to the variation between Ts and VWC in the different seasons and eventually led to the seasonal average Rs of the P−30 treatment being higher than those of other treatments [34]. For example, from January to March 2020, the VWC of the P−30 treatment was significantly lower than those of the other treatments and induced a significant increase in Ts (Figure 2a,b), while higher winter temperatures may promote microbial activity, resulting in a significant increase in Rs [35]. Therefore, the variation in the response of VWC and Ts to the precipitation in different seasons may be the main reasons for the differing responses of Rs to VWC [34].
Similar to the pattern of seasonal average Rs, the cumulative CO2 emissions during the winter wheat whole growth period were 406.37, 372.58, and 383.59 g C m−2 under the three precipitation treatments, respectively (Table 1), which is consistent with the study of irrigation gradient in Northwest China (cumulative CO2 emissions ranged from 335 to 448 g C m−2 season−1) [36], but lower than the study in the North China Plain (cumulative CO2 emissions ranged from 548.0 to 979.2 g C m−2 season−1) [37]. These differences may be due to the higher average annual temperature and rainfall in the North China Plain than in the Loess Plateau.

4.2. Responses of Rs to Ts and VWC Coupling to Precipitation Variation

Soil temperature (Ts) is the most important environmental factor controlling the seasonal variation in soil respiration [38,39]. Higher Ts can increase the production of root exudates; this accelerates the decomposition rate of the substrate by microorganisms, which further increases Rs [14]. Our results showing that Rs had an extremely significant exponential correlation with Ts in the three precipitation treatments (p < 0.01, Figure 3a,c,e) and that the R2 values increased with precipitation (from 85% to 93%) are in line with previous studies [35,40]. In addition to Ts, the VWC is an important environmental factor affecting seasonal soil CO2 emissions [14]. In rain-fed agricultural areas, precipitation is the primary driver changing the VWC and regulating biological activity [26,40]. Many studies have shown that the response of Rs to VWC increases at first and then decreases and that there is a VWC threshold [29,41]. This is mainly due to a low VWC triggering cell dehydration and soil microbial death; this reduces microbial biomass and plant biomass, causing lower substrate concentrations and weakened organic matter mineralization and, therefore, a decrease in Rs [5,14]. If this threshold is exceeded, increasing soil moisture may cause soil pore saturation, increase the leaching of soluble matter, and inhibit the activities of microorganisms and roots, thus inhibiting Rs [41,42]. In this study, there was a significant correlation between the VWC and Rs, and Rs increased at first and then decreased with the VWC in the CK and P+30 treatments (Figure 3d,f, p < 0.05). The threshold of the optimal VWC for Rs was approximately 15.00–17.07% in the three treatments, which is consistent with the results of Tan [41]. However, the piecewise linear function described well the relationship between Rs and the VWC when 15% VWC was used as the boundary in the P30 treatment (Figure 3b), and the response of Rs to the VWC showed a bimodal trend with a mean threshold above 17.07%. The coupling of the legacy and priming effects of precipitation can explain this phenomenon. Rs mainly occurs in surface soils [43], and the lower the VWC of the soil layer, the higher the threshold of precipitation that triggers the Rs response [30]. After one year of the precipitation variation treatment (Oct 2019) (Figure 3a), the soil moisture profile at 0–100 cm in the soil P30 treatment was significantly lower than those in the CK and P+30 treatments (Figure S1); this resulted in the accumulation of substrates such as dissolved organic carbon (DOC) [44]. The physical replacement of CO2 from soil pores after the precipitation event may have contributed to the higher CO2 efflux under drier conditions, while soil rewetting would have promoted the dissolution of the substrate, accelerated root growth due to microbial metabolism activity [5,44], and exacerbated the effect of water restriction on CO2 emissions under drought, resulting in a more sensitive response of Rs to precipitation under the P30 treatment [14,45].
Compared with the influence of a single factor, there was a stronger synergistic effect of the relationship between Ts and VWC on Rs. On the one hand, changes in soil water content have a significant impact on Ts [33]; on the other hand, the soil water content can enhance the effect of Rs on Ts [16]. Therefore, a bivariate model (that includes both Ts and VWC) can be used to evaluate the changing trend of Rs more accurately [16]. In this study, the application of interactive functions of Ts and VWC (Equations (3), (4) and (6)) explained 85–93% of the variation in soil respiration in the P−30 and CK treatments (Figure 3 and Table 2), and these functions had higher R2 values than the single-factor functions (R2 = 84–88%). However, the inclusion of the VWC function in Equations (3)–(7) did not improve the determination coefficients of Rs (R2 = 72–90%) compared with those of the single-factor functions using Ts (R2 = 92%) in the P+30 treatment. This may be attributed to the decoupling of soil moisture from Ts under high-moisture (not water-limited) conditions [5,11], supports our second hypothesis.

4.3. The Response of Diel Hysteresis to Precipitation

The daily hysteresis between Rs and Ts is one of the uncertainty factors in soil carbon flux simulation models and has received increasing attention [46]. Across the diurnal cycles, our results show a significant hysteresis between the hourly Rs and Ts at 10 cm depth, with Rs peaking earlier than Ts (Figure 4). Similar hysteresis relationships between diurnal Rs and Ts have also been observed in other ecosystems [47,48]. Conversely, studies on an oak-grass savanna [12], mixed conifer and oak forest [49], and wheat fields [50] reported that Ts peaked earlier than Rs; this discrepancy may be due to the variation in the hysteresis relationship between Ts and Rs caused by the legacy effects of different ecological hydrothermal relationships [51]. Furthermore, in this study, Rs exhibited diurnal clockwise hysteresis loops with Ts in the three precipitation treatments (Figure 5). A similar hysteresis loop phenomenon has also been observed in other studies [46,52].
Both biological and physical processes may contribute to the observed diurnal hysteresis. Our study found that the seasonal lag time between the diurnal Rs and Ts was negatively correlated with the VWC in the three precipitation treatments (Figure 6), supporting our first hypothesis. A similar relationship between VWC and lag time has also been observed in desert ecosystems in northwestern China [46,53]. This may be attributed to the heat transfer rate of wet soil being faster than that of dry soil [24]; the higher water content of surface soil increases the heat transfer rate of soil and shortens the lag time between autotrophic respiration and heterotrophic respiration in the P+30 treatment. Meanwhile, increasing precipitation significantly increased the stomatal conductance, transpiration rate, and intercellular CO2 concentration of the winter wheat leaves, thus significantly increasing the photosynthetic rate (Table S1) and metabolic rate [23]; this shortened the lag time caused by photosynthetic carbon transport. This may be an explanation for the observed dynamics of seasonal lag time. From November 2019 to February 2020, no precipitation events greater than 5 mm occurred, and evapotranspiration resulted in a gradual decrease in surface VWC (Figure 1a,c). After March 2020, the gradual increase in precipitation events led to an increase in surface VWC, so the diurnal seasonality lag time first increased and then decreased (Figure 5).

4.4. The Response of Seasonal Q10 to Precipitation

Q10 not only reflects temperature sensitivity, but also integrates the responses of root biomass, litter input, water conditions, and unknown variables [19]. A small error in Q10 may lead to large inaccuracies in carbon dynamic estimations [54]. Generally, Ts and VWC are the most important abiotic factors affecting Q10. In our study, there was a positive correlation between seasonal Q10 and Ts in the CK and P+30 treatments (Figure 8c,e). However, the seasonal Q10 exhibited a negative polynomial correlation with seasonal average Ts in the P−30 treatment (Figure 8a). This may be attributed to the VWC being higher under CK and P+30 than under P−30 treatments (Figure 2a); the increased Ts would have favored the diffusion of the soluble substrate, which would have increased Q10 [13]. In contrast, the relatively low soil moisture environment decoupled VWC from Ts, and Q10 may be limited by VWC under drought stress, which supports hypothesis 2. An increase in Ts would have accelerated the evaporation of VWC in the surface layer when VWC exceeded the threshold under the P−30 treatment, which would have limited the utilization of soluble substrate; therefore, the response of Q10 to Ts tended to increase at first and then decrease [55].
The VWC is also an important environmental factor affecting Q10. Some studies have shown that Q10 has a negative quadratic relationship with the VWC and that the response of Q10 to the VWC increases at first and then decreases [13,17]. This phenomenon may occur due to the following reasons: first, the lower VWC may limit the supply of respiratory substrates and thus reduce Q10 [13]. Second, higher soil moisture can also reduce Q10 by limiting the diffusion rate of O2; the diffusion rate of O2 through water is much slower than that through air, and the decomposition activity of aerobic microorganisms is therefore inhibited due to hypoxia [13,42]. Unlike previous studies, we found a positive correlation between seasonal Q10 and the VWC (Figure 8b,d,f). The discrepancies from previous studies may be attributed to the fact that the VWC in this study did not reach the threshold of the Q10 slave response to the VWC. A similar response pattern has been detected in another study [18].

5. Conclusions

This manipulation experiment investigated the effect of precipitation variation on the temporal variation in Rs by recording high-frequency data in a winter wheat farmland system on the semiarid Loess Plateau of China. This study found that the response of seasonal Rs to precipitation variation was affected by the synergistic influence of the precipitation legacy and priming effects; hence, reducing rainfall significantly increased the average Rs. The cumulative CO2 emissions under P−30, CK, and P+30 treatments during the winter wheat whole growth period were 406.37, 372.58, and 383.59 g C m−2, respectively. The synergistic effects of Ts and VWC best explained the seasonal variations in Rs and Q10. However, the increase and decrease in precipitation led to the decoupling of Rs and Q10 responses to Ts and VWC, respectively. The seasonal dynamics of the diurnal lag time were significantly negatively correlated with the VWC, and the decrease in precipitation increased the threshold of the Rs response to the VWC. Clarifying the synergistic and decoupling response of Rs and Q10 to Ts and the VWC and the threshold change of Rs to the VWC under precipitation variation scenarios can benefit the prediction of the future C balances in agroecosystems in semiarid regions under climate change. To reduce the possible limitations of short-term studies, future long-term precipitation simulation studies are needed to further clarify the relationship between soil carbon emissions and precipitation variation.

Supplementary Materials

The following are available online at https://www.mdpi.com/article/10.3390/ijerph19116915/s1, Figure S1: VWC of 0–300 cm in the soil profile during sowing and harvest of winter wheat, Horizontal bars represent LSD values based on the 0.05 significance level. Table S1: Photosynthesis indexes of winter wheat in different phenological periods under precipitation variation.

Author Contributions

Data curation, H.C. and H.N.; formal analysis, H.C.; funding acquisition, Y.S.; investigation, H.N. and J.M.; methodology, H.C., H.N., J.M. and Y.S.; visualization, H.C.; writing—original draft, H.C.; writing—review and editing, J.M. and Y.S. All authors have read and agreed to the published version of the manuscript.

Funding

This research was funded the National Natural Science Foundation of China (31872416) and the Science and Technology Planning Project of Gansu Province (Technology Innovation Guidance Program, grant number 20CX9NA105).

Institutional Review Board Statement

Not applicable.

Informed Consent Statement

Not applicable.

Data Availability Statement

Not applicable.

Acknowledgments

The authors are grateful to Xingfa Lai for his help with the layout of the experimental site.

Conflicts of Interest

The authors declare no conflict of interest.

References

  1. Xu, C.; McDowell, N.G.; Fisher, R.A.; Wei, L.; Sevanto, S.; Christoffersen, B.O.; Weng, E.; Middleton, R.S. Increasing impacts of extreme droughts on vegetation productivity under climate change. Nat. Clim. Chang. 2019, 9, 948–953. [Google Scholar] [CrossRef] [Green Version]
  2. Zhang, J.J.; Ru, J.Y.; Song, J.; Li, H.; Li, X.M.; Ma, Y.F.; Li, Z.; Hao, Y.F.; Chi, Z.S.; Hui, D.F.; et al. Increased precipitation and nitrogen addition accelerate the temporal increase of soil respiration during eight-year old-field grassland succession. Glob. Change Biol. 2022, 28, 3944–3959. [Google Scholar] [CrossRef]
  3. Liu, J.; Wang, B.; Cane, M.A.; Yim, S.Y.; Lee, J.Y. Divergent global precipitation changes induced by natural versus anthropogenic forcing. Nature 2013, 493, 656–659. [Google Scholar] [CrossRef]
  4. Kuzyakov, Y. Sources of CO2 efflux from soil and review of partitioning methods. Soil Biol. Biochem. 2006, 38, 425–448. [Google Scholar] [CrossRef]
  5. Niu, F.R.; Chen, J.; Xiong, P.F.; Wang, Z.; Zhang, H.; Xu, B.C. Responses of soil respiration to rainfall pulses in a natural grassland community on the semi-arid Loess Plateau of China. Catena 2019, 178, 199–208. [Google Scholar] [CrossRef]
  6. Luo, Y.Q.; Zhou, X.H. Soil Respiration and the Environment; Elsevier Academic Press: San Diego, CA, USA, 2006. [Google Scholar]
  7. Longdoz, B.; Yernaux, M.; Aubinet, M. Soil CO2 efflux measurements in a mixed forest: Impact of chamber disturbances, spatial variability and seasonal evolution. Glob. Chang. Biol. 2000, 6, 907–917. [Google Scholar] [CrossRef]
  8. Hui, D.F.; Deng, Q.; Tian, H.Q.; Luo, Y.Q. Global Climate Change and Greenhouse Gases Emissions in Terrestrial Ecosystems. In Handbook of Climate Change Mitigation and Adaptation; Springer International Publishing: New York, NY, USA, 2021; pp. 1–54. [Google Scholar]
  9. Jassal, R.S.; Black, T.A.; Novak, M.D.; Gaumont-Guay, D.; Nesic, Z. Effect of soil water stress on soil respiration and its temperature sensitivity in an 18-year-old temperate Douglas-fir stand. Glob. Chang. Biol. 2008, 14, 1305–1318. [Google Scholar] [CrossRef]
  10. Lloyd, J.; Taylor, J.A. On the temperature dependence of soil respiration. Funct. Ecol. 1994, 8, 315–323. [Google Scholar] [CrossRef]
  11. Chang, C.T.; Sabaté, S.; Sperlich, D.; Poblador, S.; Sabater, F.; Gracia, C. Does soil moisture overrule temperature dependence of soil respiration in Mediterranean riparian forests? Biogeosciences 2014, 11, 6173–6185. [Google Scholar] [CrossRef] [Green Version]
  12. Tang, J.W.; Baldocchi, D.D.; Xu, L.K. Tree photosynthesis modulates soil respiration on a diurnal time scale. Glob. Change Biol. 2005, 11, 1298–1304. [Google Scholar] [CrossRef]
  13. Zhang, Y.J.; Guo, S.L.; Zhao, M.; Du, L.L.; Li, R.J.; Jiang, J.S.; Wang, R.; Li, N.N. Soil moisture influence on the interannual variation in temperature sensitivity of soil organic carbon mineralization in the Loess Plateau. Biogeosciences 2015, 12, 3655–3664. [Google Scholar] [CrossRef] [Green Version]
  14. Du, Y.; Wang, Y.P.; Su, F.L.; Jiang, J.; Wang, C.; Yu, M.X.; Yan, J.H. The response of soil respiration to precipitation change is asymmetric and differs between grasslands and forests. Glob. Chang. Biol. 2020, 26, 6015–6024. [Google Scholar] [CrossRef]
  15. Knapp, A.K.; Ciais, P.; Smith, M.D. Reconciling inconsistencies in precipitation-productivity relationships: Implications for climate change. New Phytol. 2017, 214, 41–47. [Google Scholar] [CrossRef] [Green Version]
  16. Zhang, Y.Y.; Zhao, W.Z.; Fu, L.; Zhao, C.; Jia, A.Y. Land use conversion influences soil respiration across a desert-oasis ecoregion in Northwest China, with consideration of cold season CO2 efflux and its significance. Catena 2020, 188, 104460. [Google Scholar] [CrossRef]
  17. Wang, C.K.; Yang, J.Y.; Zhang, Q.Z. Soil respiration in six temperate forests in China. Glob. Chang. Biol. 2006, 12, 2103–2114. [Google Scholar] [CrossRef]
  18. Zhang, L.H.; Chen, Y.N.; Zhao, R.F.; Li, W.H. Significance of temperature and soil water content on soil respiration in three desert ecosystems in Northwest China. J. Arid Environ. 2010, 74, 1200–1211. [Google Scholar] [CrossRef]
  19. Janssens, I.A.; Pilegaard, K. Large seasonal changes in Q10 of soil respiration in a beech forest. Glob. Chang. Biol. 2010, 9, 911–918. [Google Scholar] [CrossRef]
  20. Li, L.F.; Qian, R.Y.; Liu, W.J.; Wang, W.J.; Biederman, J.A.; Zhang, B.; Kang, X.M.; Wen, F.Q.; Ran, Q.W.; Zheng, Z.Z.; et al. Drought timing influences the sensitivity of a semiarid grassland to drought. Geoderma 2022, 412, 115714. [Google Scholar] [CrossRef]
  21. Jia, X.; Zha, T.S.; Wu, B.; Zhang, Y.Q.; Chen, W.J.; Wang, X.P.; Yu, H.Q.; He, G.M. Temperature response of soil respiration in a Chinese pine plantation: Hysteresis and seasonal vs. diel Q10. PLoS ONE 2013, 8, e57858. [Google Scholar] [CrossRef] [Green Version]
  22. Illeris, L.; Christensen, T.R.; Mastepanov, M. Moisture effects on temperature sensitivity of CO2 exchange in a subarctic heath ecosystem. Biogeochemistry 2004, 70, 315–330. [Google Scholar] [CrossRef]
  23. Farooq, M.; Hussain, M.; Siddique, K.H.M. Drought Stress in Wheat during Flowering and Grain-filling Periods. Crit. Rev. Plant Sci. 2014, 33, 331–349. [Google Scholar] [CrossRef]
  24. Kulkarni, N.G.; Bhandarkar, U.V.; Puranik, B.P.; Rao, A.B. Experimental determination of thermal properties of alluvial soil. Heat Mass Transf. 2016, 52, 2661–2669. [Google Scholar] [CrossRef]
  25. Fang, C.; Ye, J.S.; Gong, Y.H.; Pei, J.Y.; Yuan, Z.Q.; Xie, C.; Zhu, Y.S.; Yu, Y.Y. Seasonal responses of soil respiration to warming and nitrogen addition in a semi-arid alfalfa-pasture of the Loess Plateau, China. Sci. Total Environ. 2017, 590–591, 729–738. [Google Scholar] [CrossRef]
  26. Wang, X.C.; Li, J. Evaluation of crop yield and soil water estimates using the EPIC model for the Loess Plateau of China. Math. Comput. Model. 2010, 51, 1390–1397. [Google Scholar] [CrossRef]
  27. Zhang, H.X.; Zhou, X.P.; Lu, F.; Pang, J.Z.; Feng, Z.W.; Liu, W.Z.; Ouyang, Z.Y.; Wang, X.K. Seasonal dynamics of soil CO2 efflux in a conventional tilled wheat field of the Loess Plateau, China. Ecol. Res. 2011, 26, 735–743. [Google Scholar] [CrossRef]
  28. Wang, W.; Liao, Y.C.; Wen, X.X.; Guo, Q. Dynamics of CO2 fluxes and environmental responses in the rain-fed winter wheat ecosystem of the Loess Plateau, China. Sci. Total Environ. 2013, 461–462, 10–18. [Google Scholar] [CrossRef] [Green Version]
  29. Xu, Y.Y.; Ma, X.C.; Wang, Y.X.; Ali, S.; Cai, T.; Jia, Z.K. Effects of ridge-furrow mulching system with supplementary irrigation on soil respiration in winter wheat fields under different rainfall conditions. Agric. Water Manag. 2020, 239, 106237. [Google Scholar] [CrossRef]
  30. Zhang, F.Y.; Quan, Q.; Ma, F.F.; Tian, D.S.; Zhou, Q.P.; Niu, S.L. Differential responses of ecosystem carbon flux components to experimental precipitation gradient in an alpine meadow. Funct. Ecol. 2019, 33, 889–900. [Google Scholar] [CrossRef]
  31. Li, H.J.; Yan, J.X.; Yue, X.F.; Wang, M.B. Significance of soil temperature and moisture for soil respiration in a Chinese mountain area. Agric. For. Meteorol. 2008, 148, 490–503. [Google Scholar] [CrossRef]
  32. Shi, W.Y.; Yan, M.J.; Zhang, J.G.; Guan, J.H.; Du, S. Soil CO2 emissions from five different types of land use on the semiarid Loess Plateau of China, with emphasis on the contribution of winter soil respiration. Atmos. Environ. 2014, 88, 74–82. [Google Scholar] [CrossRef]
  33. Li, L.F.; Qian, R.Y.; Wang, W.J.; Kang, X.M.; Ran, Q.W.; Zheng, Z.Z.; Zhang, B.; Xu, C.; Che, R.X.; Dong, J.F.; et al. The intra- and inter-annual responses of soil respiration to climate extremes in a semiarid grassland. Geoderma 2020, 378, 114629. [Google Scholar] [CrossRef]
  34. Yang, Z.L.; Wei, Y.Y.; Fu, G.Y.; Song, H.Q.; Li, G.Y.; Xiao, R. Asymmetric effect of increased and decreased precipitation in different periods on soil and heterotrophic respiration in a semiarid grassland. Agric. For. Meteorol. 2020, 291, 108039. [Google Scholar] [CrossRef]
  35. Yu, C.L.; Hui, D.F.; Deng, Q.; Kudjo Dzantor, E.; Fay, P.A.; Shen, W.J.; Luo, Y.Q. Responses of switchgrass soil respiration and its components to precipitation gradient in a mesocosm study. Plant Soil 2017, 420, 105–117. [Google Scholar] [CrossRef]
  36. Guo, Y.; Yin, W.; Chai, Q.; Fan, Z.L.; Hu, F.L.; Fan, H.; Zhao, C.; Yu, A.Z.; Coulter, J.A. No tillage with previous plastic covering increases water harvesting and decreases soil CO2 emissions of wheat in dry regions. Soil Till. Res. 2021, 208, 104883. [Google Scholar] [CrossRef]
  37. Li, Z.X.; Zhang, Q.Y.; Qiao, Y.F.; Du, K.; Li, Z.; Tian, C.; Zhu, N.; Leng, P.F.; Yue, Z.W.; Cheng, H.F.; et al. Influence of straw mulch and no-tillage on soil respiration, its components and economic benefit in a Chinese wheat–maize cropping system. Glob. Ecol. Conserv. 2022, 34, e02013. [Google Scholar] [CrossRef]
  38. Luo, Y.Q.; Wan, S.Q.; Hui, D.F.; Wallace, L.L. Acclimatization of soil respiration to warming in a tall grass prairie. Nature 2001, 413, 622–625. [Google Scholar] [CrossRef]
  39. Lin, Z.B.; Zhang, R.D.; Tang, J.; Zhang, J.Y. Effects of High Soil Water Content and Temperature on Soil Respiration. Soil Sci. 2011, 176, 150–155. [Google Scholar] [CrossRef]
  40. Hu, Z.H.; Towfiqul Islam, A.R.M.; Chen, S.T.; Hu, B.B.; Shen, S.H.; Wu, Y.Z.; Wang, Y.P. Effects of warming and reduced precipitation on soil respiration and N2O fluxes from winter wheat-soybean cropping systems. Geoderma 2019, 337, 956–964. [Google Scholar] [CrossRef]
  41. Tan, S.Y.; Ni, X.Y.; Yue, K.; Liao, S.; Wu, F.Z. Increased precipitation differentially changed soil CO2 efflux in arid and humid areas. Geoderma 2021, 388, 114946. [Google Scholar] [CrossRef]
  42. Liu, Y.C.; Liu, S.R.; Miao, R.H.; Liu, Y.Z.; Wang, D.; Zhao, C.C. Seasonal variations in the response of soil CO2 efflux to precipitation pulse under mild drought in a temperate oak (Quercus variabilis) forest. Agric. For. Meteorol. 2019, 271, 240–250. [Google Scholar] [CrossRef]
  43. Zhang, B.W.; Li, W.J.; Chen, S.P.; Tan, X.R.; Wang, S.S.; Chen, M.L.; Ren, T.T.; Xia, J.Y.; Huang, J.H.; Han, X.G. Changing precipitation exerts greater influence on soil heterotrophic than autotrophic respiration in a semiarid steppe. Agric. For. Meteorol. 2019, 271, 413–421. [Google Scholar] [CrossRef]
  44. Liu, Y.C.; Zhao, C.C.; Shang, Q.; Su, L.; Wang, L. Responses of soil respiration to spring drought and precipitation pulse in a temperate oak forest. Agric. For. Meteorol. 2019, 268, 289–298. [Google Scholar] [CrossRef]
  45. Sun, S.Q.; Lei, H.Q.; Chang, S.X. Drought differentially affects autotrophic and heterotrophic soil respiration rates and their temperature sensitivity. Biol. Fert. Soils. 2019, 55, 275–283. [Google Scholar] [CrossRef]
  46. Guan, C.; Zhang, P.; Zhao, C.M.; Li, X.R. Effects of warming and rainfall pulses on soil respiration in a biological soil crust-dominated desert ecosystem. Geoderma 2021, 381, 114683. [Google Scholar] [CrossRef]
  47. Phillips, C.L.; Nickerson, N.; Risk, D.; Bond, B.J. Interpreting diel hysteresis between soil respiration and temperature. Glob. Change Biol. 2011, 17, 515–527. [Google Scholar] [CrossRef]
  48. Feng, W.; Zhang, Y.Q.; Jia, X.; Wu, B.; Zha, T.S.; Qin, S.G.; Wang, B.; Shao, C.X.; Liu, J.B.; Fa, K.Y. Impact of environmental factors and biological soil crust types on soil respiration in a desert ecosystem. PLoS ONE 2014, 9, e102954. [Google Scholar] [CrossRef] [PubMed] [Green Version]
  49. Vargas, R.; Allen, M.F. Environmental controls and the influence of vegetation type, fine roots and rhizomorphs on diel and seasonal variation in soil respiration. New Phytol. 2008, 179, 460–471. [Google Scholar] [CrossRef] [Green Version]
  50. Zhong, Y.Q.W.; Yan, W.M.; Zong, Y.Z.; Shangguan, Z.P. Biotic and abiotic controls on the diel and seasonal variation in soil respiration and its components in a wheat field under long-term nitrogen fertilization. Field Crop. Res. 2016, 199, 1–9. [Google Scholar] [CrossRef]
  51. Ning, S.J.; Song, J.; Ru, J.Y.; Zhou, Z.X.; Zhang, J.J.; Liu, X.H.; Hui, Y.; Ma, Y.F.; Wan, S.Q. Nonadditive and Legacy Effects of Spring and Autumn Warming on Soil Respiration in an Old-Field Grassland. Ecosystems 2020, 24, 421–433. [Google Scholar] [CrossRef]
  52. Liu, Z.; Zhang, Y.Q.; Fa, K.Y.; Qin, S.G.; She, W.W. Rainfall pulses modify soil carbon emission in a semiarid desert. Catena 2017, 155, 147–155. [Google Scholar] [CrossRef]
  53. Wang, B.; Zha, T.S.; Jia, X.; Wu, B.; Zhang, Y.Q.; Qin, S.G. Soil moisture modifies the response of soil respiration to temperature in a desert shrub ecosystem. Biogeosciences 2014, 11, 259–268. [Google Scholar] [CrossRef] [Green Version]
  54. Zhou, T.; Shi, P.J.; Hui, D.F.; Luo, Y.Q. Global pattern of temperature sensitivity of soil heterotrophic respiration (Q10) and its implications for carbon-climate feedback. J. Geophys. Res. Biogeosci. 2009, 114, G02016. [Google Scholar] [CrossRef] [Green Version]
  55. Guan, C.; Li, X.R.; Chen, N.; Zhang, P.; Zhao, C.M. Warming effects on soil respiration in moss-dominated crusts in the Tengger Desert, northern China. Plant Soil 2019, 443, 591–603. [Google Scholar] [CrossRef]
Figure 1. Variations in air temperature, Ta (a); ambient precipitation, PPT (a); soil temperature, Ts (b); soil volumetric water content, VWC (c); and soil respiration, Rs (d) in the three precipitation treatments (P−30 = 30% decreased precipitation, CK = natural precipitation, P+30 = 30% increased precipitation) during the winter wheat whole growth period. Ts and VWC were measured at 10 cm depth.
Ijerph 19 06915 g001
Figure 2. Monthly average dynamics of soil volumetric water content, VWC (a); soil temperature, Ts (b); and soil respiration (Rs) (c) in three precipitation treatments (P−30 = 30% decreased precipitation, CK = ambient precipitation, P+30 = 30% increased precipitation) during the winter wheat whole growth period. Ts and VWC were measured at 10 cm depth. Vertical bars represent standard errors of the mean. Different letters represent significant differences (p < 0.05) among the three precipitation treatments in the same month. Three precipitation treatments containing the same letter in the same month indicate nonsignificant differences (p > 0.05).
Ijerph 19 06915 g002
Figure 3. Correlations of soil respiration (Rs) with soil temperature (Ts) (a,c,e) and soil volumetric water content (VWC) (b,d,f) in the different precipitation treatments (P−30 = 30% decreased precipitation, CK = ambient precipitation, P+30 = 30% increased precipitation) during the winter wheat whole growth period. The exponential function was used for fitting Rs and Ts (Rs = a×ebT). The piecewise linear function (Rs = a × VWC + b) of the response of Rs to VWC in the P−30 treatment (bounded by 15% of VWC) and the logarithmic function for Rs and VWC (Rs = a × VWC 2+ b × VWC + c) in the CK and P+30 treatments, respectively. The red lines indicates the significant relationship between Rs and Ts or VWC. Error bars represent standard errors of the mean. Hourly values were bin-averaged every 0.5 intervals of Ts and VWC.
Ijerph 19 06915 g003
Figure 4. Mean monthly diel cycles of soil respiration (Rs, open points) and soil temperature (Ts, solid points) at a depth of 10 cm in November 2019 (ac) and January (df), April (gi), and June (jl) 2020.
Ijerph 19 06915 g004
Figure 5. Mean monthly diel cycles of soil respiration (Rs) and soil temperature (Ts) at a depth of 10 cm in November 2019 (ac) and January (df), April (gi), and June (jl) 2020. The number of solid points and the arrow indicate the monthly average diurnal dynamic lag time between Rs and Ts and the direction of the diel cycle, respectively.
Ijerph 19 06915 g005
Figure 6. Relationship between soil volumetric water content (VWC) and lag time in three precipitation treatments (P−30 (a), CK (b) and P+30 (c)) and VWC at 10 cm soil depth. The lag times were calculated by a cross-correlation analysis using a three-day moving window with a one-day step. The solid line is fitted using linear regression.
Ijerph 19 06915 g006
Figure 7. Monthly average dynamics of temperature sensitivity (Q10) in three precipitation treatments during the winter wheat whole growth period. Vertical bars represent standard errors of the mean. Different letters represent significant differences (p < 0.05) among the three precipitation treatments in the same month. Three precipitation treatments containing the same letter in the same month indicate nonsignificant differences (p > 0.05).
Ijerph 19 06915 g007
Figure 8. Relationships between seasonal soil temperature (Ts), soil volumetric water content (VWC), and Q10 in the different precipitation treatments during the winter wheat whole growth period. The red lines indicates the significant relationship between Q10 and Ts (a,c,e) or VWC (b,d,f).
Ijerph 19 06915 g008
Table 1. Monthly and total cumulative CO2 emissions in three precipitation treatments (P−30 = 30% decreased precipitation, CK = natural precipitation, P+30 = 30% increased precipitation) during the winter wheat whole growth period.
MonthTreatmentCumulative CO2 Emission (g C m−2)MonthTreatmentCumulative CO2 Emission (g C m−2)
October 2019P−3065.23 March 2020P−3059.12
CK50.42 CK48.45
P+3050.38 P+3049.44
November 2019P−3021.53 April 2020P−3068.54
CK17.59 CK65.87
P+3018.77 P+3066.99
December 2019P−3013.96 May 2020P−3082.47
CK13.99 CK82.07
P+3014.53 P+3087.33
January 2020P−3013.18 June 2020P−3058.33
CK12.16 CK60.44
P+3012.54 P+3063.41
February 2020P−3018.53 Total P−30406.37
CK14.12 CK372.58
P+3013.72 P+30383.59
“Total” is the cumulative CO2 emission of winter wheat during the whole growth period.
Table 2. Regression equations of soil respiration (Rs) against soil temperature (Ts) and soil volumetric water content (VWC).
No.ModelPndfabcR2p
3Rs = Ts × VWC/(a × Ts + b × VWC + c) P−304744−8.438.5771.910.88<0.01
CK4441−6.027.3857.410.92<0.01
P+304744−8.075.56112.650.88<0.01
4Rs = a × Ts2 + b × VWC2 + c P−3047440.01−0.080.370.86<0.01
CK44410.01−0.060.360.93<0.01
P+3047440.010.08−0.240.89<0.01
5Rs = a × Ts + b × VWC + cP−3047440.220.02−0.530.79<0.01
CK44410.22−0.01−0.210.85<0.01
P+3047440.280.01−1.280.83<0.01
6Rs = a × Tsb × VWCcP−3047440.031.98−0.270.85<0.01
CK44410.031.8−0.050.92<0.01
P+3047440.012.160.160.90 <0.01
7Rs = a + b (Ts × VWC)P−3047450.110.01-0.76<0.01
CK4442−0.260.01-0.81<0.01
P+304742−1.080.01-0.72<0.01
The model number is consistent with that mentioned in the materials and methods, n is the number of bins averaged every 0.5 intervals of Ts and VWC, and df is the degree of freedom.
Publisher’s Note: MDPI stays neutral with regard to jurisdictional claims in published maps and institutional affiliations.

