
Association of Blood Heavy Metal Levels and Renal Function in Korean Adults


Abstract
:1. Introduction
2. Materials and Methods
2.1. Study Design
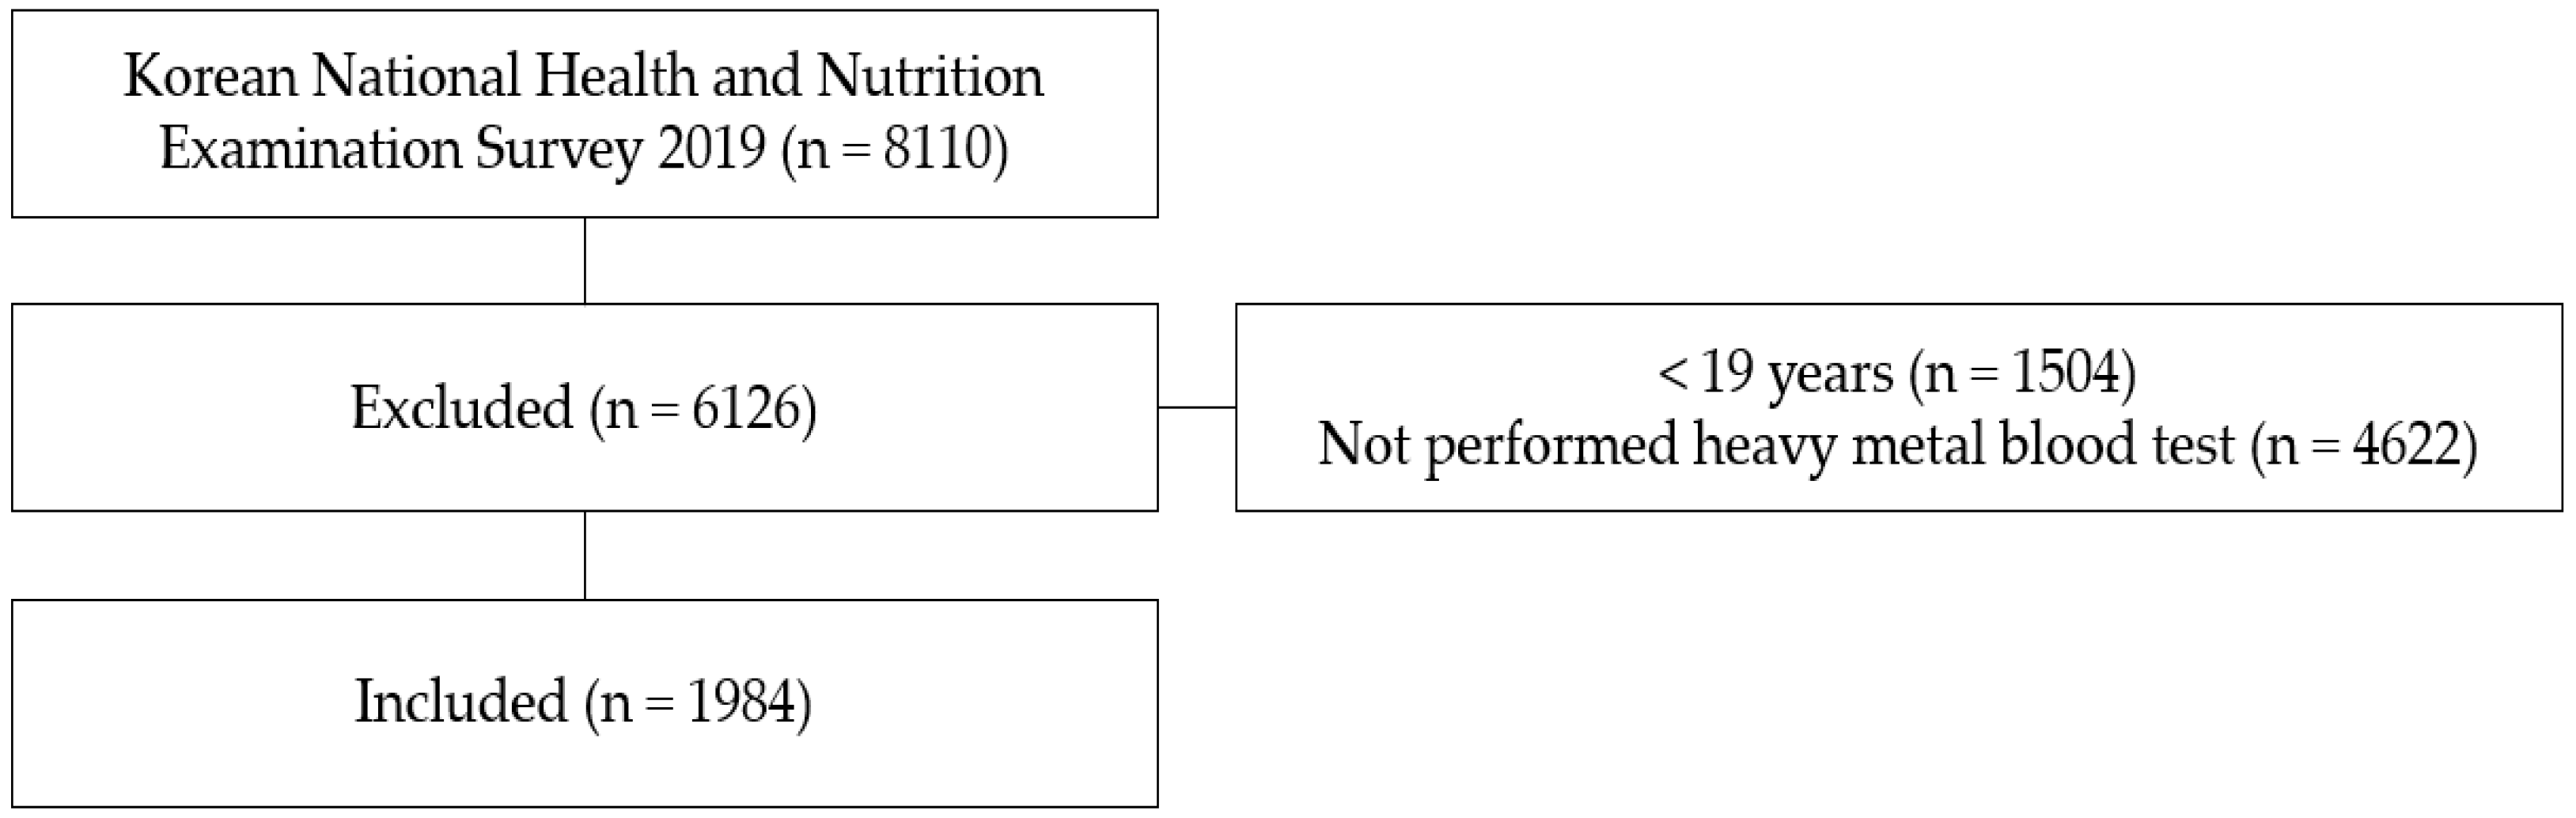
2.2. Sample
2.3. Measures
2.3.1. Demographic and Disease Characteristics
2.3.2. Biochemical Measurements
2.3.3. Renal Function
2.4. Analytic Strategy
3. Results
3.1. Demographic and Clinical Characteristics
3.2. General Characteristics according to eGFR Stage
3.3. Factors Affecting Subjects’ eGFR
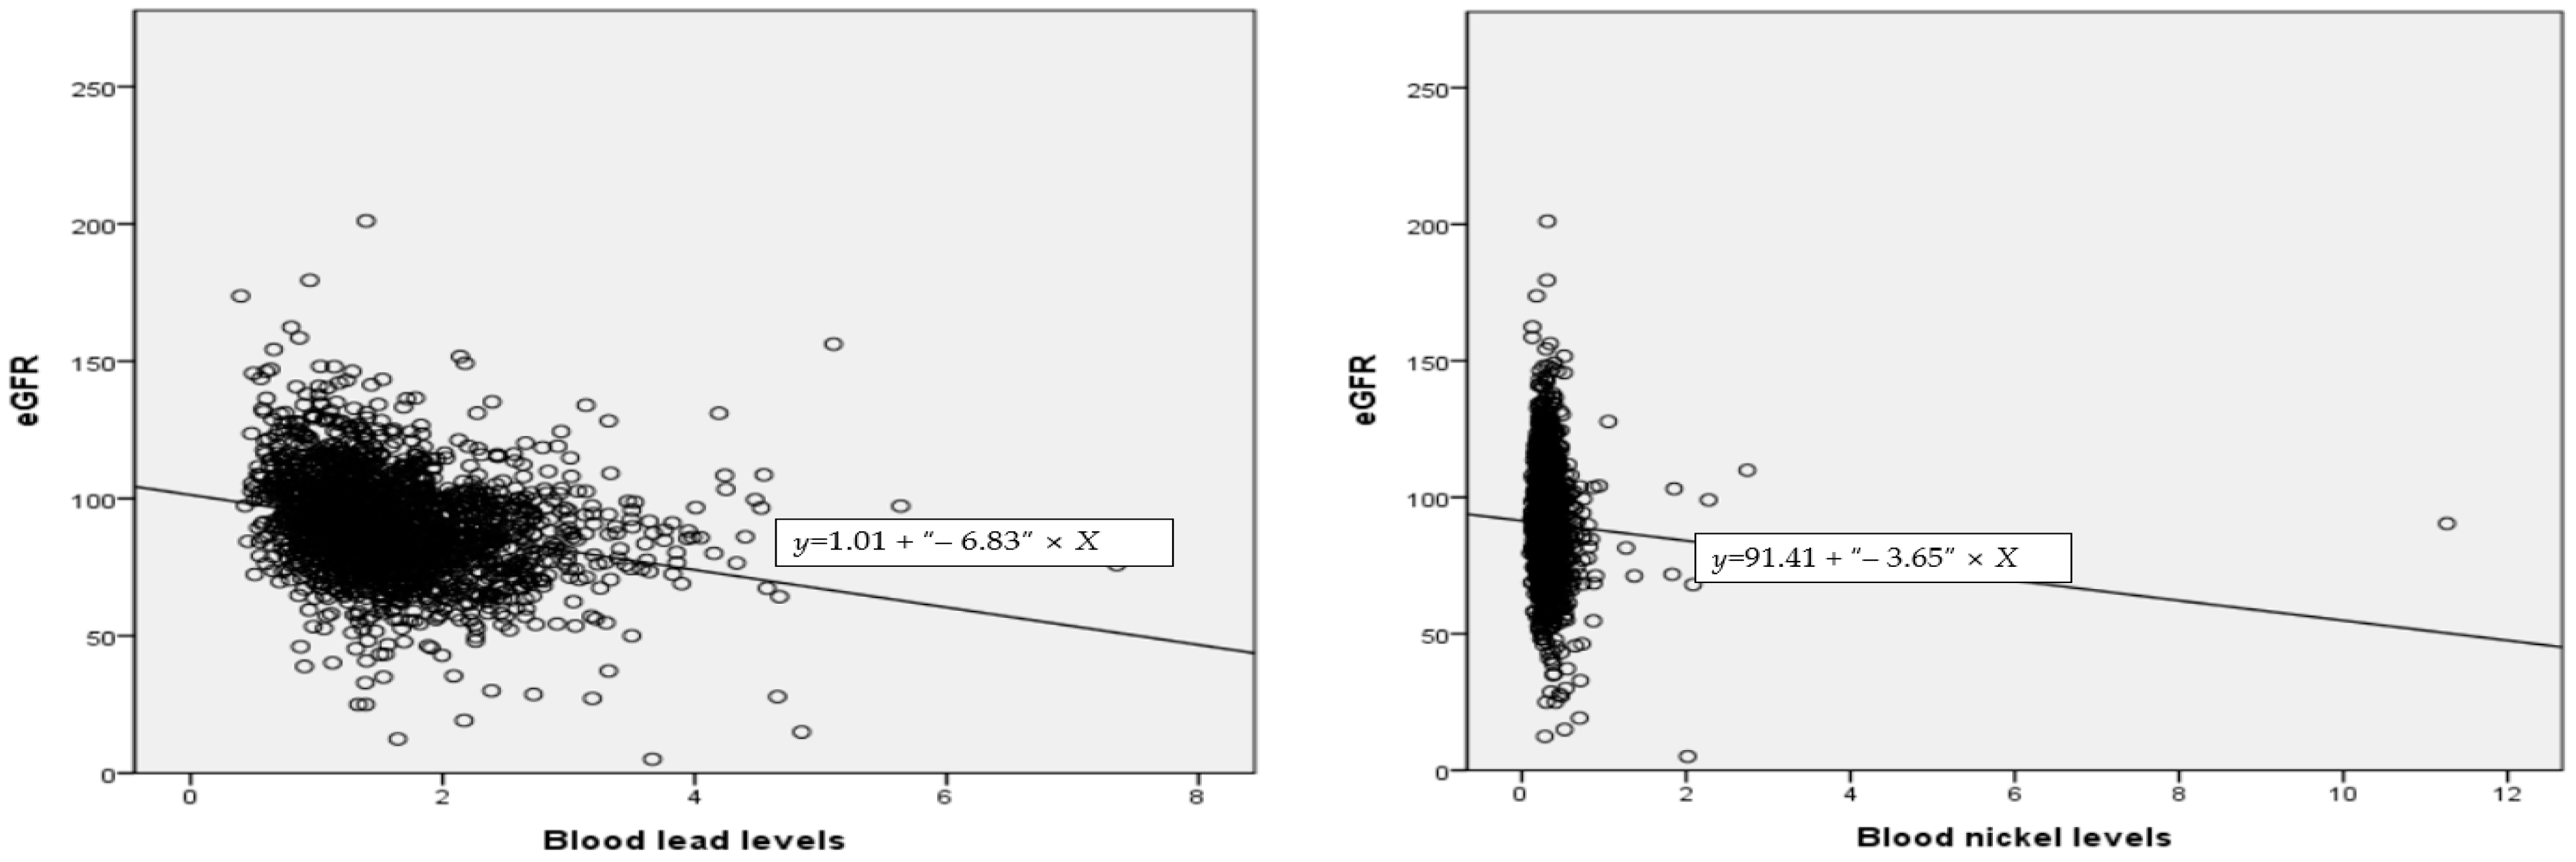
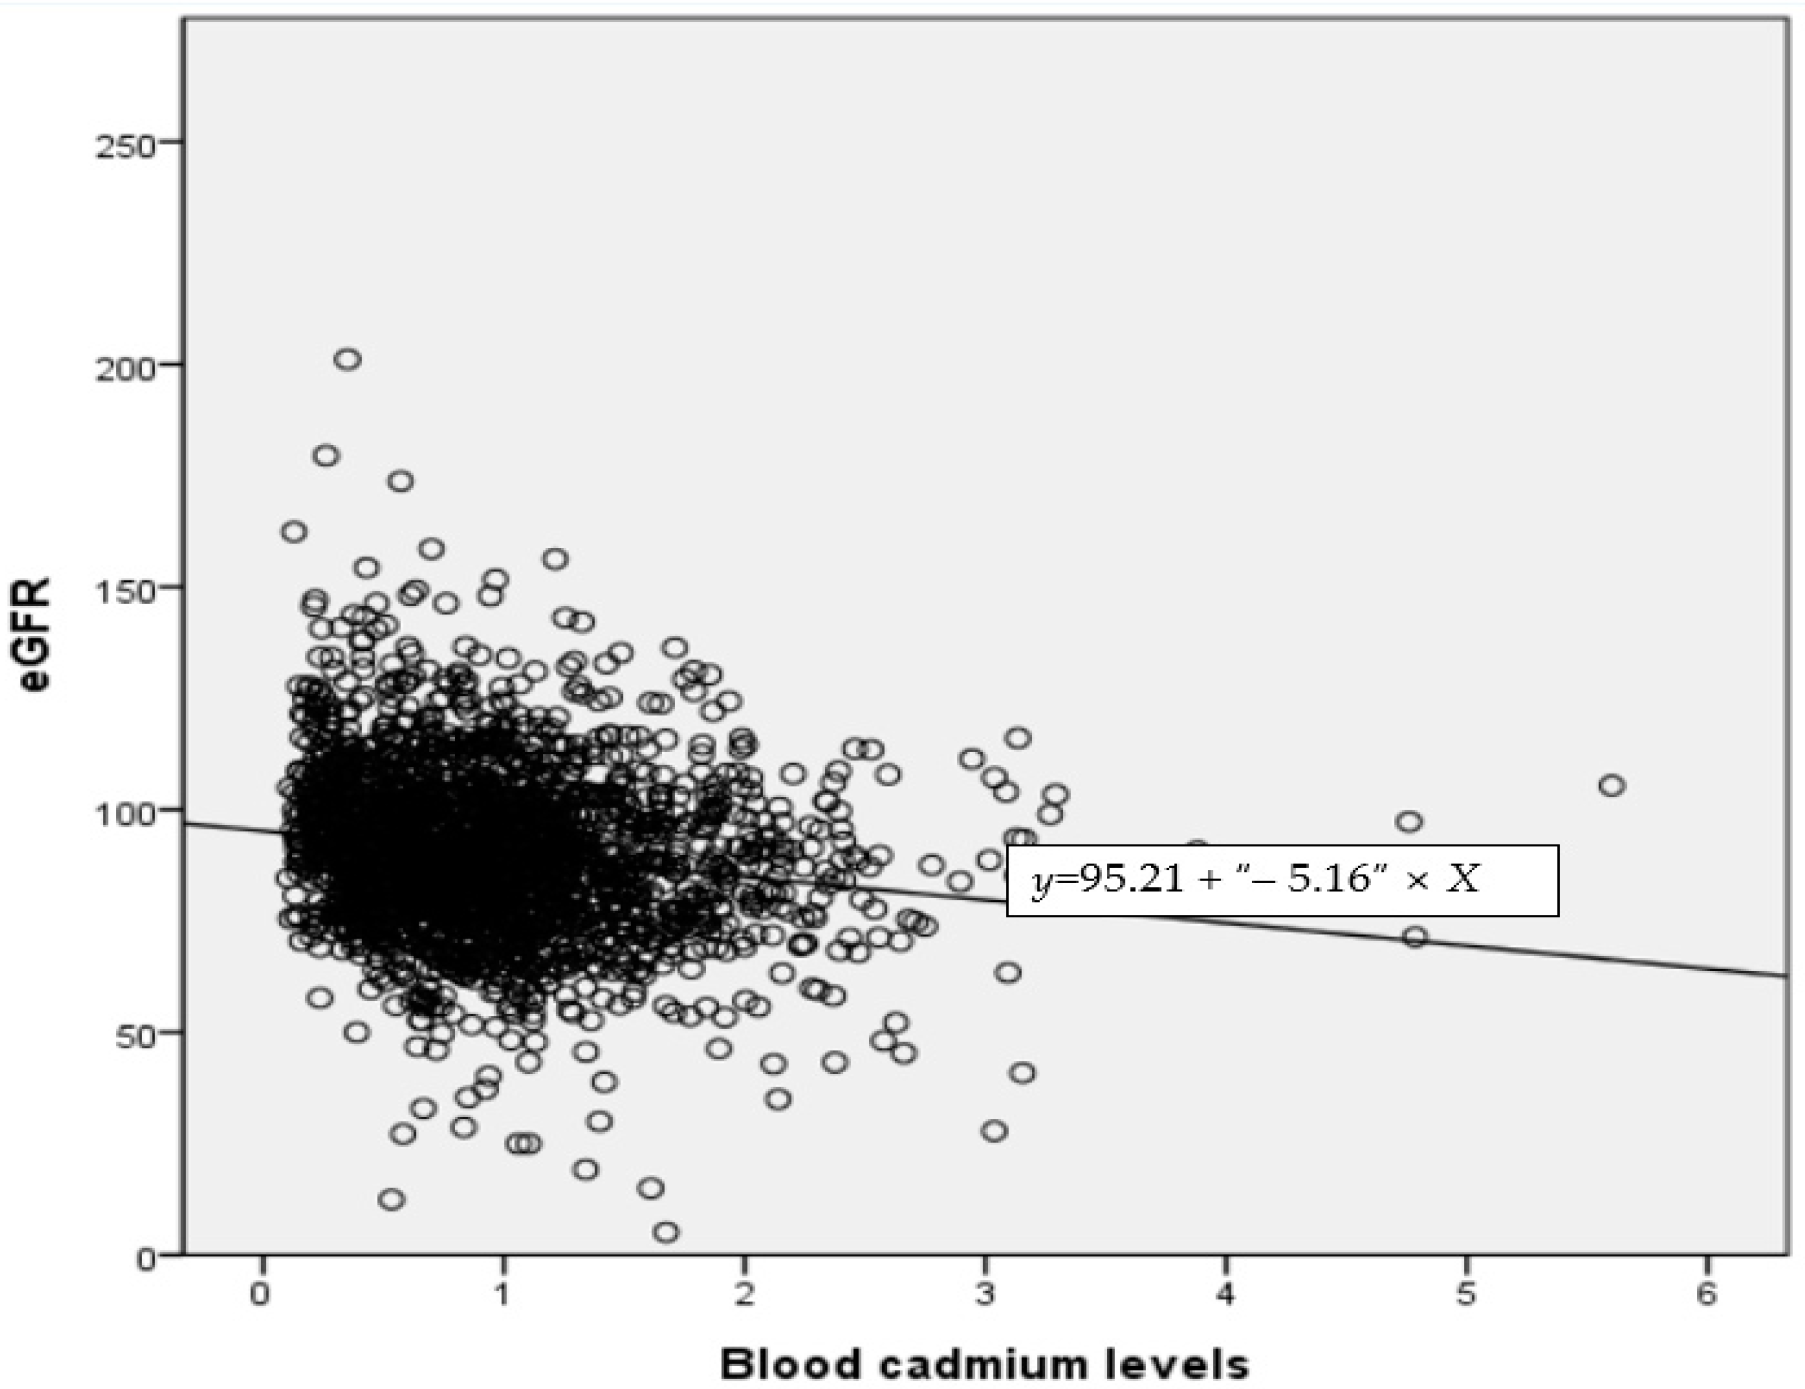
3.4. Correlation between eGFR and Blood Lead, Mercury, Cadmium, and Nickel
3.5. Heavy Metal Factors Affecting Blood eGFR
4. Discussion
5. Conclusions
Author Contributions
Funding
Institutional Review Board Statement
Informed Consent Statement
Data Availability Statement
Conflicts of Interest
References
- Chung, J.H.; Kang, P.S.; Kim, C.Y.; Lee, K.S.; Hwang, T.Y.; Kim, G.T.; Park, J.S.; Park, S.Y.; Kim, D.S.; Lim, O.T.; et al. Blood pb, urine cd and health assessment of residents in the vicinity of abandoned mines in Gyeongsangbuk-do. Korean J. Occup. Environ. Med. 2005, 17, 225–237. [Google Scholar] [CrossRef]
- Ministry of Environment of Korea. 5th Korean National Environmental Health Survey. Available online: https://www.me.go.kr/home/web/board/read.do?menuId=10525&boardMasterId=1&boardCategoryId=39&boardId=1471060 (accessed on 8 August 2021).
- Jaishankar, M.; Tseten, T.; Anbalagan, N.; Mathew, B.B.; Beeregowda, K.N. Toxicity, mechanism and health effects of some heavy metals. Interdiscip. toxicol. 2014, 7, 60–72. [Google Scholar] [CrossRef] [PubMed] [Green Version]
- Kim, N.S.; Ahn, J.; Lee, B.K.; Park, J.; Kim, Y. Environmental exposures to lead, mercury, and cadmium among South Korean teenagers (knhanes 2010–2013): Body burden and risk factors. Environ. Res. 2017, 156, 468–476. [Google Scholar] [CrossRef] [PubMed]
- Lentini, P.; Zanoli, L.; Granata, A.; Signorelli, S.S.; Castellino, P.; Dell’Aquila, R. Kidney and heavy metals—The role of environmental exposure. Mol. Med. Rep. 2017, 15, 3413–3419. [Google Scholar] [CrossRef] [Green Version]
- Derouiche, S.; Cheradid, T.; Guessoum, M. Heavy metals, oxidative stress and inflammation in pathophysiology of chronic kidney disease—A review. Asian J. Pharm. Technol. 2020, 10, 202–206. [Google Scholar] [CrossRef]
- Rehman, K.F.; Fatima, I.; Akash, M.S.H. Prevalence of exposure of heavy metals and their impact on health consequences. J. Cell. Biochem. 2018, 119, 157–184. [Google Scholar] [CrossRef]
- Prozialeck, W.C.; Edwards, J.R. Mechanisms of cadmium-induced proximal tubule injury: New insights with implications for biomonitoring and therapeutic interventions. J. Pharmacol. Exp. Ther. 2012, 343, 2–12. [Google Scholar] [CrossRef] [Green Version]
- Genchi, G.; Carocci, A.; Lauria, G.; Sinicropi, M.S.; Catalano, A. Nickel: Human health and environmental toxicology. Int. J. Environ. Res. Public Health 2020, 17, 679. [Google Scholar] [CrossRef] [Green Version]
- Korea Disease Control and Prevention Agency. Available online: https://knhanes.kdca.go.kr/knhanes/sub03/sub03_02_05.do (accessed on 10 August 2021).
- Hong, Y.A.; Ban, T.H.; Kang, C.Y.; Hwang, S.D.; Choi, S.R.; Lee, H.; Jung, H.Y.; Kim, K.; Kwon, Y.E.; Kim, S.H. Trends in epidemiologic characteristics of end-stage renal disease from 2019 Korean renal data system (KORDS). Kidney Res. Clin. Pract. 2021, 40, 52–61. [Google Scholar] [CrossRef]
- Qiu, Z.; Zheng, K.; Zhang, H.; Feng, L.; Wang, L.; Zhou, H. Physical exercise and patients with chronic renal failure: A meta-analysis. Biomed. Res. Int. 2017, 2017, 7191826. [Google Scholar] [CrossRef]
- Jha, V.; Garcia, G.K.; Iseki, Z.; Li, S.; Naicker, B.; Plattner, R.; Saran, A.; Wang, Y.M.; Yang, C.W. Chronic kidney disease: Global dimension and perspectives. Lancet 2013, 382, 260–272. [Google Scholar] [CrossRef]
- Akerstrom, M.; Sallsten, G.; Lundh, T.; Barregard, L. Associations between urinary excretion of cadmium and proteins in a nonsmoking population: Renal toxicity or normal physiology? Environ. Health Perspect. 2013, 121, 187–191. [Google Scholar] [CrossRef] [PubMed] [Green Version]
- Levey, A.; Greene, T.; Kusek, J.W.; Beck, G.J. A simplified equation to predict glomerular filtration rate from serum creatinine. J. Am. Soc. Nephrol. 2000, 11, 155A. [Google Scholar]
- Inker, L.A.; Astor, B.C.; Fox, C.H.; Isakova, T.J.; Lash, P.; Peralta, C.A.; Tamura, M.K.; Feldman, H.I. KDOQI US commentary on the 2012 kdigo clinical practice guideline for the evaluation and management of CKD. Am. J. Kidney Dis. 2014, 63, 713–735. [Google Scholar] [CrossRef] [Green Version]
- The Korean Society of Nephrology. Available online: https://ksn.or.kr/general/about/check.php (accessed on 5 December 2021).
- Xu, R.; Zhang, L.X.; Zhang, P.H.; Wang, F.; Zuo, L.; Wang, H.Y. Gender differences in age-related decline in glomerular filtration rates in healthy people and chronic kidney disease patients. BMC Nephrol. 2010, 11, 20. [Google Scholar] [CrossRef] [Green Version]
- Silbiger, S.R.; Neugarten, J. The role of gender in the progression of renal disease. Adv. Ren. Replace Ther. 2003, 10, 3–14. [Google Scholar] [CrossRef]
- Maric, C. Sex, diabetes and the kidney. Am. J. Physiol. Ren. Physiol. 2009, 296, F680–F688. [Google Scholar] [CrossRef]
- Iseki, K.; Iseki, C.; Ikemiya, Y.; Fukiyama, K. Risk of developing end-stage renal disease in a cohort of mass screening. Kidney Int. 1996, 49, 800–805. [Google Scholar] [CrossRef] [Green Version]
- Yoo, C.S.; Kim, Y.; Kim, H.Y. Impact of chronic kidney disease on depression, perceived health, and health-related quality of life: Results from the Korea National Health and Nutrition Examination Survey in 2014 and 2016. Korean J. Adult Nurs. 2020, 32, 374–384. [Google Scholar] [CrossRef]
- Margolis, D.J.; Hofstad, O.; Feldman, H.I. Association between renal failure and foot ulcer or lower-extremity amputation in patients with diabetes. Diabetes Care 2008, 31, 1331–1336. [Google Scholar] [CrossRef] [Green Version]
- Yoo, I. The blood levels of lead, mercury, and cadmium and metabolic syndrome of Korean adults. J. Korean Soc. Living Environ. Syst. 2014, 21, 251–259. [Google Scholar] [CrossRef]
- Kang, C.M. Pharmacologic therapy in patients with chronic renal failure. J. Korean Med. Assoc. 2003, 46, 246–254. [Google Scholar] [CrossRef] [Green Version]
- Kang, J.H. Factors affecting Diabetic Eye disease and Kidney disease Screening in Diabetic Patients. J. Korea Acad. Ind. Coop. Soc. 2020, 21, 226–235. [Google Scholar] [CrossRef]
- Seo, H.J. Effects for Comorbidities of Chronic Kidney Disease on the Progression to End-stage Renal Disease. J. Health Inform. Stat. 2020, 45, 356–364. [Google Scholar] [CrossRef]
- Kim, H.S. Importance of Target Blood Pressure Management in Diabetic Kidney Disease. J. Korea Contents Assoc. 2019, 19, 461–470. [Google Scholar] [CrossRef]
- Chobanian, A.V.; Bakris, G.L.; Black, H.R.; Cushman, W.C.; Green, L.A.; Izzo, J.L.; Jones, D.W.; Materson, B.J.; Oparil, S.; Wright, J.T.; et al. The seventh report of the joint national committee on prevention, detection, evaluation, and treatment of high blood pressure. Hypertension 2003, 289, 2560–2571. [Google Scholar] [CrossRef] [Green Version]
- Rana, M.N.; Tangpong, J.; Rahman, M.M. Toxicodynamics of lead, cadmium, mercury and arsenic-induced kidney toxicity and treatment strategy: A mini review. Toxicol. Rep. 2018, 5, 704–713. [Google Scholar] [CrossRef]
- Ministry of Environment of Korea. Level of Exposure to Environmental Harmful Substances in the Human Body. Available online: http://stat.me.go.kr/portal/stat/easyStatPage/DT_106N_99_1100051.do (accessed on 3 February 2022).
- Menke, A.; Muntner, P.; Batuman, V.; Silbergeld, E.K.; Guallar, E. Blood lead below 0.48 μmol/L (10 μg/dL) and mortality among us adults. Circulation 2006, 114, 1388–1394. [Google Scholar] [CrossRef] [Green Version]
- Cho, B.S.; Lee, D.W.; Cho, S.H.; Kim, H.W.; Jung, J.H. The Relationship between Serum Cadmium Level and Microalbuminuria in Korean Elderly People: Using Korean National Health and Nutrition Examination Survey. Korean Acad. Clin. Geriatr. 2018, 19, 244–248. [Google Scholar] [CrossRef]
- American Conference of Governmental Industrial Hygienists; American Conference of Governmental Industrial Hygienists, Cincinnati, OH, USA. Threshold limit values for chemical substances and physical agents and biological exposure indices. Unpublished Manuscript. 1995. [Google Scholar]
- Park, J.D.; Choi, B.S.; Kweon, I.H.; Hong, Y.P. Reference values of cadmium in kidney and liver in Korean. Korean J. Occup. Environ. Med. 2000, 12, 346–355. [Google Scholar] [CrossRef]
- Luo, J.; Hendryx, M. Metal mixtures and kidney function: An application of machine learning to NHANES data. Environ. Res. 2020, 191, 110126. [Google Scholar] [CrossRef] [PubMed]
- Matovic, V.; Buha, A.; Ðukic, D.; Bulat, Z. Insight into the oxidative stress induced by lead and/or cadmium in blood, liver and kidney. Food Chem Toxicol. 2015, 78, 130–140. [Google Scholar] [CrossRef] [PubMed]
- Satarug, S.; Gobe, G.C.; Ujjin, P.; Vesey, D.A. A comparison of the nephrotoxicity of low doses of cadmium and lead. Toxics 2020, 8, 18. [Google Scholar] [CrossRef] [PubMed] [Green Version]
- Kim, S.M.; Jung, J.Y. Nutritional management in patients with chronic kidney disease. Korean J. Intern. Med. 2020, 35, 1279–1290. [Google Scholar] [CrossRef] [PubMed]

| Category | Male (N = 920) | Female (N = 1064) | p |
|---|---|---|---|
| N (%), M ± SD | N (%), M ± SD | ||
| Age, year | 48.33 ± 16.70 | 48.20 ± 15.77 | 0.861 |
| Household income | 0.081 | ||
| Lowest~Lower middle | 570 (59.62) | 619 (65.23) | |
| Upper middle~Highest | 348 (36.40) | 444 (46.79) | |
| Non-respondent | 2 (0.21) | 1 (0.11) | |
| Educational status (years) | 0.004 | ||
| 0–9 | 190 (19.87) | 280 (29.50) | |
| 10 or more | 676 (70.71) | 729 (76.82) | |
| Non-respondent | 54 (5.65) | 55 (5.80) | |
| Smoking | 342 (37.2) | 54 (5.1) | 0.342 |
| Hypertension | 202 (22.0) | 175 (16.4) | 0.002 |
| Diabetes Mellitus | 89 (9.31) | 80 (8.43) | 0.091 |
| Body Mass Index | 24.42 ± 3.46 | 23.51 ± 3.933 | <0.001 |
| Blood pressure, mmHg | |||
| Systolic | 120.14 ± 14.55 | 115.07 ± 16.80 | <0.001 |
| Diastolic | 78.00 ± 10.18 | 73.35 ± 9.30 | <0.001 |
| HbA1C, % | 5.73 ± 0.911 | 5.60 ± 0.751 | <0.001 |
| Triglyceride | 163.76 ± 37.66 | 109.13 ± 72.21 | <0.001 |
| HDL Cholesterol | 46.91 ± 11.22 | 54.99 ± 12.4 | <0.001 |
| Lead level, µg/dL | 1.85 ± 0.73 | 1.43 ± 0.60 | <0.001 |
| Mercury, µg/dL | 4.48 ± 3.37 | 3.04 ± 2.12 | <0.001 |
| Cadmium, µg/dL | 0.83 ± 0.49 | 1.09 ± 0.64 | <0.001 |
| Nickel, µg/dL | 0.31 ± 0.17 | 0.34 ± 0.36 | 0.014 |
| eGFR, mL/min | 86.93 ± 17.67 | 93.07 ± 19.02 | <0.001 |
| Category | Stage 1 (956) | Stage 2 (949) | Stage 3–5 (79) | p |
|---|---|---|---|---|
| N (%), M ± SD | N (%), M ± SD | N (%), M ± SD | ||
| Gender | <0.001 | |||
| Male | 388 (40.59) | 481 (50.68) | 51 (64.56) | |
| Female | 568 (59.41) | 468 (49.32) | 28 (35.44) | |
| Age, year | 42.06 ± 15.13 | 52.91 ± 14.78 | 67.39 ±10.50 | <0.001 |
| Household income | <0.001 | |||
| Lowest~Lower middle | 594 (62.13) | 565 (59.54) | 30 (37.97) | |
| Upper middle~Highest | 361 (37.76) | 382 (40.25) | 49 (62.03) | |
| Non-respondent | 1 (0.10) | 2 (0.21) | - | |
| Educational status (years) | <0.001 | |||
| 0–9 | 186 (19.46) | 249 (26.24) | 35 (44.30) | |
| 10 or more | 710 (74.27) | 657 (69.23) | 38 (48.10) | |
| Non-respondent | 60 (6.28) | 43 (4.53) | 6 (7.59) | |
| Smoking | 218 (22.80) | 165 (17.39) | 13 (16.46) | <0.001 |
| Hypertension | 105 (10.98) | 215 (22.66) | 57 (72.15) | <0.001 |
| Diabetes Mellitus | 58 (6.07) | 84 (8.85) | 27 (34.18) | <0.001 |
| Body Mass Index | 23.65 ± 3.95 | 24.15 ± 3.52 | 24.63 ± 3.62 | 0.003 |
| Blood pressure, mmHg | ||||
| Systolic | 114.35 ± 14.77 | 119.64 ± 16.32 | 127.70 ± 17.69 | <0.001 |
| Diastolic | 74.24 ± 9.63 | 76.97 ± 9.88 | 73.24 ± 12.84 | <0.001 |
| HbA1C, % | 5.56 ± 0.79 | 5.72 ± 0.85 | 6.10 ± 0.95 | <0.001 |
| Triglyceride | 131.49 ± 129.77 | 136.02 ± 94.41 | 151.75 ± 77.06 | 0.257 |
| HDL cholesterol | 51.97 ± 12.36 | 51.13 ± 12.48 | 43.62 ± 13.27 | <0.001 |
| Lead level, µg/dL | 1.48 ± 0.66 | 1.74 ± 0.66 | 2.01 ± 0.80 | <0.001 |
| Mercury, µg/dL | 3.56 ± 2.76 | 3.89 ± 2.95 | 3.36 ± 2.90 | 0.022 |
| Cadmium, µg/dL | 0.90 ± 0.58 | 1.01 ± 0.58 | 1.27 ± 0.65 | <0.001 |
| Nickel, µg/dL | 0.32 ± 0.39 | 0.32 ± 0.14 | 0.39 ± 0.23 | 0.096 |
| Variable | B | SE | β | t | p | R2 | F (p) |
|---|---|---|---|---|---|---|---|
| Constant | 148.280 | 6.874 | - | 21.571 | <0.001 | 0.266 | 22.160 (<0.001) |
| Gender | −5.624 | 1.778 | −0.111 | −3.162 | 0.002 | ||
| Age | −0.564 | 0.052 | −0.492 | −10.888 | <0.001 | ||
| Educational status | −7.121 | 1.546 | −0.165 | −4.606 | <0.001 | ||
| Household income | −0.216 | 1.259 | 0.006 | −0.171 | 0.864 | ||
| Current smoking | −3.097 | 1.255 | −0.086 | −2.467 | 0.014 | ||
| Hemoglobin A1C | 0.287 | 0.613 | 0.016 | 0.468 | 0.640 | ||
| Body Mass Index | −0.495 | 0.171 | −0.098 | −2.899 | 0.004 | ||
| Systolic blood pressure | 0.082 | 0.053 | 0.067 | 1.532 | 0.126 | ||
| Diastolic blood pressure | −0.203 | 0.075 | −0.116 | −2.705 | 0.007 | ||
| Lead | −0.764 | 0.909 | −0.030 | −0.841 | 0.401 | ||
| Mercury | −0.490 | 0.186 | −0.087 | −2.630 | 0.009 | ||
| Cadmium | −1.087 | 1.130 | −0.035 | −0.962 | 0.336 | ||
| Nickel | −12.686 | 3.820 | −0.107 | −3.321 | 0.0001 |
| Category | Lead | Mercury | Cadmium | Nickel | eGFR |
|---|---|---|---|---|---|
| r (p) | r (p) | r (p) | r (p) | r (p) | |
| Lead | 1 | ||||
| Mercury | 0.262 (<0.001) | 1 | |||
| Cadmium | 0.273 (<0.001) | 0.077 (0.001) | 1 | ||
| Nickel | −0.004 (0.870) | −0.049 (0.028) | 0.078 (<0.001) | 1 | |
| eGFR | −0.255 (<0.001) | −0.042 (0.061) | −0.164 (<0.001) | −0.056 (0.012) | 1 |
| B | SE | β | t | p | R2 | Adj R2 | F | p | ||
|---|---|---|---|---|---|---|---|---|---|---|
| Male | Constant | 99.166 | 1.959 | 50.632 | <0.001 | 0.098 | 0.095 | 28.875 | <0.001 | |
| Lead | −3.541 | 0.836 | −0.146 | −4.237 | <0.001 | |||||
| Mercury | 0.269 | 0.172 | 0.051 | 1.564 | 0.118 | |||||
| Cadmium | −3.329 | 1.238 | −0.092 | −2.689 | 0.007 | |||||
| Nickel | −13.437 | 3.439 | −0.126 | −3.907 | <0.001 | |||||
| Female | Constant | 107.204 | 1.648 | 65.050 | <0.001 | 0.058 | 0.054 | 14.056 | <0.001 | |
| Lead | −6.644 | 1.019 | −0.211 | −6.521 | <0.001 | |||||
| Mercury | 0.448 | 0.270 | 0.050 | 1.659 | 0.097 | |||||
| Cadmium | −5.006 | 0.943 | −0.170 | −5.306 | <0.001 | |||||
| Nickel | −1.552 | 1.546 | −0.029 | −1.004 | 0.316 |
Publisher’s Note: MDPI stays neutral with regard to jurisdictional claims in published maps and institutional affiliations. |
© 2022 by the authors. Licensee MDPI, Basel, Switzerland. This article is an open access article distributed under the terms and conditions of the Creative Commons Attribution (CC BY) license (https://creativecommons.org/licenses/by/4.0/).
Share and Cite
Park, Y.; Lee, S.-J. Association of Blood Heavy Metal Levels and Renal Function in Korean Adults. Int. J. Environ. Res. Public Health 2022, 19, 6646. https://doi.org/10.3390/ijerph19116646
Park Y, Lee S-J. Association of Blood Heavy Metal Levels and Renal Function in Korean Adults. International Journal of Environmental Research and Public Health. 2022; 19(11):6646. https://doi.org/10.3390/ijerph19116646
Chicago/Turabian StylePark, Yoonjin, and Su-Jung Lee. 2022. "Association of Blood Heavy Metal Levels and Renal Function in Korean Adults" International Journal of Environmental Research and Public Health 19, no. 11: 6646. https://doi.org/10.3390/ijerph19116646
APA StylePark, Y., & Lee, S.-J. (2022). Association of Blood Heavy Metal Levels and Renal Function in Korean Adults. International Journal of Environmental Research and Public Health, 19(11), 6646. https://doi.org/10.3390/ijerph19116646