
Enhanced Microbial Oxidation–Neutralization Treatment of Acid Mine Drainage Rich in Ferrous Ions (Fe2+)


Abstract
:1. Introduction
2. Materials and Methods
2.1. Simulated Acid Mine Drainage
2.2. Microorganisms and Their Fixation
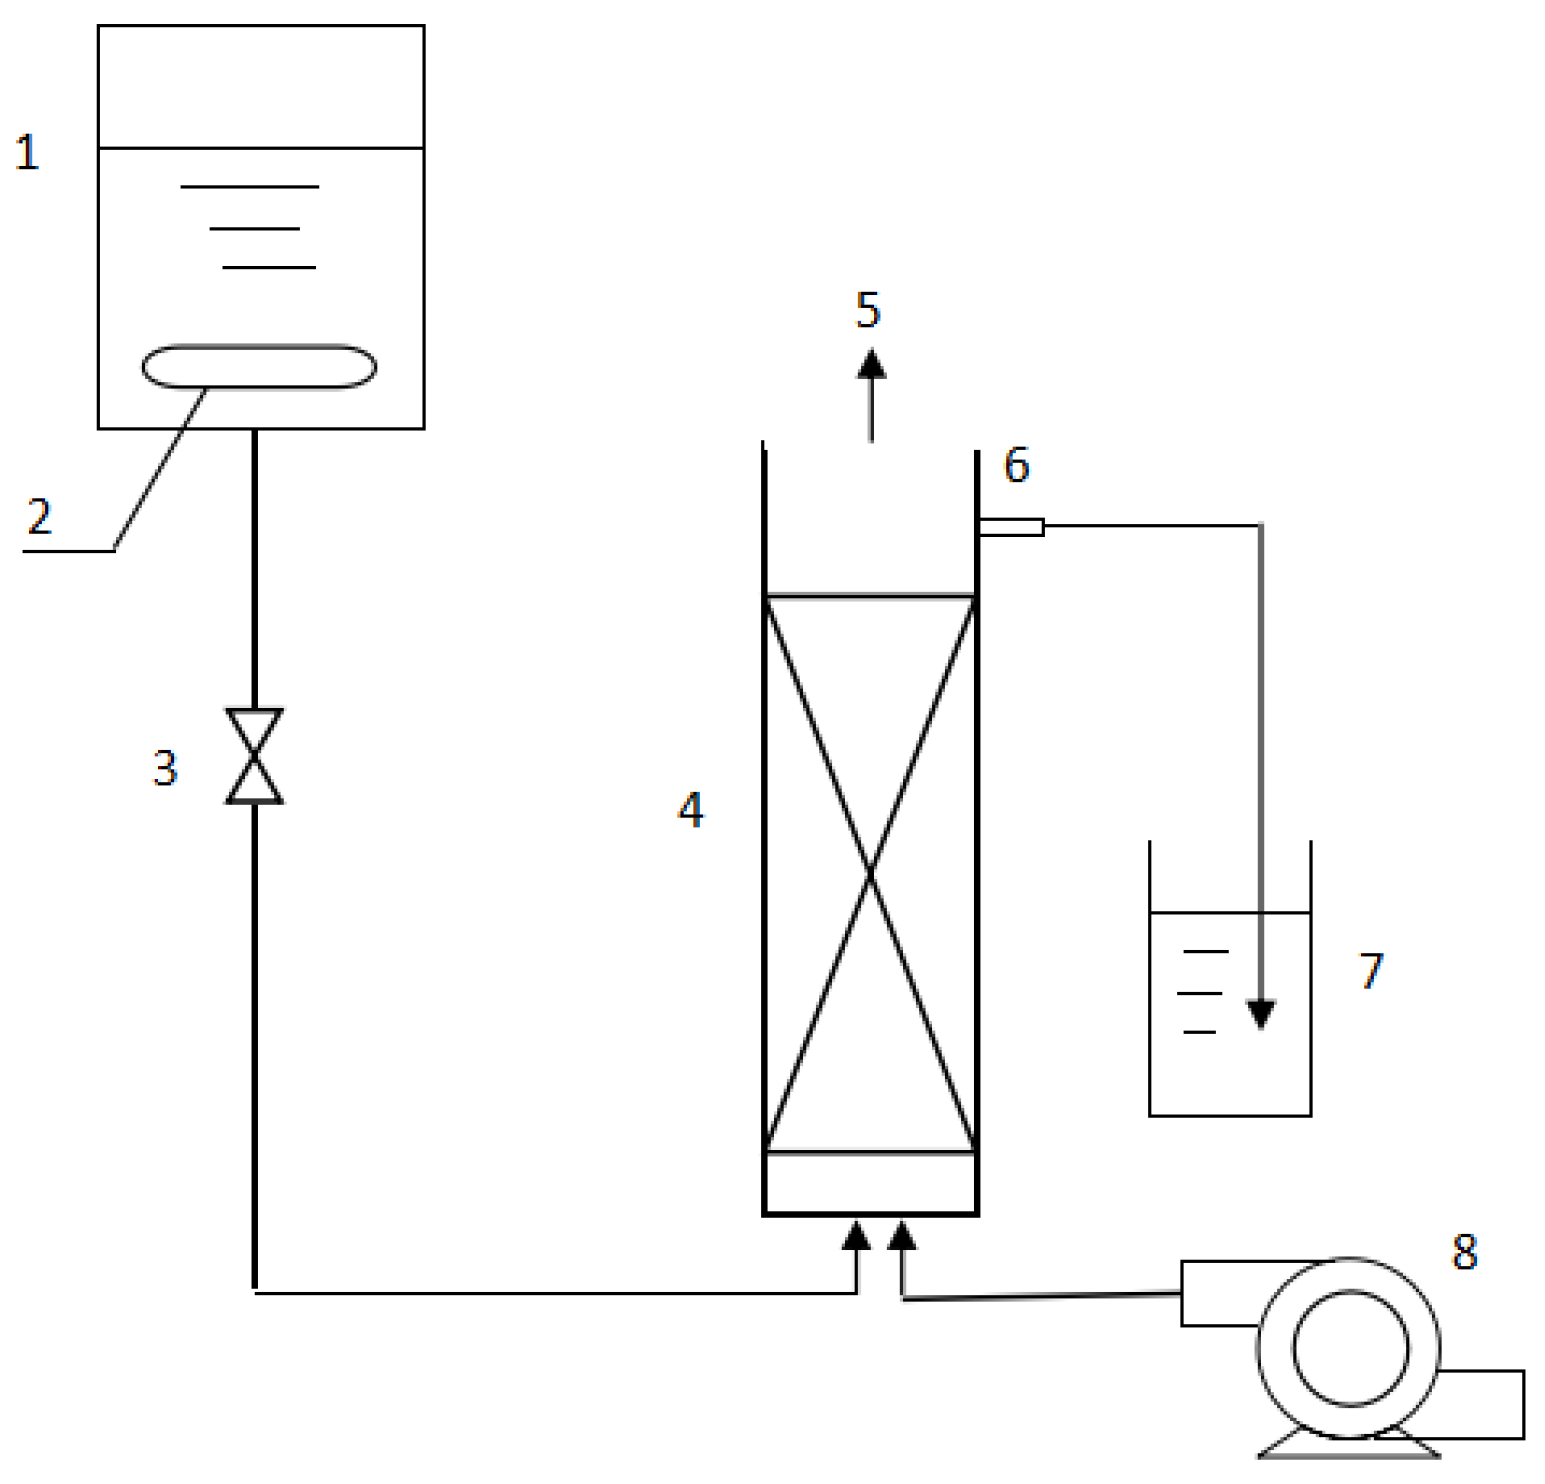
2.3. Packed-Bed Bioreactor
2.4. Neutralization Reaction
2.5. Determination Method
3. Results and Discussion
3.1. Solid Characterization
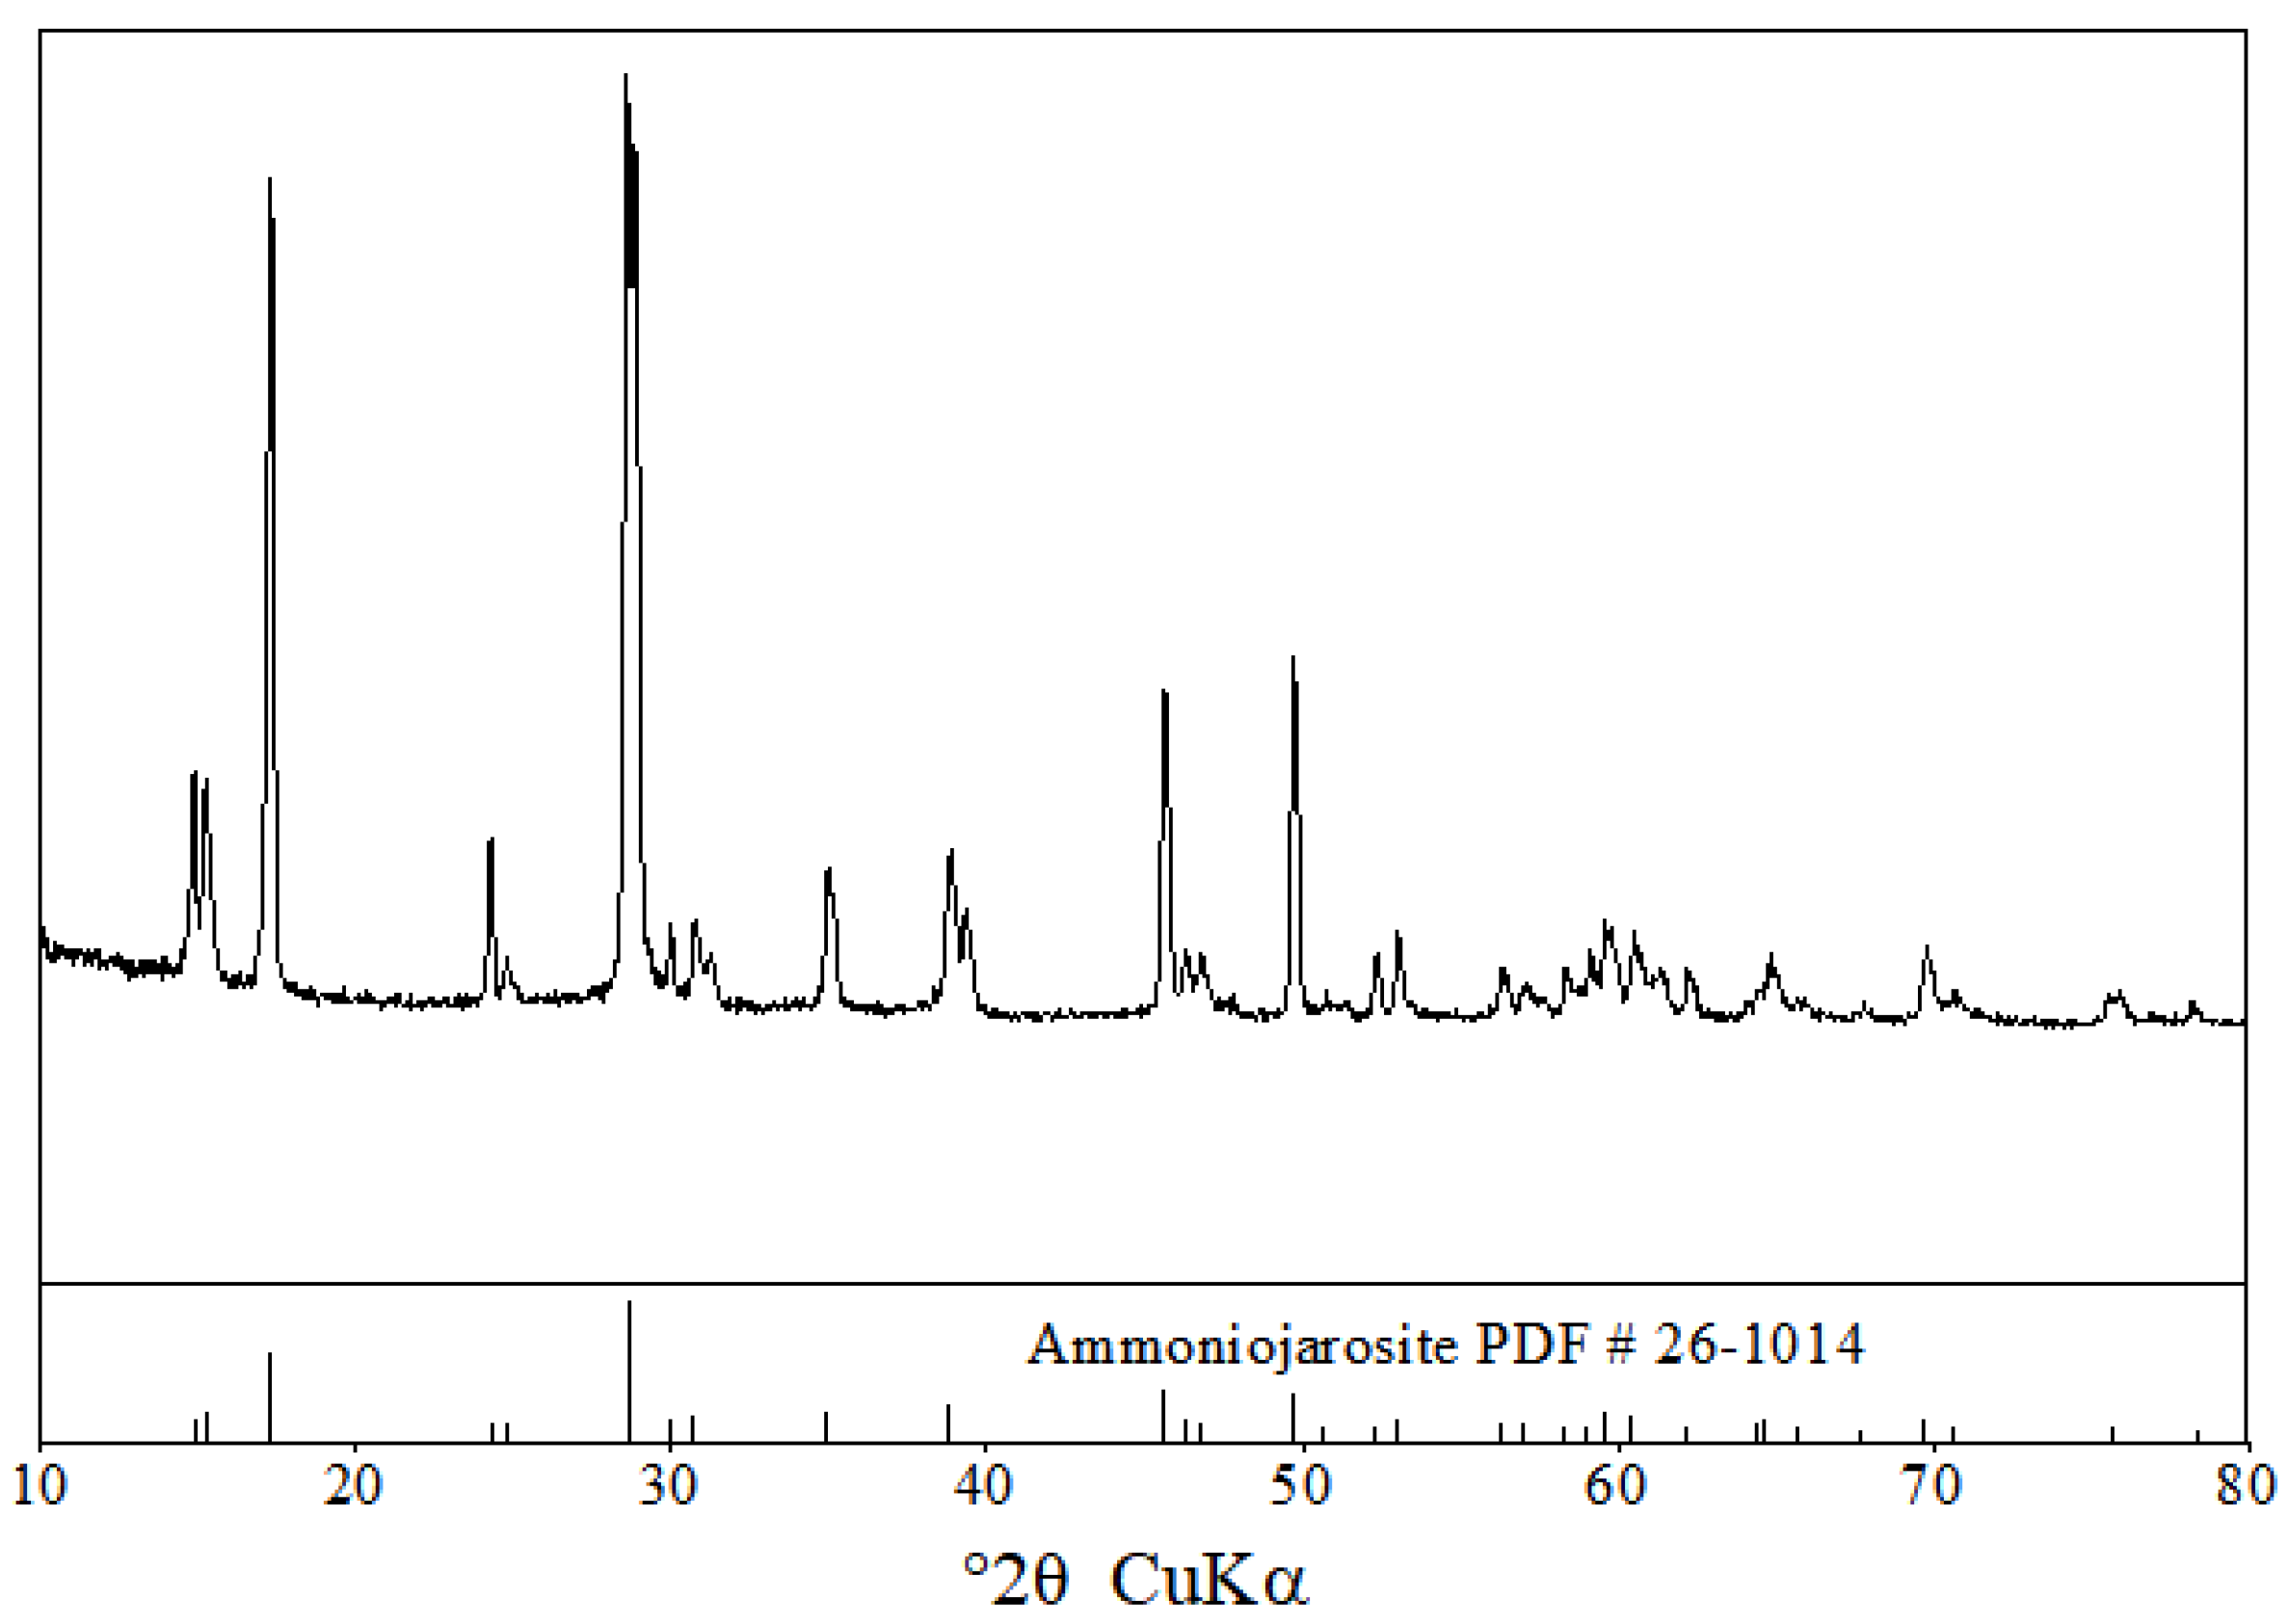
3.1.1. XRD
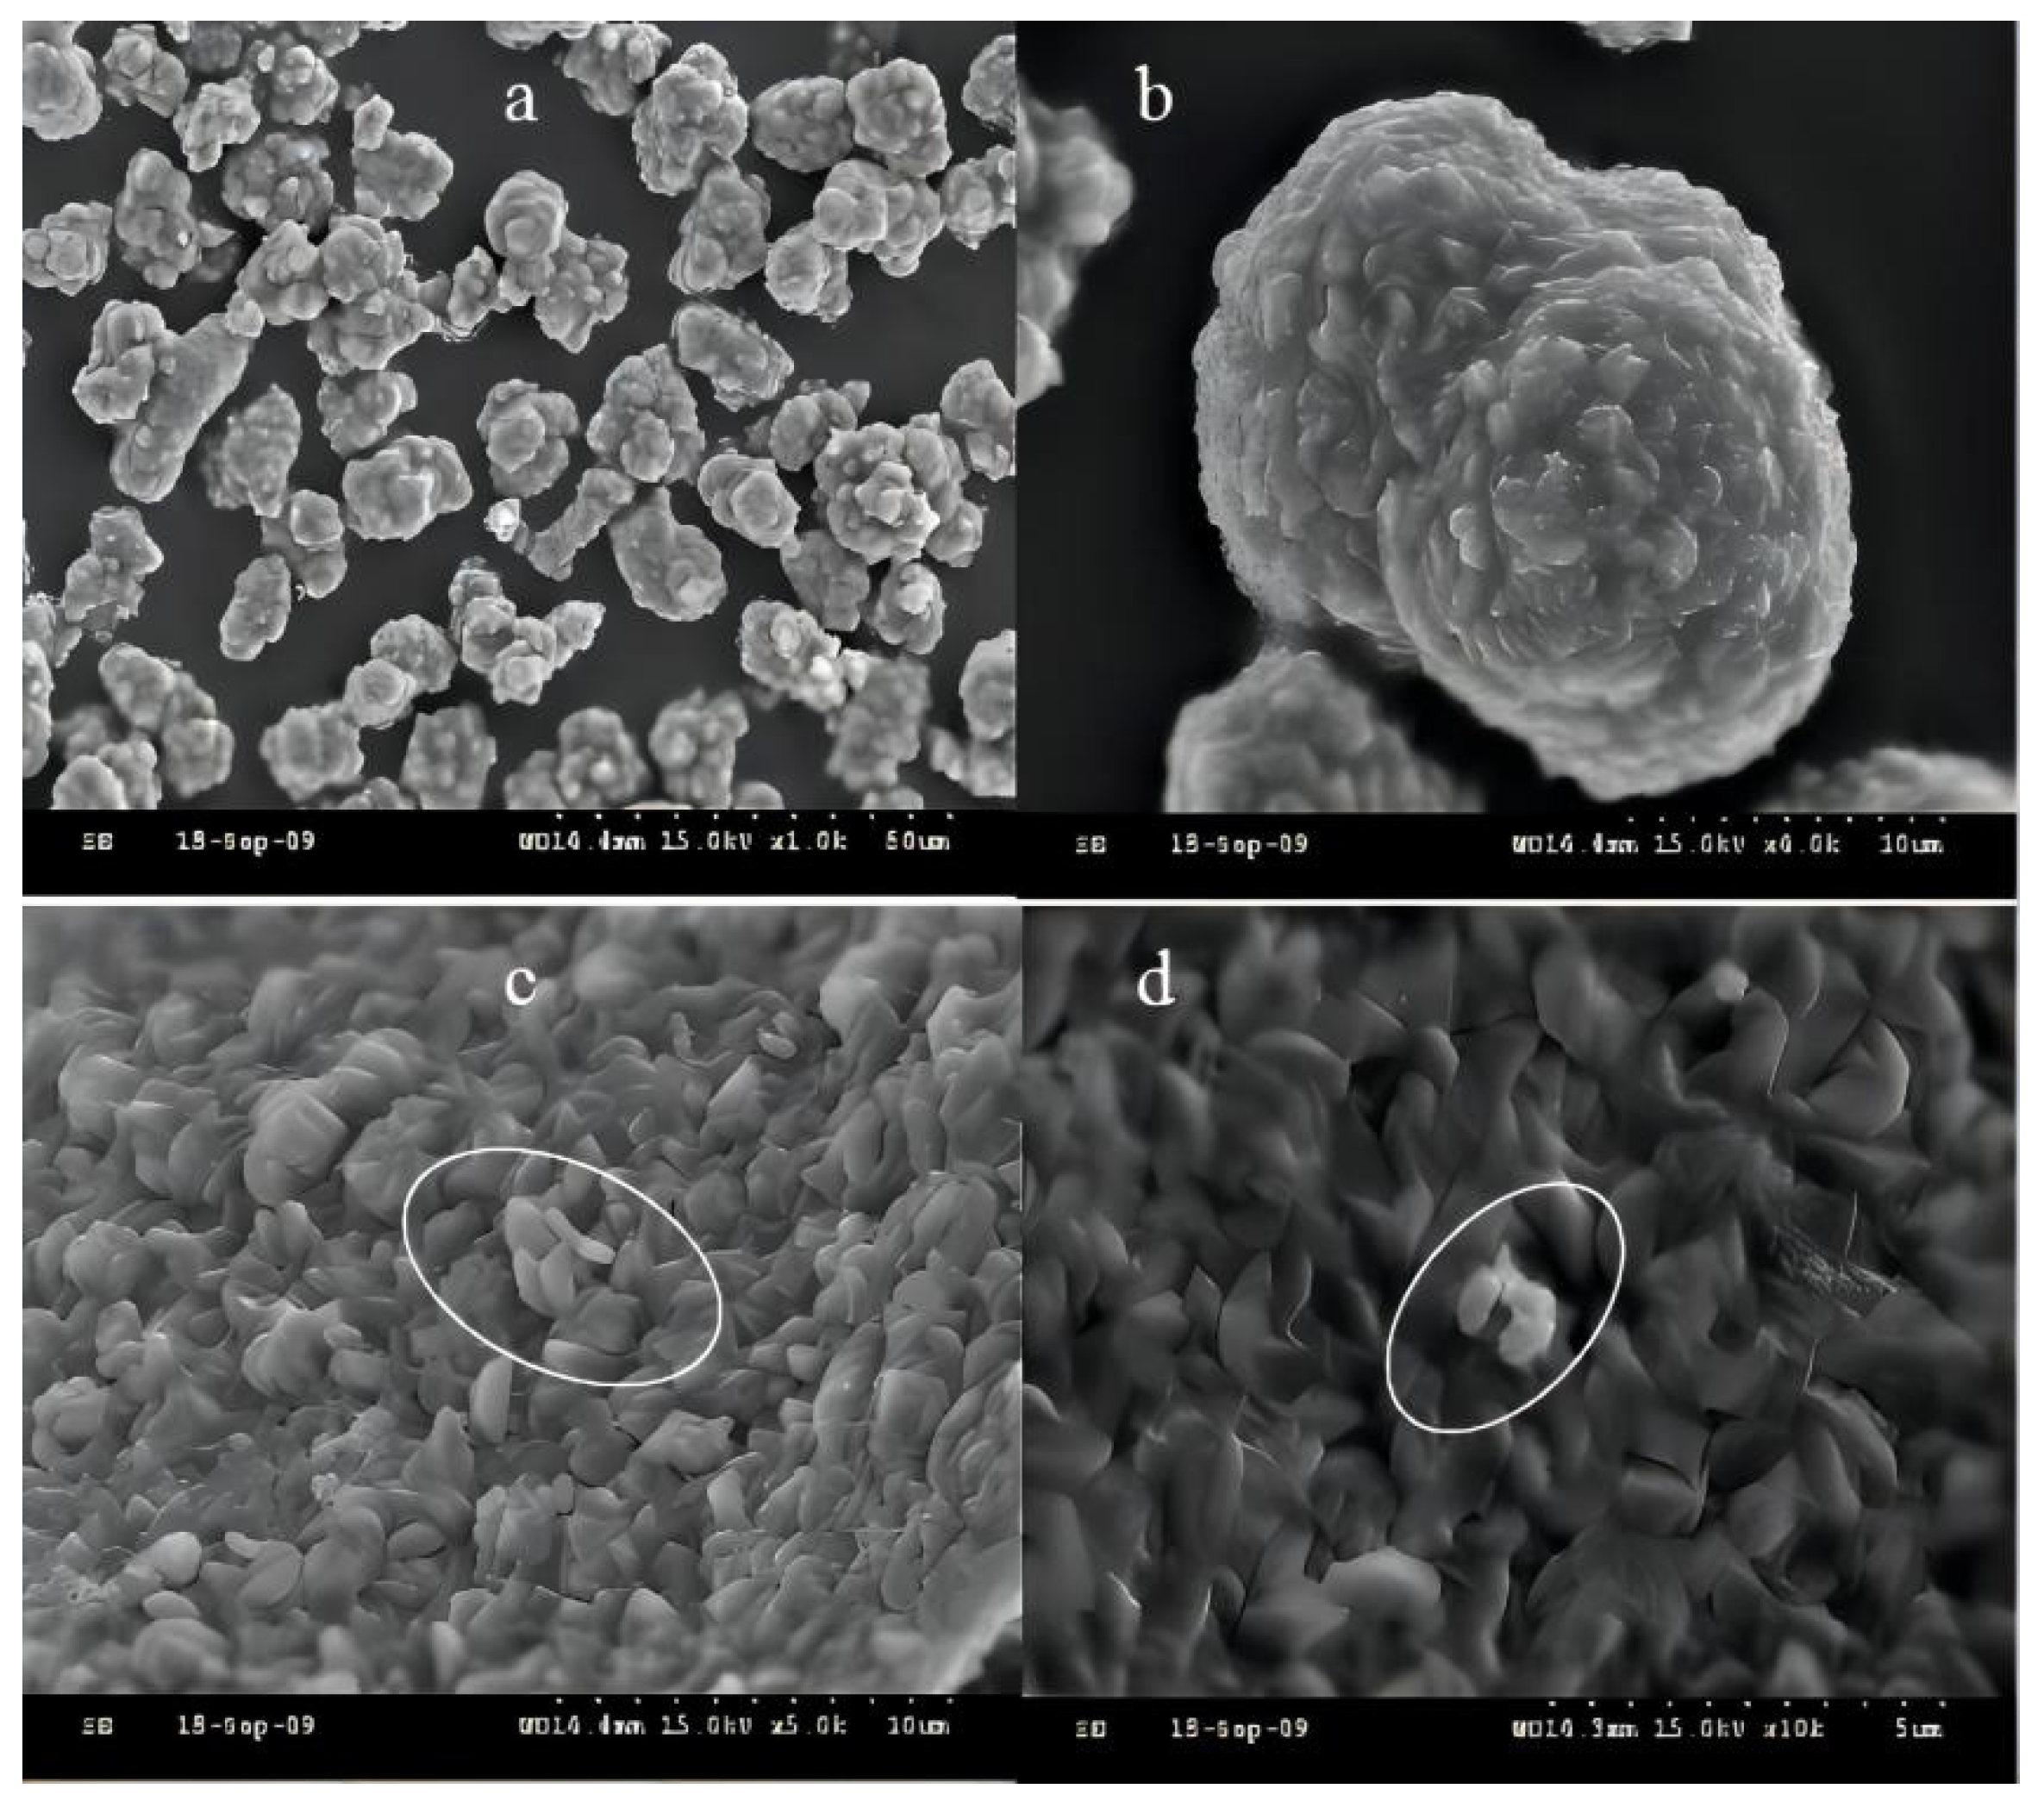
3.1.2. SEM
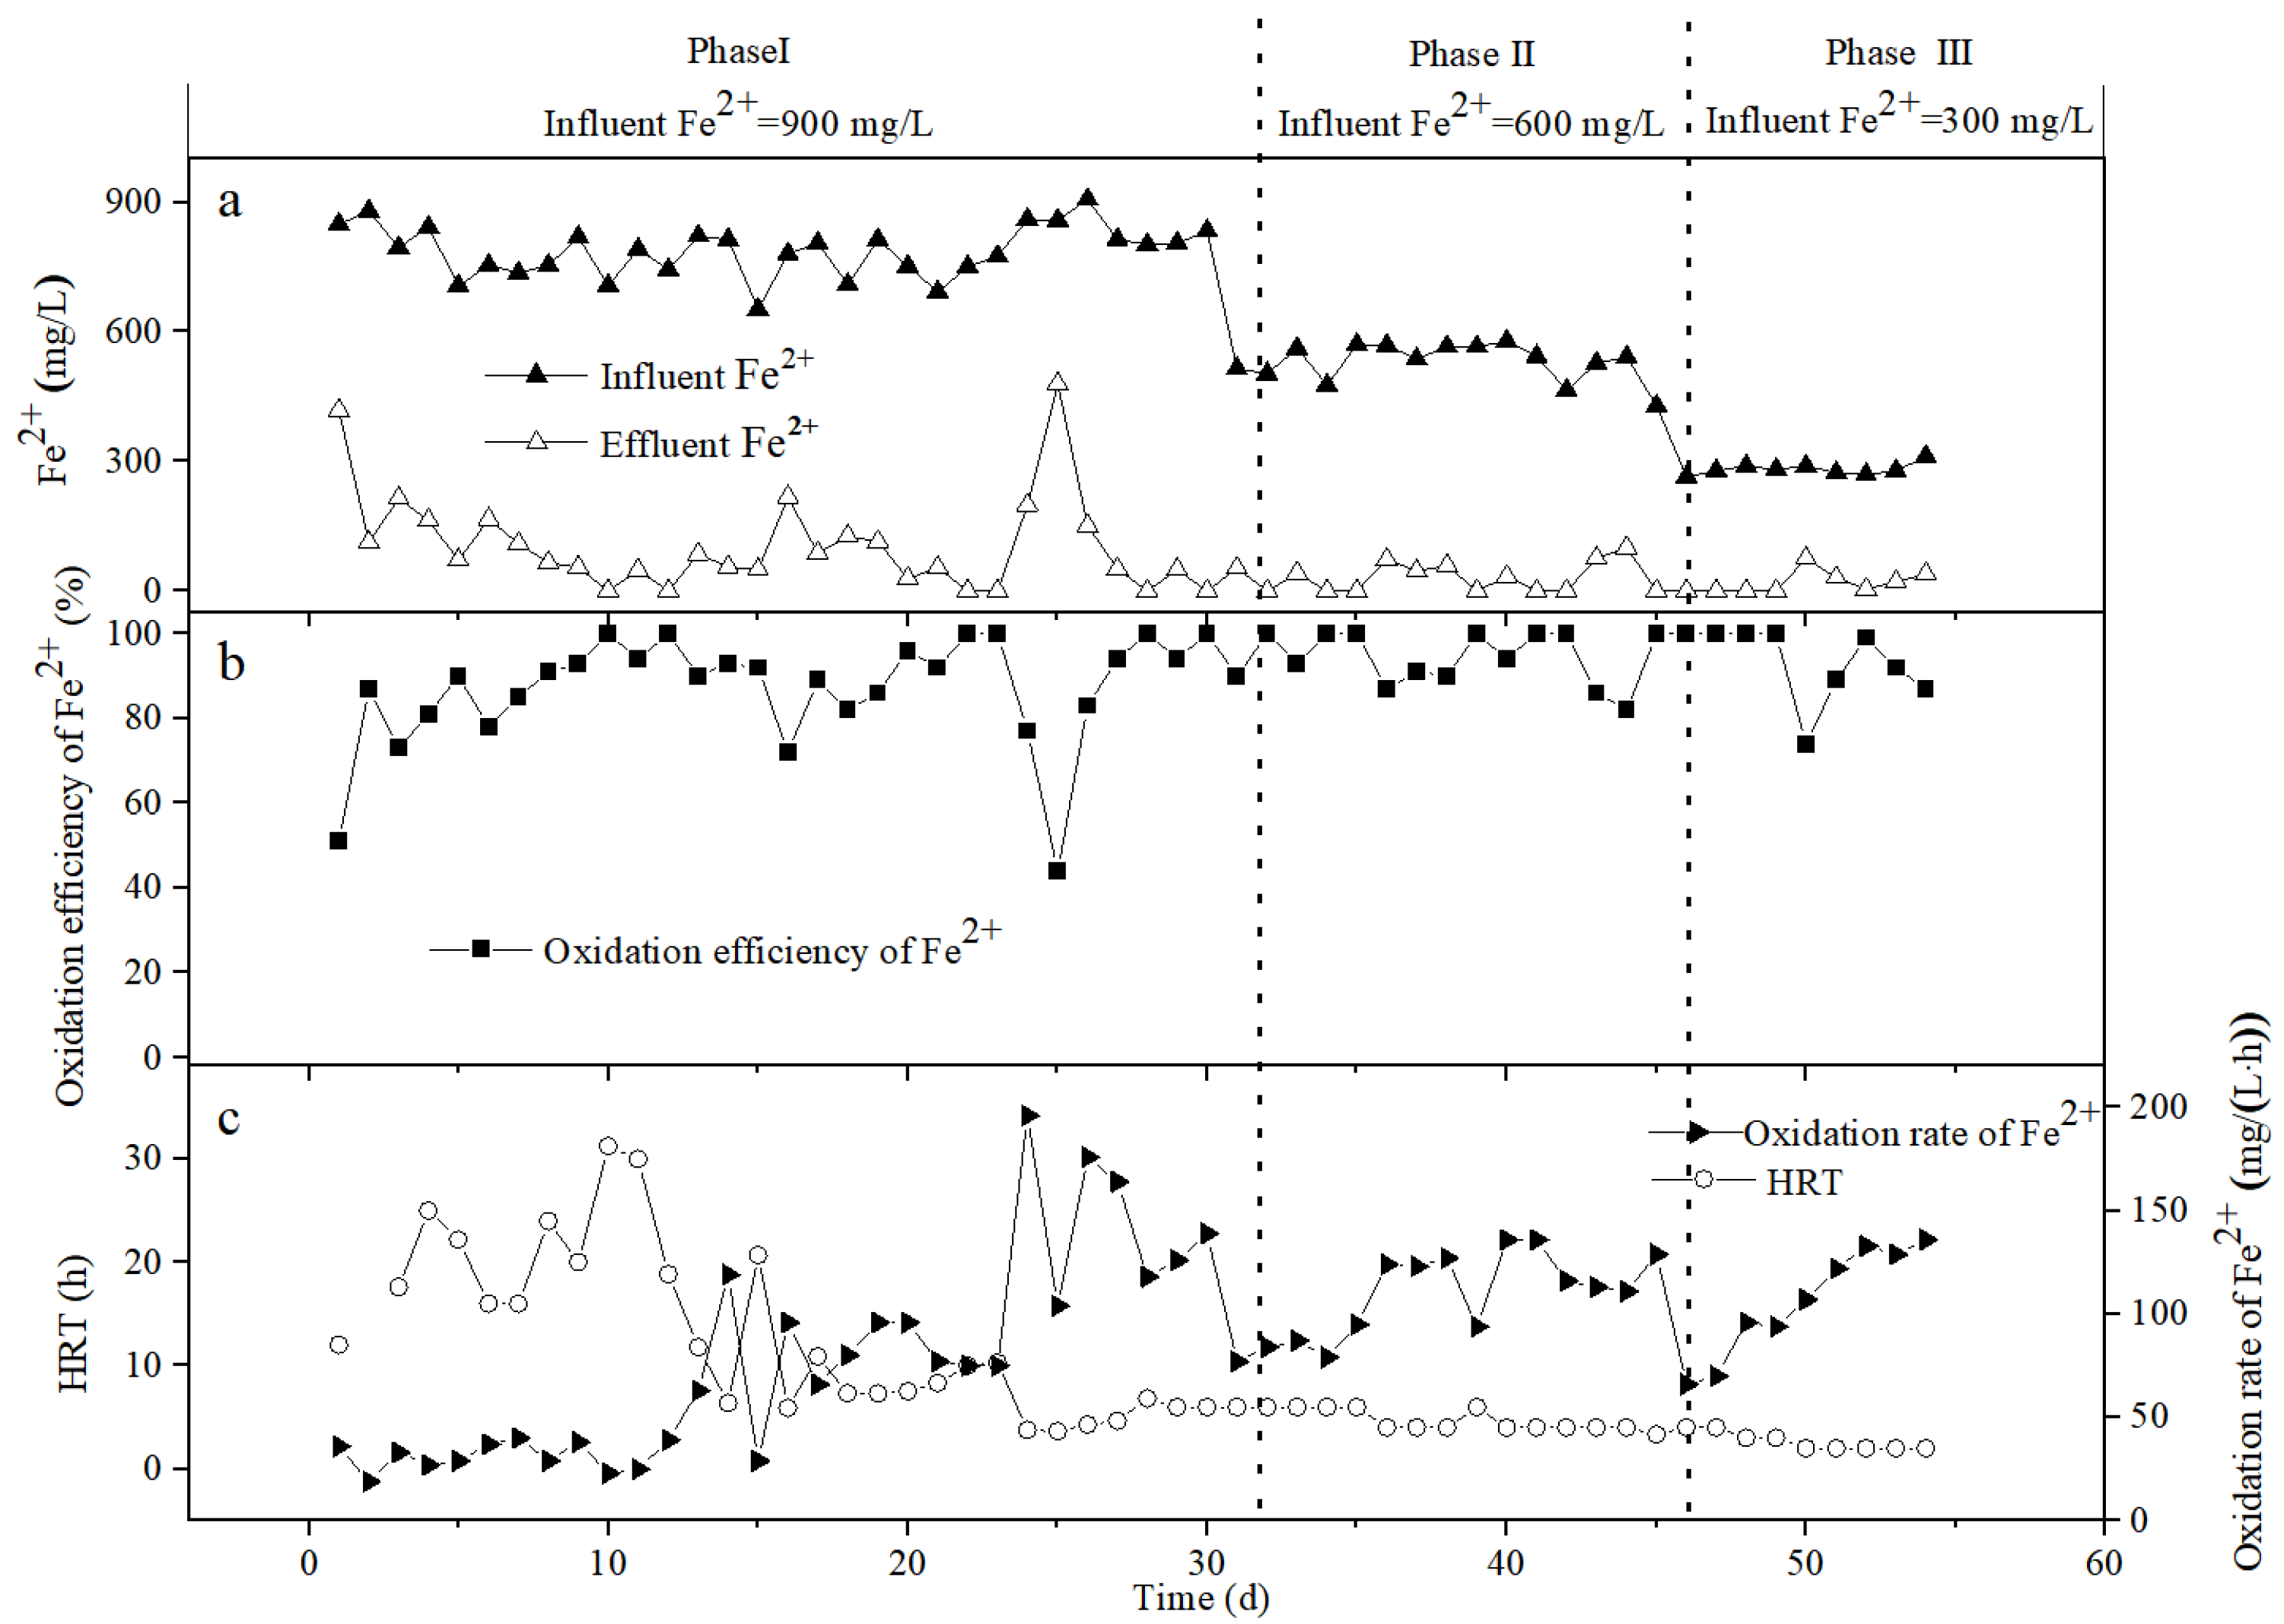
3.2. The Oxidation Effect of Bio-Volcanic Stone on Fe2+
3.3. The Oxidation Effect of Bio-Ceramsite on Fe2+
3.4. The Oxidation Effect of Bio-Activated Carbon on Fe2+
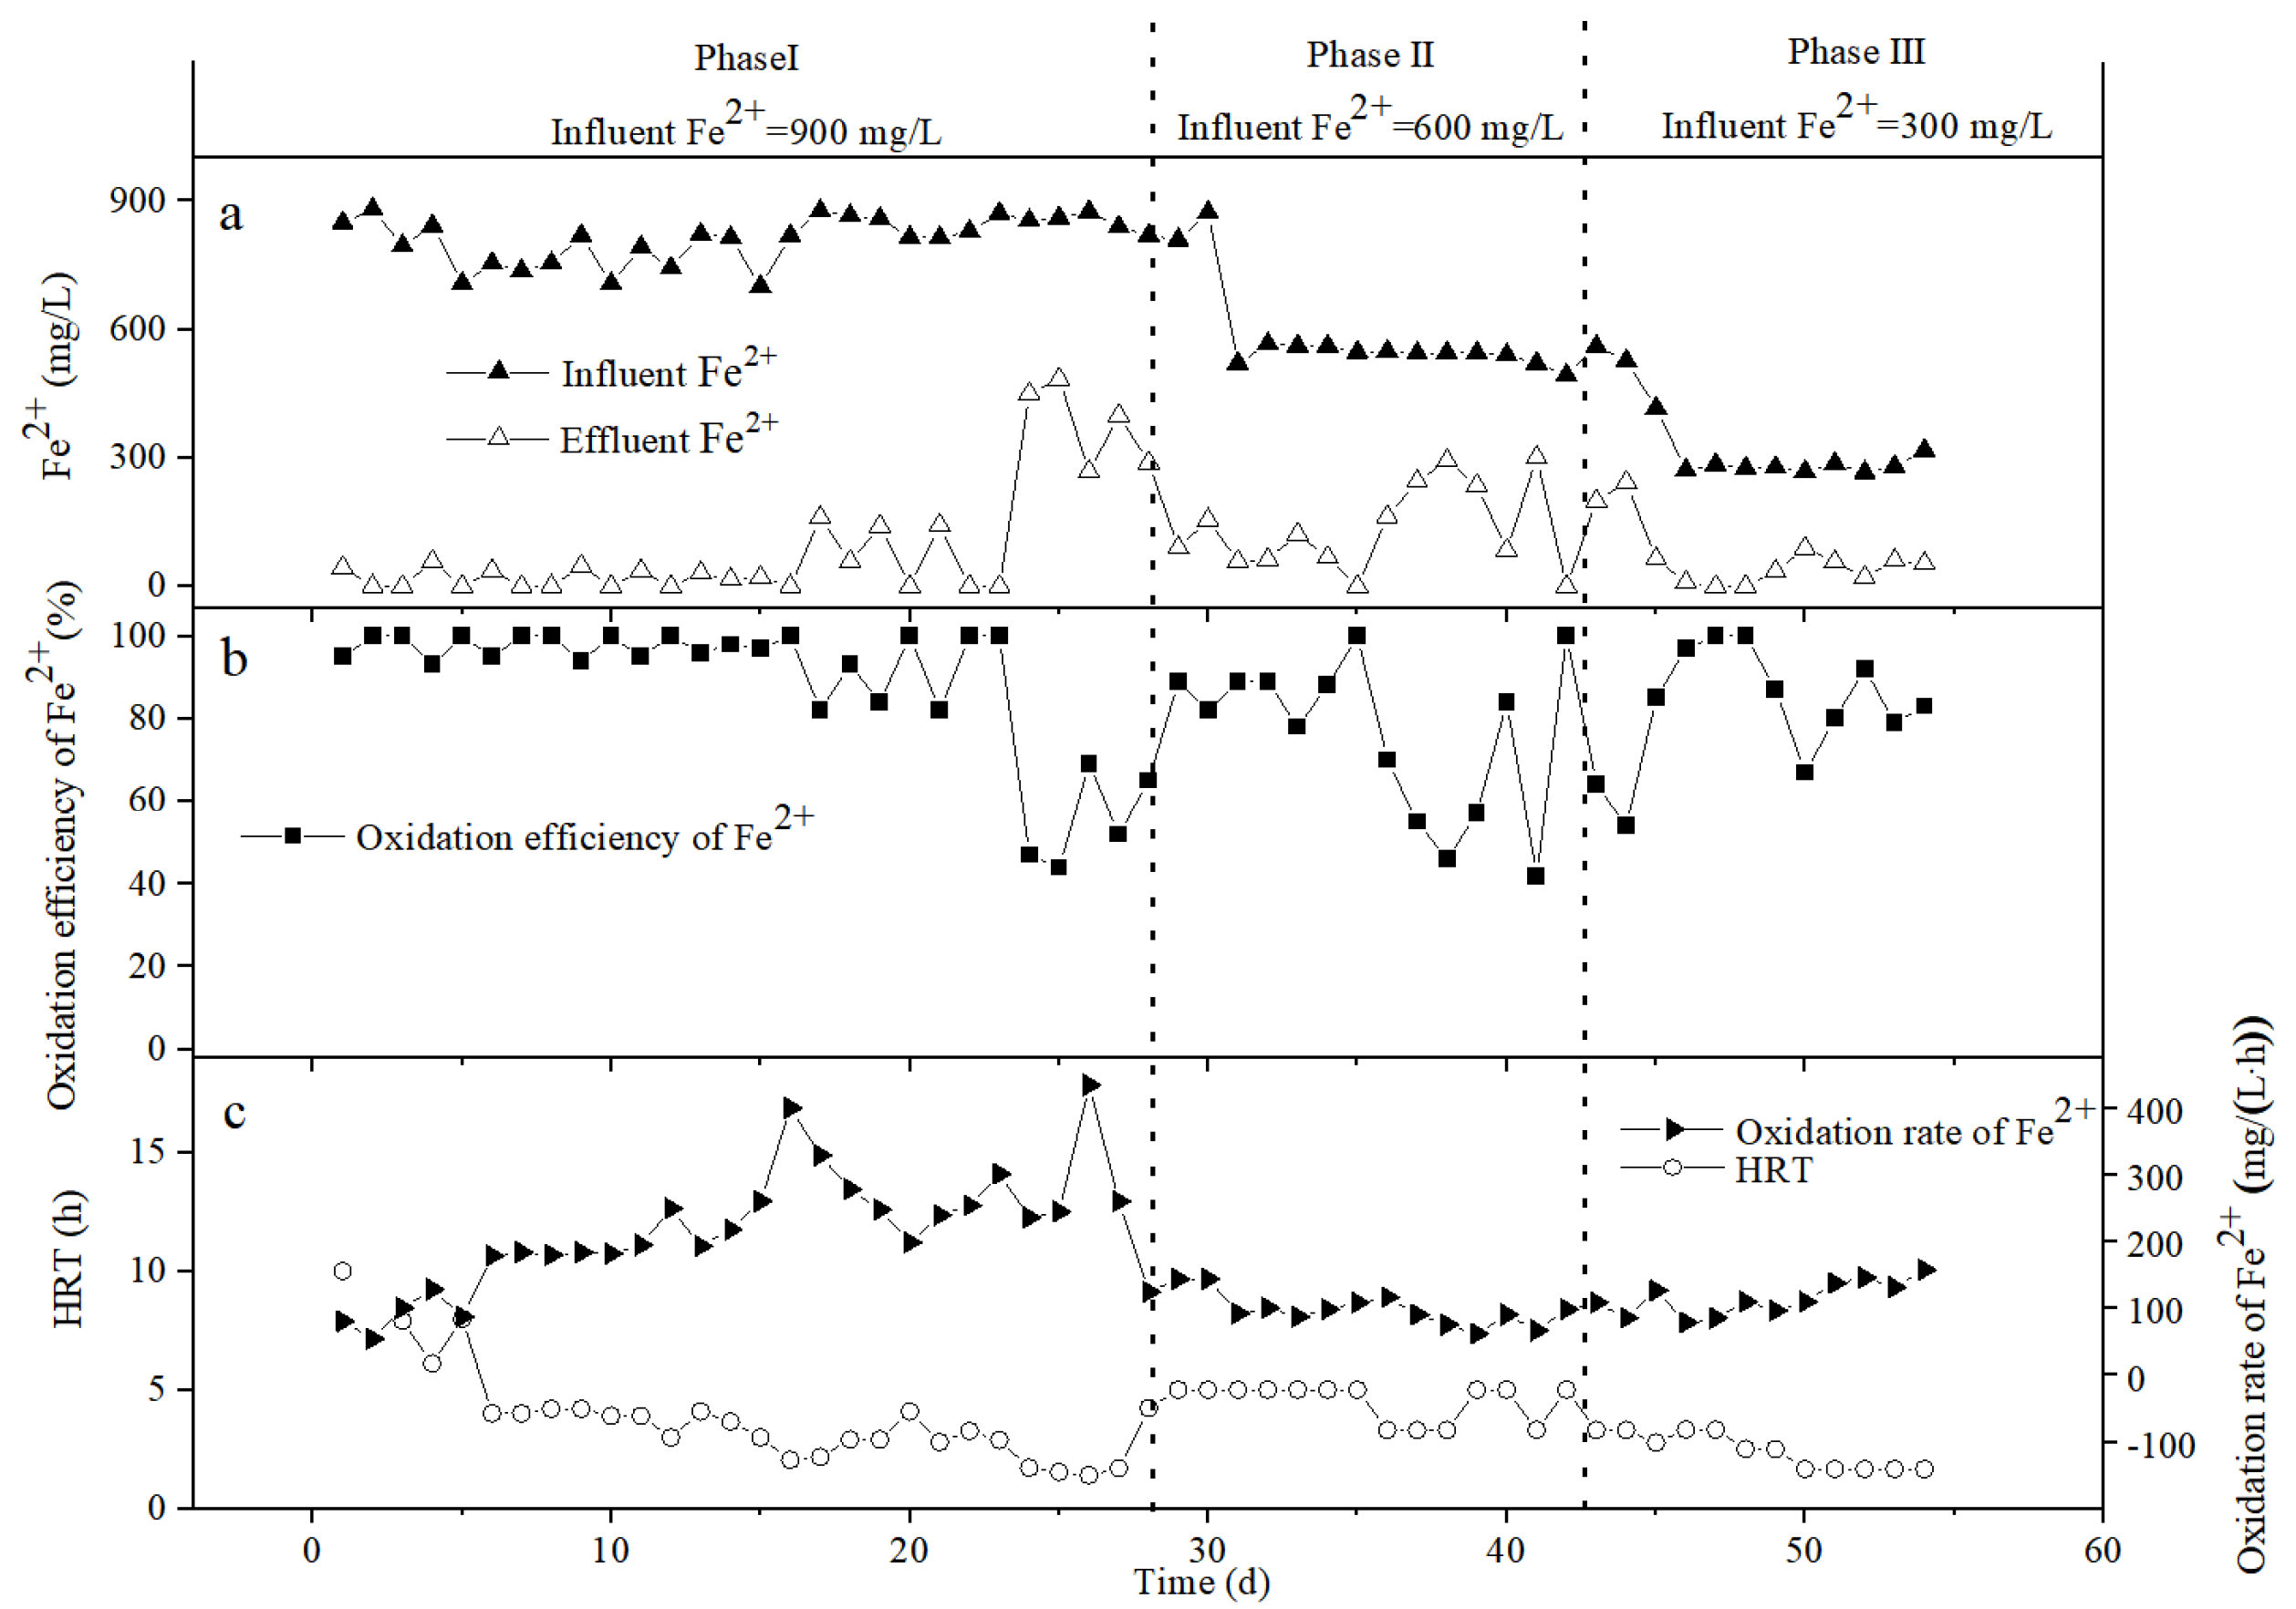
3.5. The Change of the Fe2+ Oxidation Rate in the Different Packed Columns
3.6. The Influence of Fe2+ Oxidation on the Subsequent Neutralization Treatment
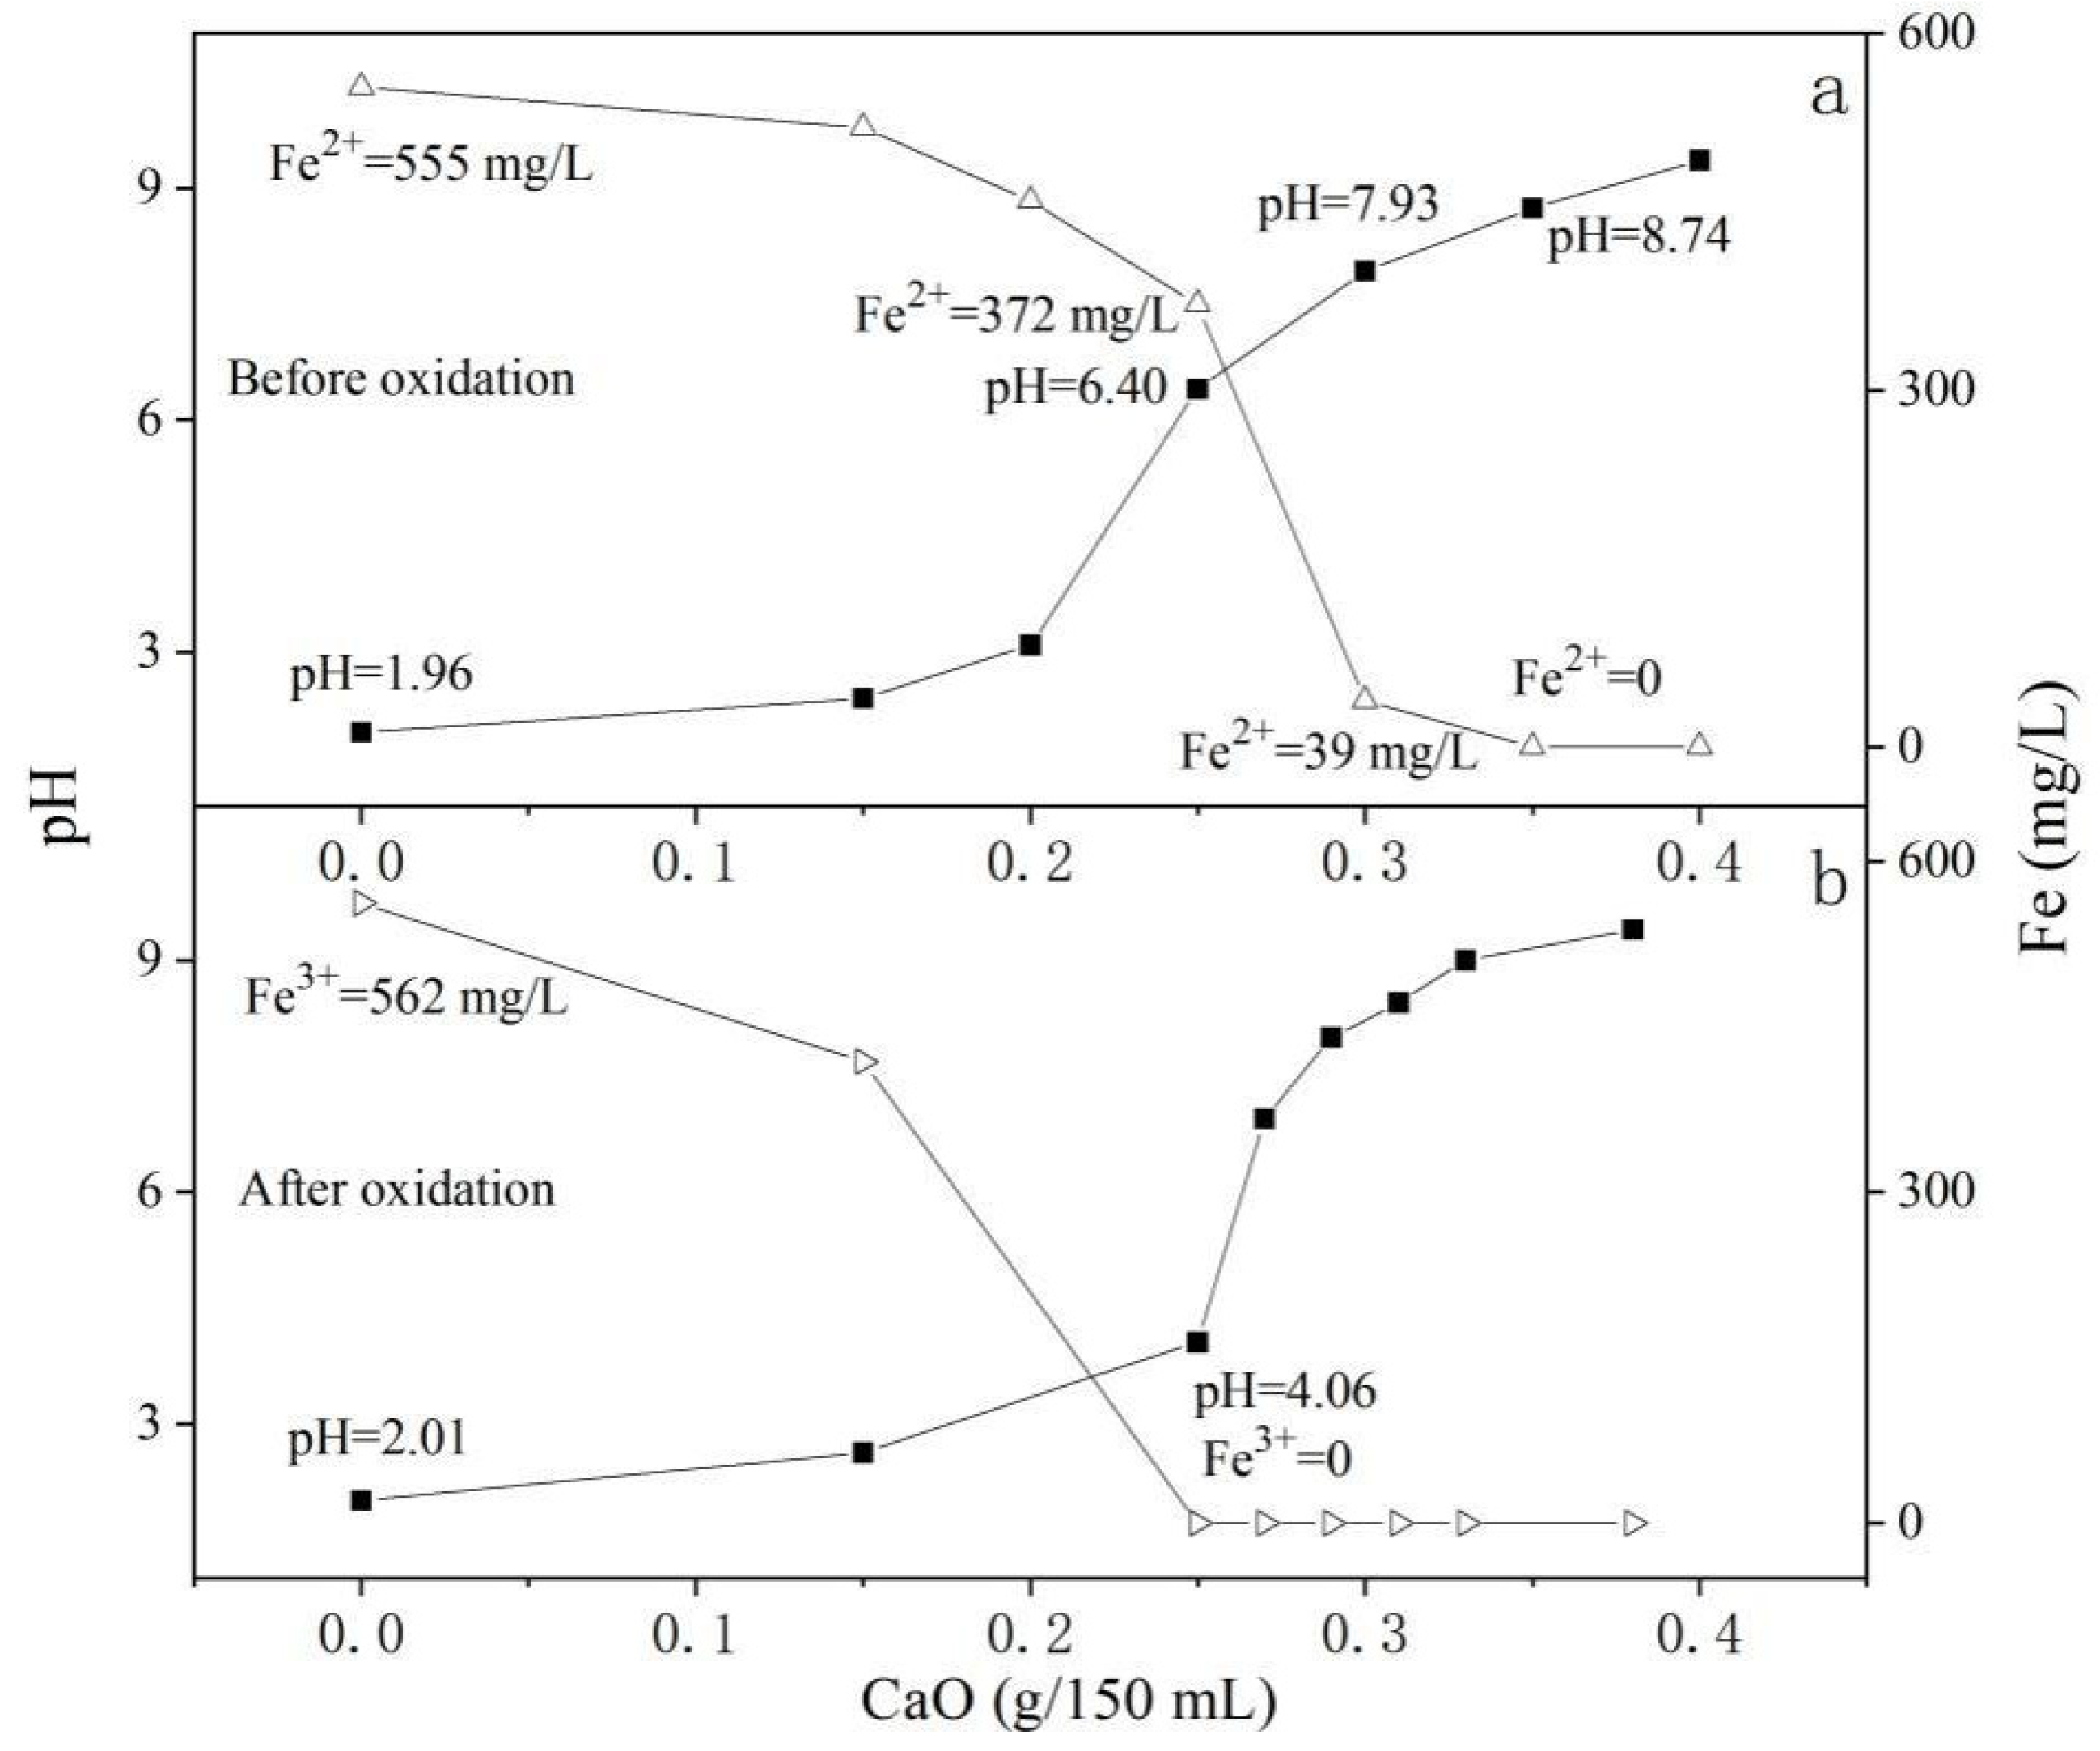
3.6.1. The Influence of Fe2+ Oxidation on the Removal of Fe by Lime (CaO) Neutralization
3.6.2. The Influence of Fe2+ Oxidation on the Removal of Fe by Limestone (CaCO3) Neutralization
3.6.3. Advantage Analysis for the Enhanced Microbial Oxidation–Neutralization Method
4. Conclusions
Author Contributions
Funding
Institutional Review Board Statement
Informed Consent Statement
Data Availability Statement
Conflicts of Interest
References
- Nordstrom, D.K.; David, W.B.; Carol, J.P. Hydrogeochemistry and microbiology of mine drainage: An update. Appl. Geochem. J. Int. Assoc. Geochem. Cosmochem. 2015, 57, 3–16. [Google Scholar] [CrossRef]
- Gayathri, N.; Seongchul, R.; Ramesh, T.; Youngkwon, C.; Sanghyun, J.; Saravanamuthu, V. A critical review on remediation, reuse, and resource recovery from acid mine drainage. Environ. Pollut. 2019, 247, 1110–1124. [Google Scholar]
- Mira, L.K.S.; Juan, A.B.; David, G.; Albert, G. Optimisation of the operational parameters for a comprehensive bioelectrochemical treatment of acid mine drainage. J. Hazard. Mater. 2020, 409, 124944. [Google Scholar]
- Lu, A.; Li, B.; Li, J.; Chen, W.; Xu, L. Heavy metals in paddy soil-rice systems of industrial and township areas from subtropical China: Levels, transfer and health risks. J. Geochem. Explor. 2018, 194, 210–217. [Google Scholar] [CrossRef]
- Li, H.; Xu, L.; Feng, N.; Lu, A.; Chen, W.; Wang, Y. Occurrence, risk assessment, and source of heavy metals in Liaohe River Protected Area from the watershed of Bohai Sea, China. Mar. Pollut. Bull. 2021, 169, 112489. [Google Scholar] [CrossRef] [PubMed]
- Chen, G.; Ye, Y.; Yao, N.; Hu, N.; Zhang, J.; Huang, Y. A critical review of prevention, treatment, reuse, and resource recovery from acid mine drainage. J. Clean. Prod. 2021, 330, 129904. [Google Scholar] [CrossRef]
- Takoua, F.; Tsiverihasina, V.R.; Carmen, M.N.; Lucie, C.; Lefebvre, O. Comparative efficiency of microbial fuel cells and electrocoagulation for the treatment of iron-rich acid mine drainage. J. Environ. Chem. Eng. 2019, 7, 103149. [Google Scholar]
- Kamalpreet, K.B.; Selma, E.; Sara, M.; Laura, C.; Satinder, K.B. Novel approach for the management of acid mine drainage (AMD) for the recovery of heavy metals along with lipid production by Chlorella vulgaris. J. Environ. Manag. 2022, 308, 114507. [Google Scholar]
- Vhahangwele, M.; Elvis, F.K.; Ednah, M.; Thabo, T.I.N.; Bhekie, B.M.; Mu, N.; Sadanand, P. Emerging remediation potentiality of struvite developed from municipal wastewater for the treatment of acid mine drainage. Environ. Res. 2022, 210, 112944. [Google Scholar]
- Perez, L.S.V.; Nava, J.R.; Flores, G.H.; Mendoza, O.T.; Alvarado, C.E.; Varaldo, H.M.P.; Feria, O.S.; Diaz, J.A.L. Industrial acid mine drainage and municipal wastewater co-treatment by dual-chamber microbial fuel cells. Int. J. Hydrogen Energy 2022, 45, 13757–13766. [Google Scholar] [CrossRef]
- Yan, S.; Cheng, K.Y.; Christina, M.; Grant, D.; Maneesha, P.G.; Zheng, G.; Zhou, L.; Anna, H.K. Sequential hydrotalcite precipitation and biological sulfate reduction for acid mine drainage treatment. Chemosphere 2020, 252, 126570. [Google Scholar] [CrossRef] [PubMed]
- Wibowo, Y.G.; Naswir, M.; Ramadan, B.S. Performance of a novel biochar-clamshell composite for real acid mine drainage treatment. Bioresour. Technol. Rep. 2022, 17, 100993. [Google Scholar]
- Lin, Y.; Jessica, A.G.; Sara, S.G.; Aswathy, S.; Istvan, A.; Rachel, A.B. Advantageous microbial community development and improved performance of pilot-scale field systems treating high-risk acid mine drainage with crab shell. J. Hazard. Mater. 2021, 420, 126665. [Google Scholar] [CrossRef] [PubMed]
- Wang, H.; Zhang, M.; Xue, J.; Lv, Q.; Yang, J.; Han, X. Performance and microbial response in a multi-stage constructed wetland microcosm co-treating acid mine drainage and domestic wastewater. J. Environ. Chem. Eng. 2021, 9, 106786. [Google Scholar] [CrossRef]
- Zheng, H.; Zhang, Z.; Xing, X.; Hu, T.; Qu, C.; Chen, W.; Zhang, J. Potentially Toxic Metals in Soil and Dominant Plants from Tonglushan Cu-Fe Deposit, Central China. Bull. Environ. Contam. Toxicol. 2019, 102, 92–97. [Google Scholar] [CrossRef]
- Chen, Y.; Huang, H.; Ding, Y.; Chen, W.; Luo, J.; Li, H.; Wu, J.; Chen, W.; Qi, S. Trace metals in aquatic environments of a mangrove ecosystem in Nansha, Guangzhou, South China: Pollution status, sources, and ecological risk assessment. Environ. Monit. Assess. 2019, 191, 629. [Google Scholar] [CrossRef]
- Jing, M.; Chen, W.; Zheng, T.; Liao, Y.; Julia, E.B.; Xu, M.; Yang, C.; Shen, L.; Liang, M. Water geochemical characteristic variations in and around a karst-dominated natural reserve area, southwestern China. Environ. Earth Sci. 2011, 64, 1051–1058. [Google Scholar] [CrossRef]
- Chai, Y.; Qin, P.; Zhang, J.; Li, T.; Dai, Z. Simultaneous removal of Fe(II) and Mn(II) from acid mine wastewater by electro-Fenton process. Process Saf. Environ. Prot. 2020, 143, 76–90. [Google Scholar] [CrossRef]
- Wei, X.; Wang, Q.; Lei, Z.; Hu, E.; Wang, H.; Zhao, J.; Li, D.; Li, P.; Yu, C.; Xu, Y. In-situ expanded experimental study on rapid bacterial oxidation of Fe in uranium adsorption tail liquor in Xinjiang in-situ leaching. Conserv. Util. Miner. Resour. 2020, 40, 9–16. [Google Scholar]
- Parka, S.M.; Shin, S.Y.; Yang, J.S.; Ji, S.W.; Baek, K. Selective Recovery of Dissolved Metals from Mine Drainage Using Electrochemical Reactions. Electrochim. Acta 2015, 181, 248–254. [Google Scholar] [CrossRef]
- Keolebogile, R.S.; Jonas, K.J.; Sithole, B.B. Beneficiation of pulp mill waste green liquor dregs: Applications in treatment of acid mine drainage as new disposal solution in South Africa. J. Clean. Prod. 2020, 246, 118979. [Google Scholar]
- Song, Y.; Yang, L.; Wang, H.; Sun, X.; Bai, S.; Wang, N.; Liang, J.; Zhou, L. The coupling reaction of Fe2+ bio-oxidation and resulting Fe3+ hydrolysis drastically improve the formation of iron hydroxysulfate minerals in AMD. Environ. Technol. 2019, 42, 2325–2334. [Google Scholar] [CrossRef] [PubMed]
- Wang, H.; Yang, L.; Wang, R.; Yang, J.; Cao, Y.; Song, Y. Fe2+ oxidation and mineralization properties of A. ferrooxidans biofilm immobilized on three fillers. Acta Sci. Circumstantiae 2022, 42, 1–9. [Google Scholar] [CrossRef]
- Bigham, J.M.; Schwertmann, U.; Pfab, G. Influence of pH on mineral speciation in a bioreactor simulating acid mine drainage. Appl. Geochem. 1996, 11, 845–849. [Google Scholar] [CrossRef]
- Nemati, M.; Harrison, S.T.L.; Hansford, G.S.; Webb, C. Biological oxidation of ferrous sulphate by Thiobacillus ferrooxidans: A review on the kinetic aspects. Biochem. Eng. J. 1998, 1, 171–190. [Google Scholar] [CrossRef]
- Umita, T. Biological mine drainage treatment. Resour. Conserv. Recycl. 1996, 16, 179–188. [Google Scholar] [CrossRef]
- Xiang, Y.; Zhang, X.; Lei, Y.; Fang, C.; Yuan, Y.; Jiang, Y.; Xu, Z. Influencing Factors for Phosphorus Removal by Modified Bio-ceramic Substrates Coated with ZnAl-LDHs Synthesized by Different Modification Conditions. Environ. Sci. 2018, 39, 2184–2194. [Google Scholar]
- Marina, G.; Vittoria, G.; Dragana, M.P.; Paola, V. Activated carbon coupled with advanced biological wastewater treatment: A review of the enhancement in micropollutant removal. Sci. Total Environ. 2021, 709, 148050. [Google Scholar]
- He, X.; Li, H.; Zhu, J. A value-added insight of reusing microplastic waste: Carrier particle in fluidized bed bioreactor for simultaneous carbon and nitrogen removal from septic wastewater. Biochem. Eng. J. 2019, 151, 107300. [Google Scholar] [CrossRef]
- Ji, G.; Tong, J.; Tan, Y. Wastewater treatment efficiency of a multi-media biological aerated filter (MBAF) containing clinoptilolite and bioceramsite in a brick-wall embedded design. Bioresour. Technol. 2011, 102, 550–557. [Google Scholar] [CrossRef]
- Godwin, A.T.; Lekene, N.R.B.; Kouotou, D.; Ankoro, N.O.; Abega, A.V.; Ndi, N.J.; Ketcha, J.M. Non-linear modelling of the adsorption of Indigo Carmine dye from wastewater onto characterized activated carbon/volcanic ash composite. Arab. J. Chem. 2022, 15, 103515. [Google Scholar]


| Packed Column | Time (d) | HRT (h) | Influent Fe2+ (mg/L) | Effluent Fe2+ (mg/L) | Fe2+ Oxidation Efficiency | Fe2+ Oxidation Rate (mg/(L·h)) |
|---|---|---|---|---|---|---|
| Bio-ceramsite | 23 | 2.89 | 871 | 0 | 100% | 301 |
| Bio-volcanic stone | 28 | 3.40 | 814 | 20 | 98% | 234 |
| Bio-activated carbon | 30 | 6.00 | 834 | 0 | 100% | 139 |
| Neutralizer | The Precipitate Obtained by Neutralization after Oxidation (Containing Fe(OH)3) | The Precipitate Obtained by Neutralization before Oxidation (Containing Fe(OH)2) | ||||||
|---|---|---|---|---|---|---|---|---|
| Form | Solid Content | CST (s) | SV30 | Form | Solid Content | CST(s) | SV30 | |
| CaCO3 | Bright yellow with compact structure | 5.50% | 8.9 | 4% | / | / | / | / |
| CaO | Orange yellow With loose structure | 1.60% | 21.1 | 28% | Blackish green with loose structure | 2.75% | 13.7 | 24% |
Publisher’s Note: MDPI stays neutral with regard to jurisdictional claims in published maps and institutional affiliations. |
© 2022 by the authors. Licensee MDPI, Basel, Switzerland. This article is an open access article distributed under the terms and conditions of the Creative Commons Attribution (CC BY) license (https://creativecommons.org/licenses/by/4.0/).
Share and Cite
He, W.; Li, H.; Xu, Y.; Zhong, F.; Dong, H.; Wang, M. Enhanced Microbial Oxidation–Neutralization Treatment of Acid Mine Drainage Rich in Ferrous Ions (Fe2+). Int. J. Environ. Res. Public Health 2022, 19, 6543. https://doi.org/10.3390/ijerph19116543
He W, Li H, Xu Y, Zhong F, Dong H, Wang M. Enhanced Microbial Oxidation–Neutralization Treatment of Acid Mine Drainage Rich in Ferrous Ions (Fe2+). International Journal of Environmental Research and Public Health. 2022; 19(11):6543. https://doi.org/10.3390/ijerph19116543
Chicago/Turabian StyleHe, Wenjie, Haibo Li, Yin Xu, Feng Zhong, Hao Dong, and Min Wang. 2022. "Enhanced Microbial Oxidation–Neutralization Treatment of Acid Mine Drainage Rich in Ferrous Ions (Fe2+)" International Journal of Environmental Research and Public Health 19, no. 11: 6543. https://doi.org/10.3390/ijerph19116543
APA StyleHe, W., Li, H., Xu, Y., Zhong, F., Dong, H., & Wang, M. (2022). Enhanced Microbial Oxidation–Neutralization Treatment of Acid Mine Drainage Rich in Ferrous Ions (Fe2+). International Journal of Environmental Research and Public Health, 19(11), 6543. https://doi.org/10.3390/ijerph19116543