
Then and Now: Investigating Anthropometrics and Child Mortality among Females in Malawi


Abstract
:1. Introduction
2. Materials and Methods
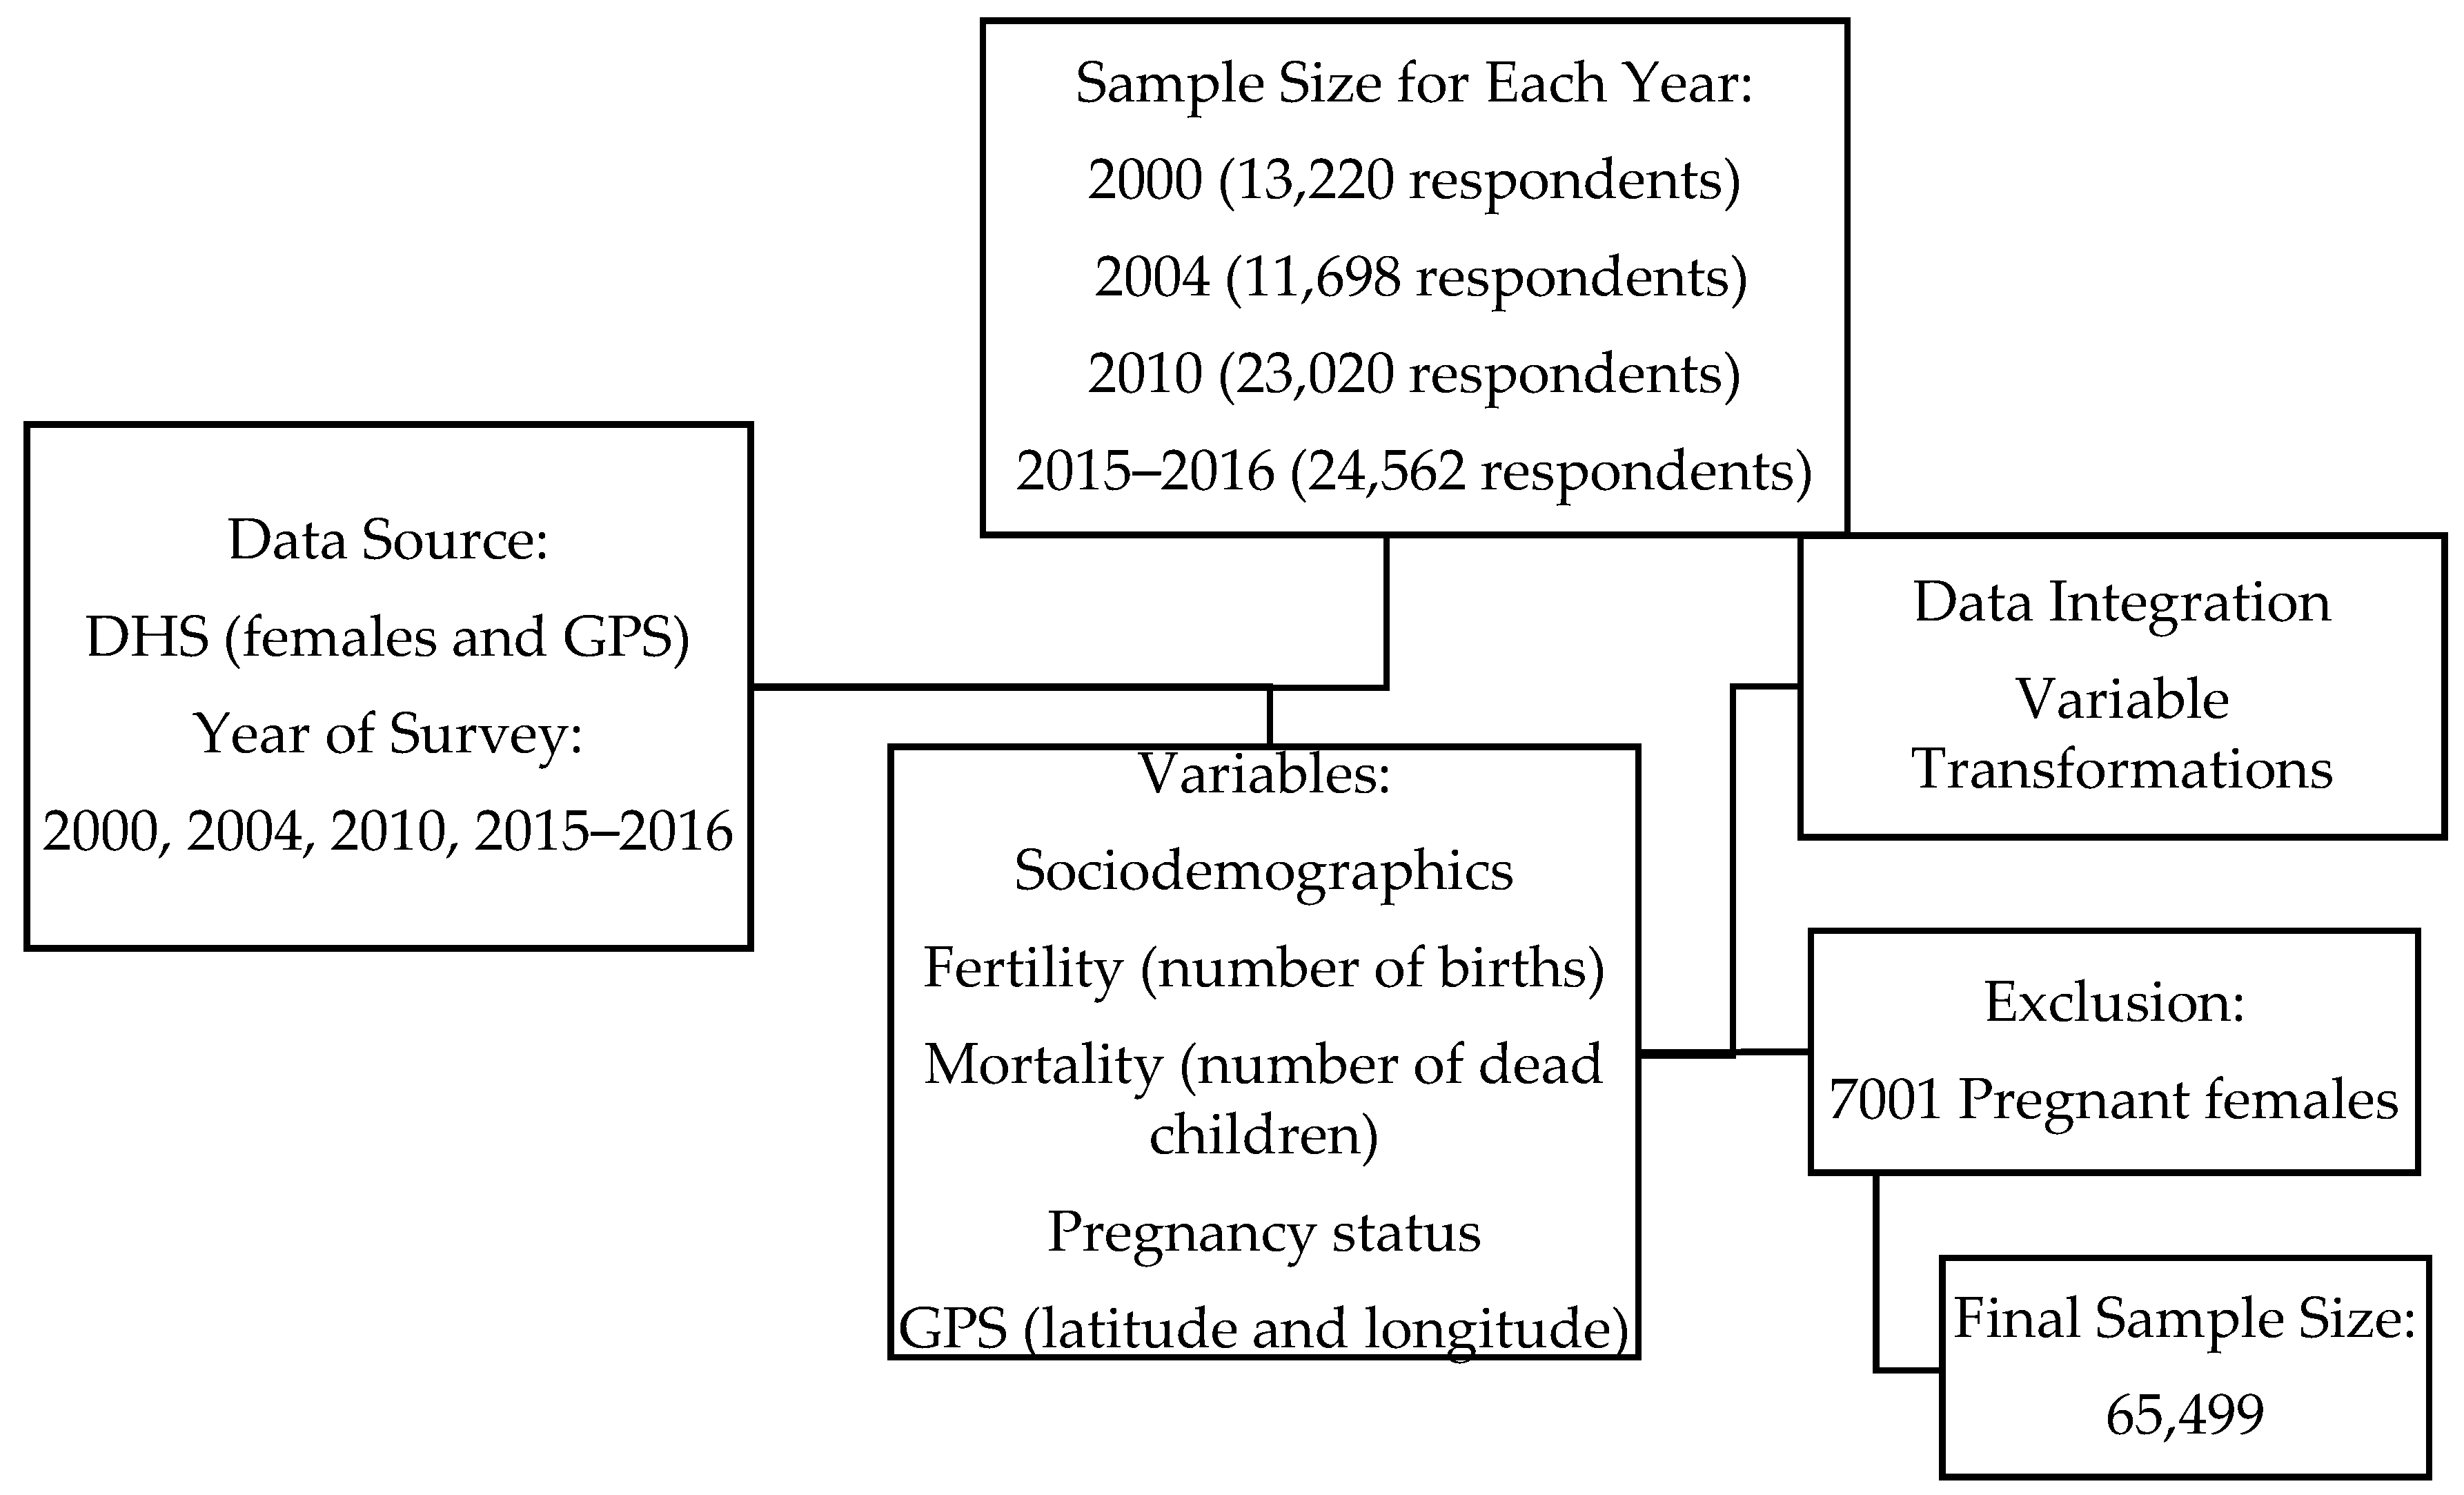
2.1. Data Source
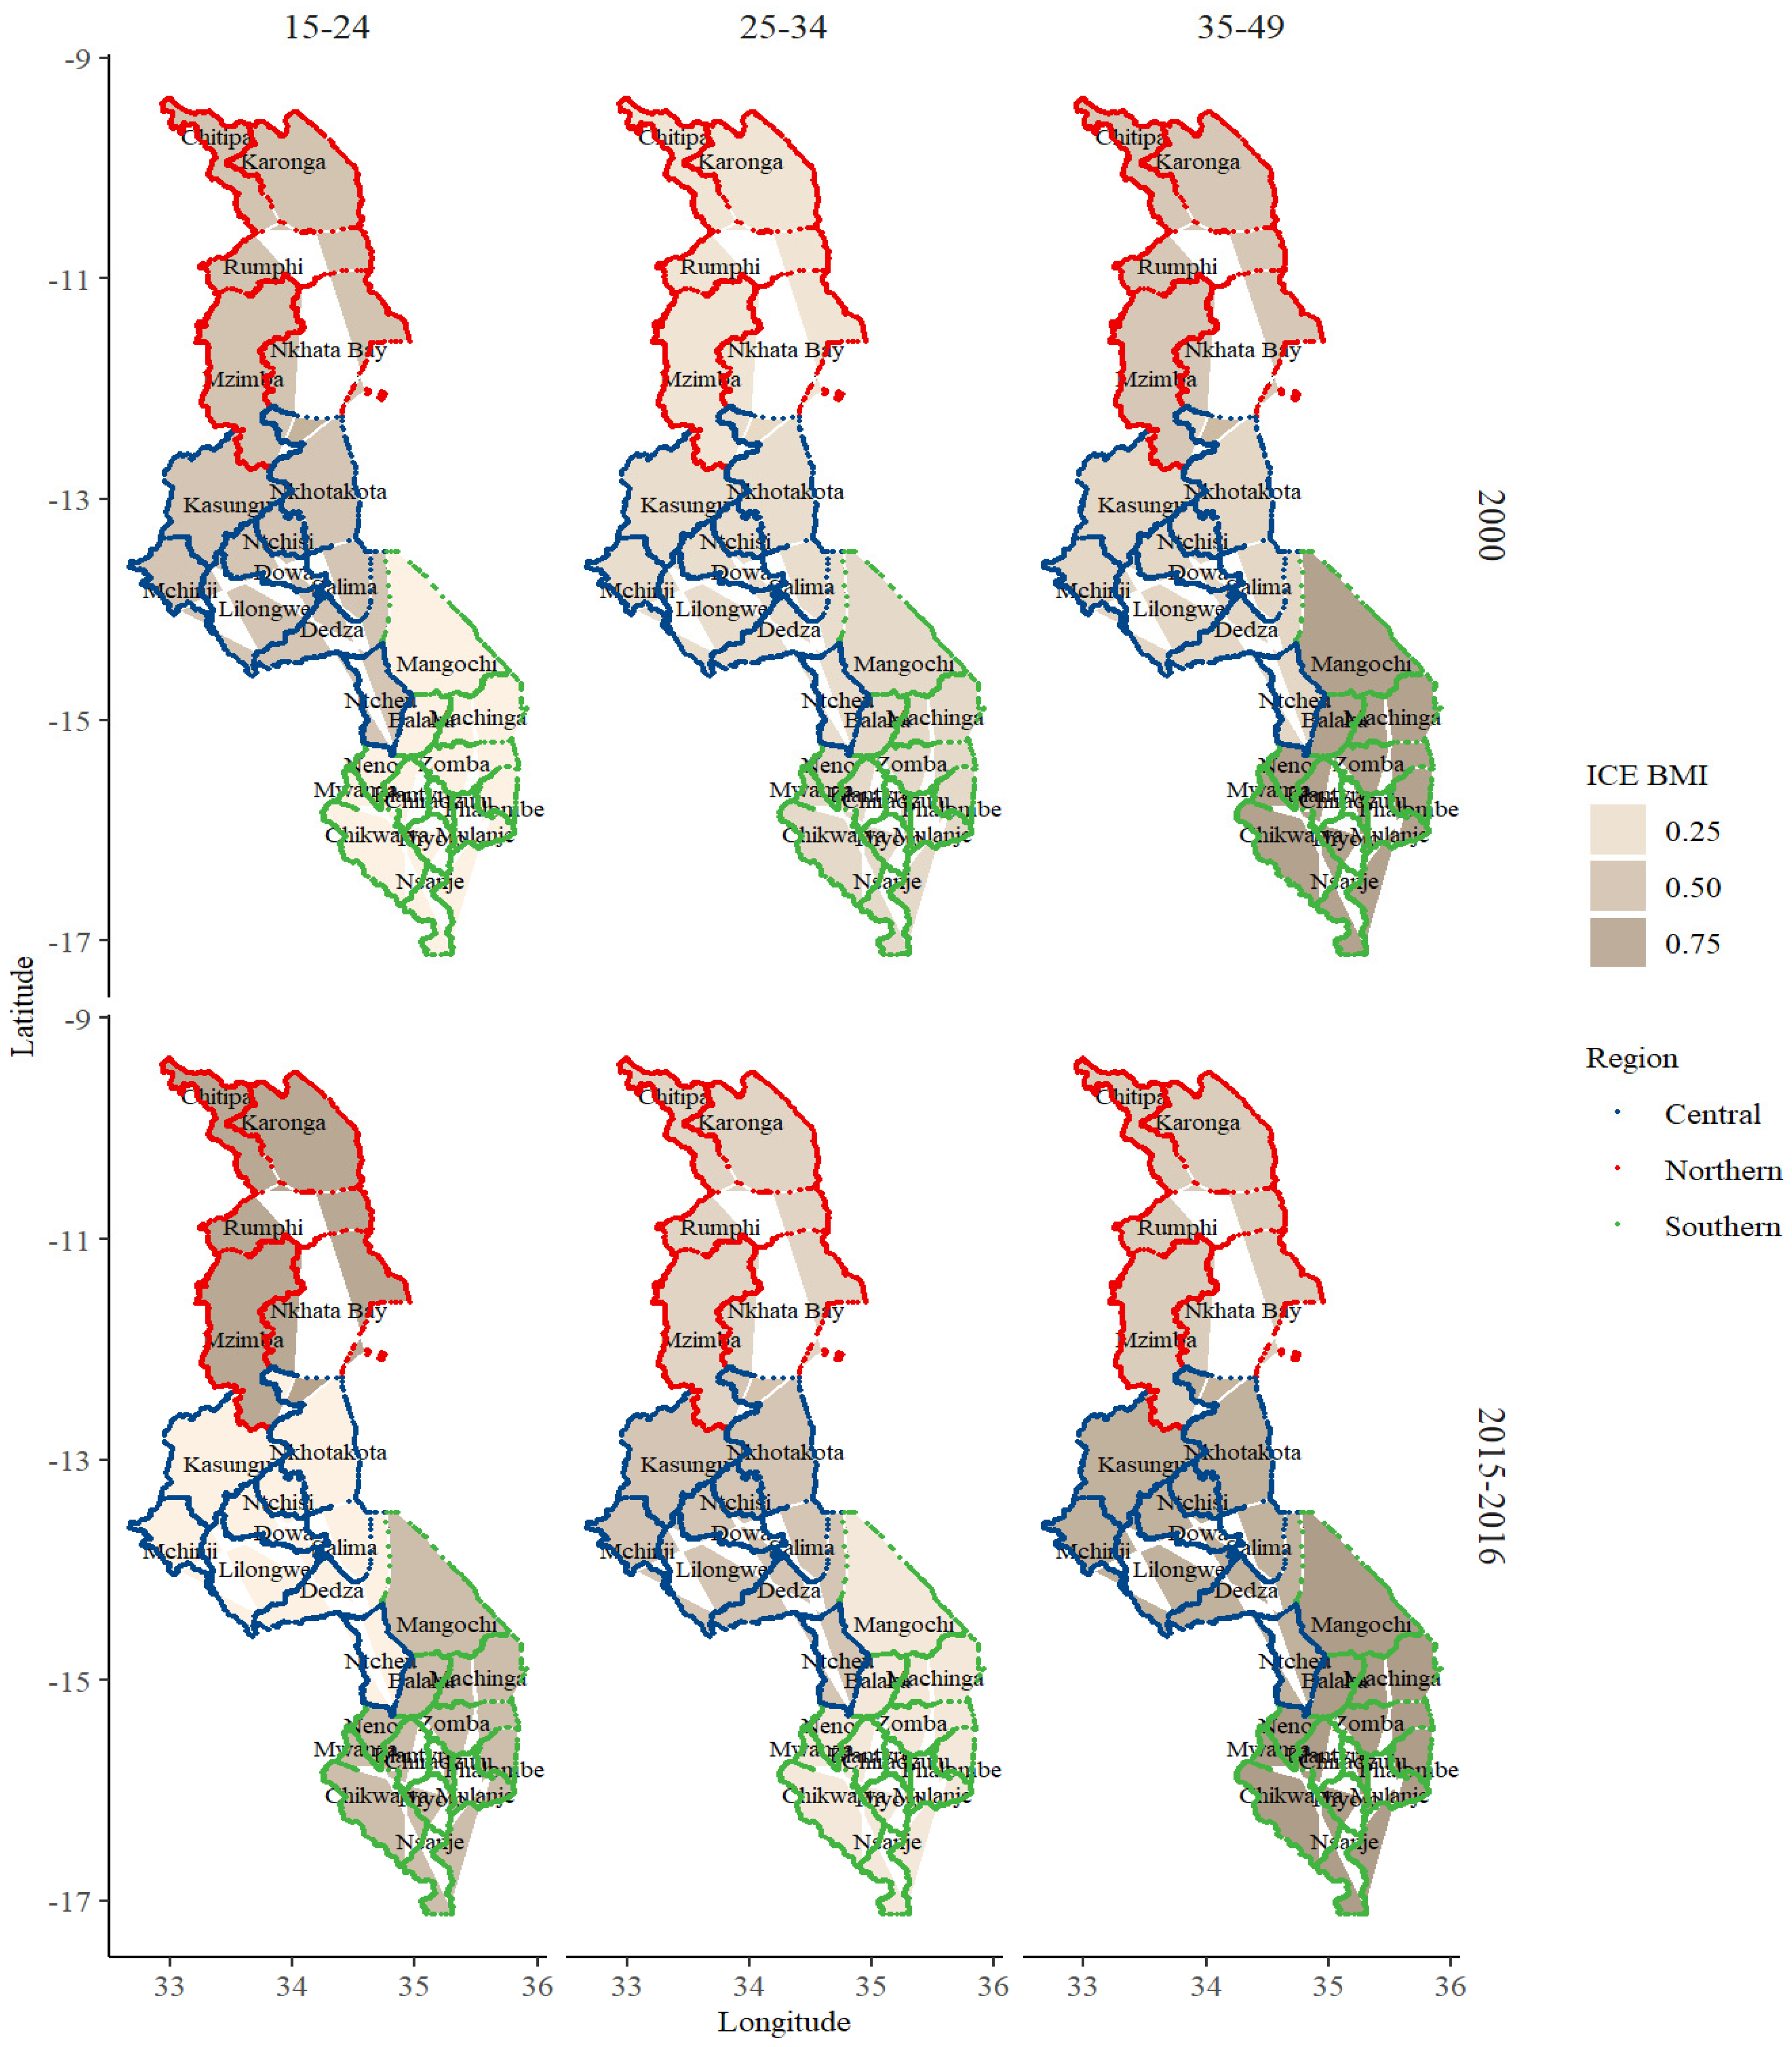
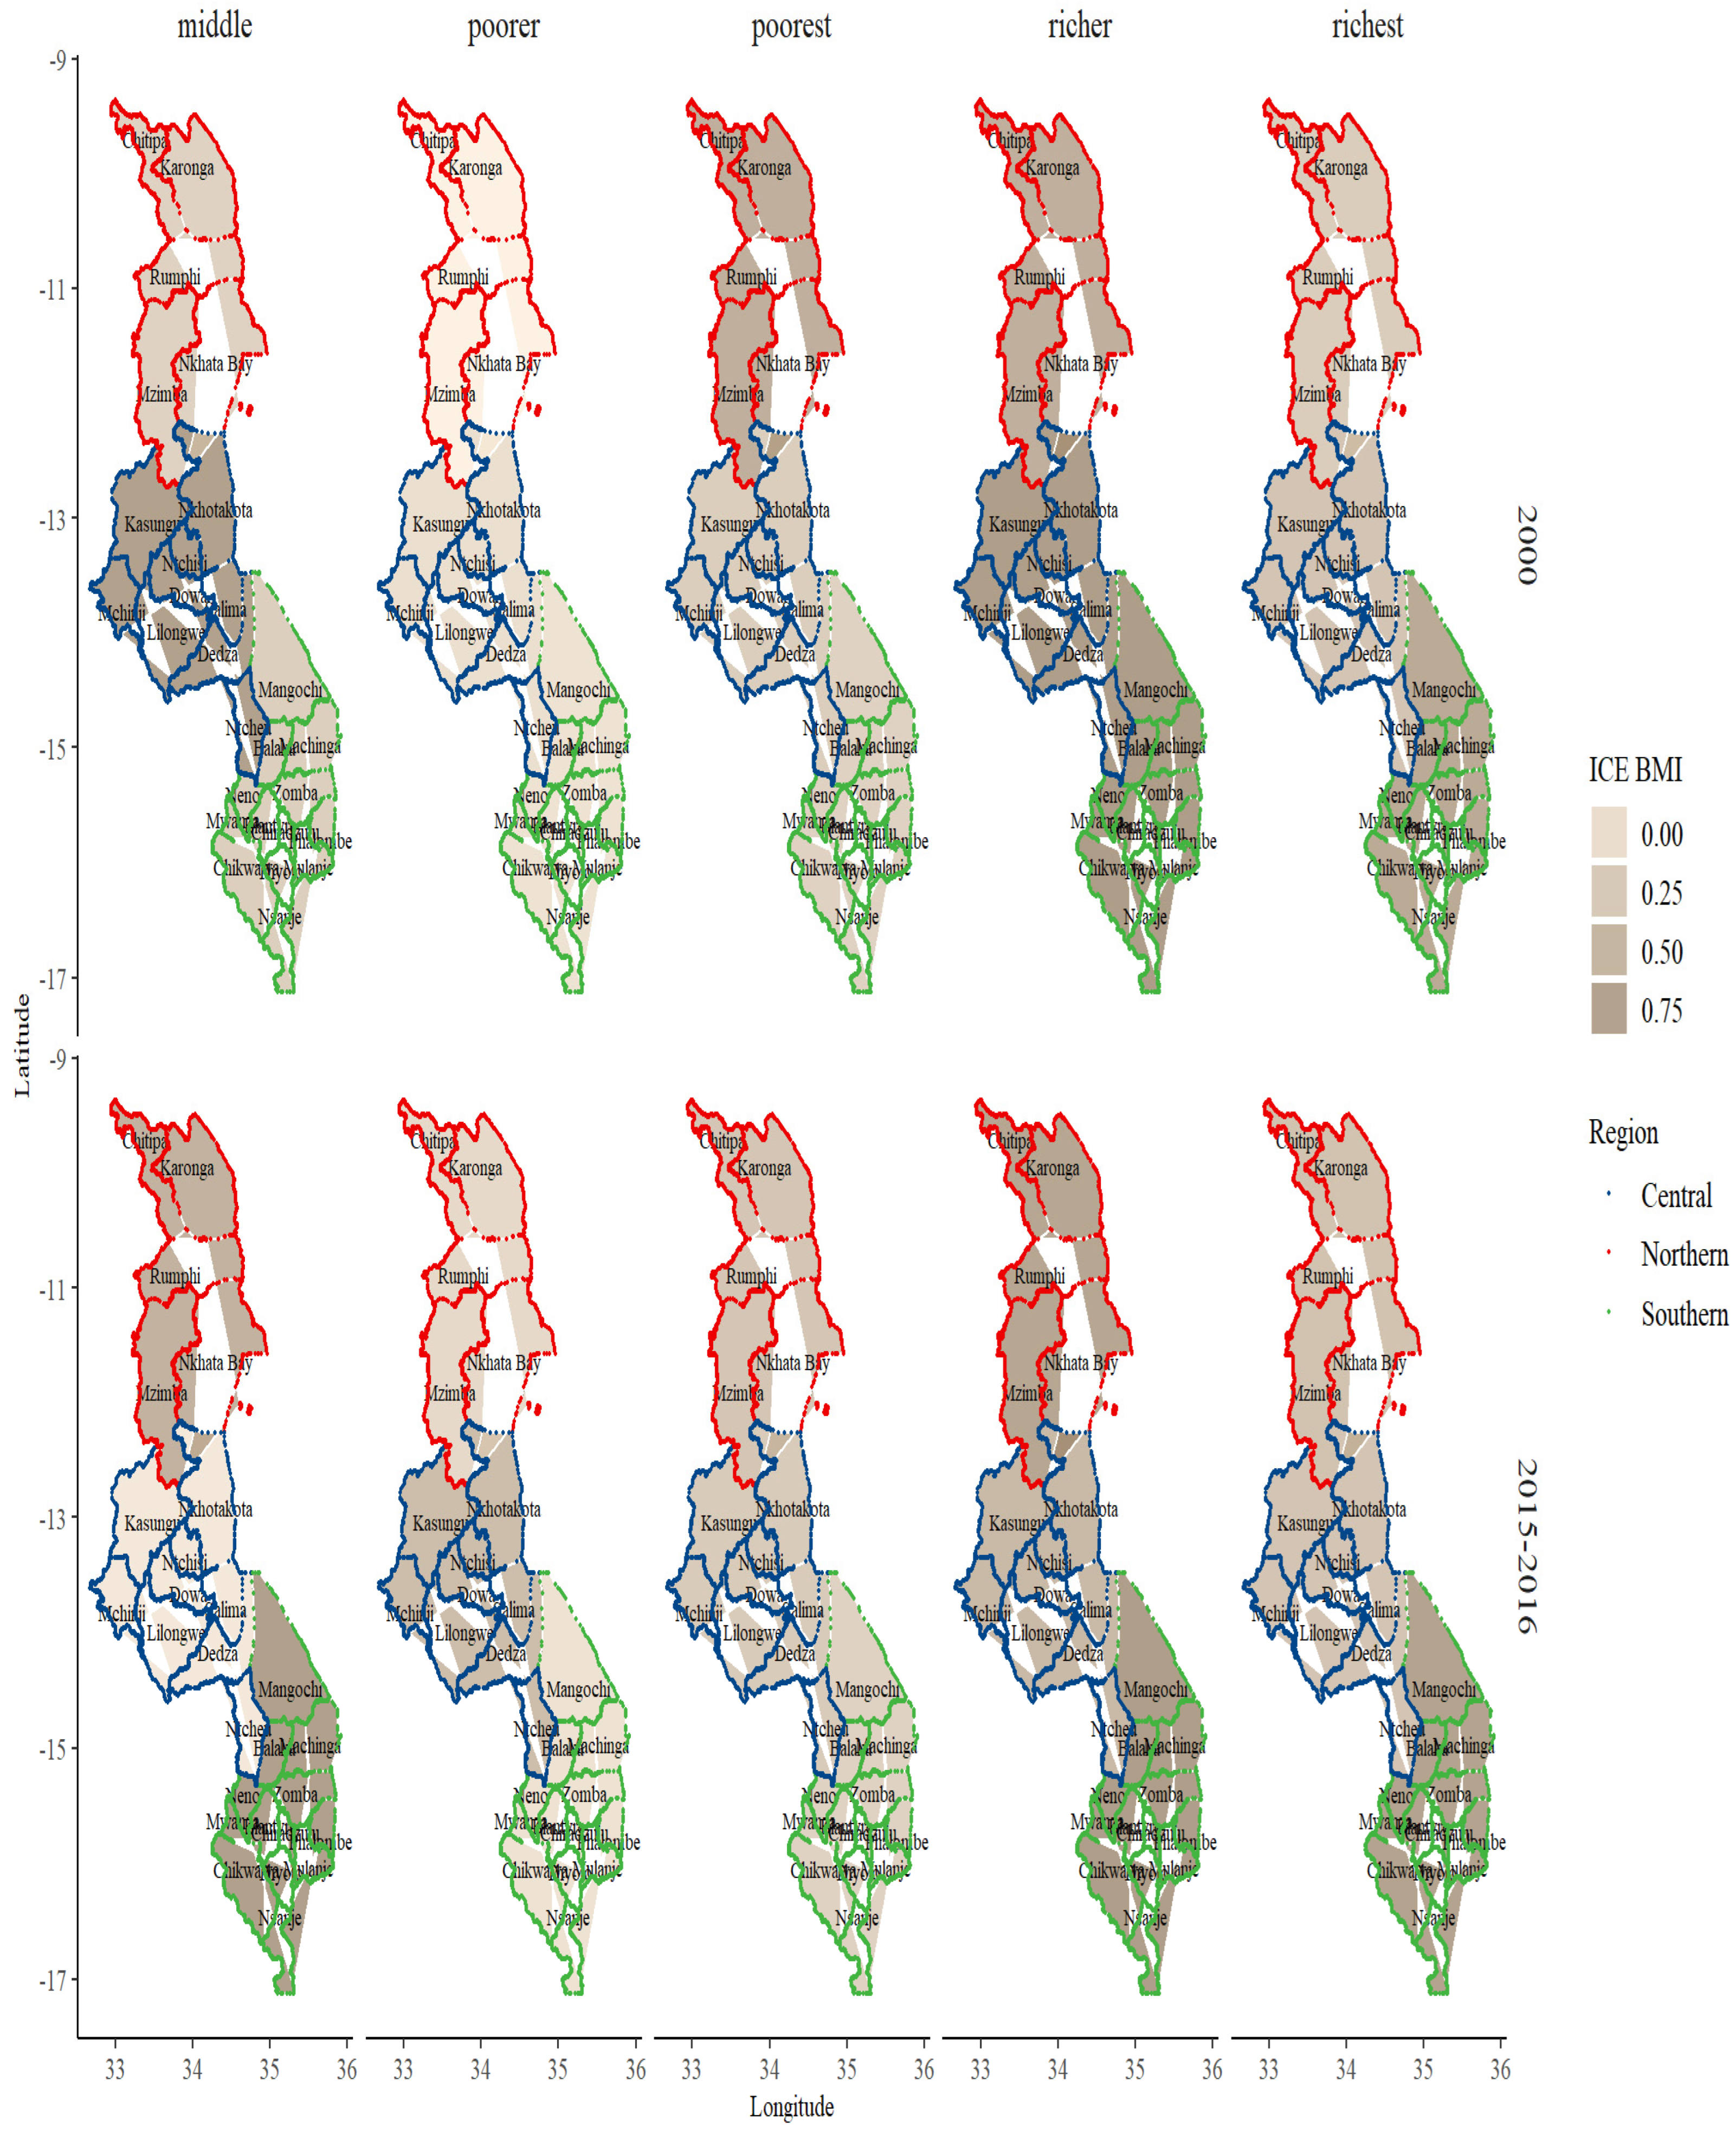
2.2. Study Area
2.3. Study Variables
2.4. Data Analyses
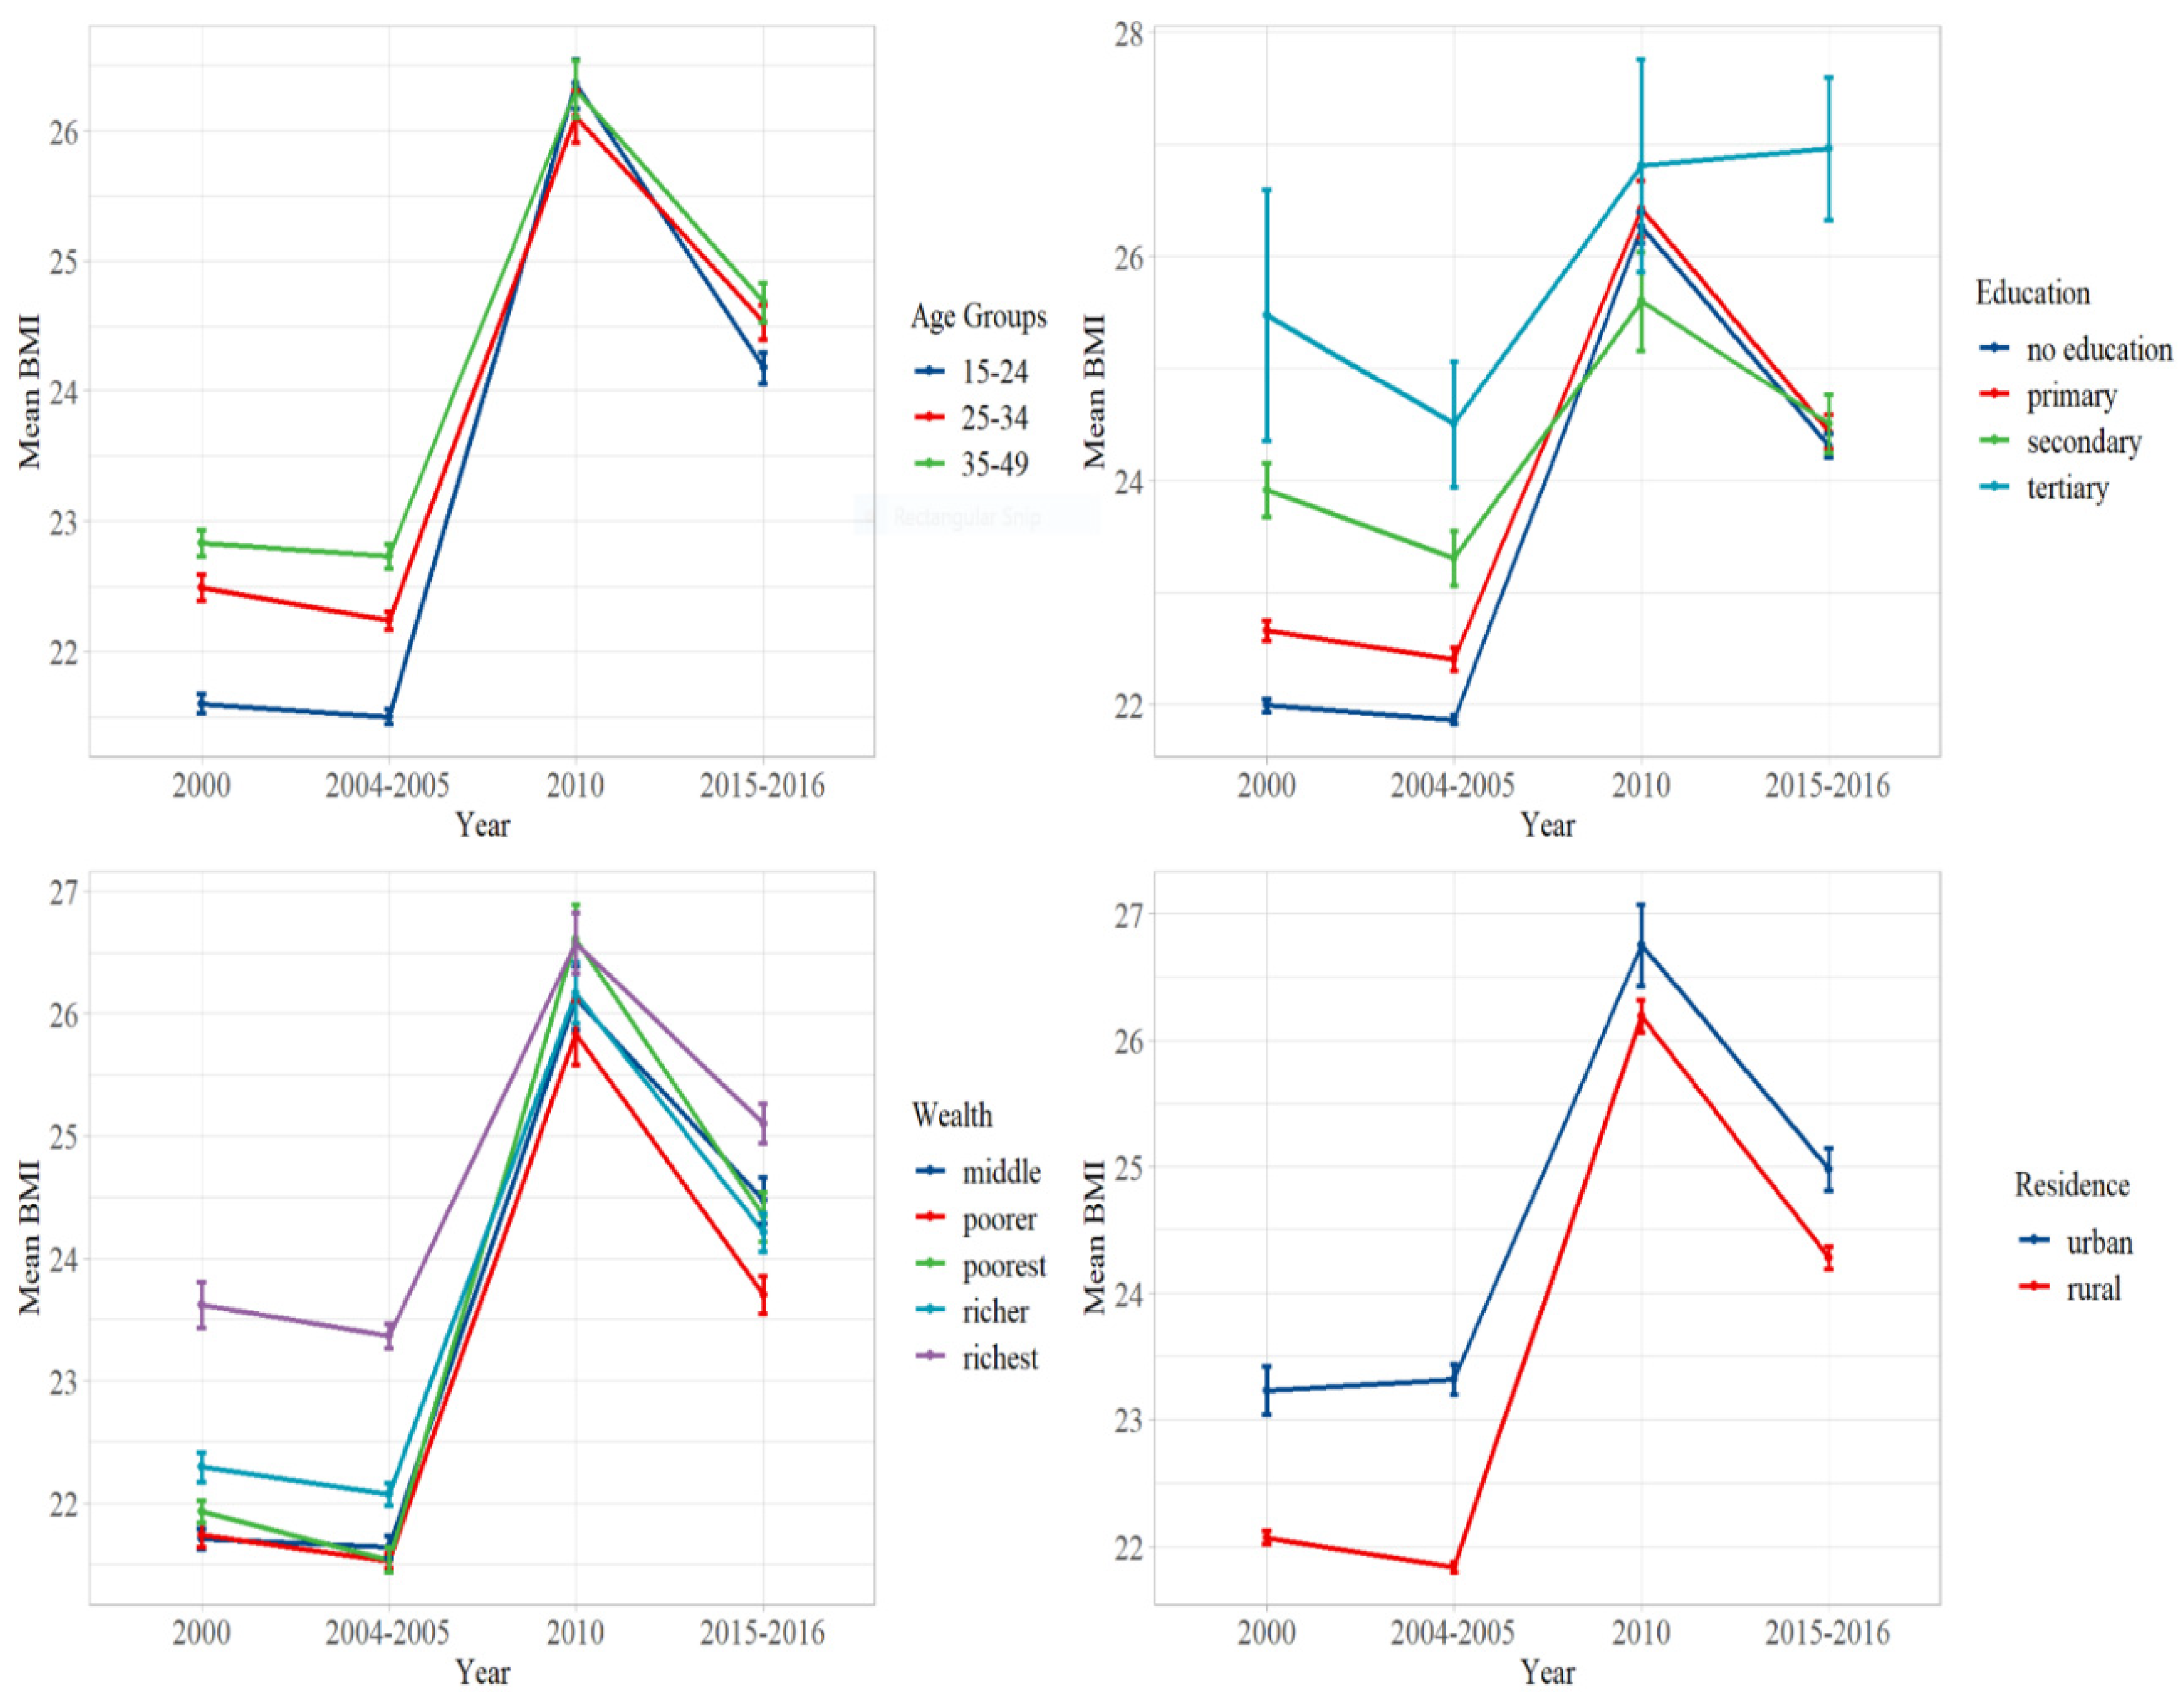
3. Results
BMI and Sociodemographic Profile Distribution
4. Discussion
4.1. Strength and Limitations
4.2. Practical Implications
5. Conclusions
Author Contributions
Funding
Institutional Review Board Statement
Informed Consent Statement
Data Availability Statement
Conflicts of Interest
Abbreviations
| BMI | Body Mass Index |
| DHS | Demographic and Health Survey |
| MDHS | Malawi Demographic and Health Survey |
| GPS | Global Positioning System |
| ICE | Index of Concentration at the Extremes |
| LMICs | Low- and Middle-Income Countries |
| PSUs | Primary Sampling Unit |
| SEAs | Standard Enumeration Areas |
| SSA | Sub-Saharan Africa |
| SDGs | Sustainable Development Goals |
| USAID | United States Agency for International Development |
| UNICEF | United Nations Children’s Fund |
| WHO | World Health Organisation |
References
- WHO. Fact Sheets—Malnutrition. Available online: https://www.who.int/news-room/fact-sheets/detail/malnutrition (accessed on 5 May 2022).
- Mařincová, L.; Šafaříková, S.; Cahlíková, R. Analysis of main risk factors contributing to obesity in the region of East Africa: Meta-analysis. Afr. Health Sci. 2020, 20, 248–256. [Google Scholar] [CrossRef] [PubMed]
- Soares, A.L.G.; Banda, L.; Amberbir, A.; Jaffar, S.; Musicha, C.; Price, A.J.; Crampin, A.C.; Nyirenda, M.J.; Lawlor, D.A. A comparison of the associations between adiposity and lipids in Malawi and the United Kingdom. BMC Med. 2020, 18, 181. [Google Scholar] [CrossRef] [PubMed]
- Neupane, S.; KC, P.; Doku, D.T. Overweight and obesity among women: Analysis of demographic and health survey data from 32 Sub-Saharan African Countries. BMC Public Health 2016, 16, 30. [Google Scholar] [CrossRef] [PubMed] [Green Version]
- Bongaarts, J. Trends in fertility and fertility preferences in sub-Saharan Africa: The roles of education and family planning programs. Genus 2020, 76, 32. [Google Scholar] [CrossRef]
- Brooks, R.; Maklakov, A. Sex Differences in Obesity Associated with Total Fertility Rate. PLoS ONE 2010, 5, e10587. [Google Scholar] [CrossRef] [Green Version]
- Caldwell, J.C. Toward A Restatement of Demographic Transition Theory. Popul. Dev. Rev. 1976, 2, 321–366. [Google Scholar] [CrossRef] [Green Version]
- Defo, B.K. Demographic, epidemiological, and health transitions: Are they relevant to population health patterns in Africa? Glob. Health Action 2014, 7, 22443. [Google Scholar] [CrossRef] [Green Version]
- Palamuleni, M. Fertility decline in Malawi: An analysis of the proximate determinants. J. Soc. Dev. Afr. 2010, 25, 9–38. [Google Scholar] [CrossRef]
- Iversen, D.S.; Kesmodel, U.S.; Ovesen, P.G. Associations between parity and maternal BMI in a population-based cohort study. Acta Obstet. Gynecol. Scand. 2018, 97, 694–700. [Google Scholar] [CrossRef] [Green Version]
- Onubi, O.J.; Marais, D.; Aucott, L.; Okonofua, F.; Poobalan, A.S. Maternal obesity in Africa: A systematic review and meta-analysis. J. Public Health Oxf. Engl. 2016, 38, e218–e231. [Google Scholar] [CrossRef] [Green Version]
- Kanyuka, M.; Ndawala, J.; Mleme, T.; Chisesa, L.; Makwemba, M.; Amouzou, A.; Borghi, J.; Daire, J.; Ferrabee, R.; Hazel, E.; et al. Malawi and Millennium Development Goal 4: A Countdown to 2015 country case study. Lancet Glob. Health 2016, 4, e201–e214. [Google Scholar] [CrossRef] [Green Version]
- Memiah, P.; Bond, T.; Opanga, Y.; Kingori, C.; Cook, C.; Mwangi, M.; Gitahi-Kamau, N.; Mubangizi, D.; Owuor, K. Neonatal, infant, and child mortality among women exposed to intimate partner violence in East Africa: A multi-country analysis. BMC Womens Health 2020, 20, 10. [Google Scholar] [CrossRef] [PubMed]
- National Research Council (US) Committee on Population; Montgomery, M.R.; Cohen, B. The Relationship Between Infant and Child Mortality and Subsequent Fertility in Indonesia: 1971–1991; National Academies Press: Washington, DC, USA, 1998. [Google Scholar]
- Ntenda, P.A.M.; Kazambwe, J.F. A multilevel analysis of overweight and obesity among non-pregnant women of reproductive age in Malawi: Evidence from the 2015–16 Malawi Demographic and Health Survey. Int. Health 2019, 11, 496–506. [Google Scholar] [CrossRef] [PubMed]
- Nkoka, O.; Ntenda, P.A.M.; Senghore, T.; Bass, P. Maternal overweight and obesity and the risk of caesarean birth in Malawi. Reprod. Health 2019, 16, 40. [Google Scholar] [CrossRef] [PubMed] [Green Version]
- World Bank. Mortality Rate, under-5 (per 1000 Live Births)—Malawi|Data. Available online: https://data.worldbank.org/indicator/SH.DYN.MORT?locations=MW (accessed on 23 December 2021).
- Doctor, H.V. Layers of Socioeconomic Vulnerability in Malawi in the Context of the Millennium Development Goals. ISRN Econ. 2013, 2013, e346750. [Google Scholar] [CrossRef]
- Price, A.J.; Crampin, A.C.; Amberbir, A.; Kayuni-Chihana, N.; Musicha, C.; Tafatatha, T.; Branson, K.; Lawlor, D.A.; Mwaiyeghele, E.; Nkhwazi, L.; et al. Prevalence of obesity, hypertension, and diabetes, and cascade of care in sub-Saharan Africa: A cross-sectional, population-based study in rural and urban Malawi. Lancet Diabetes Endocrinol. 2018, 6, 208–222. [Google Scholar] [CrossRef] [Green Version]
- Afolabi, R.F.; Palamuleni, M.E. Multilevel analysis of unhealthy bodyweight among women in Malawi: Does urbanisation matter? PLoS ONE 2021, 16, e0249289. [Google Scholar] [CrossRef]
- Neal, S.; Channon, A.A.; Chintsanya, J. The impact of young maternal age at birth on neonatal mortality: Evidence from 45 low and middle income countries. PLoS ONE 2018, 13, e0195731. [Google Scholar] [CrossRef]
- Makoka, D. Towards an understanding of regional disparities in social inequities in maternal health in Malawi. Afr. Health Sci. 2009, 9, 234–241. [Google Scholar]
- Mndala, L.; Kudale, A. Distribution and social determinants of overweight and obesity: A cross-sectional study of non-pregnant adult women from the Malawi Demographic and Health Survey (2015–2016). Epidemiol. Health 2019, 41, e2019039. [Google Scholar] [CrossRef] [Green Version]
- Nutor, J.J.; Duah, H.O.; Agbadi, P.; Duodu, P.A.; Gondwe, K.W. Spatial analysis of factors associated with HIV infection in Malawi: Indicators for effective prevention. BMC Public Health 2020, 20, 1167. [Google Scholar] [CrossRef] [PubMed]
- Lacroix, P.; Houehanou, C.; Preux, P.M.; Houinato, D. NCD risk factors in Malawi: Population characteristics matter. Lancet Diabetes Endocrinol. 2018, 6, 163–164. [Google Scholar] [CrossRef] [Green Version]
- Msyamboza, K.P.; Kathyola, D.; Dzowela, T. Anthropometric measurements and prevalence of underweight, overweight and obesity in adult Malawians: Nationwide population based NCD STEPS survey. Pan Afr. Med. J. 2013, 15, 108. [Google Scholar] [CrossRef] [PubMed]
- Ng, M.; Fleming, T.; Robinson, M.; Thomson, B.; Graetz, N.; Margono, C.; Mullany, E.C.; Biryukov, S.; Abbafati, C.; Abera, S.F.; et al. Global, regional and national prevalence of overweight and obesity in children and adults 1980–2013: A systematic analysis. Lancet Lond. Engl. 2014, 384, 766–781. [Google Scholar] [CrossRef] [Green Version]
- Corsi, D.J.; Neuman, M.; Finlay, J.E.; Subramanian, S. Demographic and health surveys: A profile. Int. J. Epidemiol. 2012, 41, 1602–1613. [Google Scholar] [CrossRef]
- Kanyangarara, M.; Munos, M.K.; Walker, N. Quality of antenatal care service provision in health facilities across sub–Saharan Africa: Evidence from nationally representative health facility assessments. J. Glob. Health 2017, 7, 021101. [Google Scholar] [CrossRef]
- Moore, S.; Croft, T. Status Report on DHS Publications and Datasets. Popul. Index 1990, 56, 216–227. [Google Scholar] [CrossRef]
- Aheto, J.M.K.; Dagne, G.A. Geostatistical analysis, web-based mapping, and environmental determinants of under-5 stunting: Evidence from the 2014 Ghana Demographic and Health Survey. Lancet Planet. Health 2021, 5, e347–e355. [Google Scholar] [CrossRef]
- Boerma, J.T.; Sommerfelt, A.E. Demographic and health surveys (DHS): Contributions and limitations. World Health Stat. Q. Rapp. Trimest. Stat. Sanit. Mond. 1993, 46, 222–226. [Google Scholar]
- Gillespie, S.; Menon, P.; Heidkamp, R.; Piwoz, E.; Rawat, R.; Munos, M.; Black, R.; Hayashi, C.; Saha, K.K.; Requejo, J. Measuring the coverage of nutrition interventions along the continuum of care: Time to act at scale. BMJ Glob. Health 2019, 4, e001290. [Google Scholar] [CrossRef] [Green Version]
- Johnson, K.; Abderrahim, N.; Rutstein, S.O. Changes in the Direct and Indirect Determinants of Fertility in Sub-Saharan Africa; ICF Macro: Calverton, MD, USA, 2011. [Google Scholar]
- Rafalimanana, H.; Westoff, C.F. Gap between Preferred and Actual Birth Intervals in Sub-Saharan Africa: Implications for Fertility and Child Health; ORC Macro: Calverton, MD, USA, 2001. [Google Scholar]
- National Statistics Office of Malawi (NSO). Ministry of Health Malawi Demographic and Health Survey 2015–16; ICF International: Rockville, MD, USA, 2017. [Google Scholar]
- National Statistics Office of Malawi (NSO). Malawi Demographic and Health Survey 2004; ORC Macro: Calverton, MD, USA, 2005. [Google Scholar]
- National Statistics Office of Malawi (NSO). Malawi Demographic and Health Survey 2010; ICF Macro: Calverton, MD, USA, 2011. [Google Scholar]
- National Statistics Office of Malawi (NSO). Malawi Demographic and Health Survey 2000; ORC Macro: Calverton, MD, USA, 2001. [Google Scholar]
- United Nations. UNdata|Country Profile|Malawi. Available online: https://data.un.org/CountryProfile.aspx/_Images/CountryProfile.aspx?crName=Malawi (accessed on 13 December 2021).
- Chowdhury, M.Z.I.; Turin, T.C. Variable selection strategies and its importance in clinical prediction modelling. Fam. Med. Community Health 2020, 8, e000262. [Google Scholar] [CrossRef] [Green Version]
- Makwero, M.; Mollentze, W.; Joubert, G.; Steinberg, W. Anthropometric profile and complications in patients with diabetes mellitus seen at Maluti Adventist Hospital, Lesotho. S. Afr. Fam. Pract. 2018, 60, 97–102. [Google Scholar] [CrossRef]
- Preston, S.; Heuveline, P.; Guillot, M. Demography: Measuring and Modeling Population Processes; Wiley: Hoboken, NJ, USA, 2000; ISBN 978-1-55786-451-2. [Google Scholar]
- Siegel, K.R.; Patel, S.A.; Ali, M.K. Non-communicable diseases in South Asia: Contemporary perspectives. Br. Med. Bull. 2014, 111, 31–44. [Google Scholar] [CrossRef] [PubMed]
- NCD Risk Factor Collaboration (NCD-RisC) Trends in adult body-mass index in 200 countries from 1975 to 2014: A pooled analysis of 1698 population-based measurement studies with 19·2 million participants. Lancet 2016, 387, 1377–1396. [CrossRef] [Green Version]
- Caleyachetty, R.; Barber, T.M.; Mohammed, N.I.; Cappuccio, F.P.; Hardy, R.; Mathur, R.; Banerjee, A.; Gill, P. Ethnicity-specific BMI cutoffs for obesity based on type 2 diabetes risk in England: A population-based cohort study. Lancet Diabetes Endocrinol. 2021, 9, 419–426. [Google Scholar] [CrossRef]
- Wise, J. Diabetes: BMI cut-offs designed to trigger action are too high for some ethnic populations, say researchers. BMJ 2021, 373, n1217. [Google Scholar] [CrossRef] [PubMed]
- Burgette, L.F.; Reiter, J.P. Multiple imputation for missing data via sequential regression trees. Am. J. Epidemiol. 2010, 172, 1070–1076. [Google Scholar] [CrossRef]
- Loh, W.-Y.; Eltinge, J.; Cho, M.; Li, Y. Classification and regression tree methods for incomplete data from sample surveys. arXiv 2016, arXiv:1603.01631. [Google Scholar]
- Soetens, L.; Hahné, S.; Wallinga, J. Dot map cartograms for detection of infectious disease outbreaks: An application to Q fever, the Netherlands and pertussis, Germany. Eurosurveillance 2017, 22, 30562. [Google Scholar] [CrossRef] [Green Version]
- Chambers, B.D.; Baer, R.J.; McLemore, M.R.; Jelliffe-Pawlowski, L.L. Using Index of Concentration at the Extremes as Indicators of Structural Racism to Evaluate the Association with Preterm Birth and Infant Mortality—California, 2011–2012. J. Urban Health Bull. N. Y. Acad. Med. 2019, 96, 159–170. [Google Scholar] [CrossRef] [Green Version]
- Feldman, J.M.; Waterman, P.D.; Coull, B.A.; Krieger, N. Spatial social polarisation: Using the Index of Concentration at the Extremes jointly for income and race/ethnicity to analyse risk of hypertension. J. Epidemiol. Community Health 2015, 69, 1199–1207. [Google Scholar] [CrossRef] [PubMed] [Green Version]
- United Nations. Manual X: Indirect Estimation Techniques for Demographic Estimation; United Nations Publisher: New York, NY, USA, 1983; Volume 81. [Google Scholar]
- Van Buuren, S.; Groothuis-Oudshoorn, K.; Vink, G.; Schouten, R.; Robitzsch, A.; Rockenschaub, P.; Doove, L.; Jolani, S.; Moreno-Betancur, M.; White, I.; et al. Mice: Multivariate Imputation by Chained Equations. J. Stat. Softw. 2011, 45, 1–67. [Google Scholar] [CrossRef] [Green Version]
- Lumley, T. Survey: Analysis of Complex Survey Samples. R Package Version. 2021. Available online: https://cran.r-project.org/web/packages/survey/index.html (accessed on 26 May 2021).
- Myo Minn, O. u5mr: Under-Five Child Mortality Estimation. 2021. Available online: https://cran.r-project.org/web/packages/u5mr/u5mr.pdf (accessed on 26 May 2021).
- Pebesma, E.; Bivand, R.; Rowlingson, B.; Gomez-Rubio, V.; Hijmans, R.; Sumner, M.; MacQueen, D.; Lemon, J.; Lindgren, F.; O’Brien, J.; et al. Sp: Classes and Methods for Spatial Data. 2021. Available online: https://cran.r-project.org/web/packages/sp/sp.pdf (accessed on 26 May 2021).
- Pebesma, E.; Bivand, R.; Racine, E.; Sumner, M.; Cook, I.; Keitt, T.; Lovelace, R.; Wickham, H.; Ooms, J.; Müller, K.; et al. sf: Simple Features for R. 2022. Available online: https://cran.r-project.org/web/packages/sf/sf.pdf (accessed on 26 May 2021).
- Wickham, H.; Chang, W.; Henry, L.; Pedersen, T.L.; Takahashi, K.; Wilke, C.; Woo, K.; Yutani, H.; Dunnington, D. RStudio ggplot2: Create Elegant Data Visualisations Using the Grammar of Graphics. 2021. Available online: https://cran.r-project.org/web/packages/ggplot2/index.html (accessed on 26 May 2021).
- Wickham, H.; François, R.; Henry, L.; Müller, K. dplyr: A Grammar of Data Manipulation. 2022. Available online: https://github.com/tidyverse/dplyr (accessed on 26 May 2021).
- Oluyombo, R.; Banjo Oguntade, H.; Soje, M.; Obajolowo, O.; Karim, M. Obesity and CKD in Sub-Saharan Africa: A Narrative Review. Kidney Med. 2022, 4, 100403. [Google Scholar] [CrossRef] [PubMed]
- McCarthy, N.; Kilic, T.; Brubaker, J.; Murray, S.; Fuente, A. de la Droughts and floods in Malawi: Impacts on crop production and the performance of sustainable land management practices under weather extremes. Environ. Dev. Econ. 2021, 26, 432–449. [Google Scholar] [CrossRef]
- Mungai, L.; Messina, J.; Snapp, S. Spatial Pattern of Agricultural Productivity Trends in Malawi. Sustainability 2020, 12, 1313. [Google Scholar] [CrossRef] [Green Version]
- Garcia, M.H.; Fares, J. Youth in Africa’s Labor Market; World Bank Publications: Washington, DC, USA, 2008; ISBN 978-0-8213-6885-5. [Google Scholar]
- Kazembe, L.; Clarke, A.; Kandala, N.-B. Childhood mortality in sub-Saharan Africa: Cross-sectional insight into small-scale geographical inequalities from Census data. BMJ Open 2012, 2, e001421. [Google Scholar] [CrossRef] [PubMed] [Green Version]
- Kabiru, C.W.; Izugbara, C.O.; Beguy, D. The health and wellbeing of young people in sub-Saharan Africa: An under-researched area? BMC Int. Health Hum. Rights 2013, 13, 11. [Google Scholar] [CrossRef] [Green Version]
- Williams, J.R.; Manfredi, P.; Melegaro, A. The potential impact of the demographic transition in the Senegal-Gambia region of sub-Saharan Africa on the burden of infectious disease and its potential synergies with control programmes: The case of hepatitis B. BMC Med. 2018, 16, 118. [Google Scholar] [CrossRef] [Green Version]
- Strong, K.L.; Pedersen, J.; Johansson, E.W.; Cao, B.; Diaz, T.; Guthold, R.; You, D.; Requejo, J.; Liu, L. Patterns and trends in causes of child and adolescent mortality 2000–2016: Setting the scene for child health redesign. BMJ Glob. Health 2021, 6, e004760. [Google Scholar] [CrossRef]
- Ward, J.L.; Azzopardi, P.S.; Francis, K.L.; Santelli, J.S.; Skirbekk, V.; Sawyer, S.M.; Kassebaum, N.J.; Mokdad, A.H.; Hay, S.I.; Abd-Allah, F.; et al. Global, regional, and national mortality among young people aged 10–24 years, 1950–2019: A systematic analysis for the Global Burden of Disease Study 2019. Lancet 2021, 398, 1593–1618. [Google Scholar] [CrossRef]
- De Wet, N.; Odimegwu, C. Contextual determinants of adolescent mortality in South Africa. Afr. Health Sci. 2017, 17, 62–69. [Google Scholar] [CrossRef] [PubMed] [Green Version]
- Masquelier, B.; Hug, L.; Sharrow, D.; You, D.; Mathers, C.; Gerland, P.; Alkema, L. Global, regional, and national mortality trends in youth aged 15–24 years between 1990 and 2019: A systematic analysis. Lancet Glob. Health 2021, 9, e409–e417. [Google Scholar] [CrossRef]
- Kim, S.W.; Haghparast-Bidgoli, H.; Skordis-Worrall, J.; Batura, N.; Petrou, S. A method for measuring spatial effects on socioeconomic inequalities using the concentration index. Int. J. Equity Health 2020, 19, 9. [Google Scholar] [CrossRef] [PubMed]
- Ford, N.D.; Patel, S.A.; Narayan, K.M.V. Obesity in Low- and Middle-Income Countries: Burden, Drivers, and Emerging Challenges. Annu. Rev. Public Health 2017, 38, 145–164. [Google Scholar] [CrossRef] [Green Version]
- Templin, T.; Hashiguchi, T.C.O.; Thomson, B.; Dieleman, J.; Bendavid, E. The overweight and obesity transition from the wealthy to the poor in low- and middle-income countries: A survey of household data from 103 countries. PLOS Med. 2019, 16, e1002968. [Google Scholar] [CrossRef] [Green Version]
- Chikhungu, L.C.; Madise, N.J. Seasonal variation of child under nutrition in Malawi: Is seasonal food availability an important factor? Findings from a national level cross-sectional study. BMC Public Health 2014, 14, 1146. [Google Scholar] [CrossRef] [Green Version]
- Global Hunger Index. A Closer Look at Hunger and Undernutrition in Malawi. Available online: https://www.globalhungerindex.org/case-studies/2018-malawi.html (accessed on 30 March 2022).
- Chowdhury, R.; Taneja, S.; Mazumder, S.; Bhandari, N.; Strand, T.A. Gender differences in infant survival: A secondary data analysis in rural North India. BMJ Open 2017, 7, e014179. [Google Scholar] [CrossRef] [Green Version]
- Felisbino-Mendes, M.S.; Matozinhos, F.P.; Miranda, J.J.; Villamor, E.; Velasquez-Melendez, G. Maternal obesity and fetal deaths: Results from the Brazilian cross-sectional demographic health survey, 2006. BMC Pregnancy Childbirth 2014, 14, 5. [Google Scholar] [CrossRef] [Green Version]
- Bean, L.L.; Mineau, G.P.; Anderton, D.L. High-Risk Childbearing: Fertility and Infant Mortality on the American Frontier. Soc. Sci. Hist. 1992, 16, 337–363. [Google Scholar] [CrossRef]
- Brosens, I.; Muter, J.; Gargett, C.E.; Puttemans, P.; Benagiano, G.; Brosens, J.J. The impact of uterine immaturity on obstetrical syndromes during adolescence. Am. J. Obstet. Gynecol. 2017, 217, 546–555. [Google Scholar] [CrossRef] [Green Version]
- Abu-Ouf, N.M.; Jan, M.M. The impact of maternal iron deficiency and iron deficiency anemia on child’s health. Saudi Med. J. 2015, 36, 146–149. [Google Scholar] [CrossRef] [PubMed]
- Mocking, M.; Savitri, A.I.; Uiterwaal, C.S.P.M.; Amelia, D.; Antwi, E.; Baharuddin, M.; Grobbee, D.E.; Klipstein-Grobusch, K.; Browne, J.L. Does body mass index early in pregnancy influence the risk of maternal anaemia? An observational study in Indonesian and Ghanaian women. BMC Public Health 2018, 18, 873. [Google Scholar] [CrossRef] [PubMed] [Green Version]
- Maze, M.J.; Bassat, Q.; Feasey, N.A.; Mandomando, I.; Musicha, P.; Crump, J.A. The epidemiology of febrile illness in sub-Saharan Africa: Implications for diagnosis and management. Clin. Microbiol. Infect. 2018, 24, 808–814. [Google Scholar] [CrossRef] [PubMed] [Green Version]
- Cohen, T.R.; Koski, K.G. Limiting excess weight gain in healthy pregnant women: Importance of energy intakes, physical activity, and adherence to gestational weight gain guidelines. J. Pregnancy 2013, 2013, 787032. [Google Scholar] [CrossRef] [PubMed]
- Gondwe, A.; Ashorn, P.; Ashorn, U.; Dewey, K.G.; Maleta, K.; Nkhoma, M.; Mbotwa, J.; Jorgensen, J.M. Pre-pregnancy body mass index (BMI) and maternal gestational weight gain are positively associated with birth outcomes in rural Malawi. PLoS ONE 2018, 13, e0206035. [Google Scholar] [CrossRef] [Green Version]
- Hobcraft, J.; McDonald, J.W.; Rutstein, S. Child-Spacing Effects on Infant and Early Child Mortality. Popul. Index 1983, 49, 585–618. [Google Scholar] [CrossRef]
- Bongaarts, J.; Casterline, J. Fertility Transition: Is sub-Saharan Africa Different? Popul. Dev. Rev. 2013, 38, 153–168. [Google Scholar] [CrossRef] [Green Version]
- Chaabane, S.; Chaabna, K.; Abraham, A.; Mamtani, R.; Cheema, S. Physical activity and sedentary behaviour in the Middle East and North Africa: An overview of systematic reviews and meta-analysis. Sci. Rep. 2020, 10, 9363. [Google Scholar] [CrossRef]
- Kandala, N.-B.; Stranges, S. Geographic variation of overweight and obesity among women in Nigeria: A case for nutritional transition in sub-Saharan Africa. PLoS ONE 2014, 9, e101103. [Google Scholar] [CrossRef] [Green Version]
- Kruger, H.S.; Venter, C.S.; Vorster, H.H.; Margetts, B.M. Physical inactivity is the major determinant of obesity in black women in the North West Province, South Africa: The THUSA study. Transition and Health During Urbanisation of South Africa. Nutrition 2002, 18, 422–427. [Google Scholar] [CrossRef]
- UNICEF. Childhood Diseases. Available online: https://www.unicef.org/health/childhood-diseases (accessed on 1 April 2022).
- Nyasulu, P.S.; Ngamasana, E.; Kandala, N.-B. Sources of Health Care Among Under-5 Malawian Children with Diarrhea Episodes: An Analysis of the 2017 Demographic and Health Survey. Glob. Pediatr. Health 2019, 6. [Google Scholar] [CrossRef] [PubMed] [Green Version]
- Tomiyama, A.J.; Carr, D.; Granberg, E.M.; Major, B.; Robinson, E.; Sutin, A.R.; Brewis, A. How and why weight stigma drives the obesity ‘epidemic’ and harms health. BMC Med. 2018, 16, 123. [Google Scholar] [CrossRef] [PubMed]


| Period of Study | Total | |||||
|---|---|---|---|---|---|---|
| 2000 (n = 11,663) | 2004–2005 (n = 10,249) | 2010 (n = 20,858) | 2015–2016 (n = 22,729) | (n = 65,499) | p Value | |
| Information on Categorical Indicators | ||||||
| (100%) | (100%) | (100%) | (100%) | (100%) | ||
| Age Groups | <0.001 | |||||
| 15–24 | 5109 (43.8%) | 4432 (43.2%) | 8442 (40.5%) | 9358 (41.2%) | 27,341 (41.7%) | |
| 25–34 | 3378 (29.0%) | 3132 (30.6%) | 6733 (32.3%) | 6986 (30.7%) | 20,229 (30.9%) | |
| 35–49 | 3176 (27.2%) | 2685 (26.2%) | 5683 (27.2%) | 6385 (28.1%) | 17,929 (27.4%) | |
| Residence | <0.001 | |||||
| Urban | 1103 (9.5%) | 1469 (14.3%) | 2884 (13.8%) | 4921 (21.7%) | 10,377 (15.8%) | |
| Rural | 10,560 (90.5%) | 8780 (85.7%) | 17,974 (86.2%) | 17,808 (78.3%) | 55,122 (84.2%) | |
| Education | 0.02 | |||||
| No education | 9124 (78.2%) | 7717 (75.3%) | 14,908 (71.5%) | 14,532 (63.9%) | 46,281 (70.7%) | |
| Primary | 2015 (17.3%) | 1975 (19.3%) | 4549 (21.8%) | 5964 (26.2%) | 14,503 (22.1%) | |
| Secondary | 506 (4.3%) | 493 (4.8%) | 1098 (5.3%) | 1588 (7.0%) | 3685 (5.6%) | |
| Tertiary | 18 (0.2%) | 64 (0.6%) | 303 (1.5%) | 645 (2.8%) | 1030 (1.6%) | |
| Wealth Quintile | <0.001 | |||||
| Poorest | 2413 (20.7%) | 1834 (17.9%) | 4071 (19.5%) | 3889 (17.1%) | 12,207 (18.6%) | |
| Poorer | 2350 (20.1%) | 2003 (19.5%) | 4008 (19.2%) | 4037 (17.8%) | 12,398 (18.9%) | |
| Middle | 2569 (22.0%) | 2152 (21.0%) | 4192 (20.1%) | 4170 (18.3%) | 13,083 (20.0%) | |
| Richer | 2395 (20.5%) | 2135 (20.8%) | 4317 (20.7%) | 4538 (20.0%) | 13,385 (20.4%) | |
| Richest | 1936 (16.6%) | 2125 (20.7%) | 4270 (20.5%) | 6095 (26.8%) | 14,426 (22.0%) | |
| Region | 0.01 | |||||
| North | 1925 (16.5%) | 1410 (13.8%) | 3794 (18.2%) | 4440 (19.5%) | 11,569 (17.7%) | |
| Central | 3932 (33.7%) | 3656 (35.7%) | 7117 (34.1%) | 7773 (34.2%) | 22,478 (34.3%) | |
| South | 5806 (49.8%) | 5183 (50.6%) | 9947 (47.7%) | 10,516 (46.3%) | 31,452 (48.0%) | |
| BMI Categories | <0.001 | |||||
| Underweight | 1049 (9.0%) | 948 (9.2%) | 1658 (7.9%) | 1689 (7.4%) | 5344 (8.2%) | |
| Normal | 9122 (78.2%) | 7942 (77.5%) | 14,597 (70.0%) | 15,913 (70.0%) | 47,574 (72.6%) | |
| Overweight | 1190 (10.2%) | 1097 (10.7%) | 2886 (13.8%) | 3459 (15.2%) | 8632 (13.2%) | |
| Obese | 302 (2.6%) | 262 (2.6%) | 1717 (8.2%) | 1668 (7.3%) | 3949 (6.0%) | |
| Information on Numerical Indicators | ||||||
| Number of Children Ever Born | <0.001 | |||||
| Mean (SD) | 3.13 (2.89) | 3.17 (2.77) | 3.19 (2.76) | 2.84 (2.48) | 3.06 (2.70) | |
| Range | 0.00–16.00 | 0.00–16.00 | 0.00–17.00 | 0.00–15.00 | 0.000–17.00 | |
| Number of Children Dead to a Mother/Female | <0.001 | |||||
| Mean (SD) | 0.68 (1.17) | 0.57 (1.05) | 0.50 (0.96) | 0.30 (0.73) | 0.47 (0.96) | |
| Range | 0.00–10.00 | 0.00–11.00 | 0.00–11.00 | 0.00–9.00 | 0.00–11.00 | |
| Mortality Levels | ||||||||
|---|---|---|---|---|---|---|---|---|
| Body Mass Index (BMI) Categories | ||||||||
| Indicator | Total Population | Underweight | Normal | Overweight and Obese | ||||
| Mother’s Age | 2000 | 2015–2016 | 2000 | 2015–2016 | 2000 | 2015–2016 | 2000 | 2015–2016 |
| 15–19 | 12.83 | 17.48 | 14.03 | 19.87 | 13.33 | 17.96 | 12.1 | 19.58 |
| 20–24 | 12.99 | 19.45 | 12.61 | 18.67 | 13.27 | 20.04 | 13.59 | 20.24 |
| 25–29 | 12.03 | 18.96 | 12.31 | 18.55 | 11.85 | 19.32 | 13.55 | 18.69 |
| 30–34 | 12.72 | 17.38 | 12.05 | 18.52 | 12.68 | 18.2 | 12.51 | 18.19 |
| 35–39 | 12.12 | 16.74 | 11 | 17.22 | 12.04 | 17.16 | 13.22 | 17.71 |
| 40–44 | 11.8 | 15.75 | 10.36 | 15.27 | 11.42 | 16 | 12.76 | 16.43 |
| 45–49 | 10.85 | 14.77 | 10.14 | 15.05 | 10.53 | 15.41 | 13.1 | 15.87 |
Publisher’s Note: MDPI stays neutral with regard to jurisdictional claims in published maps and institutional affiliations. |
© 2022 by the authors. Licensee MDPI, Basel, Switzerland. This article is an open access article distributed under the terms and conditions of the Creative Commons Attribution (CC BY) license (https://creativecommons.org/licenses/by/4.0/).
Share and Cite
Simmons, S.S.; Hagan, J.E., Jr.; Schack, T. Then and Now: Investigating Anthropometrics and Child Mortality among Females in Malawi. Int. J. Environ. Res. Public Health 2022, 19, 6171. https://doi.org/10.3390/ijerph19106171
Simmons SS, Hagan JE Jr., Schack T. Then and Now: Investigating Anthropometrics and Child Mortality among Females in Malawi. International Journal of Environmental Research and Public Health. 2022; 19(10):6171. https://doi.org/10.3390/ijerph19106171
Chicago/Turabian StyleSimmons, Sally Sonia, John Elvis Hagan, Jr., and Thomas Schack. 2022. "Then and Now: Investigating Anthropometrics and Child Mortality among Females in Malawi" International Journal of Environmental Research and Public Health 19, no. 10: 6171. https://doi.org/10.3390/ijerph19106171
APA StyleSimmons, S. S., Hagan, J. E., Jr., & Schack, T. (2022). Then and Now: Investigating Anthropometrics and Child Mortality among Females in Malawi. International Journal of Environmental Research and Public Health, 19(10), 6171. https://doi.org/10.3390/ijerph19106171