Article

Ambient Air Pollution and Risk of Admission Due to Asthma in the Three Largest Urban Agglomerations in Poland: A Time-Stratified, Case-Crossover Study

by
Piotr Dąbrowiecki
1,2,
Andrzej Chciałowski
1,
Agata Dąbrowiecka
3 and
Artur Badyda
2,4,*
1
Department of Allergology and Infectious Diseases, Military Institute of Medicine, 04-141 Warsaw, Poland
2
Polish Federation of Asthma Allergy and COPD Patients Associations, 01-604 Warsaw, Poland
3
Maria Skłodowska-Curie Medical School, 00-136 Warsaw, Poland
4
Faculty of Building Services, Hydro and Environmental Engineering, Warsaw University of Technology, 00-653 Warsaw, Poland
*
Author to whom correspondence should be addressed.
Int. J. Environ. Res. Public Health 2022, 19(10), 5988; https://doi.org/10.3390/ijerph19105988
Submission received: 18 March 2022 / Revised: 4 May 2022 / Accepted: 11 May 2022 / Published: 14 May 2022
(This article belongs to the Special Issue Environmental Risk Factors, Allergic Diseases and Lung Health)

Abstract

:
Ambient air pollution in urban areas may trigger asthma exacerbations. We carried out a time-series analysis of the association between the concentrations of various air pollutants and the risk of hospital admission due to asthma over 7 days from exposure. We used distributed lag nonlinear models to analyze data gathered between 2010 and 2018 in the three largest urban agglomerations in Poland. Overall, there were 31,919 asthma hospitalizations. Over 7 days since exposure, the rate ratio (95%CI) for admission per 10 µg/m3 was 1.013 (1.002–1.024) for PM10; 1.014 (1.000–1.028) for PM2.5; 1.054 (1.031–1.078) for NO2; and 1.044 for SO2 (95%CI: 0.986–1.104). For all pollutants, the risk of admission was the greatest on the day of exposure (day 0), decreased below baseline on days 1 and 2, and then increased gradually up to day 6. The proportions (95%CI) of hospitalizations attributable to air pollution were 4.52% (0.80%–8.14%) for PM10; 3.74% (0.29%–7.11%) for PM2.5; 16.4% (10.0%–21.8%) for NO2; and 2.50% (−0.75%–5.36%) for SO2. In conclusion, PM2.5, PM10, NO2, and SO2 pollution was associated with an increased risk of hospital admission due to asthma in the three largest urban agglomerations in Poland over nine years.

1. Introduction

Asthma is one of the most common chronic diseases among children and adults worldwide, with an increasing prevalence. In 2016, around 340 million people worldwide suffered from asthma, with asthma being a leading cause of disease burden (23.7 million disability-adjusted life years globally) [1,2]. Asthma is a respiratory disease caused by genetic and environmental factors that leads to airway constriction and inflammation [3]. The course of asthma is characterized by intermittent exacerbations that range from mild, self-limiting symptoms to severe dyspnoea requiring urgent medical care in a hospital [4,5]. Hospital admissions may thus be viewed as a proxy for both severe asthma exacerbations and the costs related to healthcare system utilization [6].
Ambient air pollution in urban areas is an established trigger for asthma exacerbations. Several air pollutants are found in increased concentrations in urban areas due to emissions from traffic, municipal, and household sources, and also from power generation and industry. These include the particulate matter of an aerodynamic diameter no greater than 2.5 μm or 10 μm (PM2.5, PM10), nitrogen dioxide (NO2), or sulfur dioxide (SO2), all of which can induce airway constriction and airway inflammation, the two key aspects of asthma pathogenesis [7]. A recent meta-analysis of 84 studies showed that the risk of asthma exacerbations at lags 0 or 1 day increased with increasing ambient air concentrations of PM2.5, PM10, NO2, and SO2 [8].
Air quality in Polish cities is among the worst in Europe, particularly regarding PM and polycyclic aromatic hydrocarbons; however, pollution with NO2 and ozone is increasing as well. Twenty-three of the fifty European cities with the highest ambient levels of PM2.5 are in Poland [9]. The sources of pollution include heating-related emissions from individual households during the winter months and the increasing burden of road traffic. In some cities, emissions from the industrial sector are substantial [10]. However, no study to date has investigated the relationship between urban air pollution and the risk of hospital admission due to asthma in a sample representative for the whole of Poland [11,12]. Moreover, data on the lagged effects of air pollutants on the risk of hospital admission due to asthma are lacking. In this study, we gathered data from the three largest urban areas in Poland and used a time-stratified case-crossover design to analyze how ambient air pollution was related to the risk of hospital admission due to asthma over several days since exposure.

2. Materials and Methods

2.1. Setting

This study was a time-series analysis of the association between ambient air pollution and the risk of hospital admission due to asthma during the period between 1 January 2010 and 31 December 2018 in the three largest urban agglomerations in Poland: Tricity, Warsaw, and Cracow, with about 8.7% of the total population in Poland residing in these agglomerations. Tricity (population 0.75 million) is a metropolitan area consisting of Gdansk, Sopot, and Gdynia, and is located in northern Poland, on the Baltic coast. Warsaw (1.8 million) lies in east-central Poland, in the Masovian Lowland, about 260 km from the Baltic Sea. Cracow (0.77 million) lies in southern Poland, about 300 km south of Warsaw, at the foot of the Carpathian Mountains, 219 m above sea level. Figure S1 shows the geographic location of the three agglomerations. The study was a retrospective analysis of publicly available data and therefore ethical approval was not needed.

2.2. Definition and Measurements

Admission due to asthma was defined as a hospitalization billed with the J45 or J46 codes from the International Classification of Disease 10th Edition as the main reason for admission. The counts of daily admissions were gathered from the National Health Fund, i.e., the only public insurer financing the universal healthcare system in Poland and encompassed the admissions to all publicly financed hospitals in the three cities during the study period. In Poland, because of the universal healthcare system, publicly financed hospitalizations represent nearly all hospitalizations as out-of-pocket financing of inpatient care is negligible. The daily counts of admissions did not encompass emergency room visits.
The mean daily concentrations of PM10, PM2.5, NO2, and SO2 and the mean daily values of relative humidity, wind velocity, precipitation, and ambient air pressure were taken from the measuring stations of the Chief Inspectorate of Environmental Protection (https://powietrze.gios.gov.pl/pjp/maps/measuringstation accessed on 27 October 2021). For each city, we averaged the values from all available stations.

2.3. Statistical Analysis
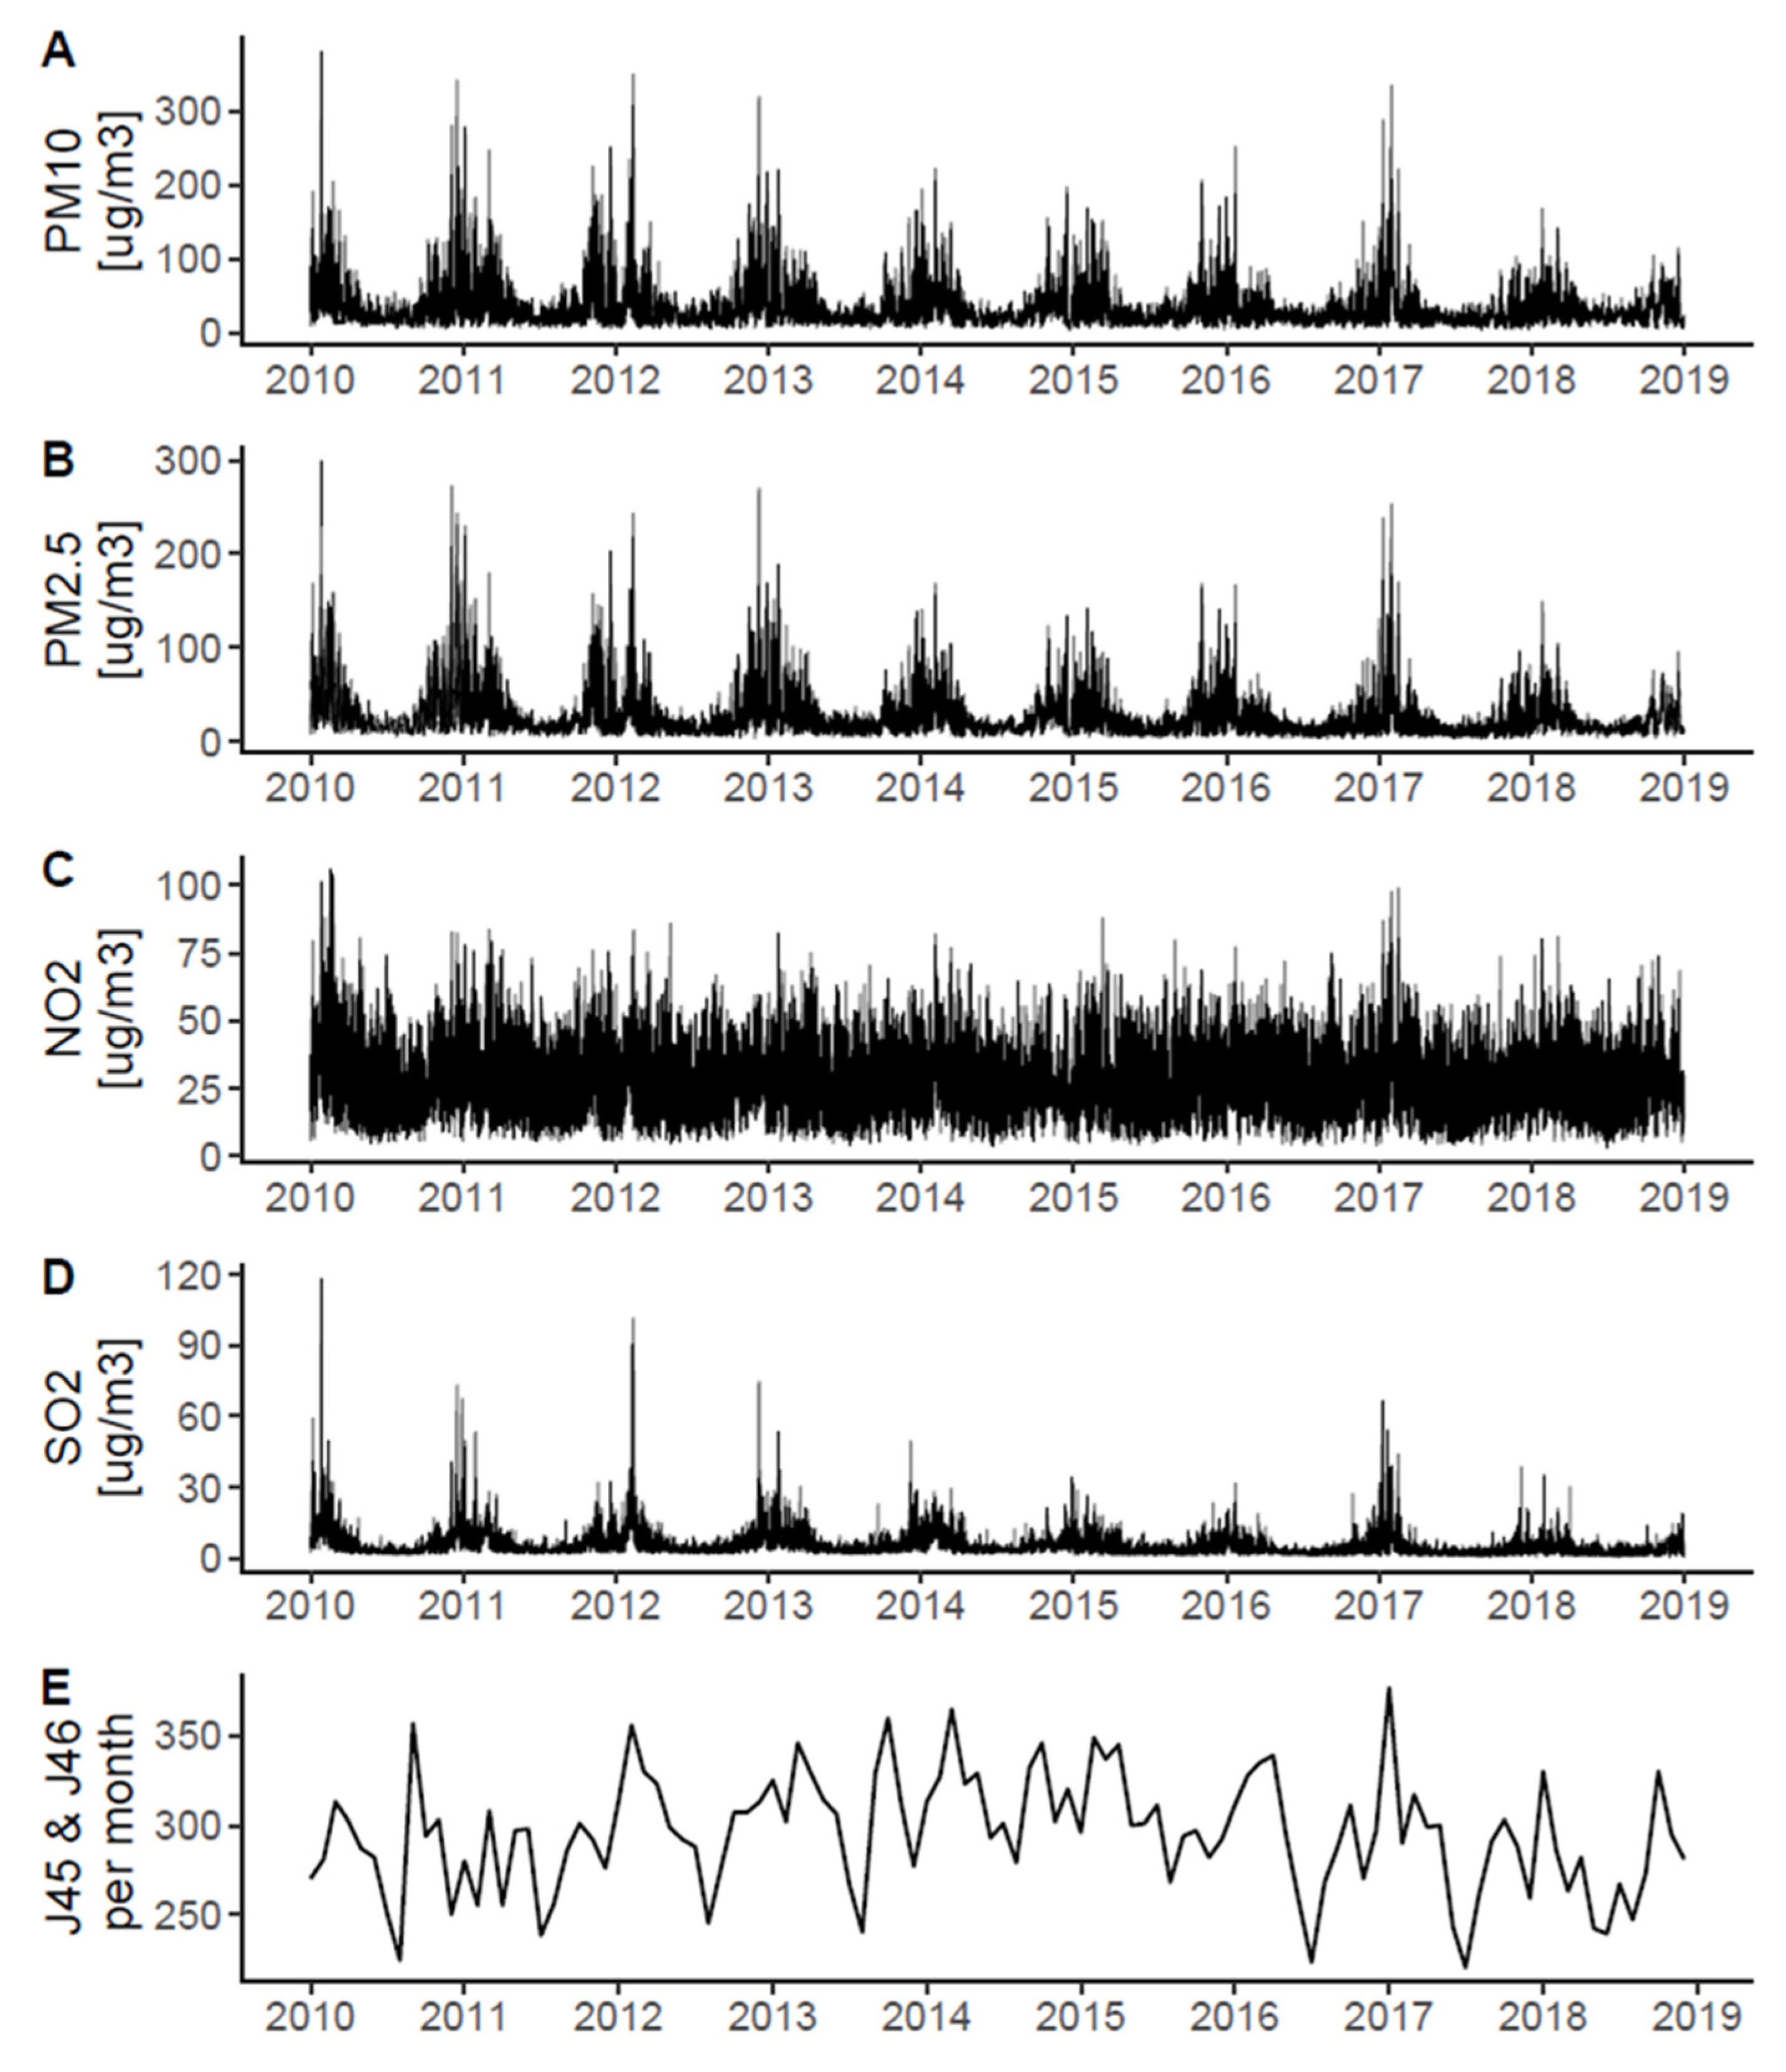
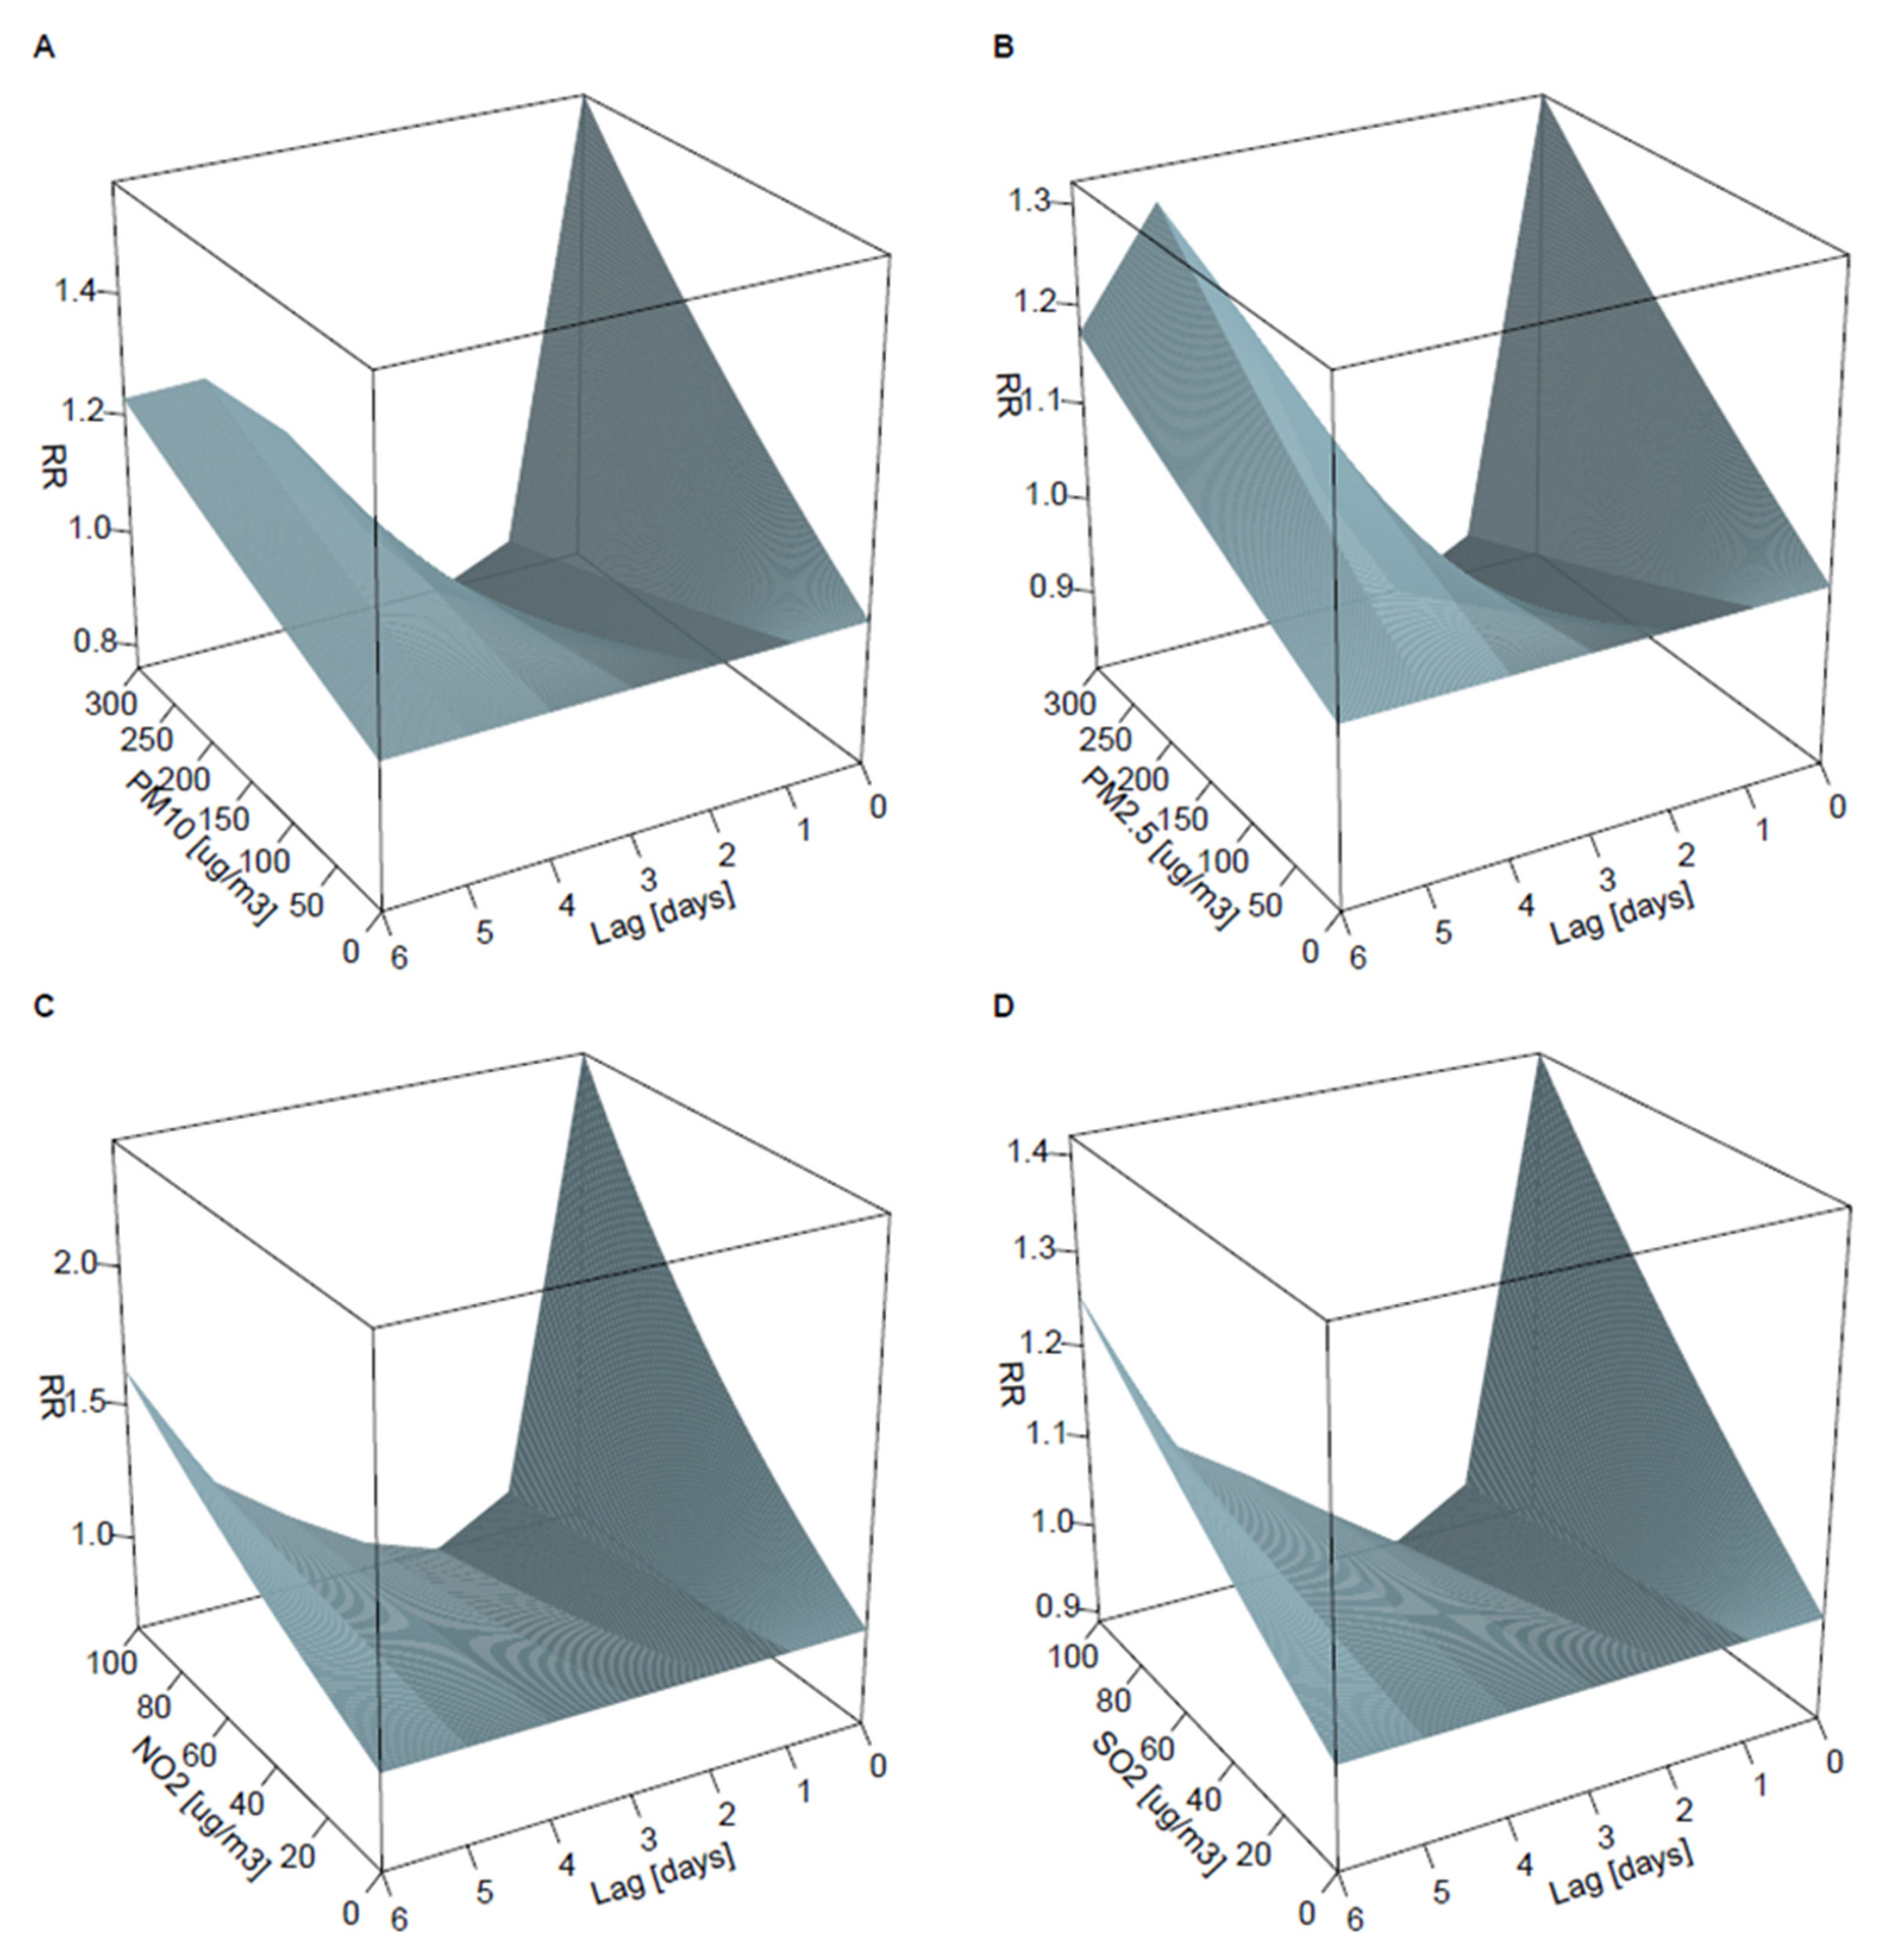
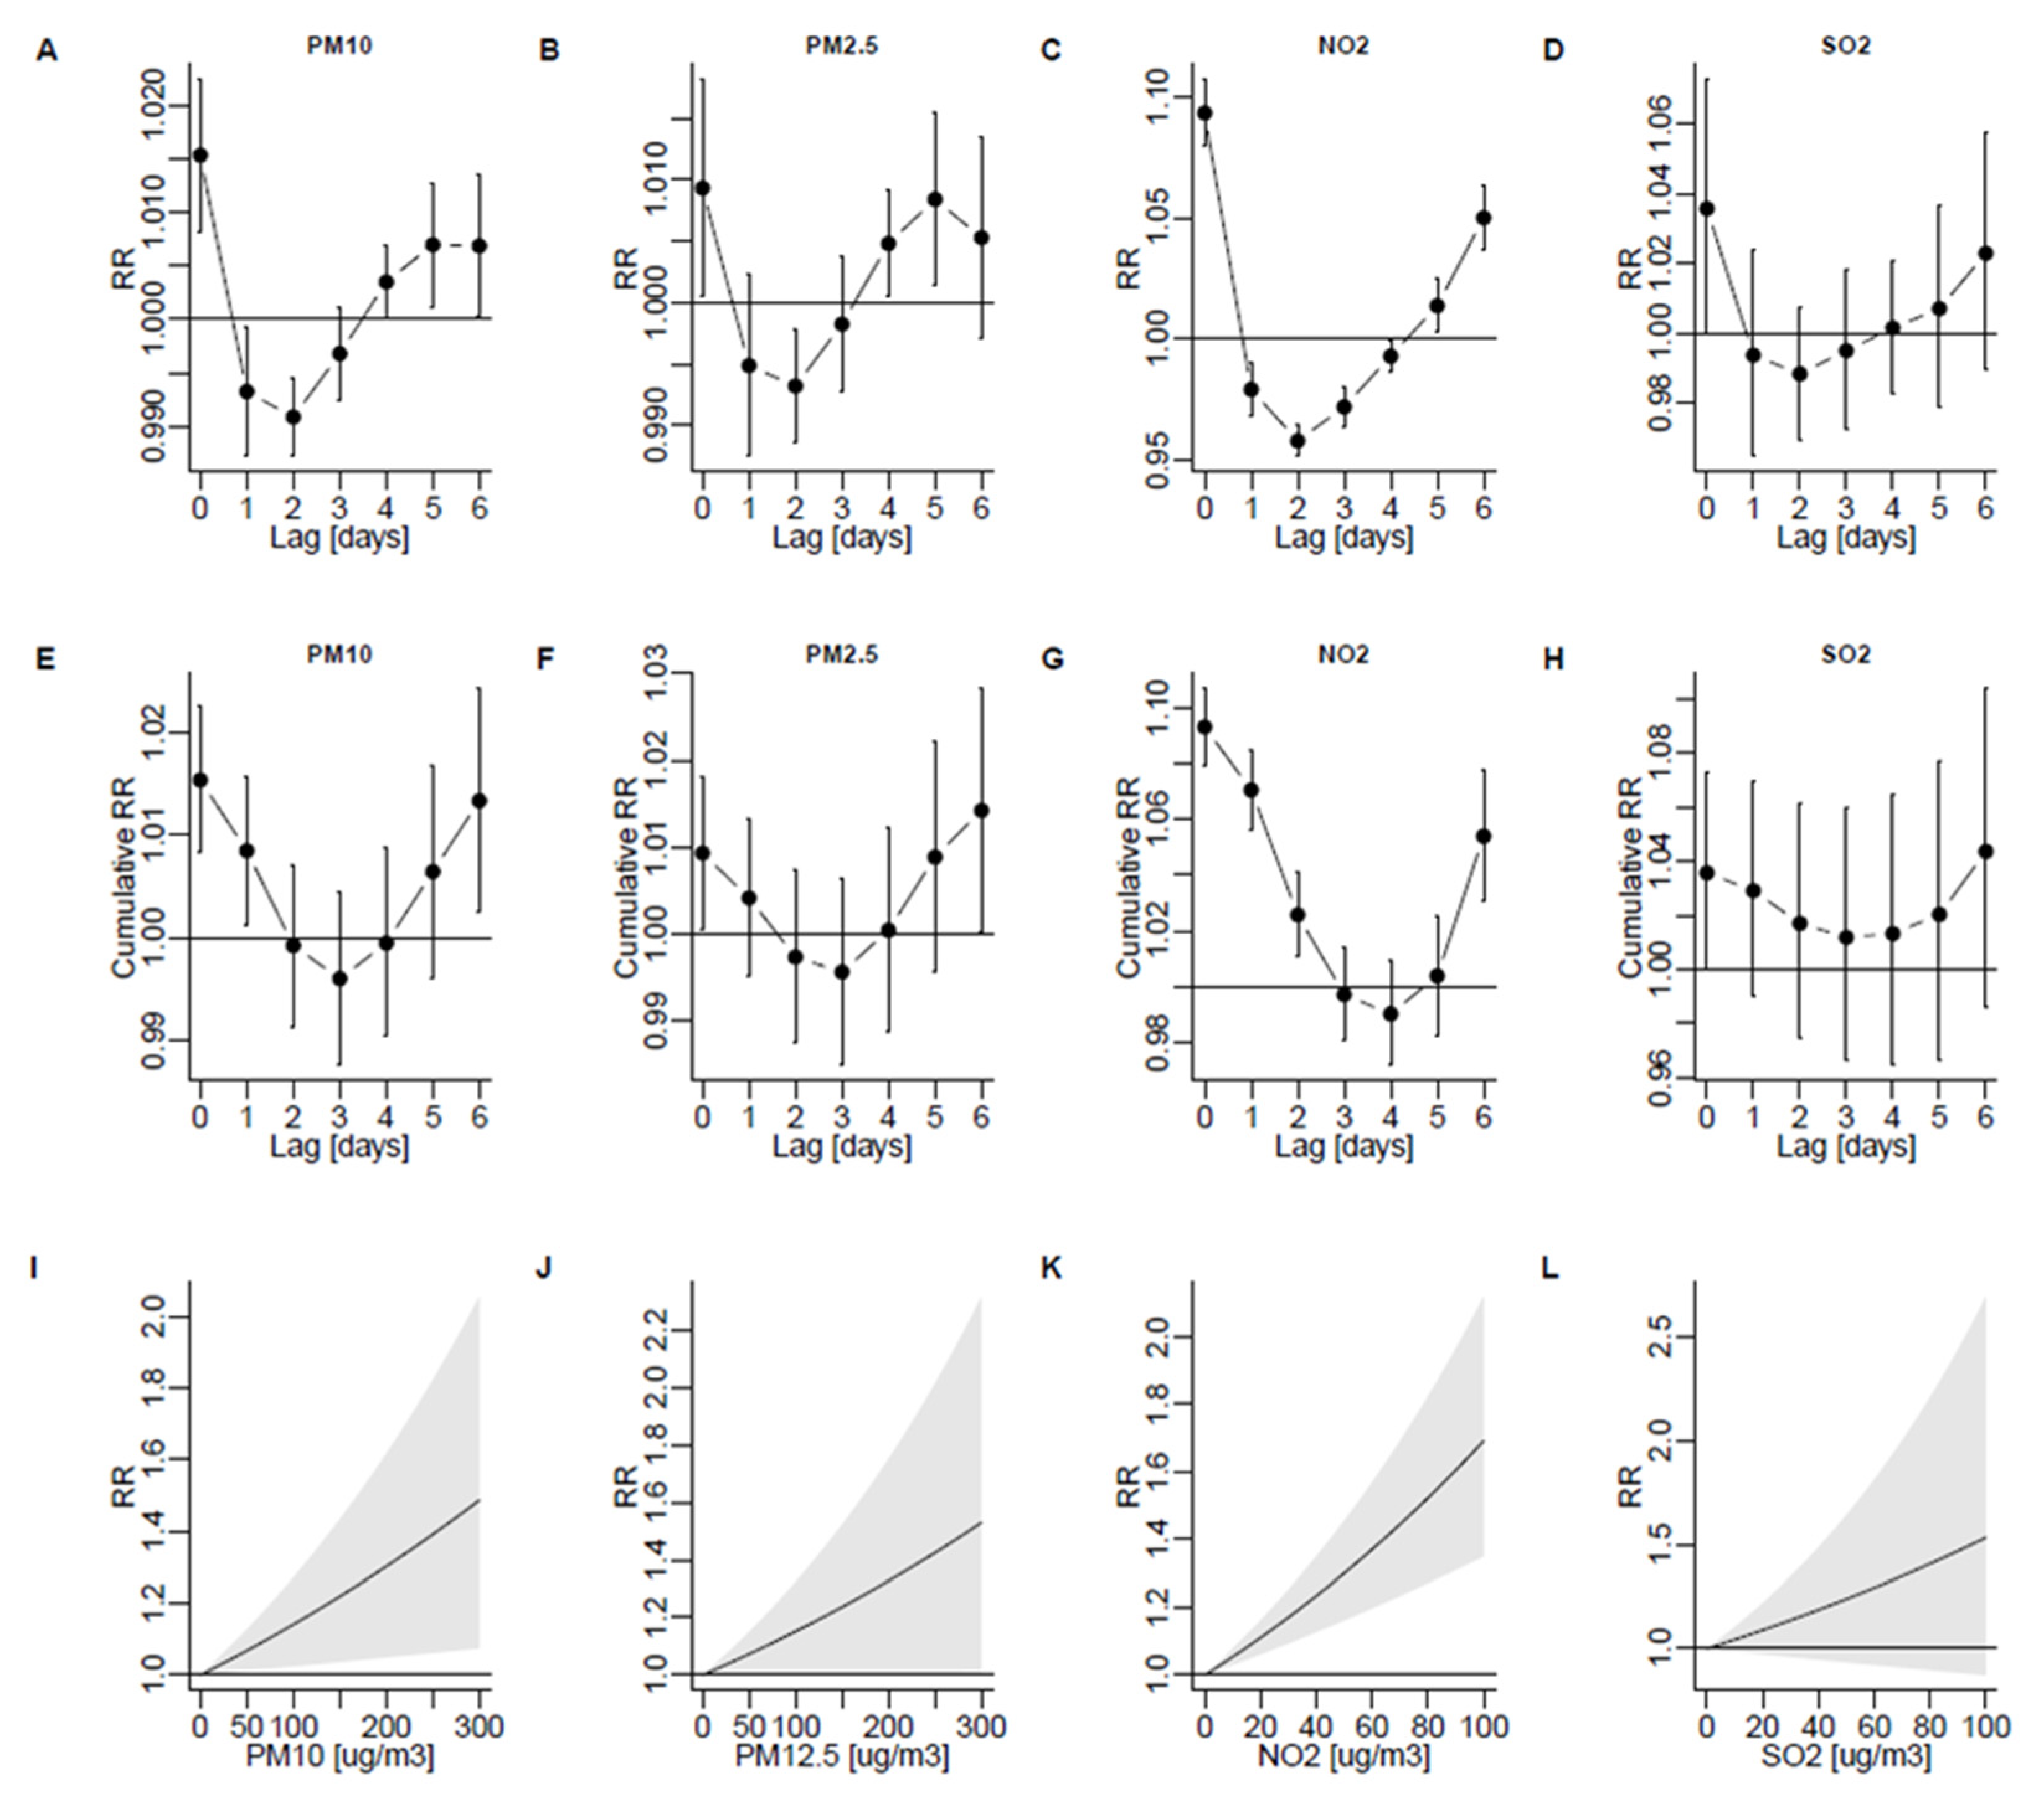
We used a time-stratified case-crossover design that compared exposures on case days with exposures on control days in the same calendar month of the same year. This design allowed the examination of how differences in exposure contributed to differences in counts of admissions. Moreover, the design allowed the pooling of data from the three cities because control periods were specific for the cities. The counts were modeled with conditional quasi-Poisson regression, which enables an analysis of aggregated exposure data and the control of overdispersion [13]. We used a stratum variable of “city-year-month” to control for a long-term trend and seasonality and to pool data from the three cities [14,15]. In addition, we adjusted the models for the effect of the day of the week. The logarithm of the total population of each city was used as the offset variable. We used distributed lag nonlinear models (DLNM) to investigate the delayed associations of PM10, PM2.5, NO2, and SO2 with admission risk. DLNMs are based on the function of cross-basis, which enables simultaneous analysis of the risk of an event along the dimensions of exposure and lag [16]. The daily concentrations of air pollutants were analyzed in separate models over 7 days from exposure, with a linear relationship between the concentration of a pollutant and the risk of admission, whereas the lag was modeled with a polynomial function and 4 degrees of freedom (df). We analyzed the risk of admission over 7 days since exposure because the effects of air pollution on asthma exacerbations seem unlikely beyond this period. The models were adjusted for the effect of meteorological variables, i.e., temperature, relative humidity, and atmospheric pressure, with natural cubic splines (df = 3) and a lag of up to one day. We used the “group” option in the “crossbasis” function in the “dlnm” package to select individual cities [17]. The results were presented as rate ratios (RR) per 10 μg/m3 for each day after exposure, including cumulative effects. Moreover, we calculated the RRs for the overall effects within the 6-day period and the percentages of hospitalizations attributable to the individual air pollutants over this period [18]. The “gnm” package was used to fit the conditional quasi-Poisson models. The “FluMoDL” package was used to calculate the percentages of hospitalizations attributable to air pollution. Results were considered statistically significant when 95% confidence intervals (CI) did not span the value of no effect (1.0 for RR; 0 for percentage of attributable admissions). All calculations were completed in R (version 3.6.2).

3. Results

3.1. Air Pollution and Asthma Hospitalizations

Figure 1 shows the daily concentrations of PM10, PM2.5 NO2, and SO2 for the entire study period, with increased concentrations during the winter months. The median concentrations of PM10, PM2.5, NO2, and SO2 were the greatest in Cracow and were the lowest in Tricity (Table 1). The values of all meteorological variables were similar across cities (Table 1).
In total, there were 31,919 hospitalizations due to the J45 or J46 codes in the three cities (details in Table 1). Figure 1E shows the monthly counts of admissions due to the J45 or J46 codes, with increased counts during the winter months, mirroring the temporal pattern for air pollutants.

3.2. Lagged Associations between PM10, PM2.5, NO2, and SO2 and the Risk of Admission

PM10 concentration was associated with the greatest risk of admission on the day of exposure; the risk decreased below baseline on days 1 and 2 but then increased up to day 6 (Figure 2A). The cumulative risk of admission over 7 days since exposure was U-shaped (Figure 2E). Overall, during 7 days since exposure, an increase of 10 μg/m3 in PM10 concentration was associated with an increased admission risk (RR per 10 μg/m3 = 1.013; 95%CI: 1.002–1.024), whereas 4.52% (95%CI: 0.80%, 8.14%) of all asthma admissions were attributable to PM10. Figure 2I and Figure 3A show the association between PM10 and the risk of admission for the range of exposures and lags. The results were similar for PM2.5: RR was 1.014 (1.000–1.028) and the percentage of attributable admission was 3.74% (0.29–7.11%; see Figure 2B,F,J and Figure 3B).
The temporal pattern between exposure and the risk of admission was similar for NO2, with the greatest risk of admission on the day of exposure, a reduced risk on days 2–3, and a subsequent increase up to day 6 (Figure 2C). The cumulative risk of admission over 7 days since exposure for NO2 was U-shaped and significantly increased on each day since exposure (Figure 2G). Overall, during 7 days since exposure, an increase in NO2 was associated with an increased admission risk (RR per 10 μg/m3 = 1.054; 95%CI: 1.031–1.078), whereas 16.4% (95%CI: 10.0%–21.8%) of all asthma admissions were attributable to NO2. Figure 2K and Figure 3C show the association between NO2 and the risk of admission for the range of exposures and lags.
The temporal pattern between SO2 exposure and the risk of admission was similar to that for PM and NO2, but the changes in risk were non-significant (Figure 2D,H,L). Overall, during 7 days since exposure, an increase in SO2 was associated with an increased admission risk (RR per 10 μg/m3 = 1.044; 95%CI: 0.986–1.104), whereas 2.50% (95%CI: −0.75–5.36%) of all asthma admissions were attributable to SO2. Figure 2I and Figure 3D show the effect of SO2 on the risk of admission for the range of exposures and lags.

4. Discussion

This study showed that increased concentrations of urban air pollutants were associated with an increased short-term risk of hospital admission due to asthma in the three largest agglomerations in Poland. Descriptive data already suggested that the changes in the concentrations of air pollutants were paralleled by asthma admission counts (Figure 1). Further analyses confirmed that exposure to air pollutants was associated with an increased risk of hospital admission due to asthma. The risk was the greatest for NO2, lower for PM10 and PM2.5, and non-significant for SO2. For all pollutants, we observed “harvesting”, with the greatest risk on the day of exposure, followed by a decrease in risk below baseline on days 2 and 3, and a further increase up to day 6. Considerable proportions of asthma hospitalizations were attributable to air pollution. The lack of a significant association between the concentration of SO2 and asthma admission could be due to low overall concentrations of this pollutant (below harmful levels).
Our findings are in line with previous reports. In a study that used a case-crossover design to analyze the risk of outpatient hospital visits for asthma in 17 Chinese cities, Lu et al. found that the risk was significantly increased by exposure to PM10, PM2.5, NO2, and SO2 in ambient air [19]. In that study, the lagged effects for PM10, PM2.5, and NO2 were similar to those in our study, with the greatest risk on the day of exposure, followed by a second peak on day 3, whereas for SO2 the risk was the greatest one day after exposure and then it returned to baseline [19]. Moreover, the overall effects of air pollution on the risk of an outpatient hospital visit due to an asthma exacerbation over 5 days since exposure in the study by Lu et al. were similar to our current report (RR = 1.004 for PM2.5, 1.005 for PM10, 1.030 for NO2, and 1.015 for SO2) [19], although we analyzed the frequency of inpatient hospitalizations. Likewise, the overall RR per 10 μg/m3 for PM10, PM2.5, NO2, and, SO2 in our analyses were consistent with those reported previously in studies from Hongkong (1.034, 1.028, 1.019, 1.021) [20] and Shijiazhuang (1.005, 1.007, 1.016, 1.020) [21]. In four European cities (APHEA project), an increase in NO2 concentration was significantly associated with the risk of emergency asthma admissions (RR, 1.029 per 50 μg/m3; PM10 was not assessed; the overall effect of SO2 was non-significant) [22]. In general, our results are in line with a meta-analysis of 87 studies, in which, at different lags, the risk of emergency room visits or hospitalizations due to asthma was significantly increased by exposure to PM10 (RR. 1.010 per 10 μg/m3) and NO2 (1.018 per 10 μg/m3) [23].
In our study, larger effects were observed for NO2 than for PM2.5, PM10, and SO2, which is in line with some previous studies. In the study by Lu et al. and our study, the greatest percentage of asthma admissions was attributable to NO2 (10.9%, ~16% in our study), lower for PM10 and PM2.5 (4.2%, ~4% in our study), and the lowest for SO2 (3.7%, ~2% in our study) [19]. Similarly, in the study by Ca et al., an interquartile range increase in the concentrations of PM10, SO2, and NO2 was associated with an increase in asthma hospitalizations by 1.82%, 6.41%, and 8.26%, respectively [24]. In contrast, in Shiraz, Iran, an interquartile range increase in PM10 was associated with a greater increase in the number of asthma hospitalizations (31%) compared to NO2 (11%) and SO2 (22%) [25]. This “reversed” effect in Shiraz could be due to occasional dust storms increasing PM10 concentrations in addition to urban emissions [26]. The link between SO2 and asthma exacerbations may be less evident than for NO2 or PM [27]. For example, in the previously mentioned APHEA study, SO2 exposure significantly increased the risk of an emergency admission due to asthma in children only [22]. In our study, SO2 pollution was associated with an increased risk of asthma admission, although this effect was non-significant. In contrast, in a study carried out in Alberta, Canada, SO2 exposure was associated with a decreased risk of an emergency room visit due to asthma, whereas NO2 and PM10 exposure increased the risk [28].
The greatest risk of admission due to asthma for all pollutants in our study was found on the day of exposure, with a subsequent risk reduction below baseline on days 2 and 3, followed by an increase up to day 6. This pattern is consistent with the phenomenon of “harvesting”, which has been observed for the effect of air pollution on mortality [29,30]. Harvesting could reflect a pattern in which air pollution affects vulnerable people immediately, who are then admitted to hospital on the day of exposure. These people are likely to stay in hospital or die shortly after admission and thus the risk remains decreased on subsequent days because the most susceptible population is smaller. The effect of air pollution on less susceptible people might be seen later, with the risk increasing gradually. In addition to an epidemiological explanation of harvesting, the two-phase effect of air pollutants on asthma admissions could be because of direct irritation of the airways on the day of exposure, causing immediate bronchoconstriction; then, a gradual pro-inflammatory effect in the airways could further worsen asthma symptoms [7]. Some previous studies analyzing the effect of air pollutants on the risk of asthma exacerbations found harvesting [31,32,33,34], whereas others did not find [19,35]. Lu et al. observed that the risk of asthma admission was the greatest on the day of exposure for PM2.5, PM10, and NO2, but it did not decrease below baseline on subsequent days. Similarly, Lee et al. found that the risk of emergency room visits due to asthma increased over 3 days since exposure to PM10, NO2, and SO2 [35]. However, Lu et al. analyzed outpatient hospital admissions, Lee et al. analyzed emergency room visits, whereas we analyzed inpatient admissions, which most likely represent more severe asthma exacerbations. In Poland, patients with symptoms that do not require immediate admission to hospital may be treated in emergency departments for up to 3 days; if they improve, patients are discharged home and the emergency room visit does not count as a hospitalization.
The limitations of our study need to be acknowledged. We did not analyze how demographic data could modify the effects of air pollutants on the risk of asthma admission. This was because we could obtain only aggregated data on the counts of admissions, whereas demographic data were unavailable. Therefore, we analyzed pooled data from children and adults and the effects of air pollution on asthma exacerbations could differ by age group. Moreover, we could not differentiate between repeated visits by the same patient. The data on air pollutants were taken from a few measuring stations; however, individualized data would be more accurate. Finally, the data on asthma admissions did not include mild and moderate exacerbations, which account for a substantial proportion of asthma exacerbations. The strengths of our study include an analysis of an urban population representative for Poland (nearly 10% of the country’s population) and the use of a time-stratified case-crossover design that reduces confounding by conditioning data specific to location and a short time window [13,14]. The pooling of data from the three cities was justified because of the similarities in climates and ethnicity of populations across the cities. Moreover, the data on the number of admissions and pollutant concentrations were taken from the same institutions for all cities.

5. Conclusions

In conclusion, PM2.5, PM10, NO2, and SO2 pollution was associated with an increased risk of hospital admission due to asthma in the three largest urban agglomerations in Poland over nine years. Our results add further evidence on the association between air pollution and the burden of respiratory diseases in Poland [36,37]. We hope this accumulating evidence will help push forward initiatives to reduce emissions from individual households in Poland, the main source of PM, and to reduce NO2 emissions, which are mainly attributable to increasing traffic [38].

Supplementary Materials

The following supporting information can be downloaded at: https://www.mdpi.com/article/10.3390/ijerph19105988/s1, Supplementary Figure S1. Geographic location of the three largest urban agglomerations in Poland.

Author Contributions

Conceptualization, A.B. and P.D.; methodology, A.B. and P.D.; software, A.B. and P.D.; validation, A.B. and P.D.; formal analysis, A.B., A.C. and P.D.; investigation, A.B., A.D. and P.D.; resources, A.B. and P.D.; data curation, A.B.; writing—original draft preparation, A.B. and P.D.; writing—review and editing, A.B., A.C., A.D. and P.D.; visualization, A.B. and P.D.; supervision, A.B.; project administration, P.D.; funding acquisition, A.B. and P.D. All authors have read and agreed to the published version of the manuscript.

Funding

This research received no external funding.

Institutional Review Board Statement

This was an analysis of de-identified data and therefore ethics approval was not needed.

Informed Consent Statement

Not applicable.

Data Availability Statement

Data are available from the corresponding author.

Acknowledgments

We are thankful for the Polish National Health Fund that provided data on the daily number of health events investigated. We are also grateful to the Chief Inspectorate for Environmental Protection for making the data on air pollution publicly available.

Conflicts of Interest

The authors declare no conflict of interest.

References

  1. Vos, T.; Allen, C.; Arora, M.; Barber, R.M.; Bhutta, Z.A.; Brown, A.; Carter, A.; Casey, D.C.; Charlson, F.J.; Chen, A.Z.; et al. Global, regional, and national incidence, prevalence, and years lived with disability for 310 diseases and injuries, 1990–2015: A systematic analysis for the Global Burden of Disease Study 2015. Lancet 2016, 388, 1545–1602. [Google Scholar] [CrossRef] [Green Version]
  2. The Global Asthma Report 2018; Global Asthma Network: Auckland, New Zealand, 2018; ISBN 978-0-473-46524-7.
  3. Papi, A.; Brightling, C.; Pedersen, S.E.; Reddel, H.K. Asthma. Lancet 2018, 391, 783–800. [Google Scholar] [CrossRef]
  4. Yang, J.F.; Chaudhuri, R.; Thomson, N.C.; Ramparsad, N.; O’Pray, H.; Barclay, S.; MacBride-Stewart, S.; McCallum, C.; Sharma, V.; McSharry, C.; et al. Insights into frequent asthma exacerbations from a primary care perspective and the implications of UK National Review of Asthma Deaths recommendations. NPJ Prim. Care Respir. Med. 2018, 28, 35. [Google Scholar] [CrossRef] [PubMed] [Green Version]
  5. DiMango, E.; Rogers, L.; Reibman, J.; Gerald, L.B.; Brown, M.; Sugar, E.A.; Henderson, R.; Holbrook, J.T. Risk Factors for Asthma Exacerbation and Treatment Failure in Adults and Adolescents with Well-controlled Asthma during Continuation and Step-Down Therapy. Ann. Am. Thorac. Soc. 2018, 15, 955–961. [Google Scholar] [CrossRef]
  6. Suruki, R.Y.; Daugherty, J.B.; Boudiaf, N.; Albers, F.C. The frequency of asthma exacerbations and healthcare utilization in patients with asthma from the UK and USA. BMC Pulm. Med. 2017, 17, 74. [Google Scholar] [CrossRef] [Green Version]
  7. Guarnieri, M.; Balmes, J.R. Outdoor air pollution and asthma. Lancet 2014, 383, 1581–1592. [Google Scholar] [CrossRef] [Green Version]
  8. Huang, J.; Yang, X.; Fan, F.; Hu, Y.; Wang, X.; Zhu, S.; Ren, G.; Wang, G. Outdoor air pollution and the risk of asthma exacerbations in single lag0 and lag1 exposure patterns: A systematic review and meta-analysis. J. Asthma 2021, 28, 1–18. [Google Scholar] [CrossRef]
  9. World Bank Poland Air Quality Management—Poland Final Report. Available online: https://openknowledge.worldbank.org/bitstream/handle/10986/31531/Air-Quality-Management-in-Poland.pdf (accessed on 28 April 2022).
  10. Badyda, A.J. Zrodla zanieczyszczen powietrza. Najważniejsze szkodliwe substancje spotykane w atmosferze. In Smog. Konsekwencje Zdrowotne Zanieczyszczeń Powietrza; Mazurek, H., Badyda, A.J., Eds.; PZWL Wydawnictwo Lekarskie: Warsaw, Poland, 2018; pp. 17–30. ISBN 978-83-200-5575-7. [Google Scholar]
  11. Kowalska, M.; Skrzypek, M.; Kowalski, M.; Cyrys, J. Effect of NOx and NO2 Concentration Increase in Ambient Air to Daily Bronchitis and Asthma Exacerbation, Silesian Voivodeship in Poland. Int. J. Environ. Res. Public Health 2020, 17, 754. [Google Scholar] [CrossRef] [Green Version]
  12. Nazar, W.; Niedoszytko, M. Air Pollution in Poland: A 2022 Narrative Review with Focus on Respiratory Diseases. Int. J. Environ. Res. Public Health 2022, 19, 895. [Google Scholar] [CrossRef]
  13. Armstrong, B.G.; Gasparrini, A.; Tobias, A. Conditional Poisson models: A flexible alternative to conditional logistic case cross-over analysis. BMC Med. Res. Methodol. 2014, 14, 122. [Google Scholar] [CrossRef] [Green Version]
  14. Ragettli, M.S.; Vicedo-Cabrera, A.M.; Schindler, C.; Röösli, M. Exploring the association between heat and mortality in Switzerland between 1995 and 2013. Environ. Res. 2017, 158, 703–709. [Google Scholar] [CrossRef] [PubMed] [Green Version]
  15. Wang, Z.; Peng, J.; Liu, P.; Duan, Y.; Huang, S.; Wen, Y.; Liao, Y.; Li, H.; Yan, S.; Cheng, J.; et al. Association between short-term exposure to air pollution and ischemic stroke onset: A time-stratified case-crossover analysis using a distributed lag nonlinear model in Shenzhen, China. Environ. Health 2020, 19, 1. [Google Scholar] [CrossRef] [PubMed] [Green Version]
  16. Gasparrini, A. Modeling exposure–lag–response associations with distributed lag non-linear models. Stat. Med. 2014, 33, 881–899. [Google Scholar] [CrossRef] [PubMed] [Green Version]
  17. Gasparrini, A. Distributed Lag Linear and Non-Linear Models in R: The Package dlnm. J. Stat. Softw. 2011, 43, 1–20. [Google Scholar] [CrossRef] [PubMed] [Green Version]
  18. Gasparrini, A.; Leone, M. Attributable risk from distributed lag models. BMC Med. Res. Methodol. 2014, 14, 55. [Google Scholar] [CrossRef] [Green Version]
  19. Lu, P.; Zhang, Y.; Lin, J.; Xia, G.; Zhang, W.; Knibbs, L.D.; Morgan, G.G.; Jalaludin, B.; Marks, G.; Abramson, M.; et al. Multi-city study on air pollution and hospital outpatient visits for asthma in China. Environ. Pollut. 2020, 257, 113638. [Google Scholar] [CrossRef]
  20. Ko, F.W.S.; Tam, W.; Wong, T.W.; Lai, C.K.W.; Wong, G.W.K.; Leung, T.-F.; Ng, S.S.S.; Hui, D.S.C. Effects of air pollution on asthma hospitalization rates in different age groups in Hong Kong. Clin. Exp. Allergy 2007, 37, 1312–1319. [Google Scholar] [CrossRef]
  21. Liu, F.; Qu, F.; Zhang, H.; Chao, L.; Li, R.; Yu, F.; Guan, J.; Yan, X. The effect and burden modification of heating on adult asthma hospitalizations in Shijiazhuang: A time-series analysis. Respir. Res. 2019, 20, 122. [Google Scholar] [CrossRef] [Green Version]
  22. Sunyer, J.; Spix, C.; Quenel, P.; Ponce-de-Leon, A.; Ponka, A.; Barumandzadeh, T.; Touloumi, G.; Bacharova, L.; Wojtyniak, B.; Vonk, J.; et al. Urban air pollution and emergency admissions for asthma in four European cities: The APHEA Project. Thorax 1997, 52, 760–765. [Google Scholar] [CrossRef] [Green Version]
  23. Zheng, X.; Ding, H.; Jiang, L.; Chen, S.; Zheng, J.; Qiu, M.; Zhou, Y.; Chen, Q.; Guan, W. Association between Air Pollutants and Asthma Emergency Room Visits and Hospital Admissions in Time Series Studies: A Systematic Review and Meta-Analysis. PLoS ONE 2015, 10, e0138146. [Google Scholar] [CrossRef]
  24. Cai, J.; Zhao, A.; Zhao, J.; Chen, R.; Wang, W.; Ha, S.; Xu, X.; Kan, H. Acute effects of air pollution on asthma hospitalization in Shanghai, China. Environ. Pollut. 2014, 191, 139–144. [Google Scholar] [CrossRef] [PubMed]
  25. Soleimani, Z.; Darvishi Boloorani, A.; Khalifeh, R.; Teymouri, P.; Mesdaghinia, A.; Griffin, D.W. Air pollution and respiratory hospital admissions in Shiraz, Iran, 2009 to 2015. Atmos. Environ. 2019, 209, 233–239. [Google Scholar] [CrossRef]
  26. Krasnov, H.; Katra, I.; Koutrakis, P.; Friger, M.D. Contribution of dust storms to PM 10 levels in an urban arid environment. J. Air Waste Manag. Assoc. 2014, 64, 89–94. [Google Scholar] [CrossRef] [PubMed] [Green Version]
  27. Galán, I.; Tobías, A.; Banegas, J.R.; Aránguez, E. Short-term effects of air pollution on daily asthma emergency room admissions. Eur. Respir. J. 2003, 22, 802–808. [Google Scholar] [CrossRef]
  28. Villeneuve, P.J.; Chen, L.; Rowe, B.H.; Coates, F. Outdoor air pollution and emergency department visits for asthma among children and adults: A case-crossover study in northern Alberta, Canada. Environ. Health 2007, 6, 40. [Google Scholar] [CrossRef] [Green Version]
  29. Basagaña, X.; Barrera-Gómez, J. Reflection on modern methods: Visualizing the effects of collinearity in distributed lag models. Int. J. Epidemiol. 2021, 51, 334–344. [Google Scholar] [CrossRef]
  30. Rabl, A. Air Pollution Mortality: Harvesting And Loss Of Life Expectancy. J. Toxicol. Environ. Health Part A 2005, 68, 1175–1180. [Google Scholar] [CrossRef]
  31. Guo, H.; Chen, M. Short-term effect of air pollution on asthma patient visits in Shanghai area and assessment of economic costs. Ecotoxicol. Environ. Saf. 2018, 161, 184–189. [Google Scholar] [CrossRef]
  32. Nadali, A.; Leili, M.; Karami, M.; Bahrami, A.; Afkhami, A. The short-term association between air pollution and asthma hospitalization: A time-series analysis. Air Qual. Atmos. Health 2021, 1–15. [Google Scholar] [CrossRef]
  33. AlBalawi, S.M.; Namdeo, A.; Hodgson, S.; Pless-Mulloli, T.; McNally, R.J.Q. Short-term effects of air pollution on daily asthma-related emergency department visits in an industrial city. J. Public Health 2021, 43, e45–e53. [Google Scholar] [CrossRef]
  34. Çapraz, Ö.; Deniz, A. Assessment of hospitalizations from asthma, chronic obstructive pulmonary disease and acute bronchitis in relation to air pollution in İstanbul, Turkey. Sustain. Cities Soc. 2021, 72, 103040. [Google Scholar] [CrossRef]
  35. Lee, S.W.; Yon, D.K.; James, C.C.; Lee, S.; Koh, H.Y.; Sheen, Y.H.; Oh, J.-W.; Han, M.Y.; Sugihara, G. Short-term effects of multiple outdoor environmental factors on risk of asthma exacerbations: Age-stratified time-series analysis. J. Allergy Clin. Immunol. 2019, 144, 1542–1550.e1. [Google Scholar] [CrossRef] [PubMed] [Green Version]
  36. Ratajczak, A.; Badyda, A.; Czechowski, P.O.; Czarnecki, A.; Dubrawski, M.; Feleszko, W. Air Pollution Increases the Incidence of Upper Respiratory Tract Symptoms among Polish Children. J. Clin. Med. 2021, 10, 2150. [Google Scholar] [CrossRef] [PubMed]
  37. Dąbrowiecki, P.; Adamkiewicz, Ł.; Mucha, D.; Czechowski, P.O.; Soliński, M.; Chciałowski, A.; Badyda, A. Impact of Air Pollution on Lung Function among Preadolescent Children in Two Cities in Poland. J. Clin. Med. 2021, 10, 2375. [Google Scholar] [CrossRef]
  38. Institute of Environmental Protection Sources of Emissions of SO2, NOX, CO, NH3, NMVOCs, Particulate Matter, Heavy Metals, and POPs. Available online: https://www.kobize.pl/uploads/materialy/Inwentaryzacje_krajowe/2015/Bilansemisji—raportpodstawowy_2013.pdf (accessed on 19 January 2022).
Figure 1. Daily concentrations of PM10 (A), PM2.5 (B), NO2 (C), and SO2 (D) in the study period. Monthly counts of hospitalizations due to the J45 or J46 ICD-10 codes (E) (“asthma”).
Ijerph 19 05988 g001
Figure 2. Risk of admission due to J45 or J46 (“asthma”) per 10 μg/m3 for PM10 (A), PM2.5 (B) NO2 (C), and SO2 (D) depending on lag. Cumulative effects are shown in (EH). Predicted admission risk within a range of exposure is shown in (IL). 95% confidence intervals are shown as bars (AF) or shaded areas (GI). RR, rate ratio.
Ijerph 19 05988 g002
Figure 3. Risk for admission due to J45 or J46 (“asthma”) depending on time since exposure (lag) and concentrations of PM10 (A), PM2.5 (B), NO2 (C), and SO2 (D). RR, rate, ratio.
Ijerph 19 05988 g003
Table 1. Average daily concentrations of air pollutants, average daily values of meteorological variables, and total counts of asthma admission by city.
WarsawCracowTricity
PM10, μg/m3, median (IQR)28.4 (20.7–40.3)36.3 (24.4–60.0)15.5 (11.2–22.6)
PM2.5, μg/m3, median (IQR)20.6 (14.5–31.9)26.0 (17.1–46.5)11.5 (7.87–17.6)
NO2, μg/m3, median (IQR)33.6 (26.1–41.4)40.8 (33.6–49.0)13.8 (9.69–19.1)
SO2, μg/m3, median (IQR)4.56 (2.94–7.12)5.63 (4.02)2.61 (1.84–3.92)
Temperature, °C, median (IQR)9.58 (2.90–16.9)9.90 (2.95–16.6)9.29 (3.71–5.9)
Relative humidity, %, median (IQR)77.5 (66.1–87.1)78.2 (68.6–86.2)74.9 (67.6–80.7)
Atmospheric pressure, hPa, median (IQR)1003 (998–1008)988 (983–992)1007 (1001–1012)
J45 and J46 admissions, n17,01580626842
J45 and J46 admissions per million, n945210,4709122
IQR, interquartile range.
Publisher’s Note: MDPI stays neutral with regard to jurisdictional claims in published maps and institutional affiliations.

