
Assessment of Meteorological Variables and Air Pollution Affecting COVID-19 Cases in Urban Agglomerations: Evidence from China


Abstract
:
1. Introduction
2. Materials and Methods
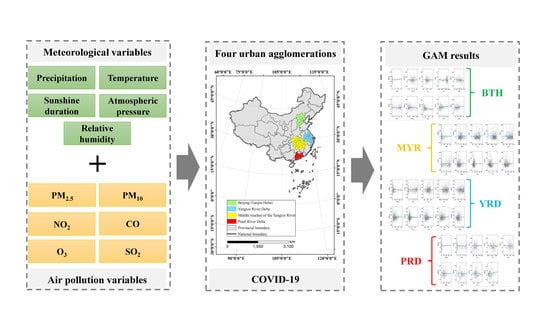
2.1. Study Design
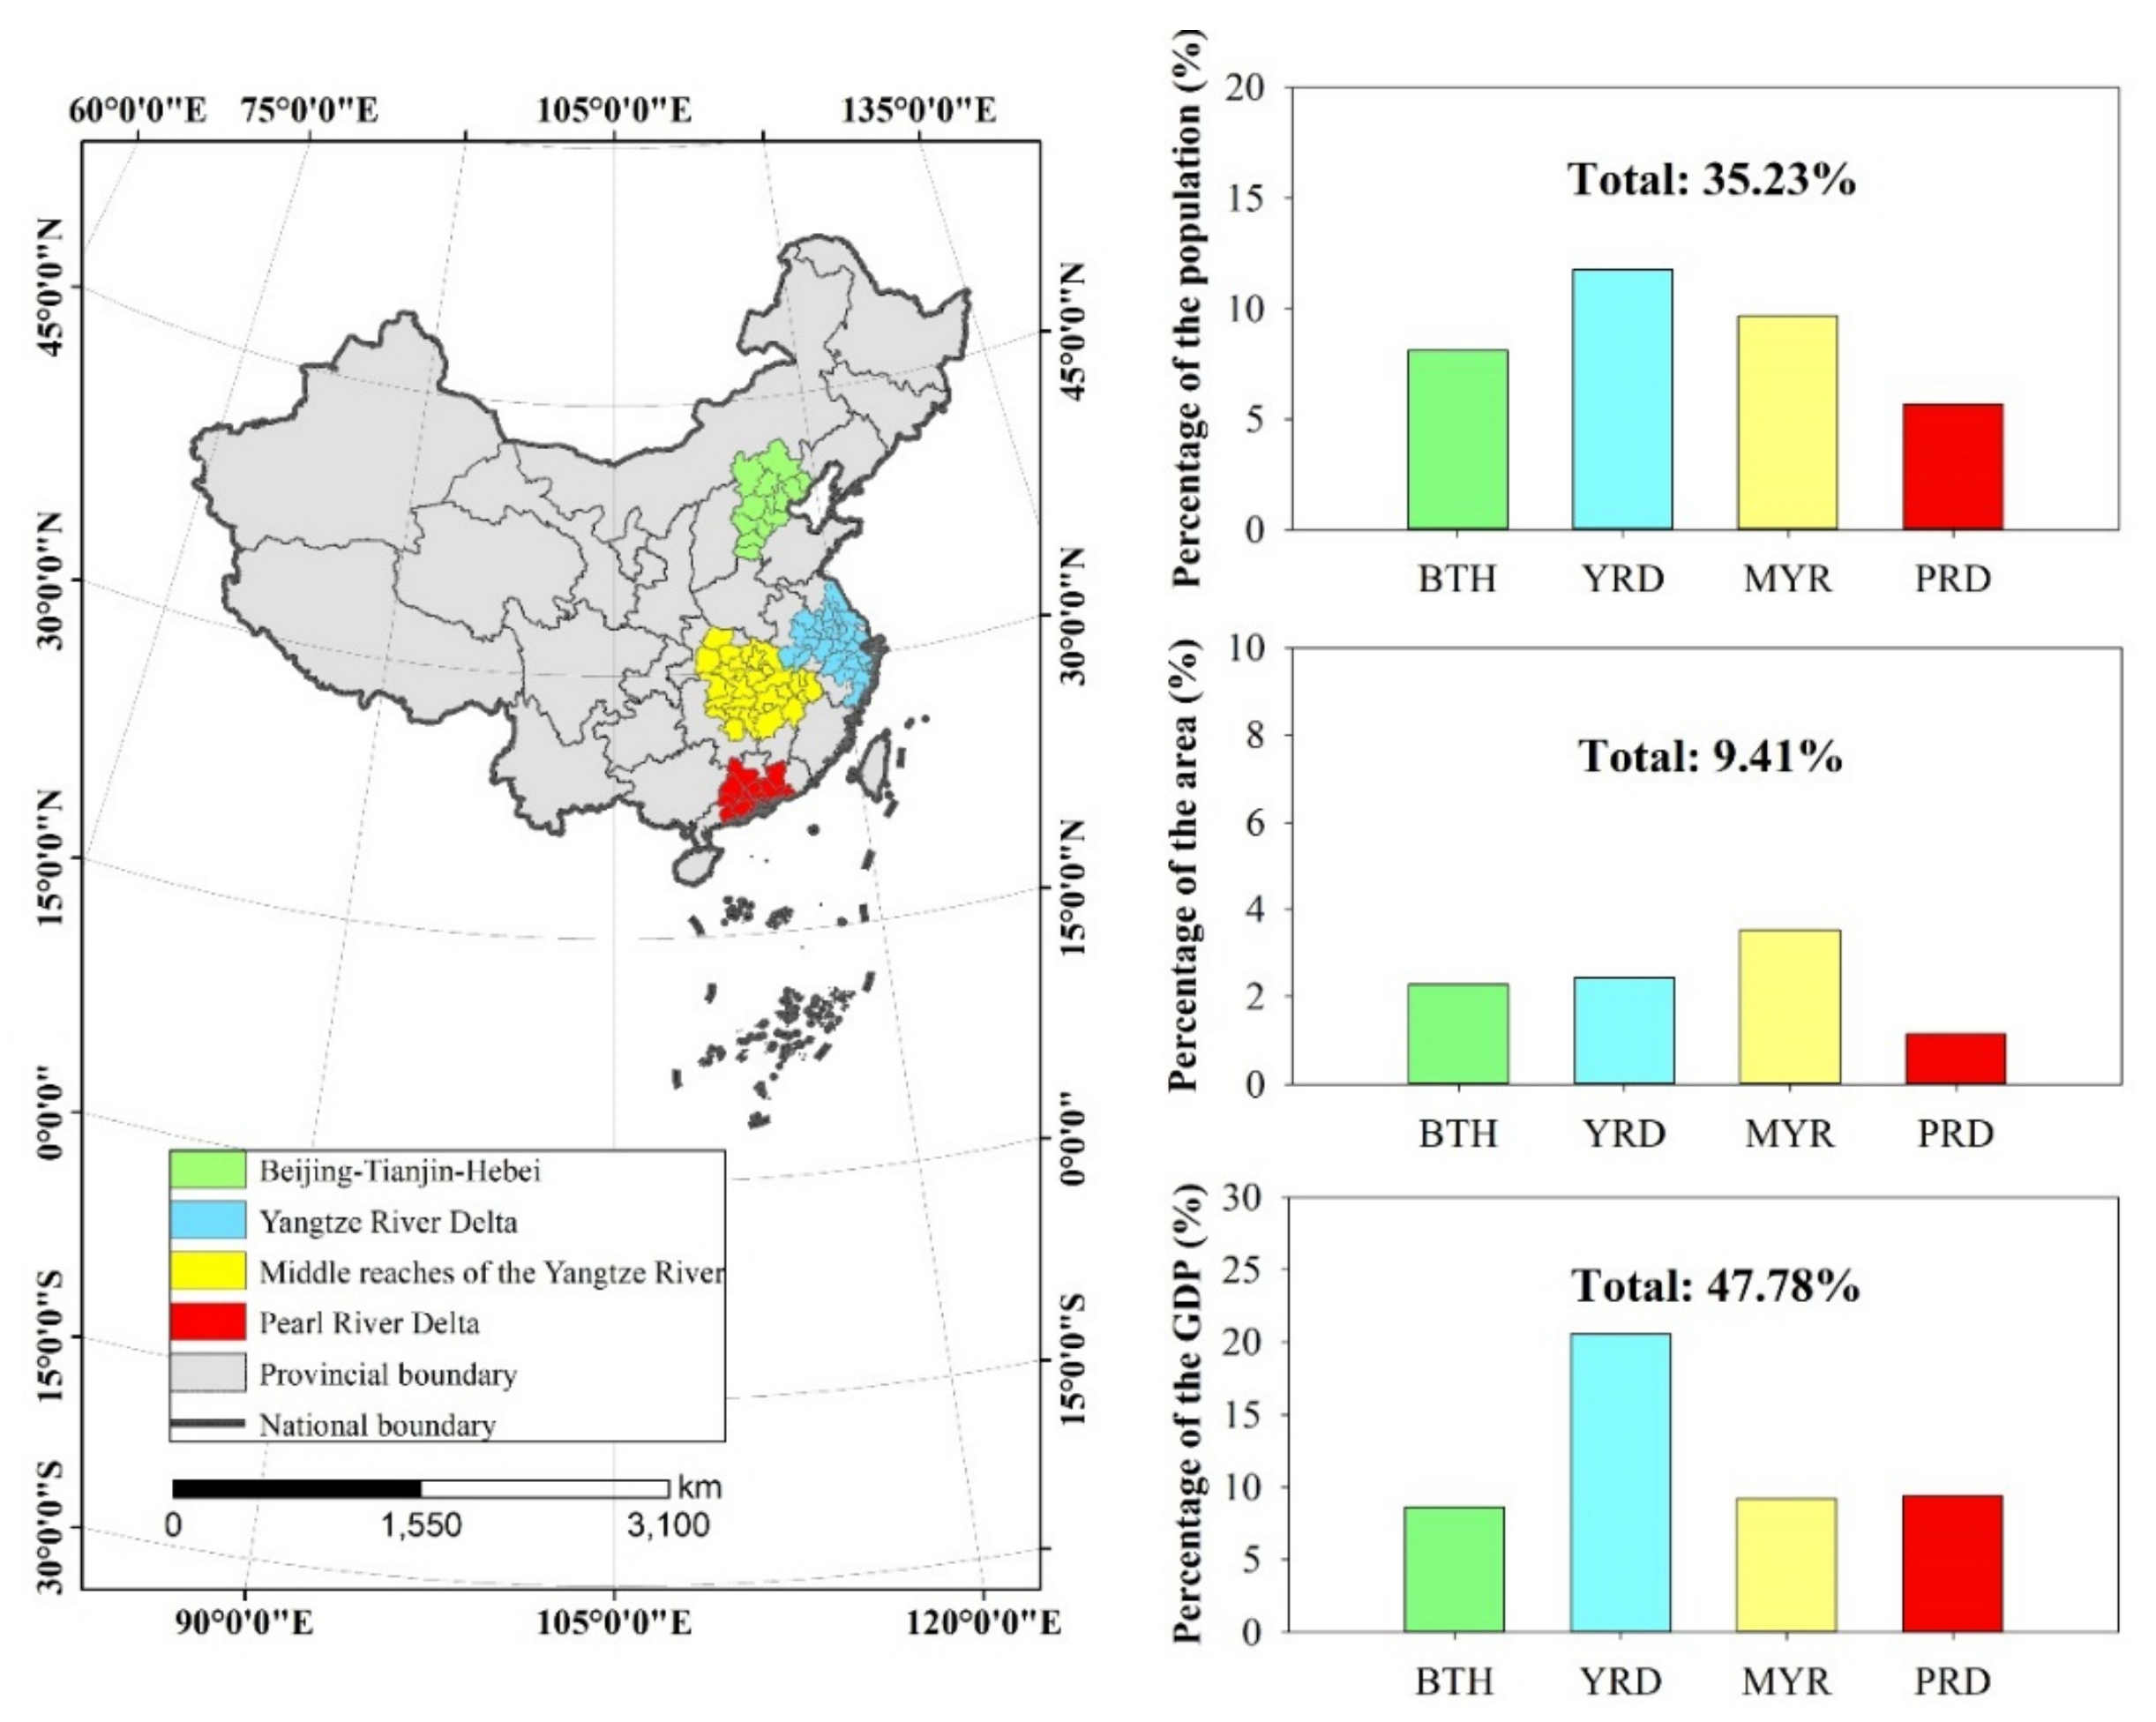
2.2. Study Area
2.3. Data
2.4. Methods
3. Results
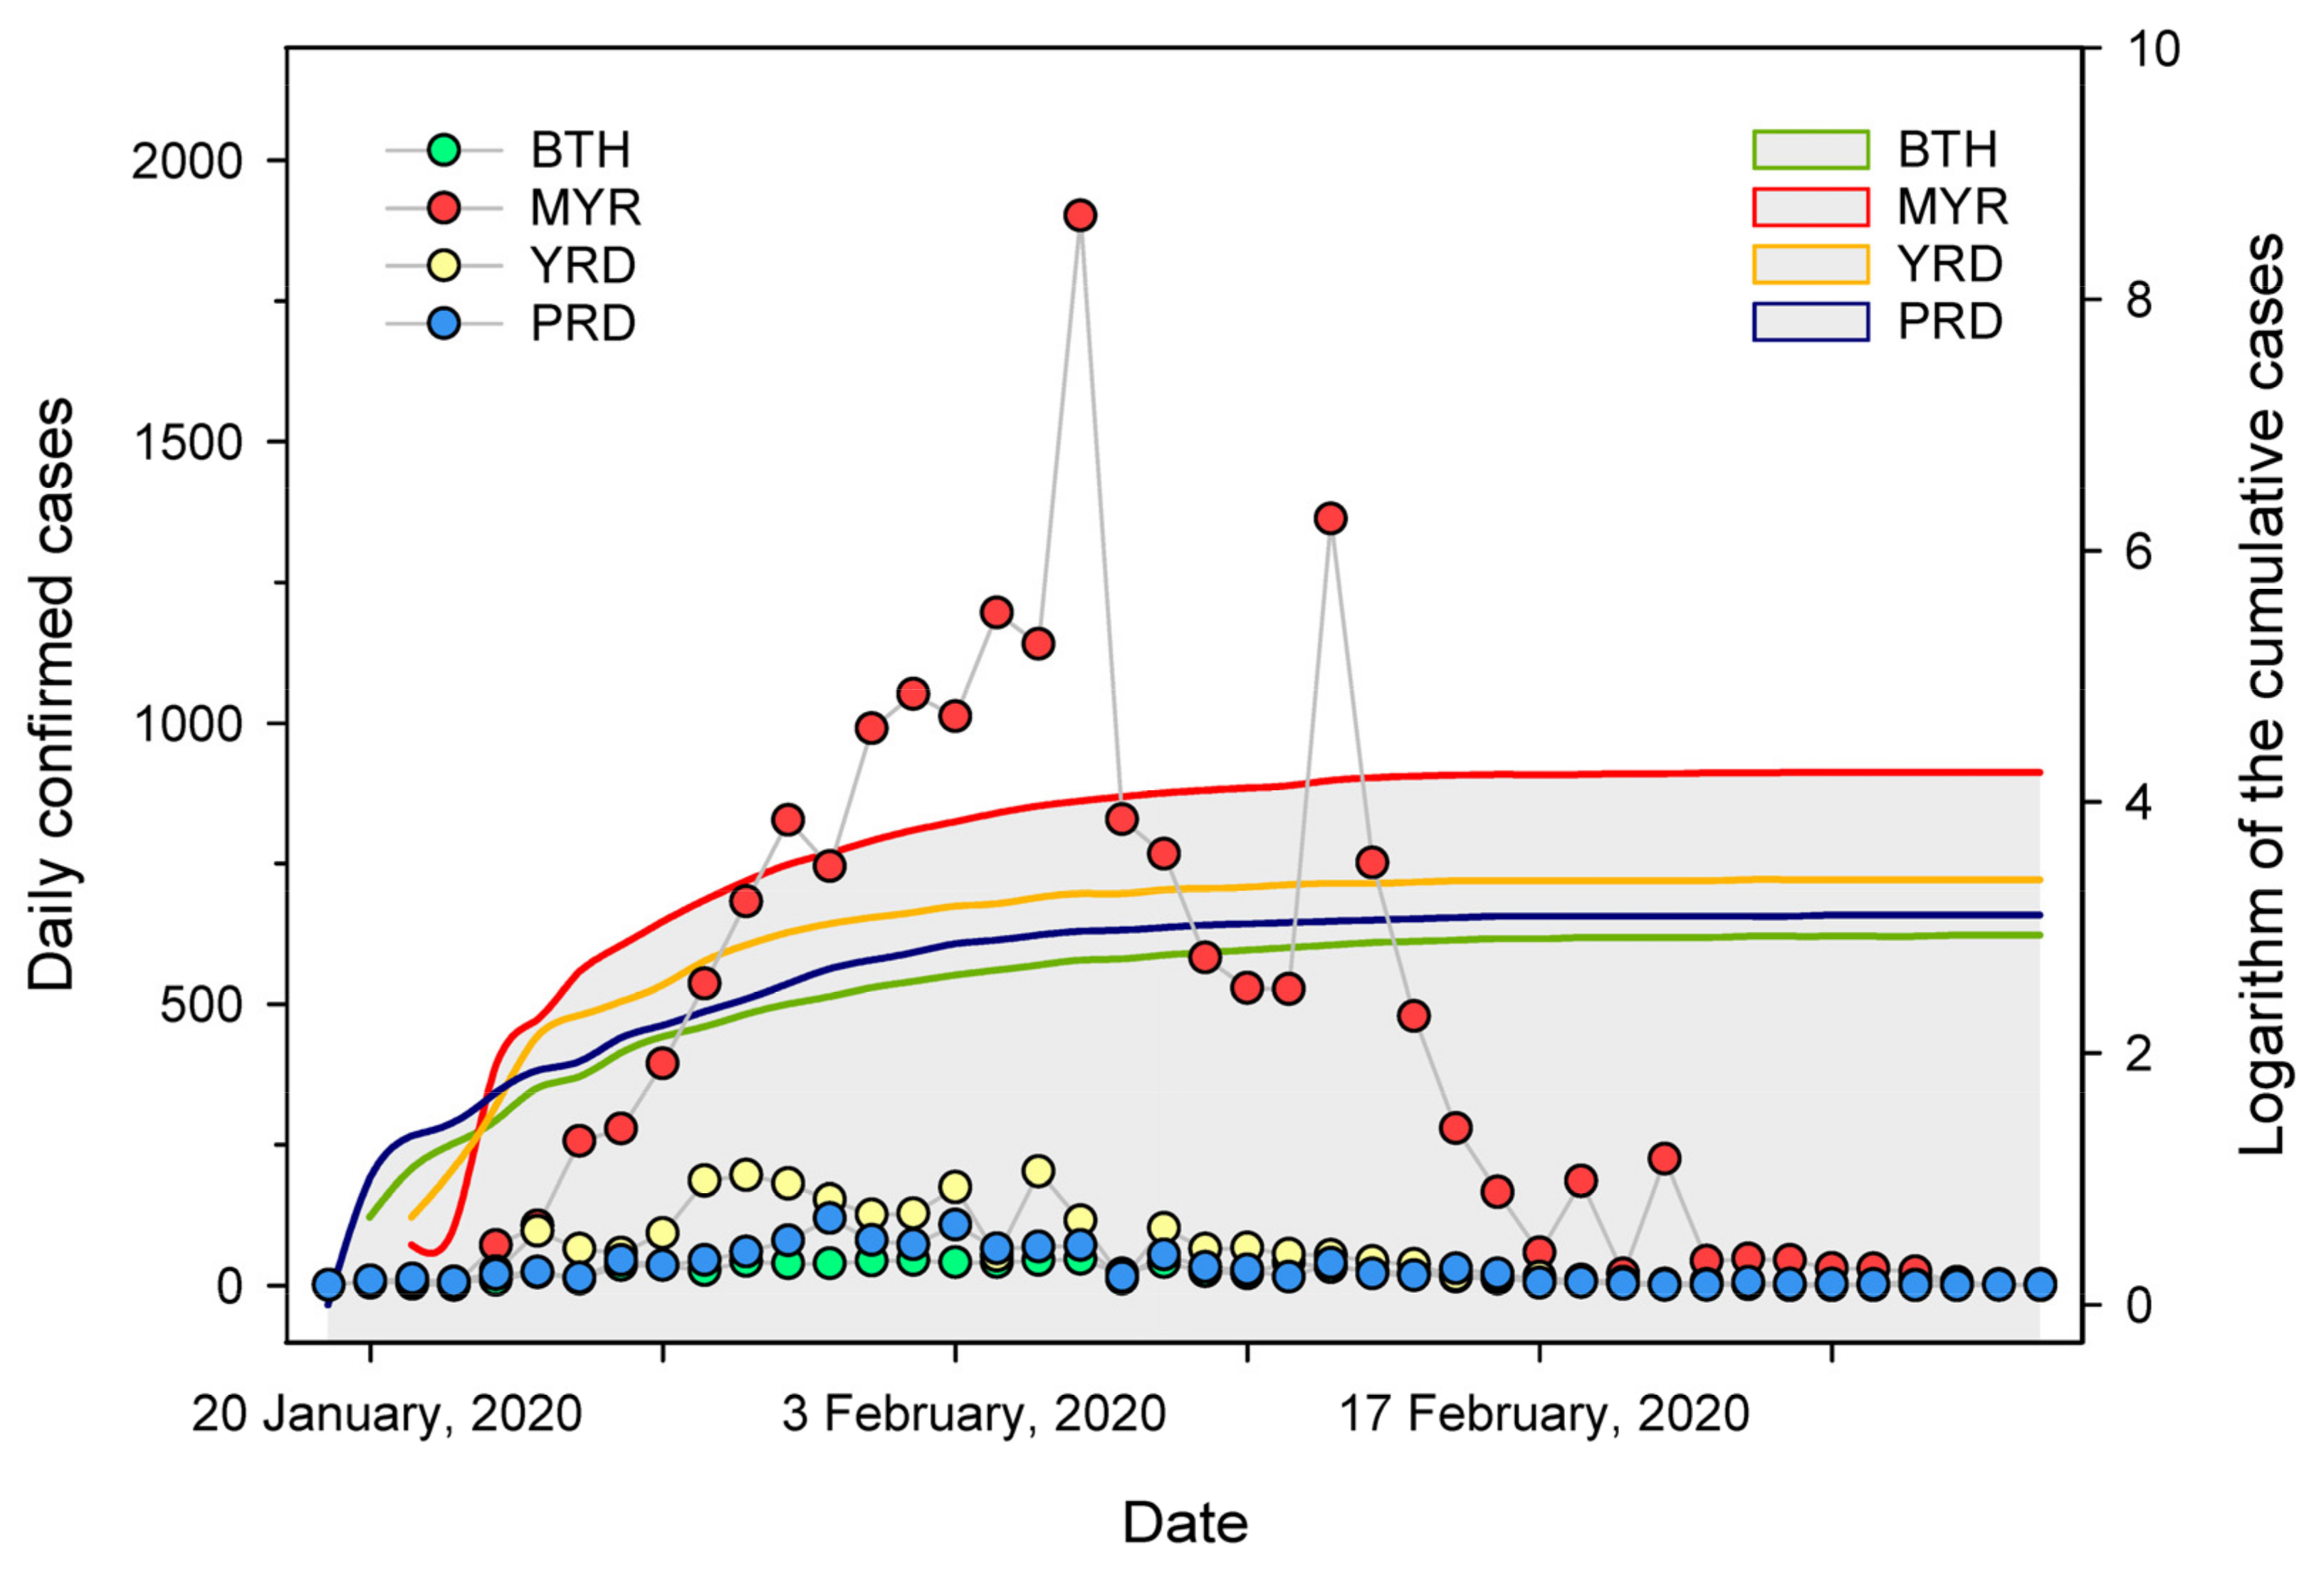
3.1. Description of SARS-CoV-2 Daily Infection Cases and Meteorological and Air Pollution Variables
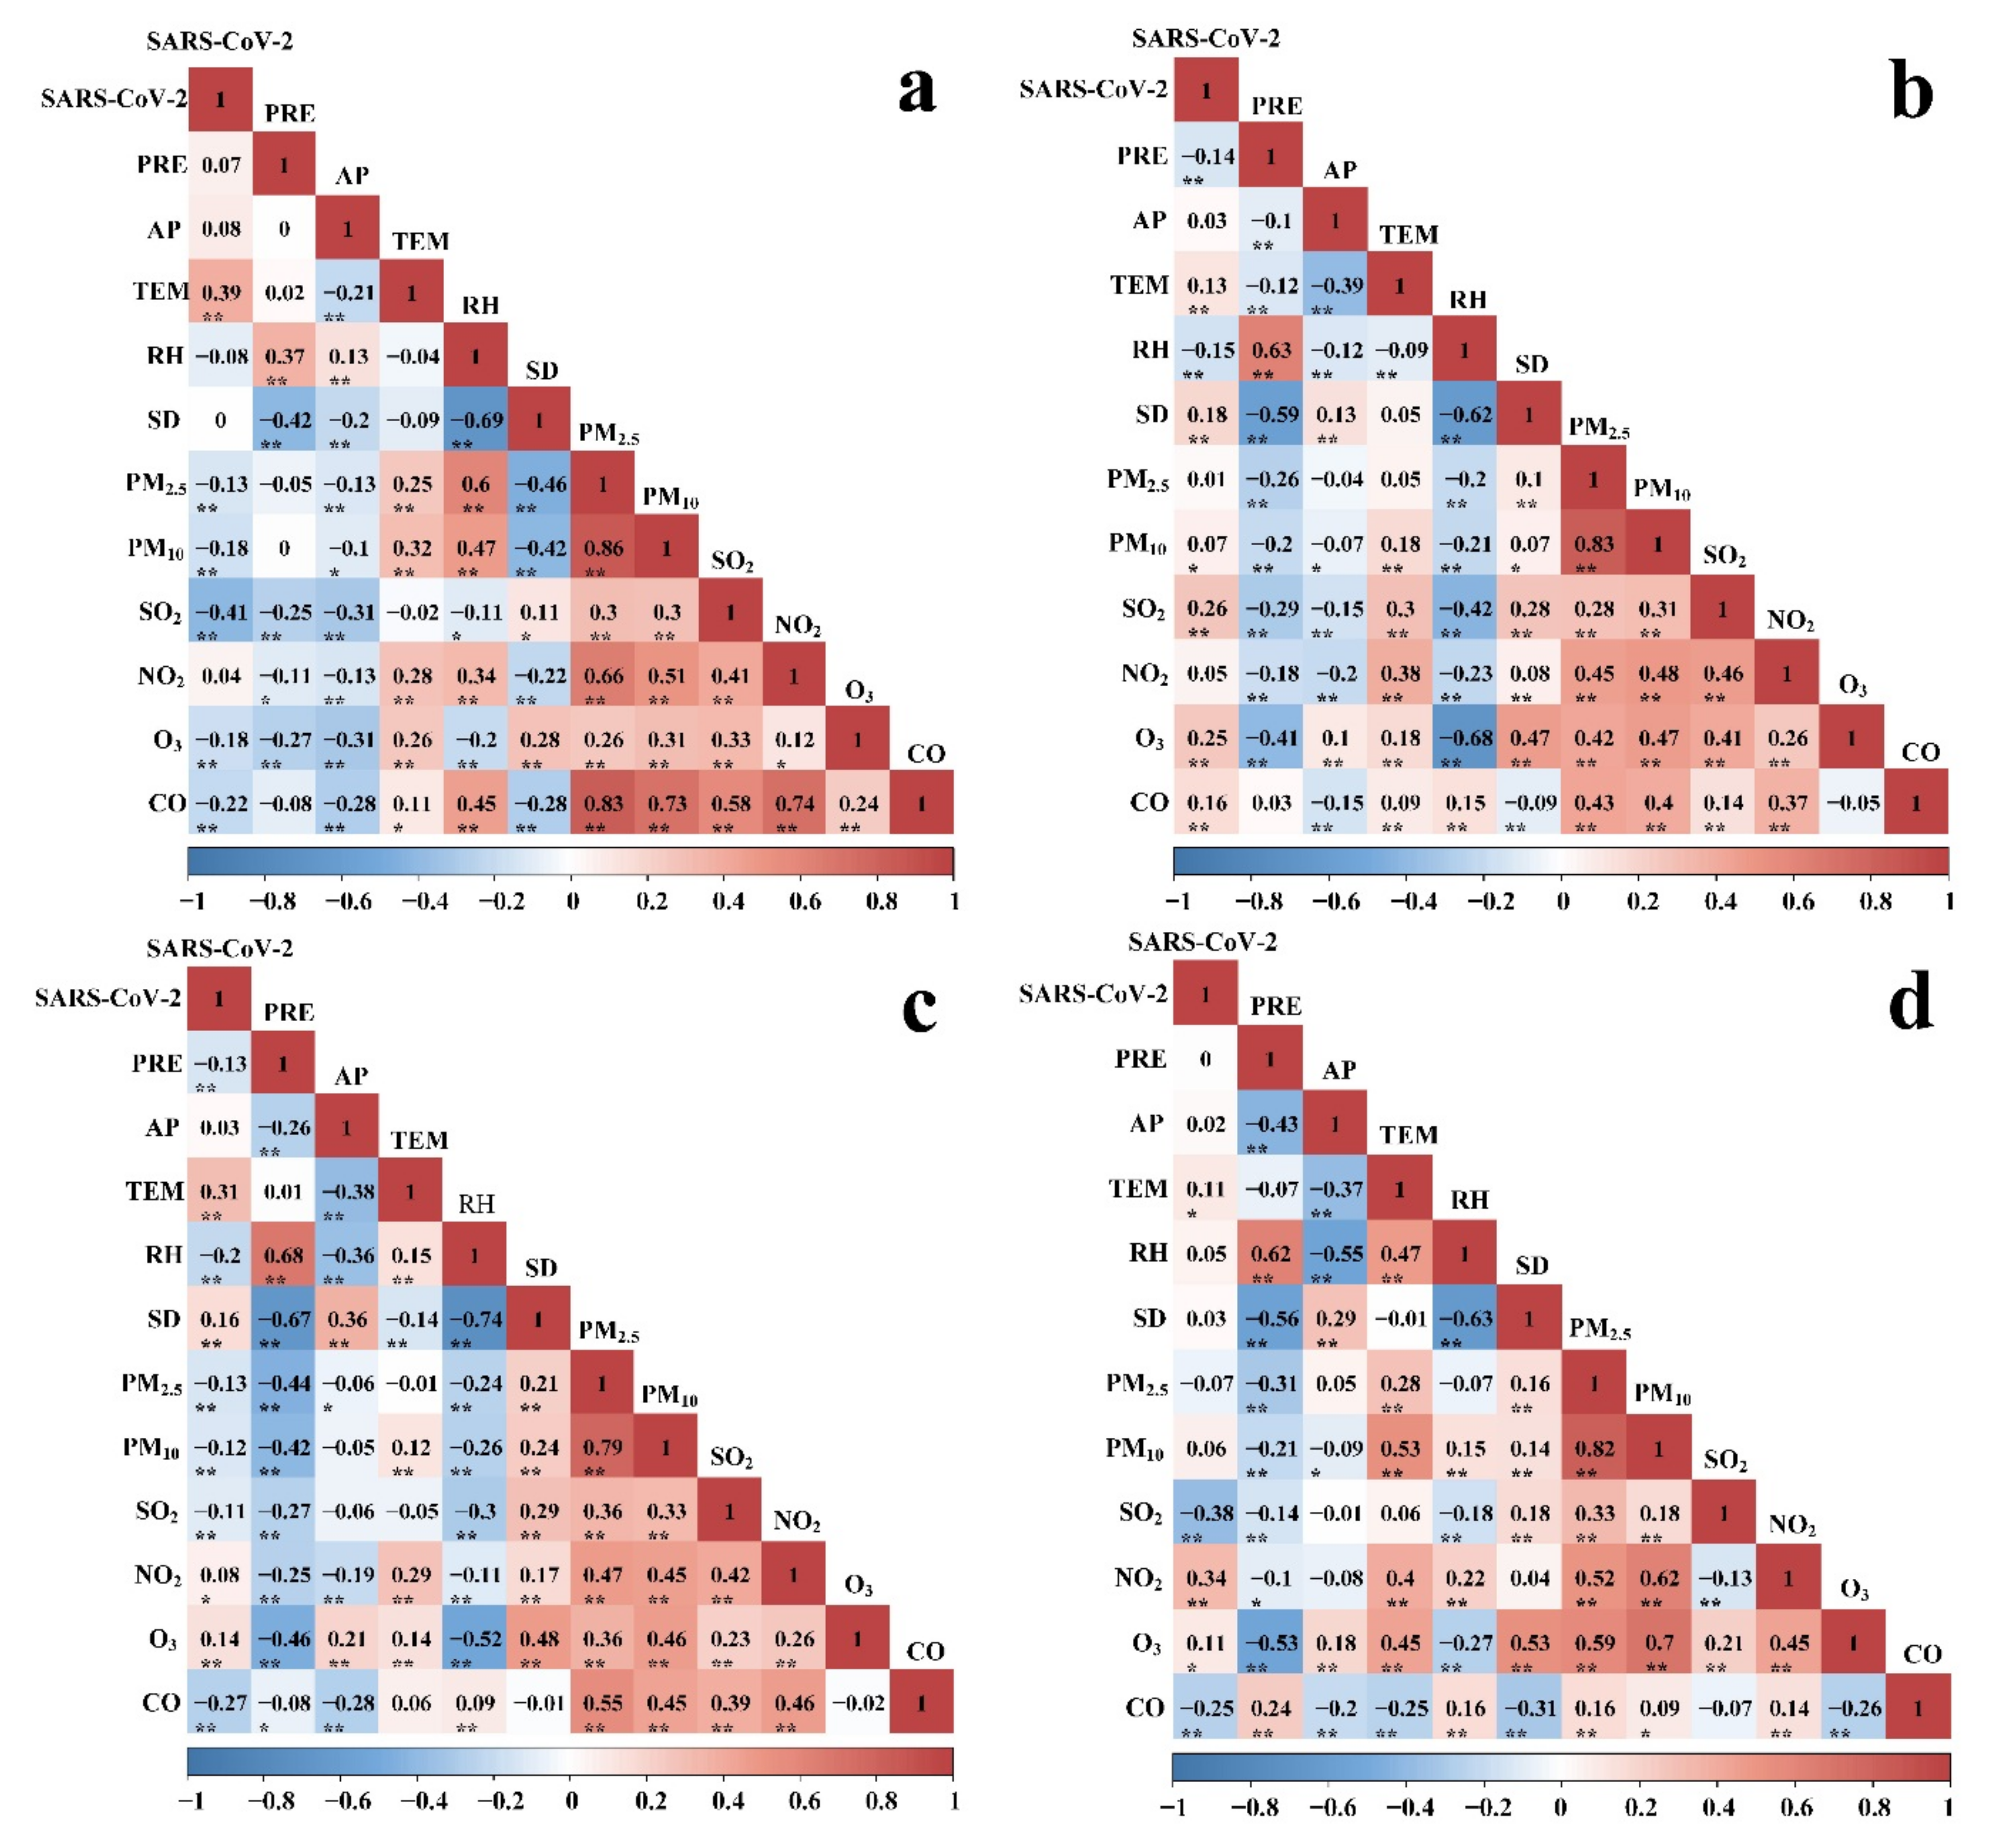
3.2. Correlation between SARS-CoV-2 Cases and Meteorological Variables and Air Pollution Variables
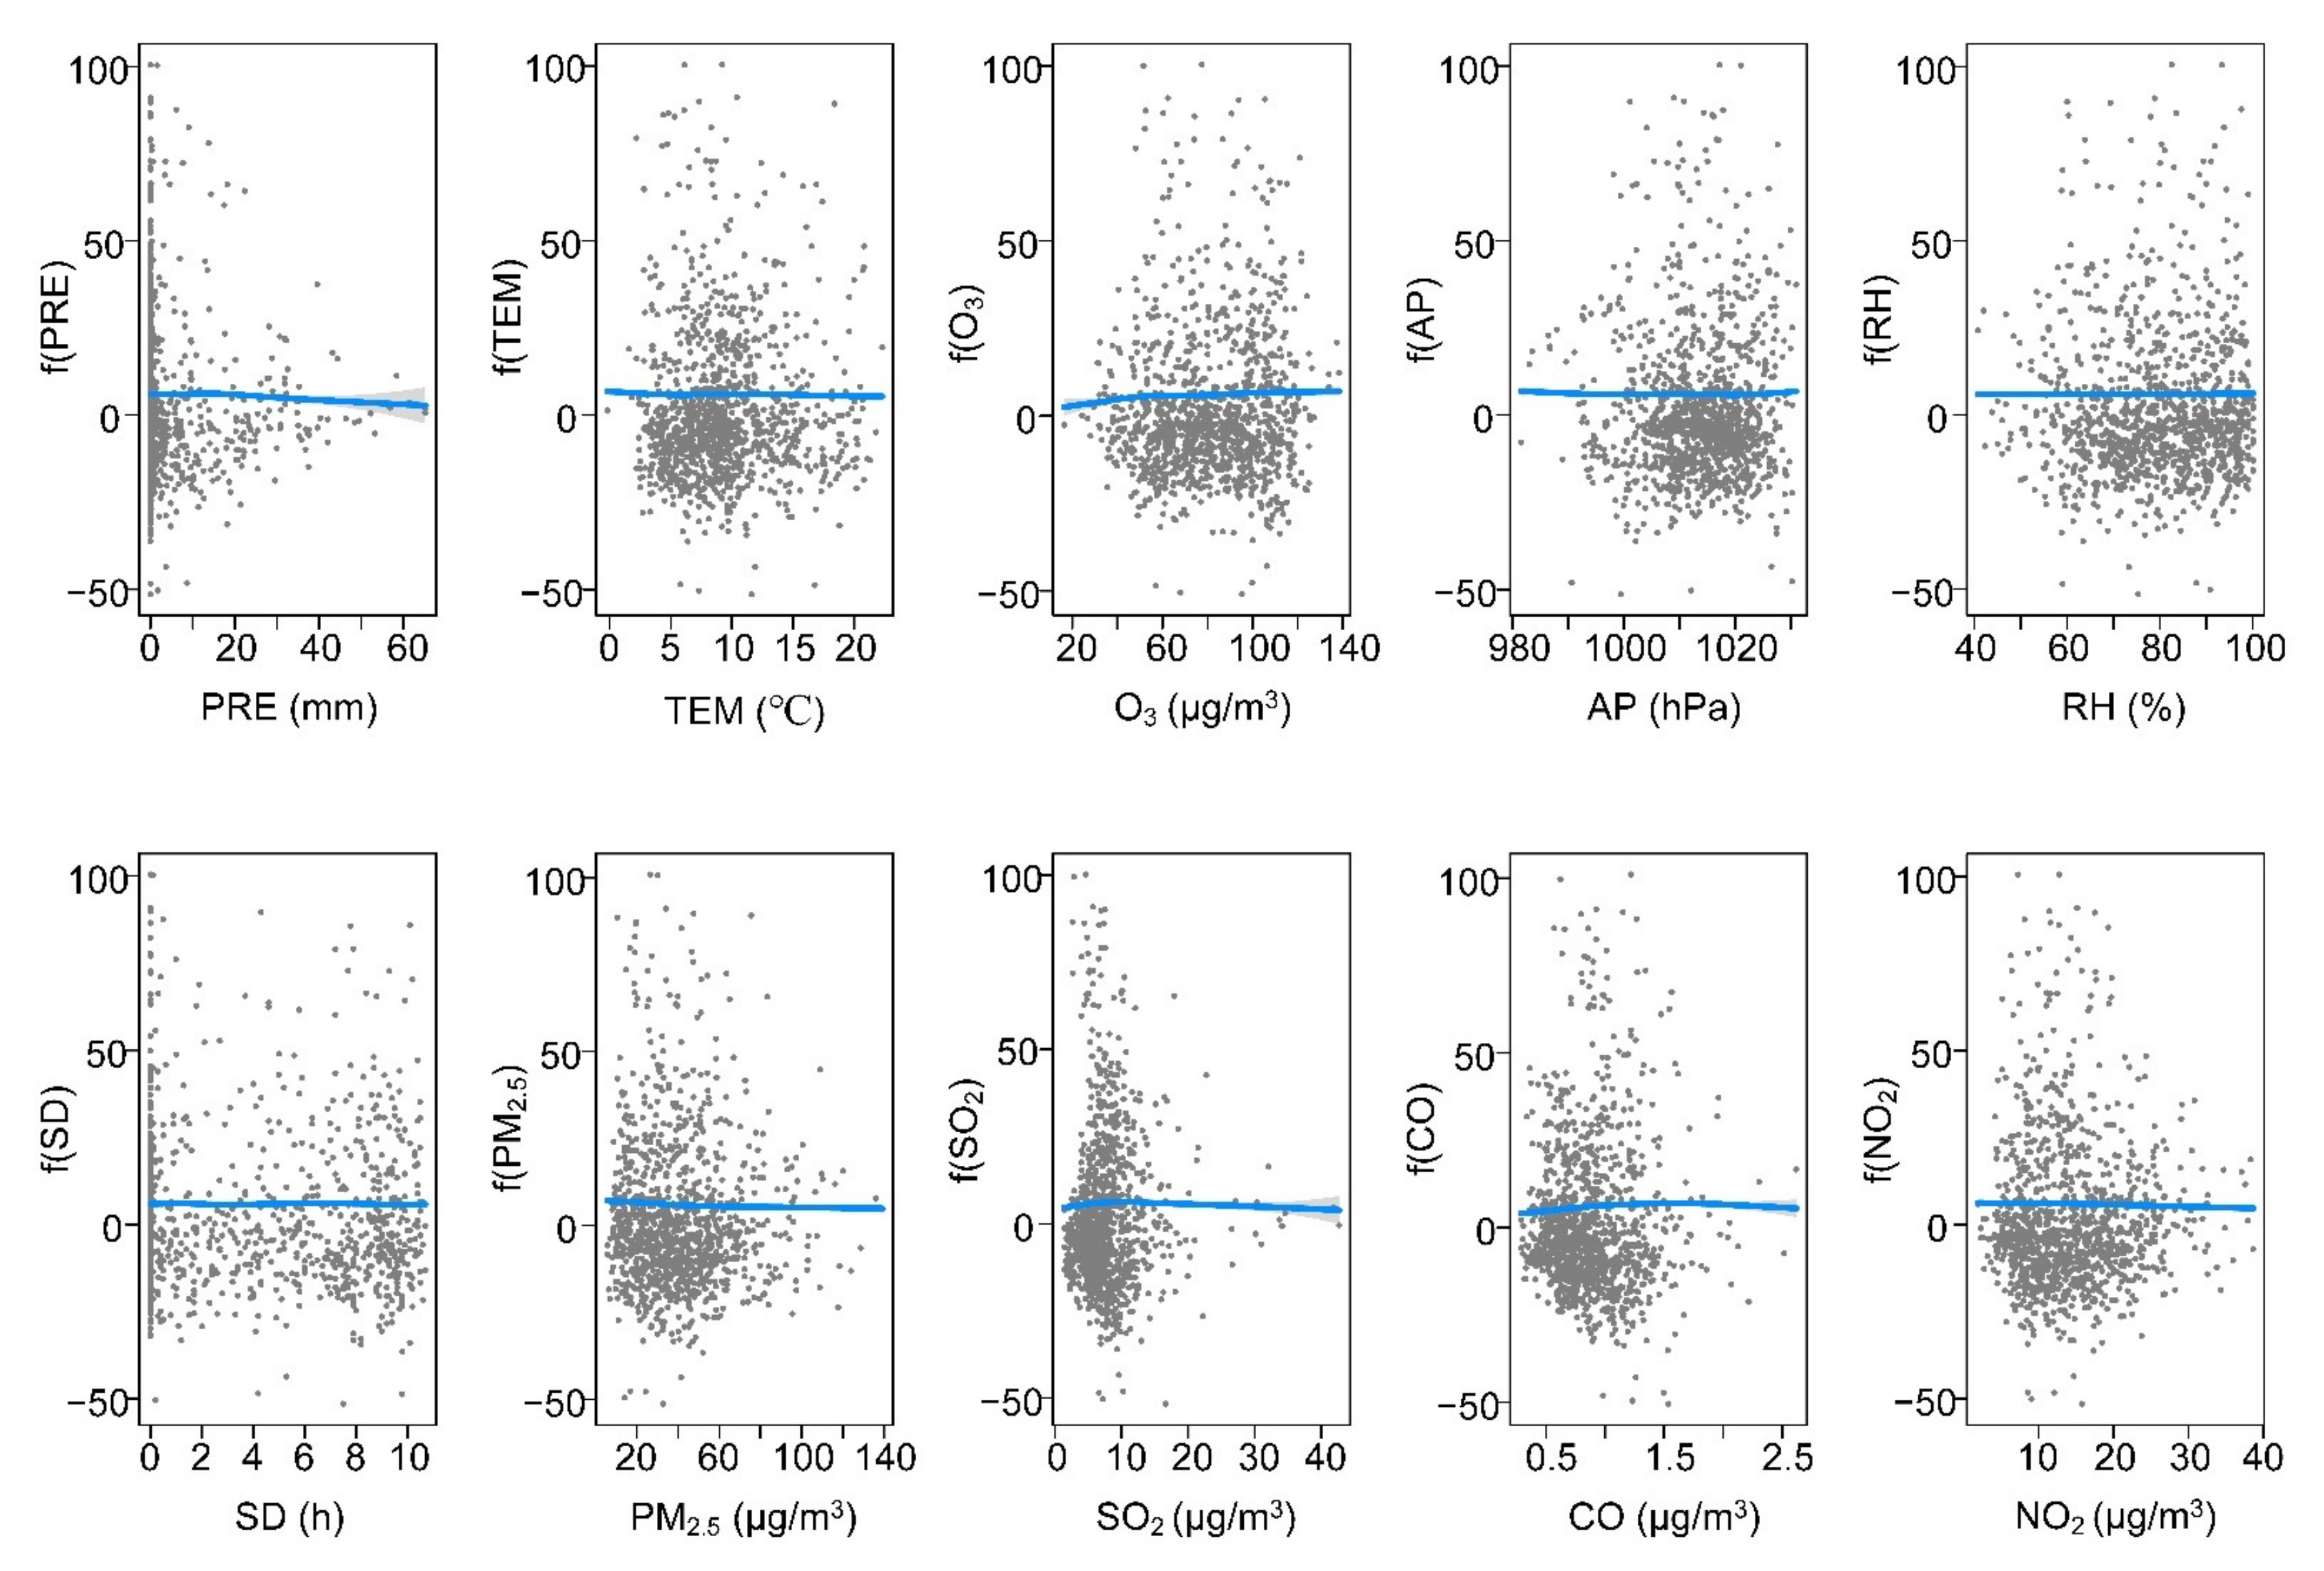
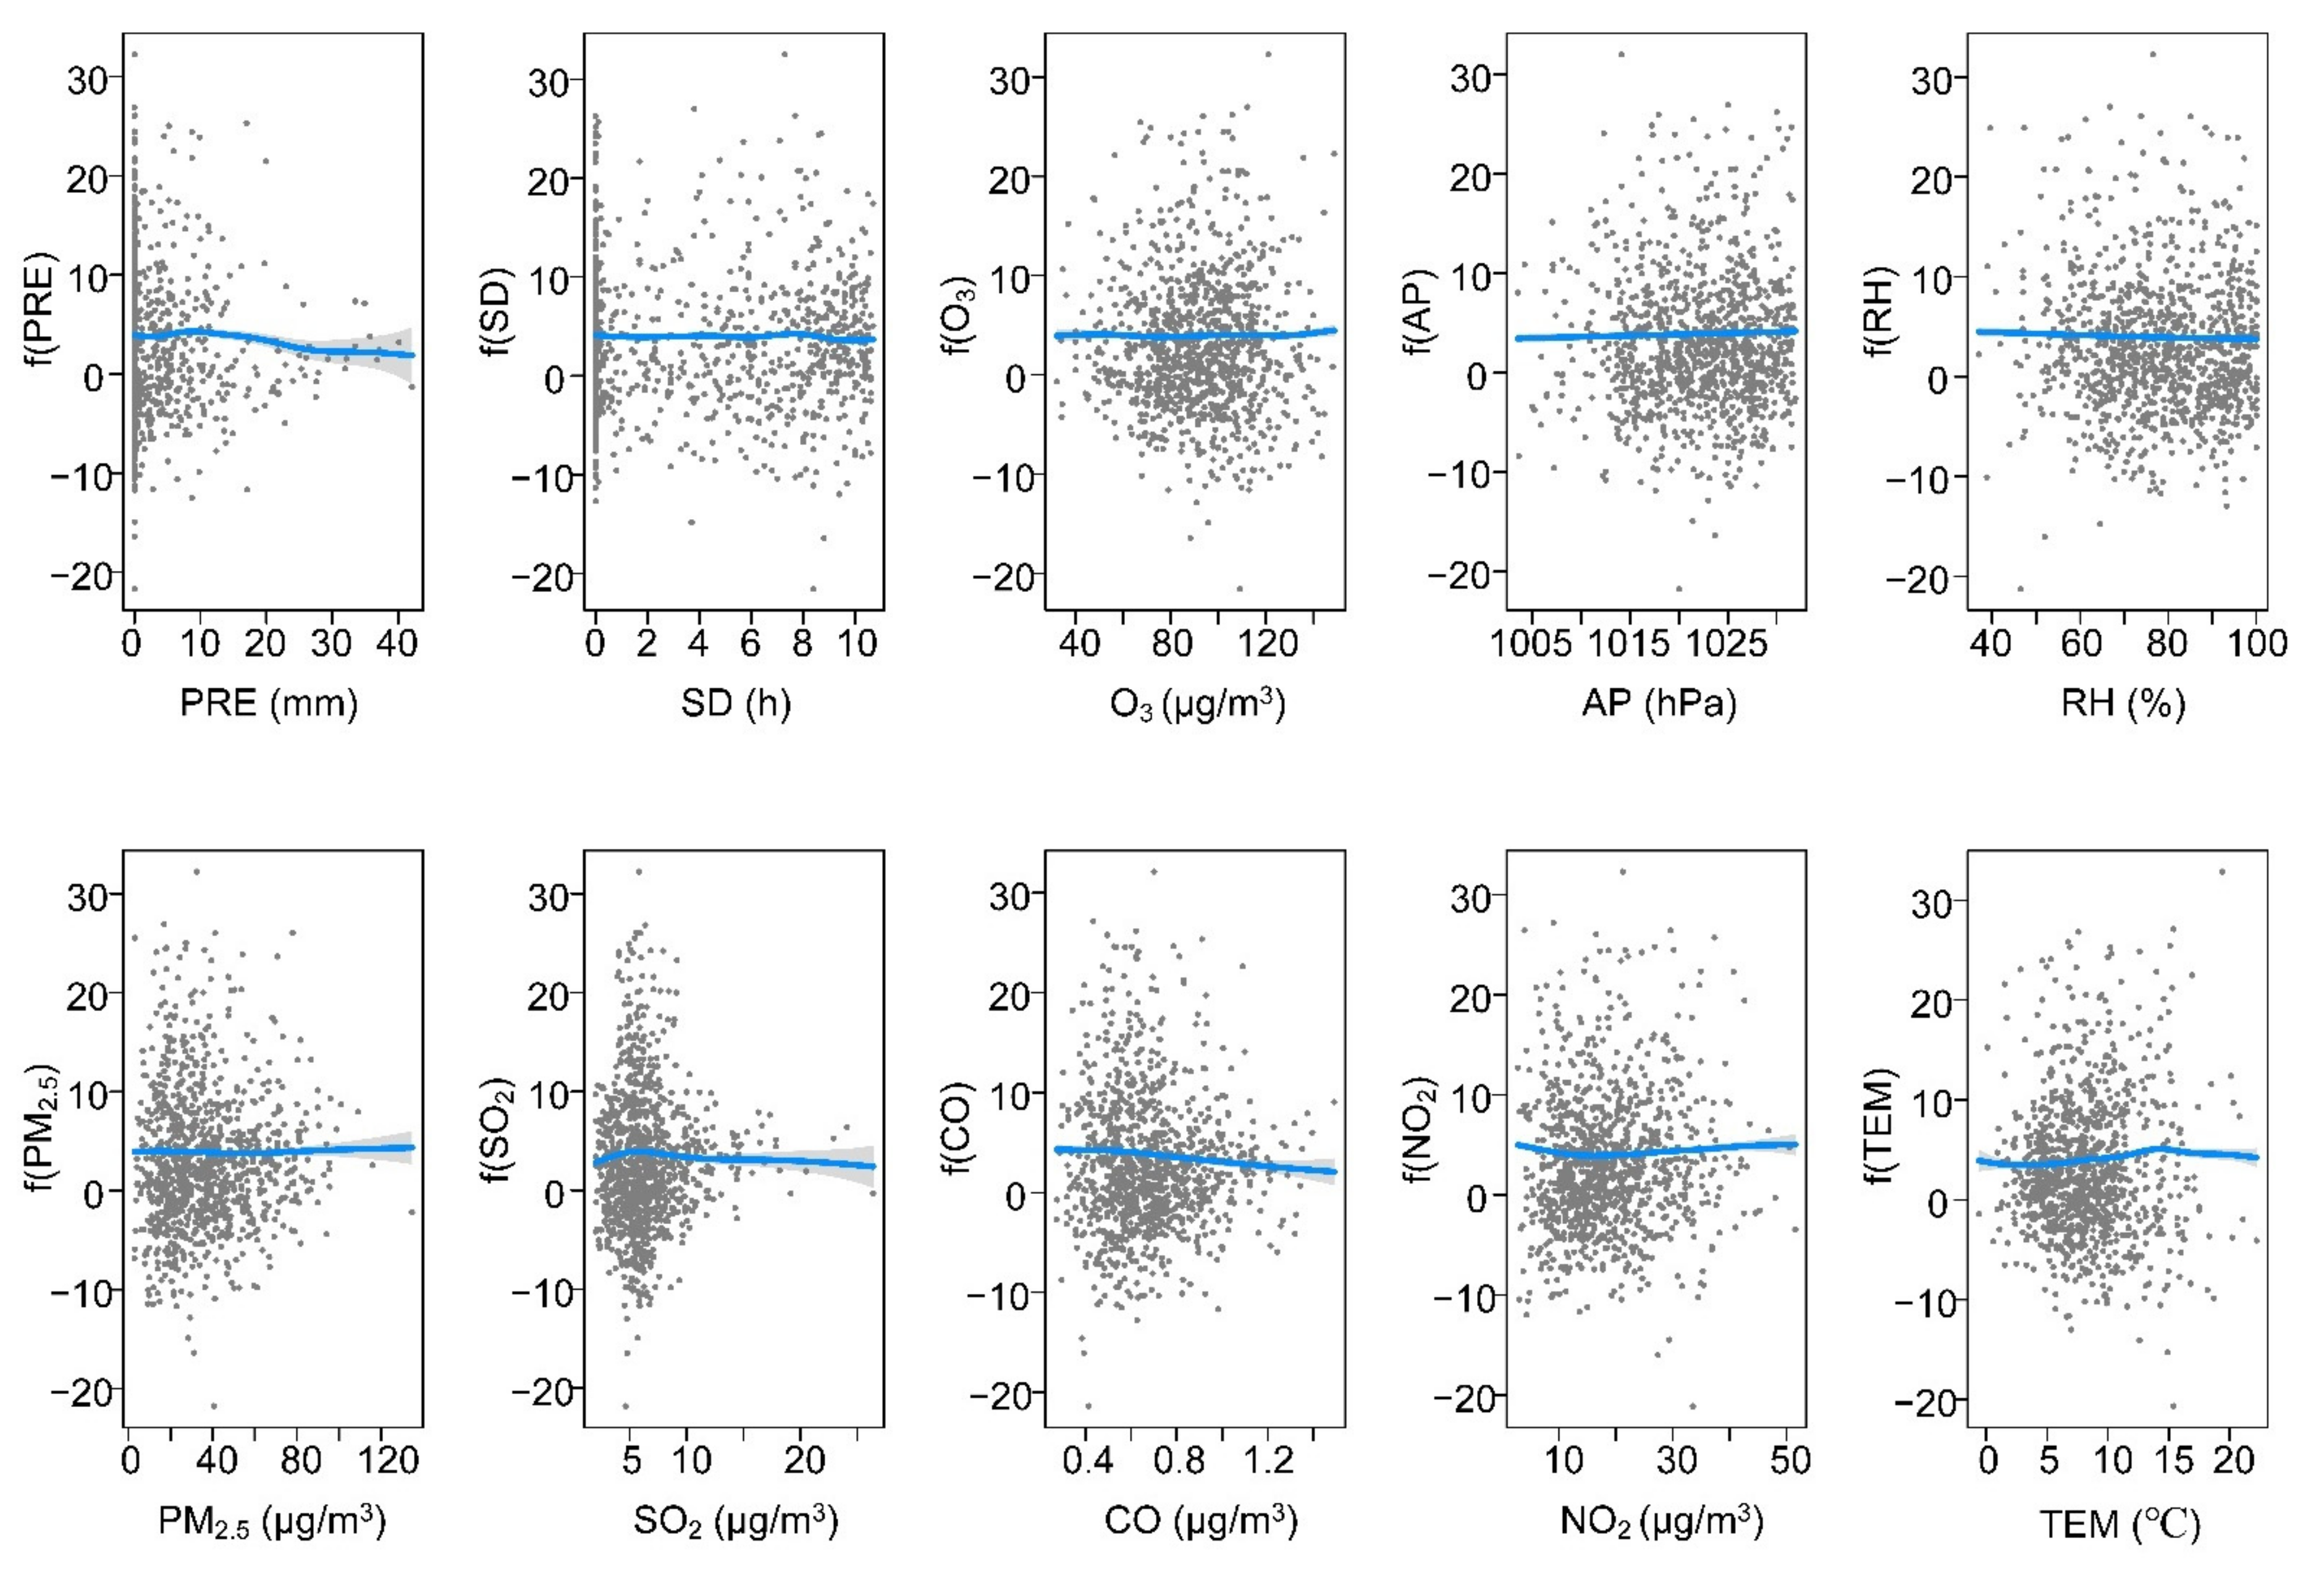
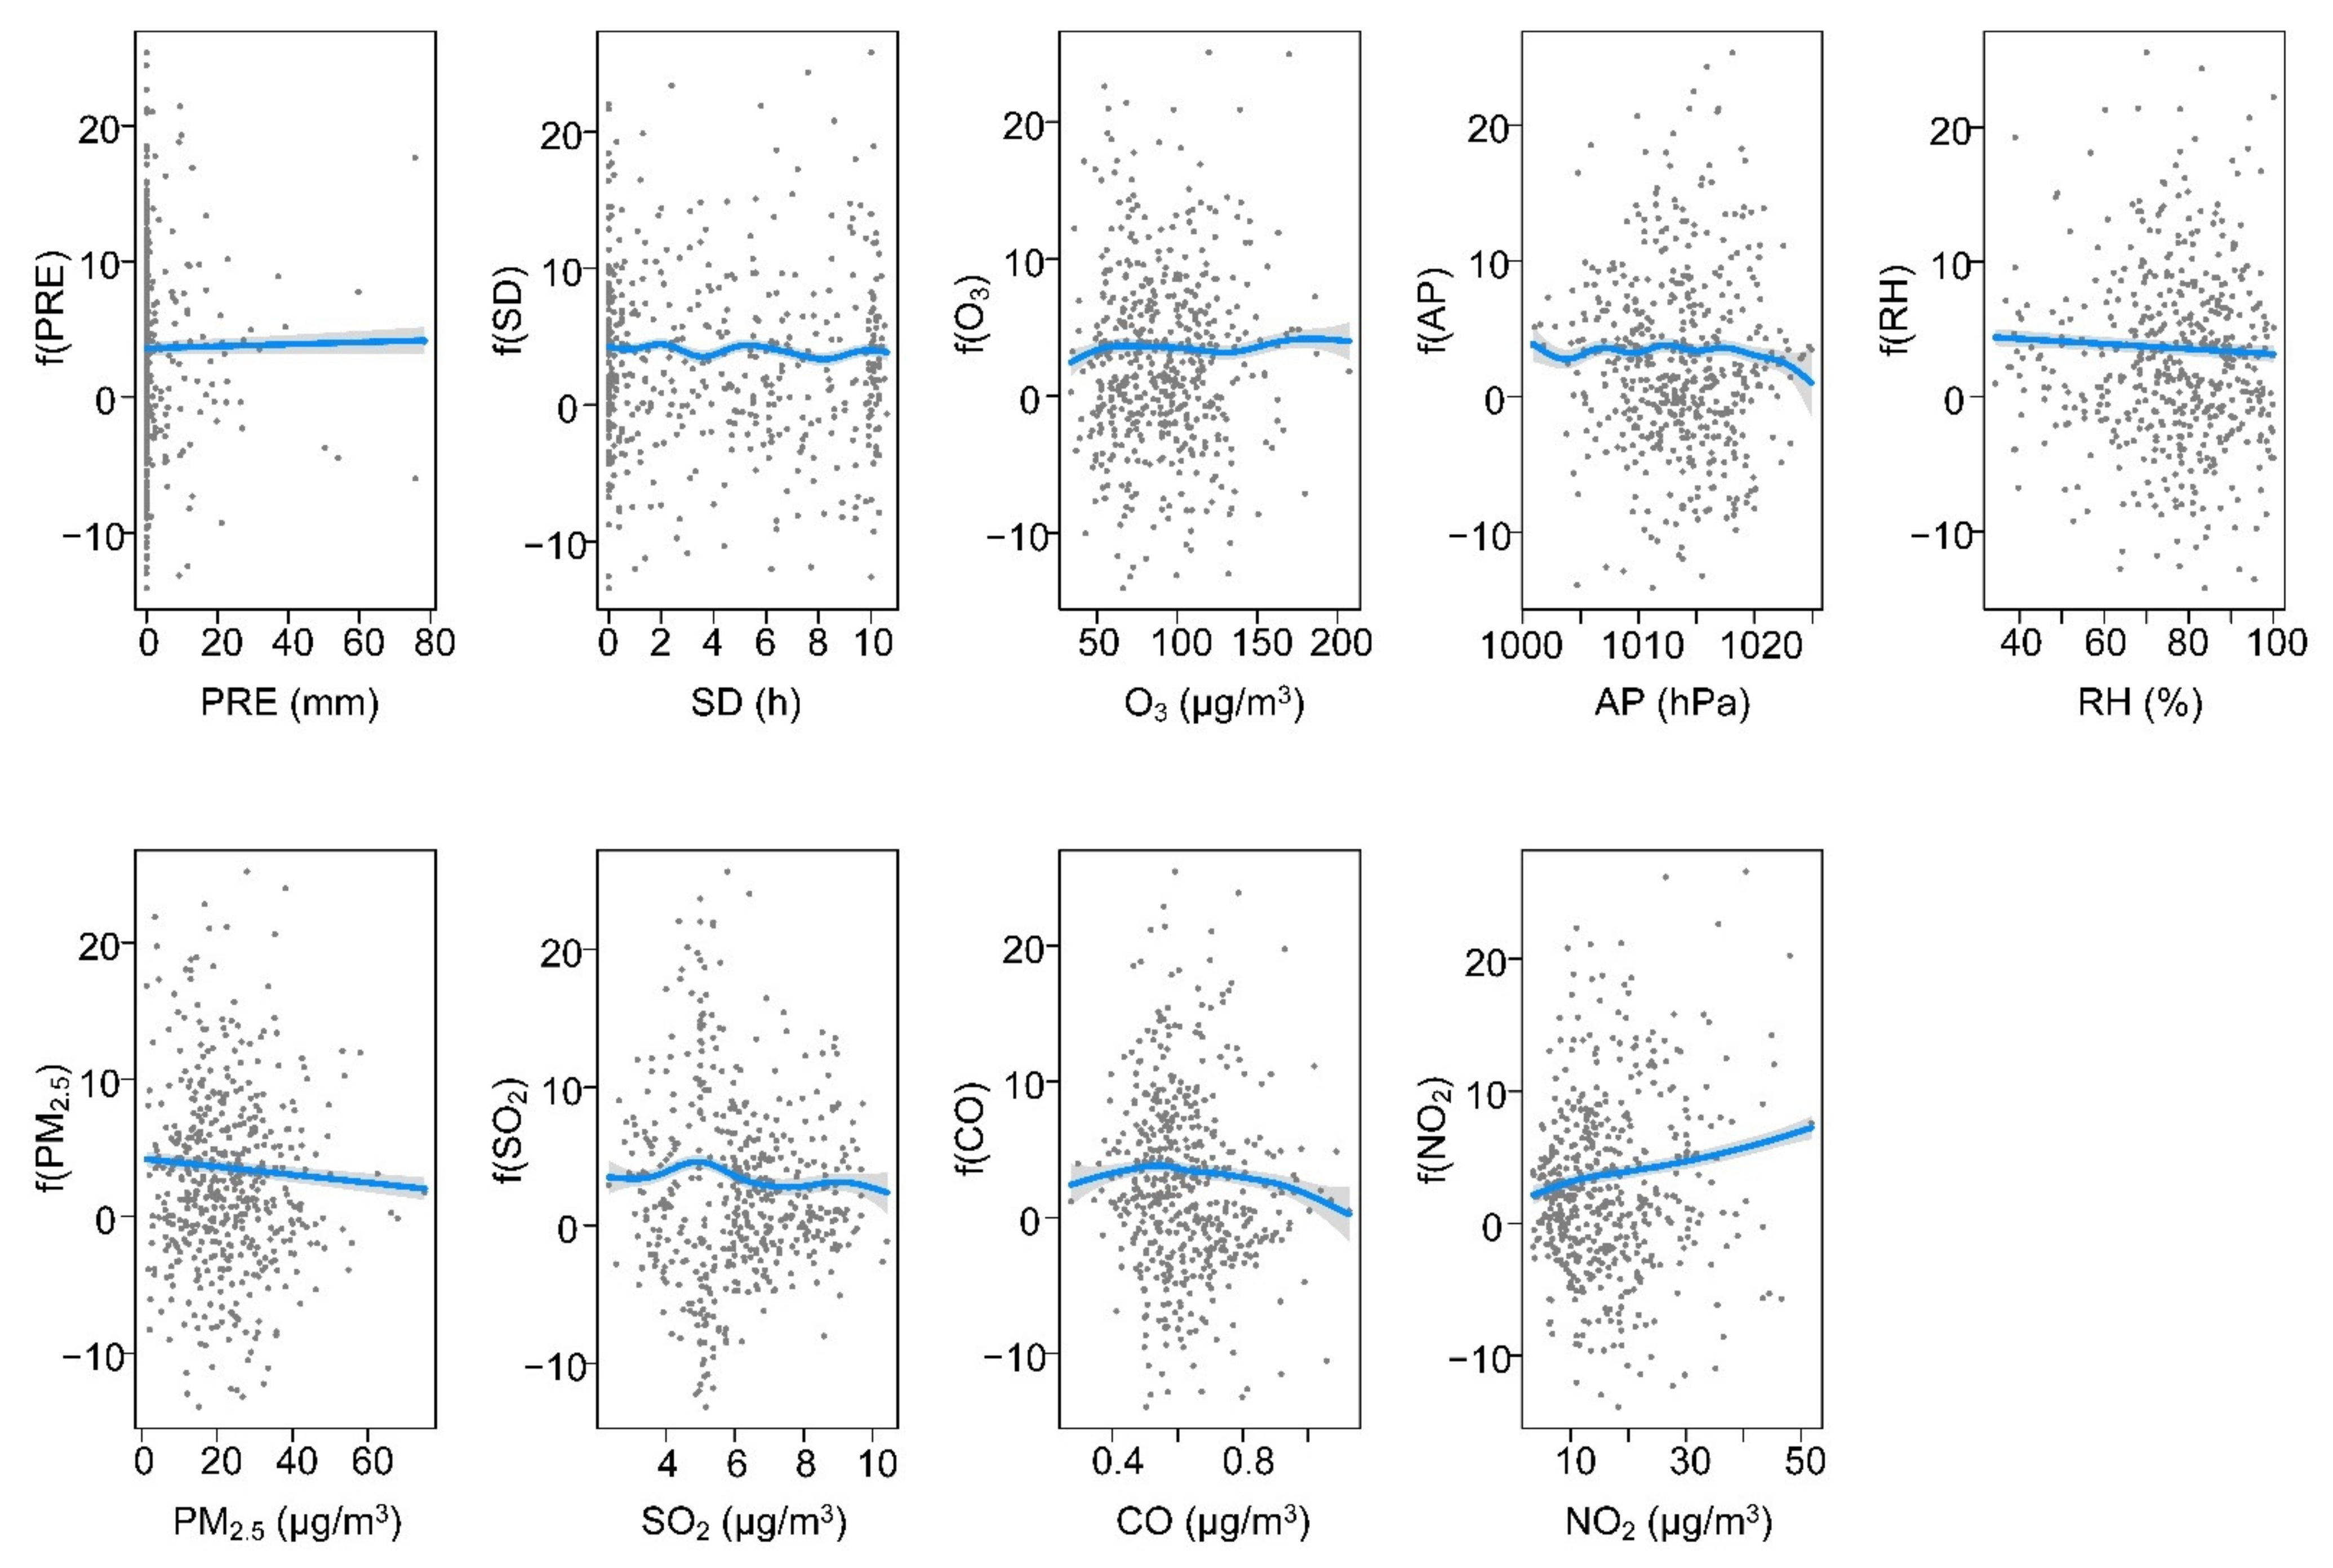
3.3. The Response of SARS-CoV-2 to Meteorological and Air Pollution Variables
4. Discussion
4.1. Effects of Meteorological and Air Pollution Variables on SARS-CoV-2 in Urban Agglomerations
4.2. Implications for the SARS-CoV-2 Control and Prevention
4.3. Limitations of the Present Study
5. Conclusions
Supplementary Materials
Author Contributions
Funding
Institutional Review Board Statement
Informed Consent Statement
Data Availability Statement
Conflicts of Interest
References
- Huang, C.; Wang, Y.; Li, X.; Ren, L.; Zhao, J.; Hu, Y.; Zhang, L.; Fan, G.; Xu, J.; Gu, X.; et al. Clinical features of patients infected with 2019 novel coronavirus in Wuhan, China. Lancet 2020, 395, 497–506. [Google Scholar] [CrossRef] [Green Version]
- Kanniah, K.D.; Kamarul Zaman NA, F.; Kaskaoutis, D.G.; Latif, M.T. COVID-19’s impact on the atmospheric environment in the Southeast Asia region. Sci. Total Environ. 2020, 736, 139658. [Google Scholar] [CrossRef]
- Chan, J.F.-W.; Yuan, S.; Kok, K.-H.; To, K.K.-W.; Chu, H.; Yang, J.; Xing, F.; Liu, J.; Yip, C.C.-Y.; Poon, R.W.-S.; et al. A familial cluster of pneumonia associated with the 2019 novel coronavirus indicating person-to-person transmission: A study of a family cluster. Lancet 2020, 395, 514–523. [Google Scholar] [CrossRef] [Green Version]
- Wang, L.; Zhang, S.; Yang, Z.; Zhao, Z.; Moudon, A.V.; Feng, H.; Liang, J.; Sun, W.; Cao, B. What county-level factors influence COVID-19 incidence in the United States? Findings from the first wave of the pandemic. Cities 2021, 118, 103396. [Google Scholar] [CrossRef] [PubMed]
- McCartney, G.; Pinto, J.; Liu, M. City resilience and recovery from COVID-19: The case of Macao. Cities 2021, 112, 103130. [Google Scholar] [CrossRef] [PubMed]
- Wang, B.; Liu, J.; Li, Y.; Fu, S.; Xu, X.; Li, L.; Zhou, J.; Liu, X.; He, X.; Yan, J.; et al. Airborne particulate matter, population mobility and COVID-19: A multi-city study in China. BMC Public Health 2020, 20, 1585. [Google Scholar] [CrossRef]
- Chen, B.; Liang, H.; Yuan, X.; Hu, Y.; Xu, M.; Zhao, Y.; Zhang, B.; Tian, F.; Zhu, X. Predicting the local COVID-19 outbreak around the world with meteorological conditions: A model-based qualitative study. BMJ Open 2020, 10, e041397. [Google Scholar] [CrossRef] [PubMed]
- Marazziti, D.; Cianconi, P.; Mucci, F.; Foresi, L.; Chiarantini, I.; Della Vecchia, A. Climate change, environment pollution, COVID-19 pandemic and mental health. Sci. Total Environ. 2021, 773, 145182. [Google Scholar] [CrossRef]
- Fu, X.; Li, L.; Lei, Y.; Wu, S.; Yan, D.; Luo, X.; Luo, H. The economic loss of health effect damages from PM2.5 pollution in the Central Plains Urban Agglomeration. Environ. Sci. Pollut. Res. Int. 2020, 27, 25434–25449. [Google Scholar] [CrossRef]
- Ravindra, K.; Rattan, P.; Mor, S.; Aggarwal, A.N. Generalized additive models: Building evidence of air pollution, climate change and human health. Environ. Int. 2019, 132, 104987. [Google Scholar] [CrossRef]
- Frumkin, H.; McMichael, A.J.; Hess, J.J. Climate change and the health of the public. Am. J. Prev. Med. 2008, 35, 401–402. [Google Scholar] [CrossRef] [PubMed]
- Hu, W.; Mengersen, K.; McMichael, A.; Tong, S. Temperature, air pollution and total mortality during summers in Sydney, 1994–2004. Int. J. Biometeorol. 2008, 52, 689–696. [Google Scholar] [CrossRef] [PubMed]
- Biktasheva, I.V. Role of a habitat’s air humidity in Covid-19 mortality. Sci. Total Environ. 2020, 736, 138763. [Google Scholar] [CrossRef]
- Huang, Z.; Huang, J.; Gu, Q.; Du, P.; Liang, H.; Dong, Q. Optimal temperature zone for the dispersal of COVID-19. Sci. Total Environ. 2020, 736, 139487. [Google Scholar] [CrossRef] [PubMed]
- Roviello, V.; Roviello, G.N. Less COVID-19 deaths in southern and insular Italy explained by forest bathing, Mediterranean environment, and antiviral plant volatile organic compounds. Environ. Chem. Lett. 2021, 1–11. [Google Scholar] [CrossRef]
- Xie, J.; Zhu, Y. Association between ambient temperature and COVID-19 infection in 122 cities from China. Sci. Total Environ. 2020, 724, 138201. [Google Scholar] [CrossRef]
- He, G.; Pan, Y.; Tanaka, T. The short-term impacts of COVID-19 lockdown on urban air pollution in China. Nat. Sustain. 2020, 3, 1005–1011. [Google Scholar] [CrossRef]
- Mandal, I.; Pal, S. COVID-19 pandemic persuaded lockdown effects on environment over stone quarrying and crushing areas. Sci. Total Environ. 2020, 732, 139281. [Google Scholar] [CrossRef]
- Feng, C.; Li, J.; Sun, W.; Zhang, Y.; Wang, Q. Impact of ambient fine particulate matter (PM2.5) exposure on the risk of influenza-like-illness: A time-series analysis in Beijing, China. Environ. Health 2016, 15, 17. [Google Scholar] [CrossRef] [Green Version]
- Damialis, A.; Gilles, S.; Sofiev, M.; Sofieva, V.; Kolek, F.; Bayr, D.; Plaza, M.P.; Leier-Wirtz, V.; Kaschuba, S.; Ziska, L.H.; et al. Higher airborne pollen concentrations correlated with increased SARS-CoV-2 infection rates, as evidenced from 31 countries across the globe. Proc. Natl. Acad. Sci. USA 2021, 118, e2019034118. [Google Scholar] [CrossRef]
- Yang, Y.; Qi, W.; Ma, L.; Liu, Y. Spatial optimization strategies of population function in China’s world-class urban agglomerations during 14th five-year plan period. Bull. Chin. Acad. Sci. 2020, 35, 835–843. [Google Scholar]
- Zhang, C.; Wang, C.; Chen, C.; Tao, L.; Jin, J.; Wang, Z.; Jia, B. Effects of tree canopy on psychological distress: A repeated cross-sectional study before and during the COVID-19 epidemic. Environ. Res. 2022, 203, 111795. [Google Scholar] [CrossRef]
- Ma, Y.; Zhao, Y.; Liu, J.; He, X.; Wang, B.; Fu, S.; Yan, J.; Niu, J.; Zhou, J.; Luo, B. Effects of temperature variation and humidity on the death of COVID-19 in Wuhan, China. Sci. Total Environ. 2020, 724, 138226. [Google Scholar] [CrossRef] [PubMed]
- Hoang, T.; Tran, T.T.A. Ambient air pollution, meteorology, and COVID-19 infection in Korea. J. Med. Virol. 2021, 93, 878–885. [Google Scholar] [CrossRef]
- Ceylan, Z. Insights into the relationship between weather parameters and COVID-19 outbreak in Lombardy, Italy. Int. J. Healthc. Manag. 2020, 14, 255–263. [Google Scholar] [CrossRef]
- Everard, M.; Johnston, P.; Santillo, D.; Staddon, C. The role of ecosystems in mitigation and management of Covid-19 and other zoonoses. Environ. Sci. Policy 2020, 111, 7–17. [Google Scholar] [CrossRef] [PubMed]
- Gao, C.; Li, S.; Liu, M.; Zhang, F.; Achal, V.; Tu, Y.; Zhang, S.; Cai, C. Impact of the COVID-19 pandemic on air pollution in Chinese megacities from the perspective of traffic volume and meteorological factors. Sci. Total Environ. 2021, 773, 145545. [Google Scholar] [CrossRef]
- Coccia, M. Preparedness of countries to face COVID-19 pandemic crisis: Strategic positioning and factors supporting effective strategies of prevention of pandemic threats. Environ. Res. 2022, 203, 111678. [Google Scholar] [CrossRef]
- Bi, P.; Wang, J.; Hiller, J.E. Weather: Driving force behind the transmission of severe acute respiratory syndrome in China? Intern. Med. J. 2007, 37, 550–554. [Google Scholar] [CrossRef]
- Casanova, L.M.; Jeon, S.; Rutala, W.A.; Weber, D.J.; Sobsey, M.D. Effects of Air Temperature and Relative Humidity on Coronavirus Survival on Surfaces. Appl. Environ. Microbiol. 2010, 76, 2712–2717. [Google Scholar] [CrossRef] [Green Version]
- Zhu, Y.; Xie, J.; Huang, F.; Cao, L. Association between short-term exposure to air pollution and COVID-19 infection: Evidence from China. Sci. Total Environ. 2020, 727, 138704. [Google Scholar] [CrossRef] [PubMed]
- Xu, Z.; Shi, L.; Wang, Y.; Zhang, J.; Huang, L.; Zhang, C.; Liu, S.; Zhao, P.; Liu, H.; Zhu, L.; et al. Pathological findings of COVID-19 associated with acute respiratory distress syndrome. Lancet Respir. Med. 2020, 8, 420–422. [Google Scholar] [CrossRef]
- Sobral MF, F.; Duarte, G.B.; da Penha Sobral AI, G.; Marinho ML, M.; de Souza Melo, A. Association between climate variables and global transmission oF SARS-CoV-2. Sci. Total Environ. 2020, 729, 138997. [Google Scholar] [CrossRef] [PubMed]
- Wang, Z.; Zhao, J.; Niu, Z.; Qi, P. Influence of air pollution on the outpatient volume of cardiovascular and cerebrovascular diseases using the poisson generalized additive models in Weifang. Chin. J. Health Stat. 2017, 34, 232–235. [Google Scholar]
- Isaia, G.; Diémoz, H.; Maluta, F.; Fountoulakis, I.; Ceccon, D.; di Sarra, A.; Facta, S.; Fedele, F.; Lorenzetto, G.; Siani, A.M.; et al. Does solar ultraviolet radiation play a role in COVID-19 infection and deaths? An environmental ecological study in Italy. Sci. Total Environ. 2021, 757, 143757. [Google Scholar] [CrossRef] [PubMed]
- Sun, S.; Xie, Z.; Yu, K.; Jiang, B.; Zheng, S.; Pan, X. COVID-19 and healthcare system in China: Challenges and progression for a sustainable future. Glob. Health 2021, 17, 14. [Google Scholar] [CrossRef]


| AP | RH | SD | PRE | TEM | SO2 | CO | NO2 | O3 | PM2.5 | Deviance Explained (%) | ||
|---|---|---|---|---|---|---|---|---|---|---|---|---|
| BTH | edf | 5.08 | 8.24 | 5.99 | 1.78 | 1 | 7.14 | 5.65 | 5.83 | 5.07 | 5.53 | 75.4 |
| p | <0.001 | <0.001 | <0.001 | 0.06 | 0.08 | <0.001 | <0.01 | <0.001 | <0.001 | 0.07 | ||
| MYR | edf | 5.34 | 1.68 | 6.02 | 3.81 | 4.74 | 4.5 | 4.27 | 2.26 | 5.33 | 3.18 | 35.2 |
| p | 0.02 | 0.4 | 0.48 | <0.01 | 0.04 | <0.001 | <0.001 | <0.001 | <0.001 | <0.001 | ||
| YRD | edf | 1 | 1.57 | 6.93 | 5.73 | 7.47 | 4.92 | 3.31 | 4.94 | 5.82 | 3.13 | 45.6 |
| p | <0.001 | <0.01 | <0.001 | <0.001 | <0.001 | <0.001 | <0.001 | <0.001 | 0.17 | 0.3 | ||
| PRD | edf | 8.4 | 1 | 8.27 | 1 | - | 6.59 | 5.48 | 4.58 | 6.49 | 1 | 62.2 |
| p | <0.001 | <0.001 | <0.001 | 0.15 | <0.001 | <0.001 | <0.001 | <0.001 | <0.001 |
Publisher’s Note: MDPI stays neutral with regard to jurisdictional claims in published maps and institutional affiliations. |
© 2022 by the authors. Licensee MDPI, Basel, Switzerland. This article is an open access article distributed under the terms and conditions of the Creative Commons Attribution (CC BY) license (https://creativecommons.org/licenses/by/4.0/).
Share and Cite
Zhao, M.; Liu, Y.; Gyilbag, A. Assessment of Meteorological Variables and Air Pollution Affecting COVID-19 Cases in Urban Agglomerations: Evidence from China. Int. J. Environ. Res. Public Health 2022, 19, 531. https://doi.org/10.3390/ijerph19010531
Zhao M, Liu Y, Gyilbag A. Assessment of Meteorological Variables and Air Pollution Affecting COVID-19 Cases in Urban Agglomerations: Evidence from China. International Journal of Environmental Research and Public Health. 2022; 19(1):531. https://doi.org/10.3390/ijerph19010531
Chicago/Turabian StyleZhao, Mingyue, Yuanxin Liu, and Amatus Gyilbag. 2022. "Assessment of Meteorological Variables and Air Pollution Affecting COVID-19 Cases in Urban Agglomerations: Evidence from China" International Journal of Environmental Research and Public Health 19, no. 1: 531. https://doi.org/10.3390/ijerph19010531
APA StyleZhao, M., Liu, Y., & Gyilbag, A. (2022). Assessment of Meteorological Variables and Air Pollution Affecting COVID-19 Cases in Urban Agglomerations: Evidence from China. International Journal of Environmental Research and Public Health, 19(1), 531. https://doi.org/10.3390/ijerph19010531