Article

Differences in Park Walking, Comparing the Physically Inactive and Active Groups: Data from mHealth Monitoring System in Seoul

Department of Architecture & Architectural Engineering, Seoul National University, Seoul 08826, Korea
*
Author to whom correspondence should be addressed.
Int. J. Environ. Res. Public Health 2022, 19(1), 395; https://doi.org/10.3390/ijerph19010395
Submission received: 30 October 2021 / Revised: 16 December 2021 / Accepted: 20 December 2021 / Published: 30 December 2021
(This article belongs to the Collection Physical Activity and Public Health)

Abstract

:
Despite the overall increase in physical activities and park uses, the discrepancies between physically inactive and active people have increasing widened in recent times. This paper aims to empirically measure the differences in walking activity in urban parks between the physically inactive and active. As for the dataset, 22,744 peoples’ 550,234 walking bouts were collected from the mHealth system of the Seoul government, using the smartphone healthcare app, WalkOn, from September to November 2019, in Seocho-gu district, Seoul, Korea. We classified the physically inactive and active sample groups, based on their regular walking (≥150 min of moderate-to-vigorous walking activity a week), and analyzed their park walking activities. We found that while there was no significant difference in walking measures of non-park walking between the sample groups, the difference did exist in park walking. The park walking average in the physically active group had more steps (p = 0.021), longer time (p = 0.008), and higher intensity (p < 0.001) of walking than that in the inactive group. Each park also revealed differences in its on-site park walking quantity and quality, based on which we could draw the list of ‘well-walked parks’, which held more bouts and more moderate-to-vigorous physical activities (MVPAs) than other parks in Seocho-gu district. This paper addresses how park walking of physically inactive and active people is associated with multiple differences in everyday urban walking.

1. Introduction

Given a wide consensus that urban facilities play a role in reducing sedentary behaviors and physical inactivity, urban parks have been a focus as one of the most health-promoting urban facilities [1,2]. The positive associations of walking activity with built environmental features of parks have been recognized [3,4]. Activity-promoting programs in parks, such as park prescriptions, also develops people’s regular physical activities [5]. Research has been conducted on the urban environmental and behavioral aspects of parks in terms of the physical activity, for example, walking activity in park.
Despite the overall increase in physical activity and park use, discrepancies between physically active and inactive people increase, and those who are not physically active have yet to participate in park activities [6,7]. The group of physical inactivity, categorized as not achieving 150 min of moderate-to-vigorous-intensity physical activity per week, needs to be spotlighted in order to make significant health intervention changes [8,9]. Studies have found that demographic factors and park characteristics are associated with park use [3,10], but little is known about physically inactive people who are in need of the health intervention [11].
Innovations in physical activity measurement technology [12] and mobile health [13] are supported in the research. In particular, walking assessment has been developed from self-reported methods, such as travel survey, and now objective measurements capable of more quantitative analysis. Global positioning system (GPS), a widely known technology for objective measurement of locations and paths, has contributed to the analysis of pedestrian behaviors. Combined with geographic information system (GIS), many studies have found the characteristics of walking activity in specific urban area: walking in retail districts [14] and central business districts [15]; hiking trails in recreational areas [16]; and park use in urban forest parks [17]. Today, most smartphones are equipped with GPS sensors, and their operating systems detect user’s body movement and accumulate physical activity data. The smartphone-based approach enables easier physical activity assessment from a larger population than other methods [18,19].
This paper aims to measure the differences in walking activities at the urban parks between those individuals who are physically inactive and active, and to identify a list of parks that are likely to encourage people’s moderate-to-vigorous physical activity. For this goal, three objectives are carried out: (1) to classify individuals who are in physically inactive and active groups; (2) to find a significant difference between their walking measures; (3) to identify the well-walked parks based on the analysis of park walking. These findings help re-evaluate the supportive effect of urban parks on different walking activities in the physically inactive and active groups, and thus applicable for targeted interventions by identifying the specific group of physical inactivity. This paper also provides a practical example of applying a smartphone-based monitoring system to health policy, in collaboration with urban environment researchers, computer engineers, and public health officials.

2. Research Data and Methods

This study uses physical activity data from the mHealth monitoring system of the Seoul government, assessed by a smartphone healthcare application, WalkOn (Swallaby Inc., Seoul, South Korea). The reason why this app is suitable for research purposes is that, first, it has been officially used by public health centers in Korea; second, it is free of charge, serviced in Korean, and has more than 500,000 active users (about 1% of national population); and third, it is highly applicable to various smartphone devices because it is based on the physical activity assessment algorithm of Android and iOS operating systems. However, its data might be biased because the user percentage is higher in those individuals over the age of 40 and lower in the under 10 age group. Due to the restriction of personal information, we cannot present the prevalence of ages of our dataset. The period of the dataset, from September to November 2019, was the autumn season with abundant outdoor activities and the season before the outbreak of COVID-19, that might have brought an impact on people’s outdoor activities. The research site, Seocho-gu district, is one of 25 administrative districts of Seoul with low obesity prevalence, great walkability, and the largest number of pedestrians [20]. The local government of Seocho-gu district has tried to provide walkable built environments, including its 130 urban parks, and run several walk-promoting campaigns through the mobile app. The dataset of this study was composed of 22,744 app users who recorded 550,234 bouts of walking activity in Seocho-gu for 13 weeks, from September to November 2019. Technical reliability of this data basically follows the confidence level of Android and iOS algorithms that detect physical activity from each device. This is because the raw data of this app has been called from smartphone operating systems.
Research data of this study are mainly composed of three types of information: smartphone-based physical activity data for walking activities; smartphone-based regular walking data for physical inactivity level of subjects; and Seoul urban GIS data for park facilities (https://data.seoul.go.kr/dataList/OA-21129/S/1/datasetView.do (accessed on 27 April 2021)). Our dataset of walking activities, which was an existing dataset from the Seoul mHealth monitoring system, has information of pseudonymized user ID, start time, end time, the number of steps, and GPS coordinates of its path (Appendix A, Table A1). A de-identification process must be applied on research data so that individuals cannot be specified, according to the Personal Information Protection Act in Korea. In order to determine the user’s physical inactivity, the number of weeks that the user had achieved regular walking was measured over a 13-week research period. Park facilities in the GIS dataset, shown in Figure 1 were used to distinguish park walking, as a walking activity in which more than one of GPS coordinates exists within the park area. Our definition of park walking includes a wide range of park-related walking such as walking inside or passing through a park. To identify park walking and non-park walking, we used Python library, GeoPandas version 0.8.1 (https://geopandas.org/en/stable/ (accessed on 19 December 2021)), and Matplotlib version 3.5 (https://matplotlib.org/ (accessed on 19 December 2021)), to check point-in-polygon whether every GPS points were located in 130 parks in Seocho-gu or not (Appendix A, Table A2). As a result, 56,651 bouts of park walking (10.26%) and 493,583 bouts of non-park walking (89.74%) were identified from 550,234 walking bouts.
For understanding, the terms used in this study are summarized as follows:
  • Physical inactivity: Public health physical activity guidelines [2] recommend that people engage in sufficient levels of moderate-to-vigorous physical activity (MVPA) for older adults, at least 150 min/week, and include “brisk walking” as a primary example of an appropriate activity [21,22,23].
  • Regular walking: at least 150 min/week of walking activity. This criteria is officially recommended by public health professionals to make it easier for the public to understand and promote their physical activities [24,25].
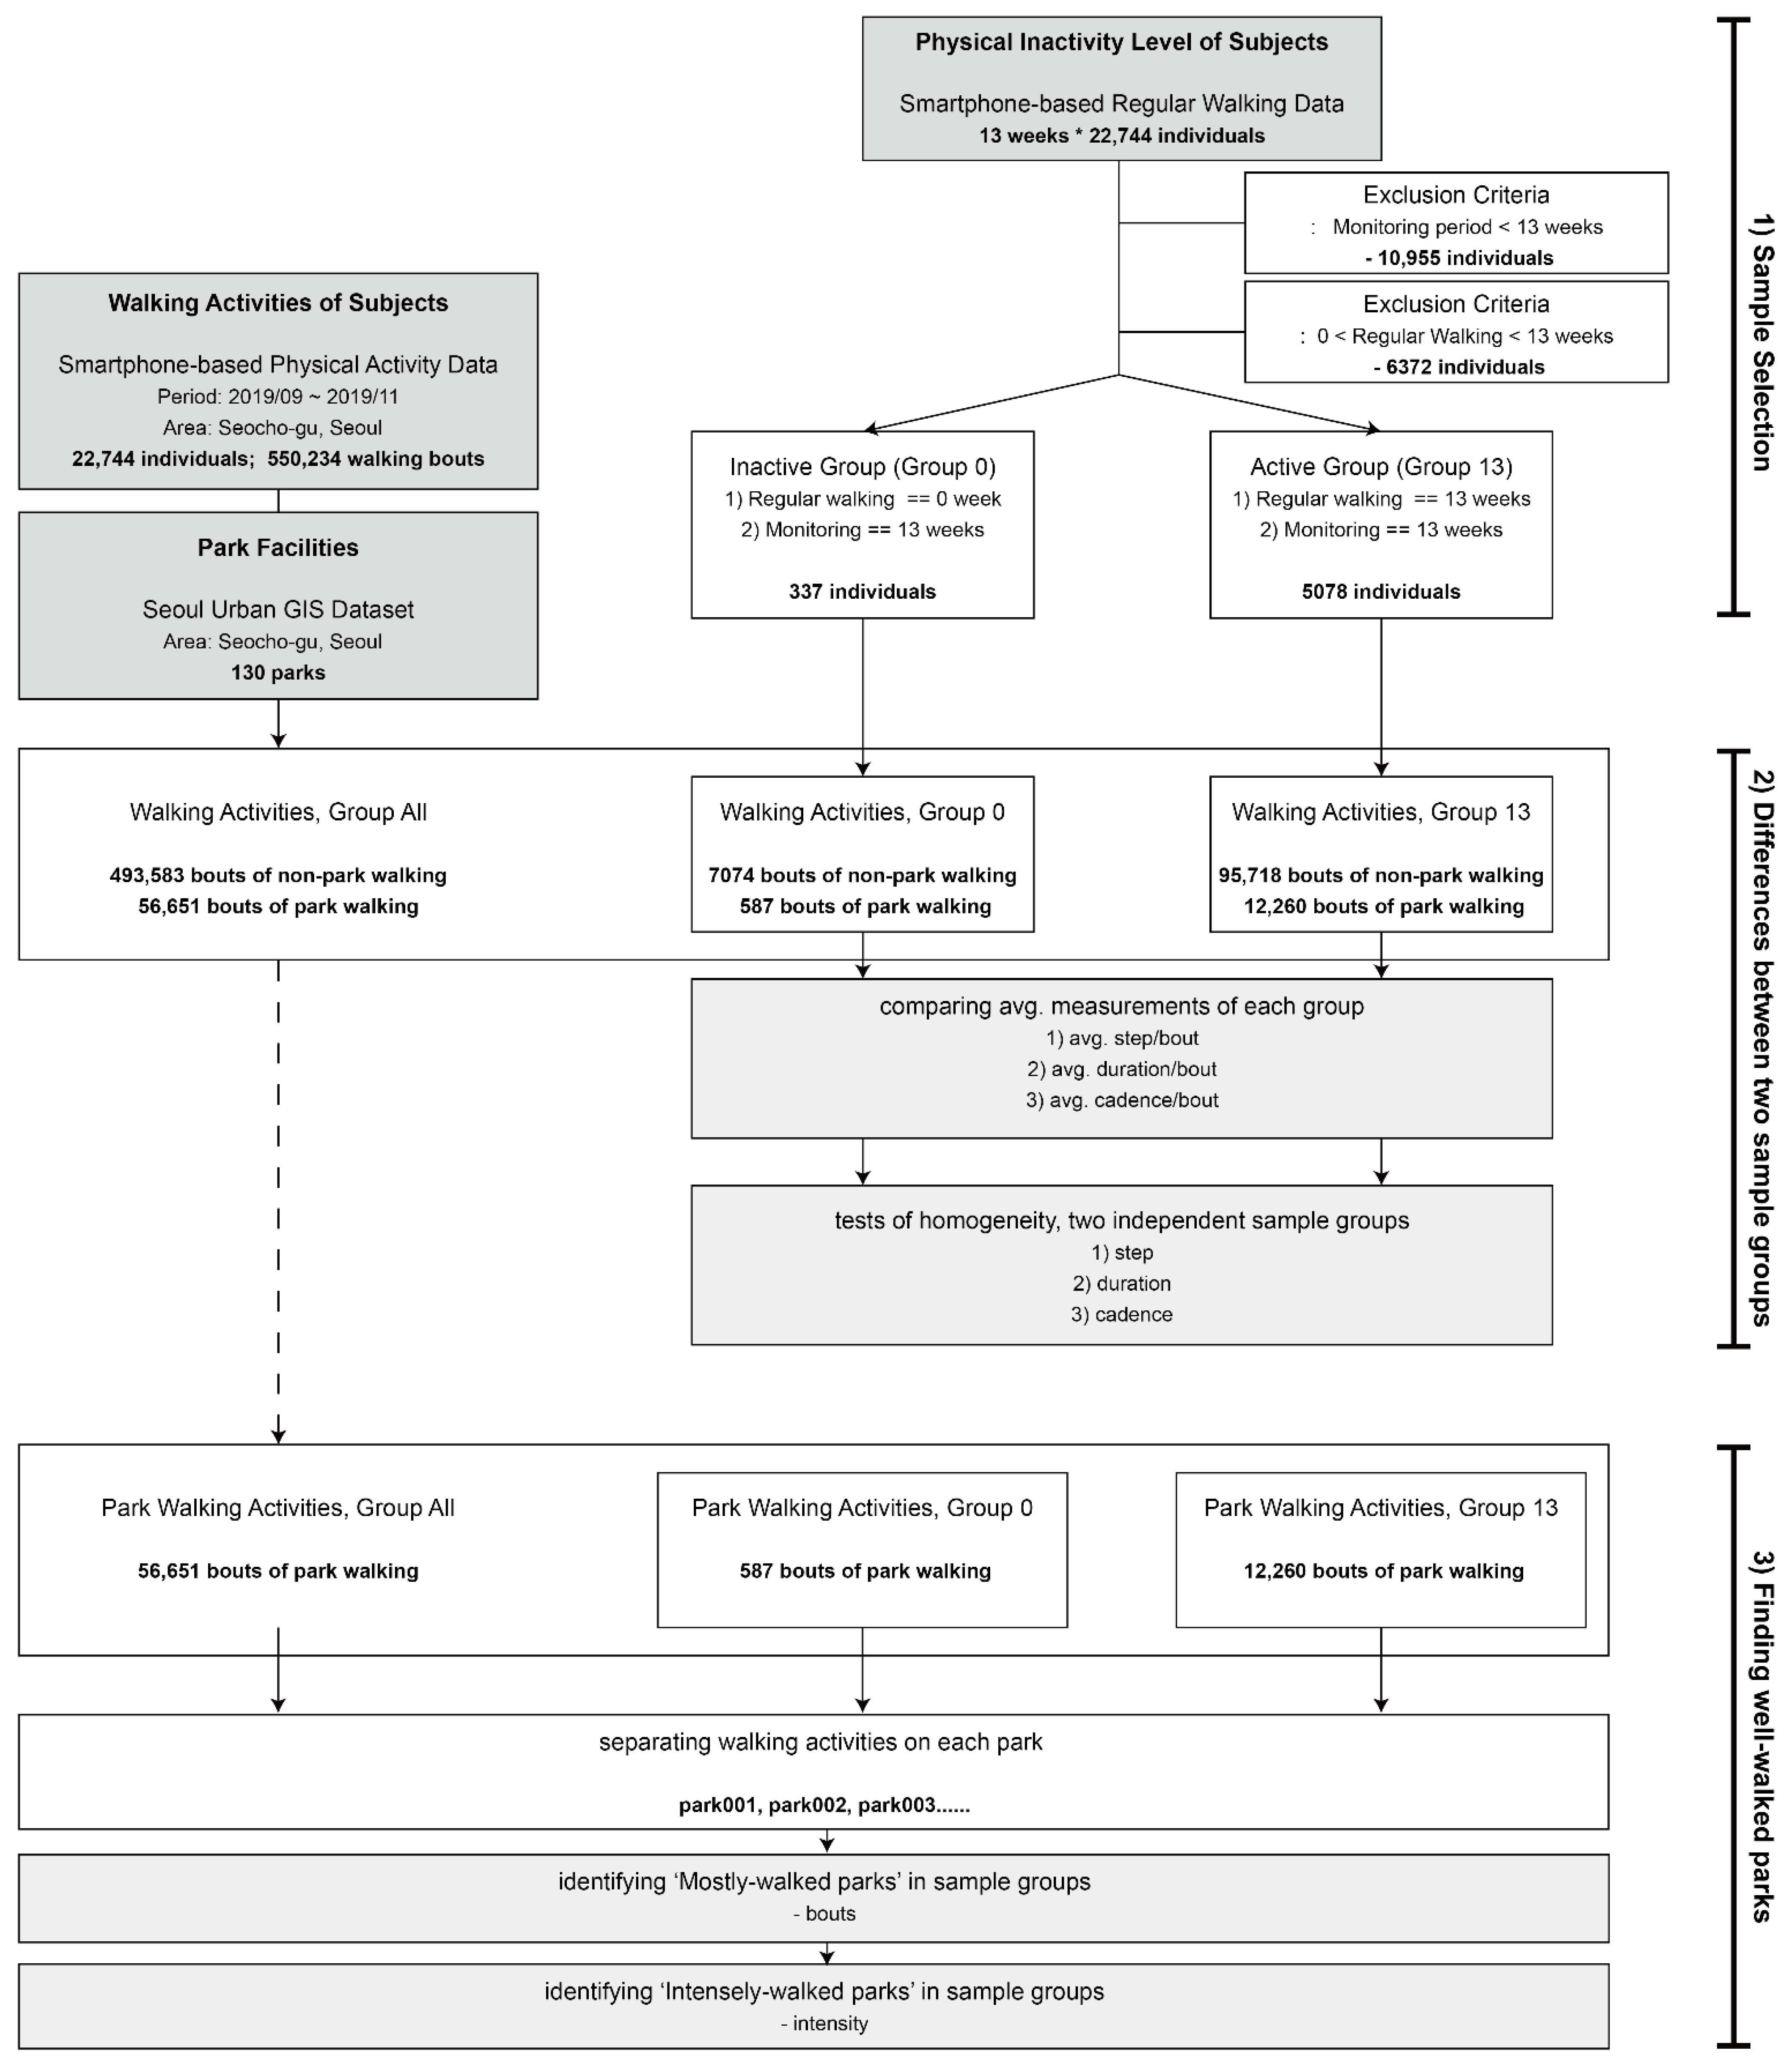
  • Physically inactive/active sample group: Based on the regular walking of each person, this study categorized people into physically inactive/active sample group.
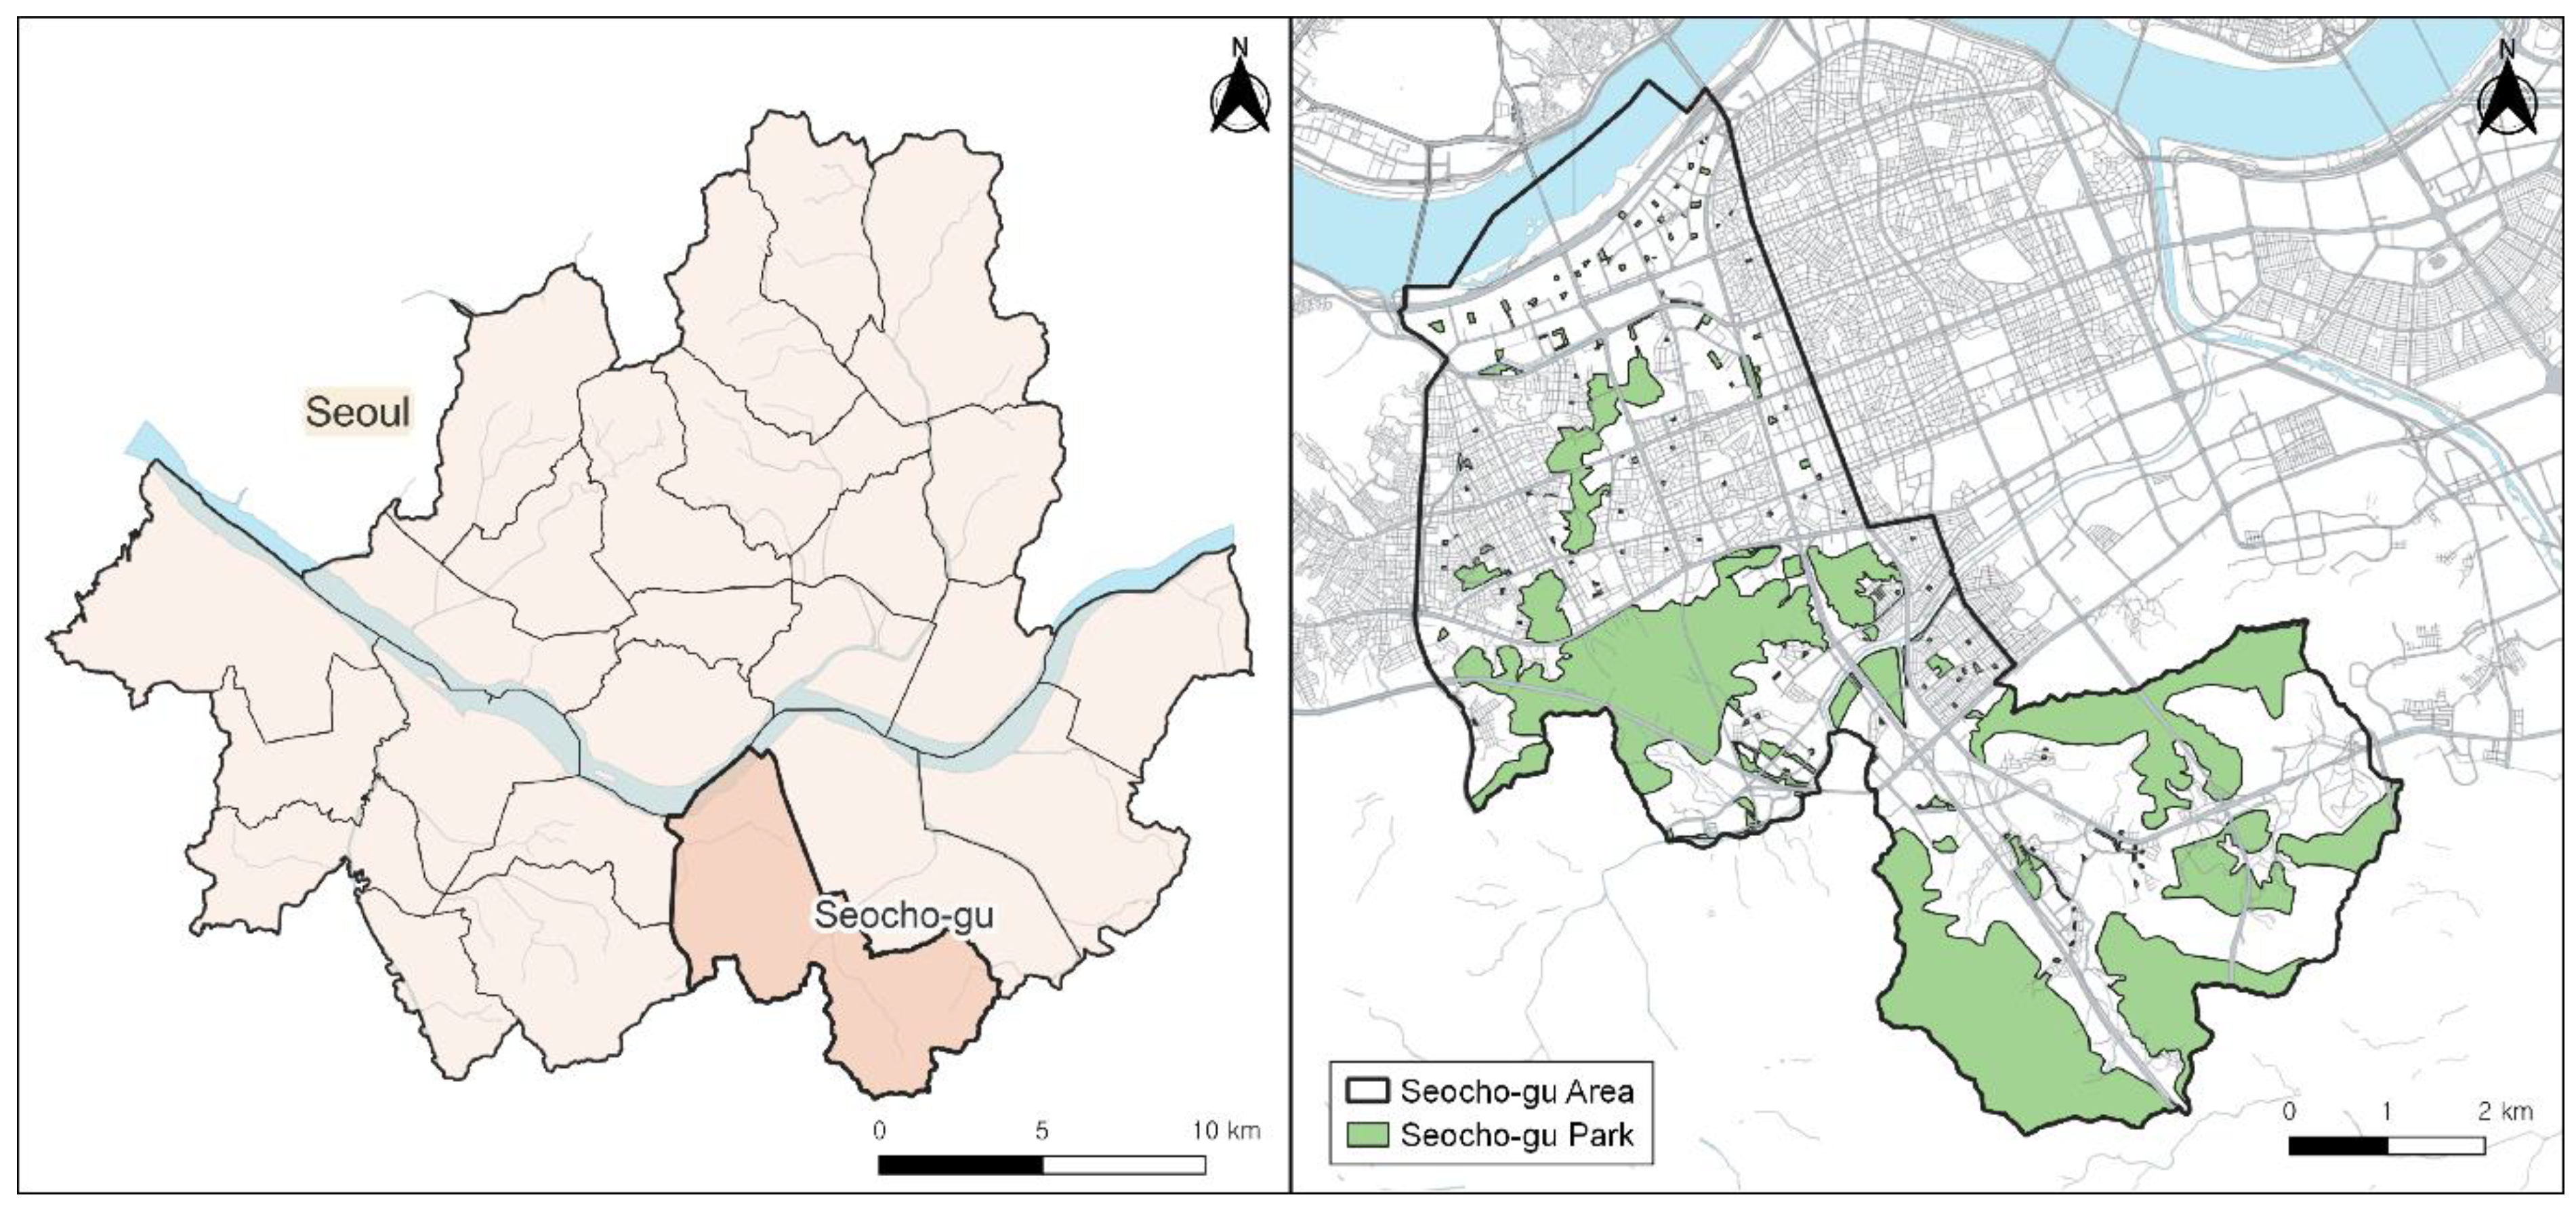
  • Park walking and non-park walking: a walking activity which does/does not pass through park areas in research site. To identify park walking activities, we coded a point-in-polygon algorithm in Python to determine whether every GPS points of walking activity were located in park or not.
  • Walking measures: quantitative information of walking activity, including accelerometer counts, GPS coordinates, and timestamp, were recorded by smartphone device. The application of the mHealth system can calculate those numbers into several walking measures, such as steps/bout, duration/bout, and cadence/bout.
In order to find the differences in walking measures between physically inactive and active people, we designed this research into three processes: (1) selecting sample groups; (2) comparing sample groups; and (3) finding certain parks based on the differences between sample groups. First, sample selection classified the physical inactivity level of each user by the number of weeks of regular walking (>150 min/week of moderate-to-vigorous walking activities). Two distinct sample groups, who did/did not achieve regular walking every week in the research period, were selected.
Second, we compared the walking measures of the sample groups’ park walking and non-park walking. Walking measures of each group, for example, the number of bouts, steps, duration, and cadence, were calculated from the dataset. In the result of this study, the average walking measures of each group were compared, and a significant statistical difference between the two groups was tested by using Mann–Whitney U test.
Third, based on the differences in overall walking activities between each sample groups, it is necessary to figure out the apportioned differences at each park. Considering the health intervention for physically inactive people, we analyzed whether a certain park had better walking measures. The list of ‘well-walked parks’ was drawn based on our spatial analysis. Considering the criteria of physical inactivity, 150 min/week of MVPA, both volume and intensity of park walking are essential for physically inactive people [2,6]. We found mostly-walked parks to have a greater number of walking bouts. Mostly-walked parks in each sample group were compared to find differences in the quantity of park walking. In addition to bouts of park walking, we also figured out several parks that have higher level of walking intensity. Detailed procedures and findings in Figure 2 are explained in the following Results section.

3. Results

3.1. Sample Selection: Classifying the Physically Inactive and Active Groups

Sample selection, for the first step, needed to find physically inactive and active people based on their regular walking (≥150 min/week of moderate-to-vigorous walking). The mHealth monitoring system of Seoul, our data source, evaluates the regular walking of app users from their smartphones every week. Its algorithm (small vibrations, short movements, and light intensity of walking activities are excluded from the regular walking measurement) considers walking activities meeting the criteria of three features (≥1000 steps, ≥10 min, ≥100 steps/min) as MVPA walking [12,26,27]. If an app user had 150 or more minutes of MVPA walking in a week, he or she would be counted as meeting the regular walking in that week [28]. Based on the user’s accomplishment of regular walking in 13 weeks of our research period, we can evaluate each user for how many weeks he or she met the public health recommendation. As shown in Table 1, 339 people who never met the regular walking for 13 weeks were selected as a physically inactive sample group (Group 0, from here on), and 5078 people who successfully met regular walking for all 13 weeks were selected as a sample of the physically active sample group (Group 13). In order to increase the reliability of the sample, we selected the two distinctive sample groups, which had a maximum and minimum of regular walking week, and fully monitored for the entire research period (a portion of data was excluded from the sample selection; 6372 cases that were uncertain because they partially succeeded or failed to meet regular walking, and 10,955 cases that were monitored less than 13 weeks were excluded).

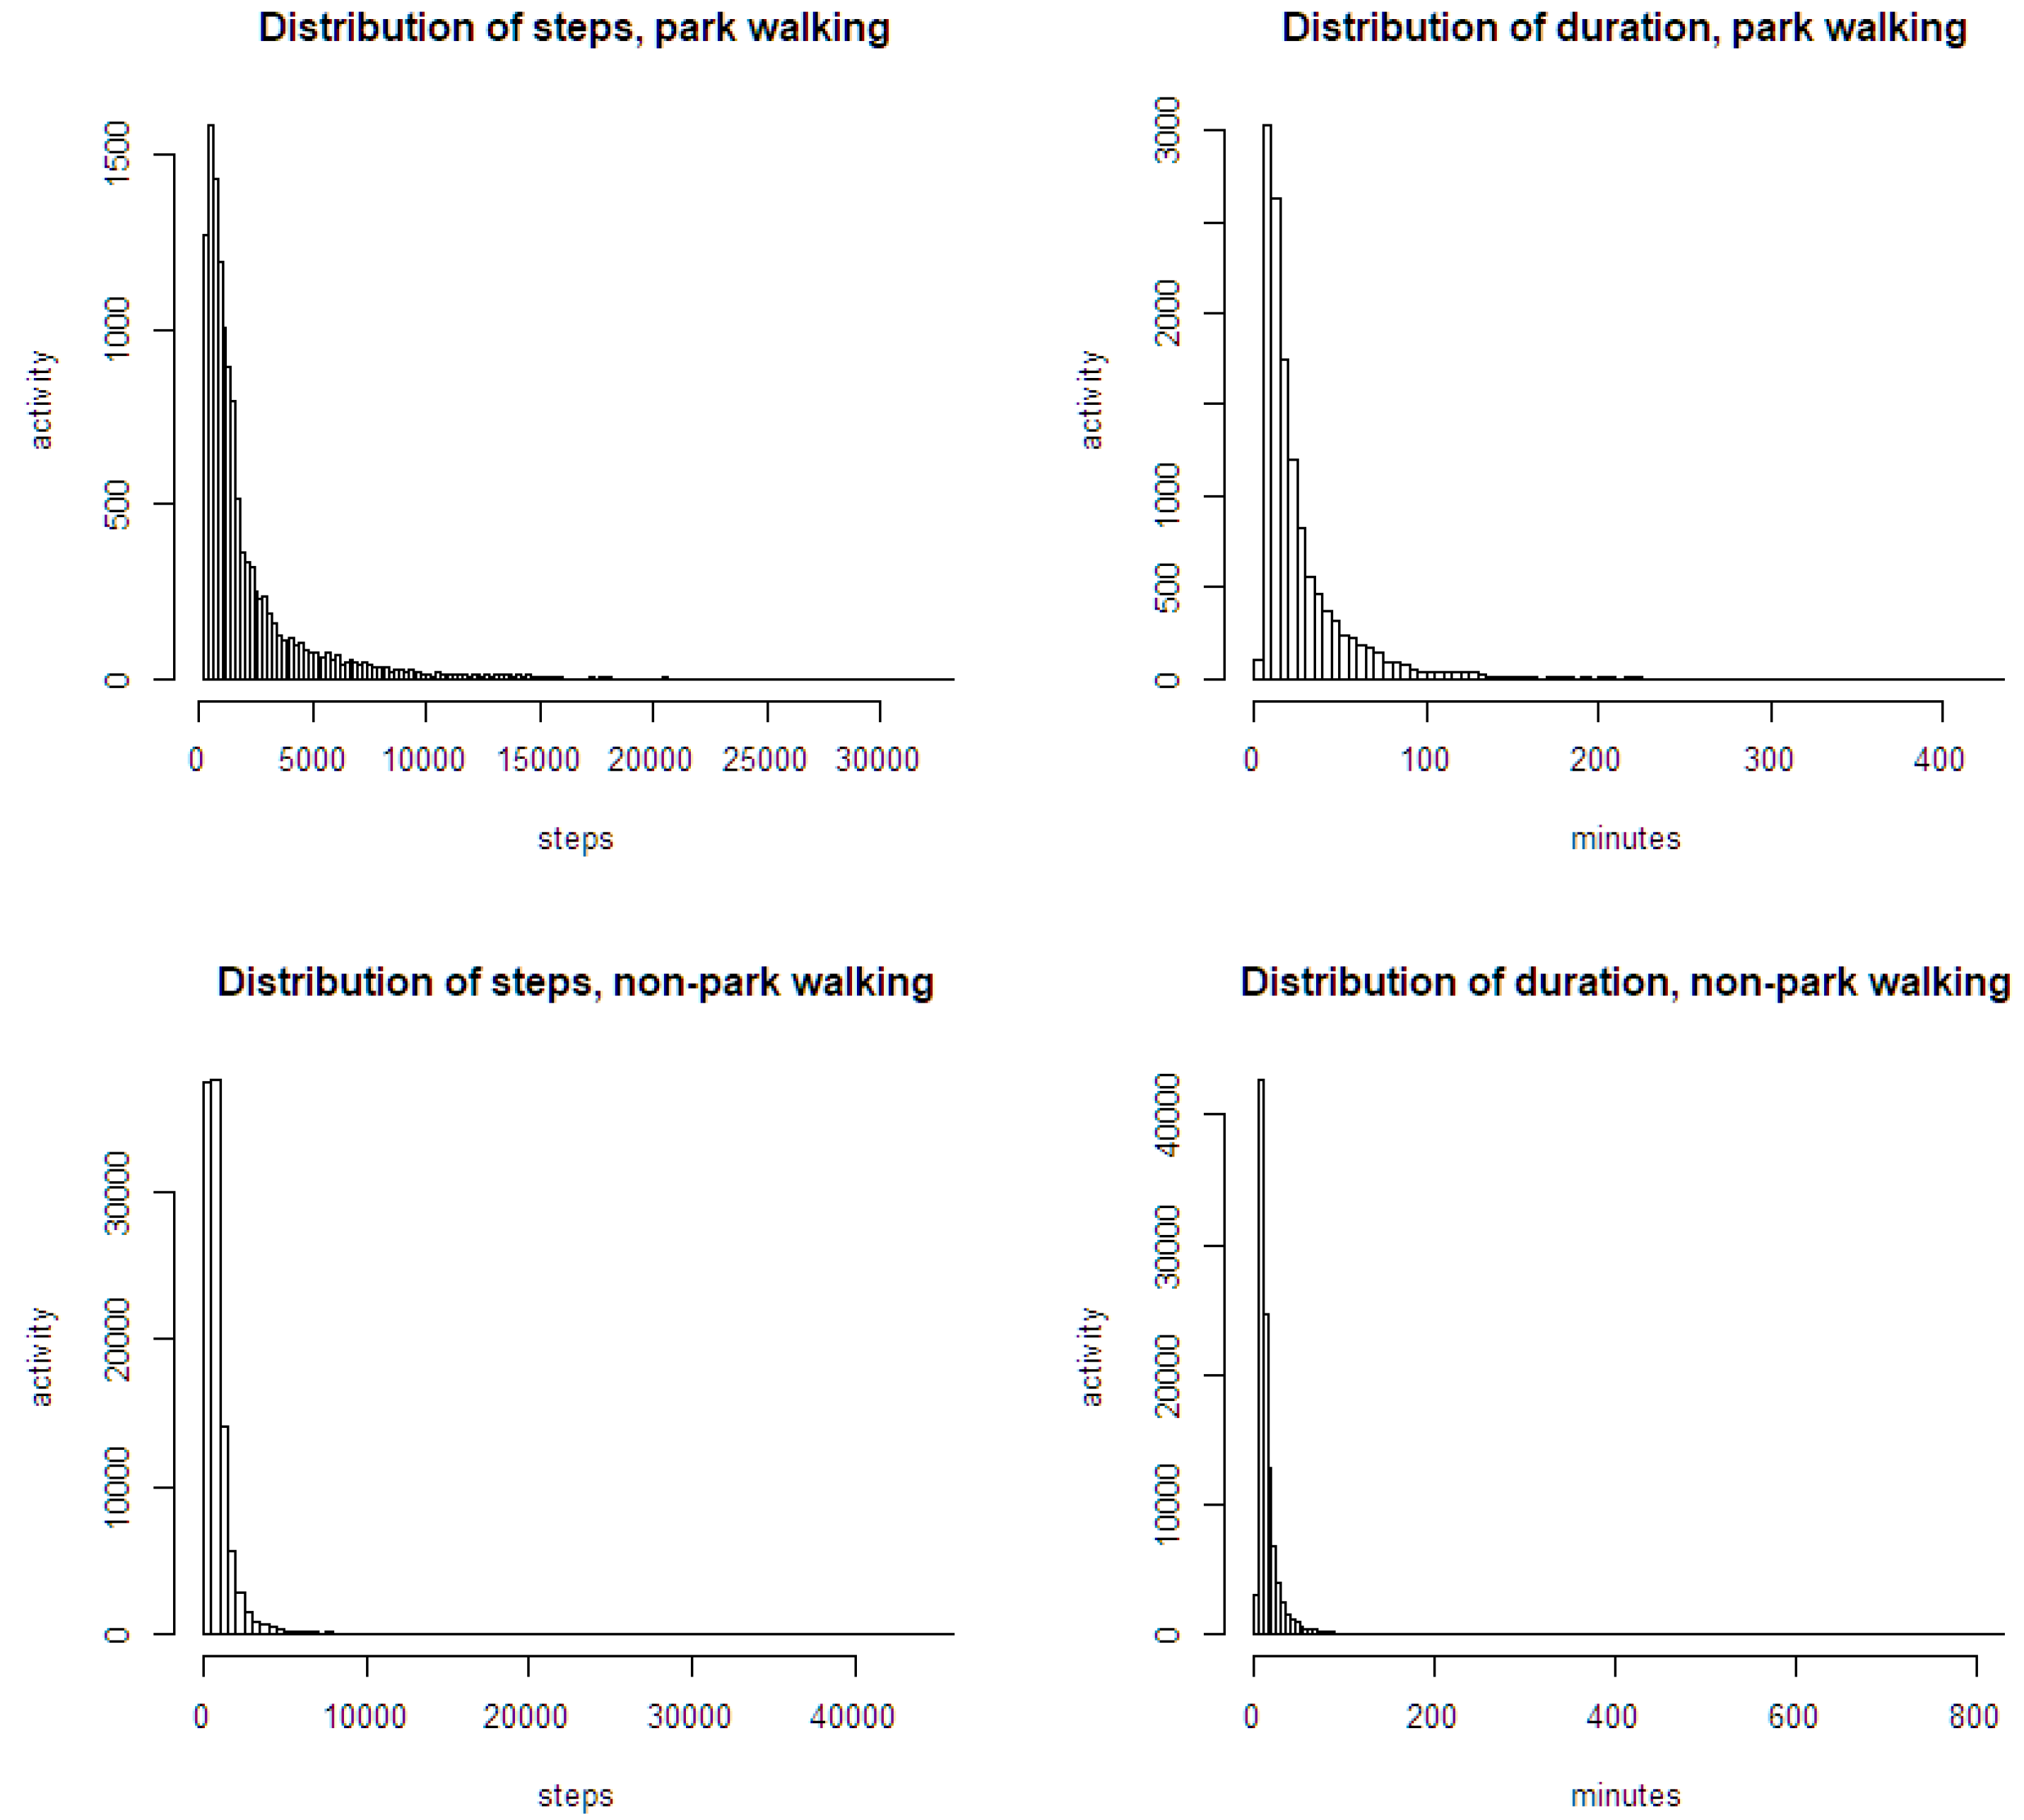
3.2. Differences in Walking Activities: Comparing the Selected Sample Groups

In order to compare the walking activities, it is necessary to comprehensively look at three indicators representing different aspects of walking, step, duration, and cadence [29]. Step is a familiar indicator to explain the volume of a walking bout. Duration is another quantitative indicator representing the temporal aspect of a walking bout. Cadence, the number of steps per minute, represents the intensity of walking activity. Considering that the public health recommendation targets physically inactive people to increase moderate-to-vigorous-intensity physical activity for 150 min or more per week, we considered not only the quantity of walking but also the intensity aspect of walking as an important factor in the analysis.
As shown in Table 2, the walking measures of the sample groups’ non-park walking and park walking were carefully calculated, based on which park walking had different walking measures in each group. Considering the average walking measures, park walking of Group 13 showed an average of 2108.13 steps, 26.09 min, and 76.19 steps/min in a single walking bout. Park walking of Group 0 had an average of 1665.96 steps, 24.58 min, and 65.64 steps/min in a single walking bout. In the two groups, the walking measures of park walking seemed higher than those of non-park walking. However, it was not enough to prove the differences in walking measures between the two sample groups.
To statistically confirm a significant difference between the two sample groups, the data should be normally distributed. If not, a non-parametric test is needed. As shown in Figure 3, it looks far from the normal distribution, but close to Pareto distribution (power-law distribution) with a long tale. In order to test the homogeneity of two independent samples’ walking measures, Mann–Whitney U test (Wilcoxon rank-sum test) was conducted as a non-parametric test. The result in Table 3 showed that three walking measures (steps, duration, and cadence) of park walking were significantly different between Group 0 and Group 13, but those measures of non-park walking have no significant difference. Steps of park walking were significantly lower in Group 0 (median = 1169, n = 587) compared to Group 13 (median = 1191.5, n = 12,260), U = 3,395,179, z = −2.31, p = 0.02066. Cadence of park walking was significantly lower in Group 0 (median = 68.07) compared to Group 13 (median = 77.15), U = 2,814,828, z = −8.93, p < 0.001. Duration of park walking was significantly higher in Group 0 (median = 18.9) compared to Group 13 (median = 16.7), U = 3,828,546, z = 2.62, p = 0.008719. Otherwise, non-park walking in both groups had no significant differences in steps (p = 0.3087), duration (p = 0.1171), and cadence (p = 0.08002). Therefore, non-park walking of the two groups does not show a significant difference in all three indicators of step, duration, and cadence, whereas park walking of the two groups shows a significant difference in all three indicators. Cadence of park walking in the two groups, which is associated with MVPA, shows an extremely significant difference at a confidence level of less than 0.1%.
Highlighted on the cadence, which shows a significant difference in the two groups, the park walking of the two sample groups was divided into light, moderate, and vigorous levels of intensity. The intensity level of walking activity is another factor of the difference between the two groups park’ walking. Using the thresholds of cadence values, we classified the walking activities into the light (<100), moderate (100 ≤ cadence < 130), and vigorous-intensity (≥130) of walking. As shown in Table 4, a total of 587 park walking in Group 0 showed the distribution of light (91.82%), moderate (7.84%), and vigorous activity (0.34%). On the other hand, in Group 13, a total of 12,260 park walking, light (80.80%), moderate (18.03%), and vigorous activity (1.17%) showed a higher bout ratio of moderate-vigorous walking activity (MVPA). Steps and duration of Group 13 also had greater measures in every intensity level than those of Group 0. It can be inferred that Group 13 walked at the parks with better quality of walking activities than Group 0 did.
After all, between Group 13 and Group 0, there was no significant difference between non-park walking of Group 0 and Group 13, but there was a significant difference in park walking. Taking a more in-depth look at the cadence of park walking, Group 13 walked with a higher level of intensity than Group 0, when they walked in the park. This could be evidence that park walking activities will be helpful in increasing the walking measures of people, and that physically active individuals may have better walking measures than inactive individuals.

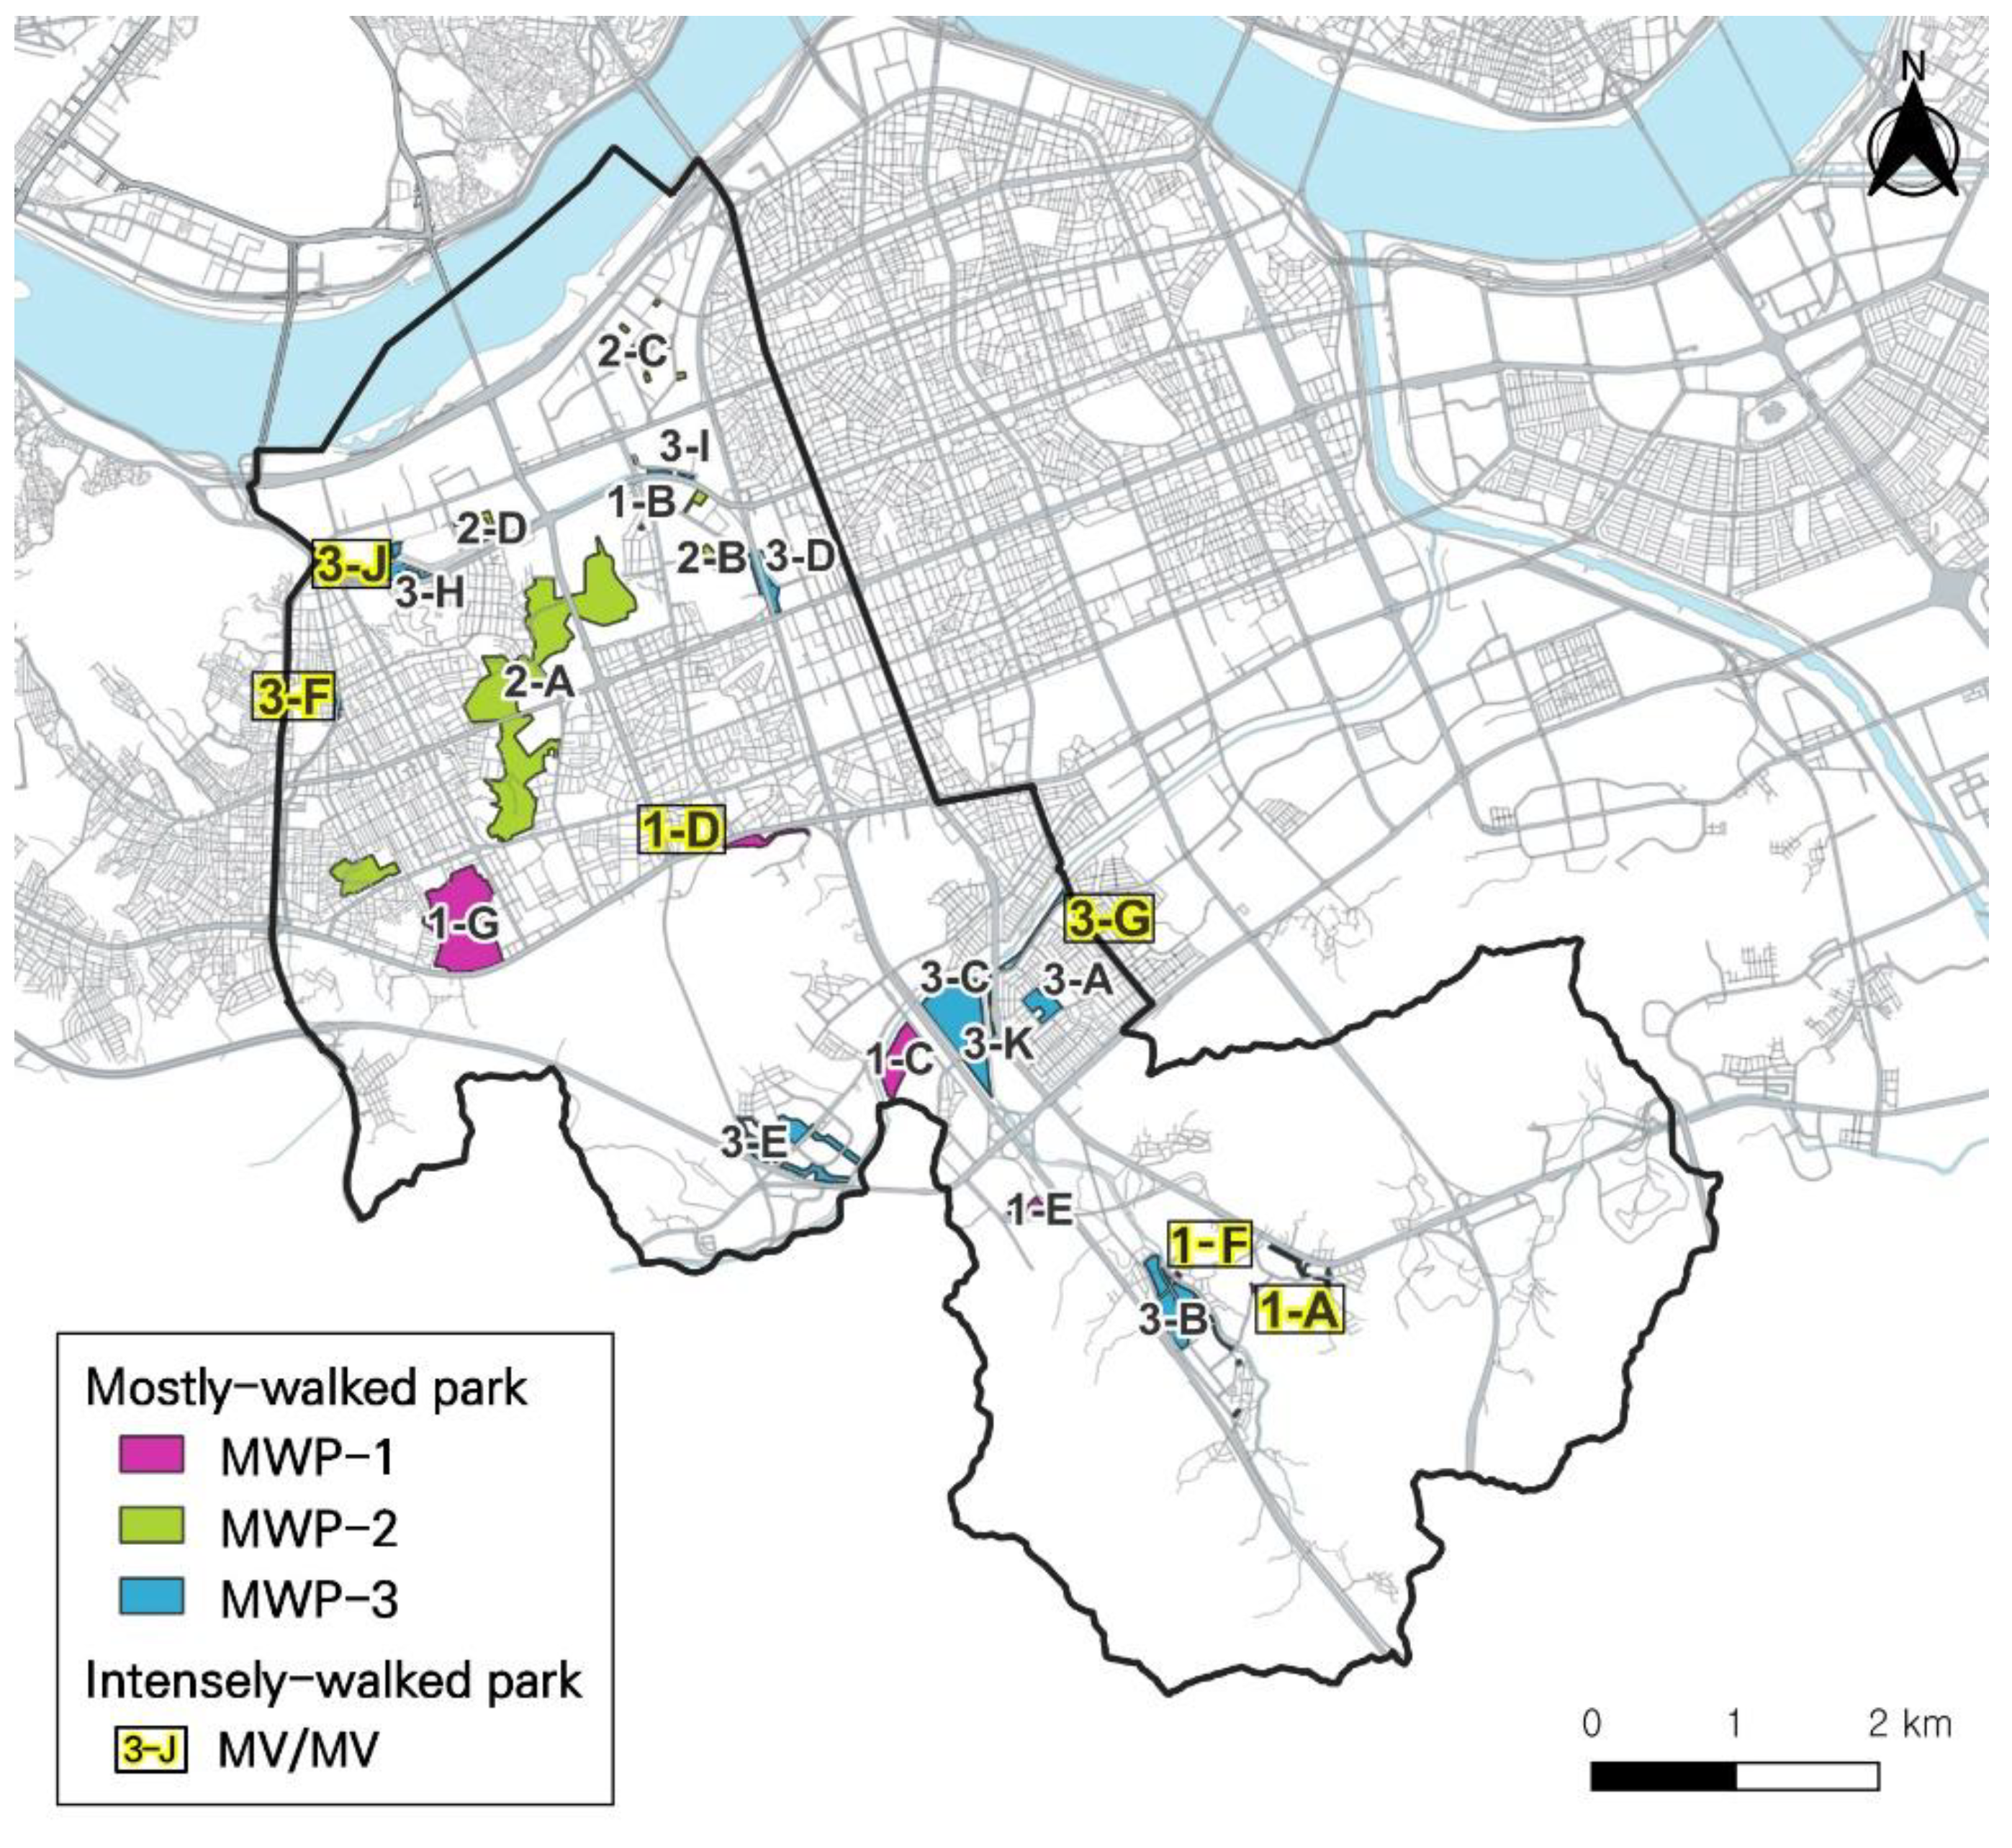
3.3. Differences in Parks: Finding ‘Well-Walked Park’

Based on the differences in park walking of the two groups, we now examine the differences in spatial aspects. Among the 130 parks in Seocho-gu district, we tried to find ‘well-walked parks’, which provide sufficient MVPAs of both Group 13 and Group 0. A plain indicator for finding parks that hold health-related physical activities might be the number of walking trips, but a more critical indicator is needed to examine the intensity of walking activities. While ‘mostly-walked park’ represents the quantity of park walking, ‘intensely-walked park’ represents the quality of park walking. In order to find ‘well-walked parks’, we firstly filtered the ‘mostly-walked park’ and figured out ‘intensely-walked parks’ with a higher ratio of MVPAs among them.
We listed in a ranking order by the number of bouts in each sample group. Table 5 shows a list of the top 20 of ‘mostly-walked parks’ with the walking measures of three sample groups, Group 0, Group 13, and Group All. Comparing the top 20 of ‘mostly-walked parks’ of sample groups, we can categorize those parks into three common types, as shown in Table 6. The three types of ‘mostly-walked parks’, with their parkID (parkIDs were from the serial number of Seoul Urban GIS dataset. The first-21-digit of raw data, ‘11650UQ153PS201407214′, which is entitled as same as every park in Seocho-gu, was converted to ‘park’ + ‘000′ in the table)s and codes (we named a new code (e.g., 3-A), representing its type of MWP, next to the parkIDs to avoid confusion), consists of Type MWP-3 (common in the list of Group all, Group 13, and Group 0), Type MWP-2 (common in Group all, Group 13) and Type MWP-1 (appeared only in Group 0). MWP-3 had 11 parks, hosting a great number of walking bouts in every sample group. Group 0 not only recorded a large number of bouts in these parks, but also showed great measures in terms of step, duration, and cadence. MWP-2 consisted of five parks in which Group 0 had not as many walking bouts, unlike other groups. This might be related to the walking differences, in that Group 0 tended not to walk, but Group 13 and Group All seem willing to walk. MWP-1, which was only listed in Group 0, might represents extraordinary bouts of Group 0′s park walking. This result, however, must be interpreted with caution due to the small sample size of Group 0.
Furthermore, we analyzed the intensity of walking activity to examine which parks had more moderate-to-vigorous-intensity level of park walking (MVPA). We already estimated the percentage of park walking that was MVPA in each sample group, described in Table 2. The average bouts ratio of MVPA in each group’s park walking was 8.18% in Group 0, 19.20% in Group 13, and 14.95% in Group All. Depending on the average of MVPA%, we evaluated which intensity level of park walking was prevalent in each park. Higher MVPA% at a certain park than the average of park walking meant that people were likely to walk ‘more intensely’ at that park. Table 7 shows whether the prevalent intensity of each park is light or moderate-vigorous in the sample groups. As shown in Table 8, it was possible to categorize seven parks (3-F, 3-G, 3-J, 2-E, 1-A, 1-D, and 1-F) as ‘intensely-walked parks’ which had a higher percentage of MVPA park walking in both Group All and Group 13 (Group 0 were excluded in this comparison, because bouts of each park were too little (<10) in Group 0). On the other hand, 13 parks in which LPA was more prevalent could be sorted as less-intensely-walked parks. Only three parks (3-D, 2-D, and 1-C) have a different prevalent intensity in Group All and Group 13. Figure 4 shows the locations of the three types of ‘mostly-walked parks’ and emphasizes ‘intensely-walked parks’ in Seocho-gu district.

4. Conclusions

The current widespread use of smartphones along with the evolving mHealth monitoring technology enable more abundant data collection as well as detailed analysis for environmental health. In Korea, which has a high level of smartphone ownership (first ranked country, with 95% of smartphone ownership [30]. https://www.pewresearch.org/global/2019/02/05/smartphone-ownership-is-growing-rapidly-around-the-world-but-not-always-equally/ (accessed on 15 August 2021)), smartphone-based research has been increased to explore the walking activities of diverse populations, including vulnerable groups in various urban spaces. A large number of datasets, walking activities from the mHealth monitoring system of Seoul, and park data from the urban planning information system of Seoul, allow us to explore the differences in park walking between the physically inactive and active groups. This study, as an analysis from existing data, has several limitations: uncontrollable conditions of data collection, de-identified information about subjects, and probability of self-selection. Nevertheless, smartphone-based research has promising potential to explore with careful and proper protocols. Researchers look forward to further studies on the global protocol and methodology for smartphone-assessed physical activities.
This paper contributes to a better understanding of the walking activities of physically active and inactive groups in specific urban parks. Empirical contrasts between the physically inactive and active, park walking and non-park walking, mostly-walked parks and intensely-walked parks, are keywords for interpreting the differences of our findings. While previous approaches to the vulnerable group were identified in terms of demographic or socioeconomic variables, this study identified physically inactive people without any demographic information. The findings in this study demonstrated that the physically inactive and active groups had disparity in their park walking. Significant differences between both groups resulted from their park walking, for example, the physically active group had better walking indicators, including more steps, longer time, and higher intensity in park walking, than the inactive group. This is evidence that parks can bring more health benefits to people who do not meet the public health recommendation of regular walking. This study then drew the newly defined ‘well-walked park’, in which most people walk and do so intensely. The finding of the ‘well-walked park’ is a solid foundation for promoting urban places that contain not only quantitative but also qualitative aspects of walking activities. In order to meet 150 min of MVPA as required by the public health recommendation, it is essential to increase the volume of walking activities as well as to increase the intensity of walking activities. As a result, we established the substantial list of ‘well-walked parks’, which brought more bouts and higher intensity.
This study reflects collaborative works that have been carried out among a local government’s public health office, a university’s urban design and planning lab, and a private sector’s start-up company for the mobile healthcare system. For a common goal of promoting citizen’s physical activities in the urban environment, the three bodies work together to develop and publicize smartphone healthcare apps, collect and monitor data, and conduct research for policy implications. Starting with the results of this study, this type of collaboration is necessary to explore more evidence for activity-supportive built environments based on walking activities empirically measured in urban spaces.
Physical inactivity is a global public health issue, and various policies are being discussed so that people can have more MVPA and reduce their sedentary behavior. This study implies that park walking could provide better walking measures with more steps, duration, and cadence, which are recommended for the physically inactive group. Parks are necessary as urban infrastructure to bring both quantity and quality of walking activities. Despite the overall increase of park areas, the health disparity on physically inactive people gets worse [31]. Empirical monitoring for park spaces acting as public goods means the built environment and health professionals now strategically cooperate with targeted interventions to make changes for the physically inactive. Differences in park walking could suggest evidence to distinguish the advantage of parks, with respect to which they are easy for park walking and favorable for walking longer, and which are effective to increase MVPAs. It could suggest the implication for practice to re-design a park with fewer walking bouts or to run a walk-promoting program at a park with high MVPAs. We hope our collaborative understanding of differences in park walking contributes to providing more supportive built environments for physically inactive people.

Author Contributions

Conceptualization, Y.P. and S.P.; methodology, Y.P.; software, Y.P.; validation, Y.P. and S.L.; data curation, Y.P. and S.L.; writing—original draft preparation, Y.P.; writing—review and editing, S.P.; visualization, S.L.; supervision, S.P.; project administration, S.P. All authors have read and agreed to the published version of the manuscript.

Funding

This research received no external funding.

Institutional Review Board Statement

Ethical review and approval were waived for this study because this research was based on the secondary analysis of existing data previously collected through the municipal mHealth system, managed by the Health Promotion Department in the Metropolitan Government of Seoul. A de-identification procedure removed and pseudonymized personal identifiable information from the original data source, before the research data were transferred to the authors. Due to the data transfer agreement for research purposes, the authors were allowed to access the research data from the mHealth system.

Informed Consent Statement

Not applicable.

Data Availability Statement

Third party data; data were obtained from the mHealth system, WalkOn, and are available with the permission of the Health Promotion Department in the Metropolitan Government of Seoul, and app developer, Swallaby, Inc.

Acknowledgments

Since 2015, the collaboration among the app developer, Swallaby, Inc.; the public health officials of the Metropolitan Government of Seoul; and the Urban Form and Conservation Lab of the Seoul National University have worked together to make the city healthier and more walkable.

Conflicts of Interest

The authors declare no conflict of interest.

Appendix A

We add the examples of raw dataset, as Supplementary data.
Table A1. Example of walking activity dataset, from the mHealth monitoring system of Seoul.
Activity IndexUser IdSteps
(n)
Start Time
(Unix Epoch)
End Time
(Unix Epoch)
Duration
(Minutes)
Cadence
(Steps/Min)
Path
(Latitude, Longitude)
0uid1445156955874815695590685.3383.44[(127.0162903, 37.4818736), (127.0165615, 37.4…
1uid19201569564149156956499814.1565.02[(127.0549116, 37.4481587), (127.0549533, 37.4…
2uid2310156957840015695789949.9031.31[(127.0054878, 37.4904547), (127.0055013, 37.4…
550,231uid25434333157442337615744237125.6059.46[(127.0290467, 37.5329585), (127.0284468, 37.5…
550,232uid25434290157442567715744260325.9249.01[(127.0041856, 37.4971586), (127.0039574, 37.4…
550,233uid254347461574430477157443109710.3372.19[(127.0107915, 37.5100321), (127.0110716, 37.5…
Table A2. Park walking activity, identified by GPS path coordinates, and GIS park boundaries.
Activity IndexUser IDSteps
(n)
Start Time
(Unix Epoch)
End Time
(Unix Epoch)
Duration
(Min)
Cadence
(Steps/Min)
Path
(Latitude, Longitude)
GeoHashPark ID
217,165uid1006328821570949720157095182235.0382.26[(127.0162903, 37.4818736), (127.0165615, 37.4…[wydm4r, wydm4m, …[11650UQ153PS201407214307]
217,171uid1006327031572048709157205066832.6582.79[(127.0549116, 37.4481587), (127.0549533, 37.4…[wydkgp, wydm52, …[11650UQ153PS201407214286]
234,514uid100637921573608683157360969316.8347.05[(127.0054878, 37.4904547), (127.0055013, 37.4…[wydm61, wydm60][11650UQ153PS201407214296]
234,218uid999994481574137192157414281093.63100.90[(127.0290467, 37.5329585), (127.0284468, 37.5…[wydmd8, wydm6n, …[11650UQ153PS201407214330]
234,219uid999925041574148430157415019129.3585.32[(127.0041856, 37.4971586), (127.0039574, 37.4…[wydm6h, wydm6j, …[11650UQ153PS201407214330]
234,224uid999910681575010633157501126710.57101.07[(127.0107915, 37.5100321), (127.0110716, 37.5…[wydm6h, wydm6j][11650UQ153PS201407214204]

References

  1. Bedimo-Rung, A.L.; Mowen, A.J.; Cohen, D.A. The Significance of Parks to Physical Activity and Public Health: A Conceptual Model. Am. J. Prev. Med. 2005, 28 (Suppl. 2), 159–168. [Google Scholar] [CrossRef] [PubMed]
  2. World Health Organization. WHO Guidelines on Physical Activity and Sedentary Behaviour: At a Glance; World Health Organization: Geneva, Switzerland, 2020.
  3. Kaczynski, A.T.; Potwarka, L.R.; Saelens, P.B.E. Association of Park Size, Distance, and Features with Physical Activity in Neighborhood Parks. Am. J. Public Health 2008, 98, 1451–1456. [Google Scholar] [CrossRef]
  4. Shaheen, S.; Cohen, A. Growth in Worldwide Carsharing: An International Comparison. Transp. Res. Rec. J. Transp. Res. Board 2007, 1992, 81–89. [Google Scholar] [CrossRef] [Green Version]
  5. Besenyi, G.M.; Hayashi, E.B.; Christiana, R.W. Prescribing Physical Activity in Parks and Nature: Health Care Provider Insights on Park Prescription Programs. J. Phys. Act. Heal. 2020, 17, 958–967. [Google Scholar] [CrossRef]
  6. Babey, S.H.; Hastert, T.A.; Yu, H.; Brown, E.R. Physical Activity Among Adolescents. When Do Parks Matter? Am. J. Prev. Med. 2008, 34, 345–348. [Google Scholar] [CrossRef] [PubMed]
  7. Josey, M.J.; Moore, S. The Influence of Social Networks and the Built Environment on Physical Inactivity: A Longitudinal Study of Urban-Dwelling Adults. Health Place 2018, 54, 62–68. [Google Scholar] [CrossRef] [PubMed]
  8. Pratt, M.; Norris, J.; Lobelo, F.; Roux, L.; Wang, G. The Cost of Physical Inactivity: Moving into the 21st Century. Br. J. Sports Med. 2014, 48, 171–173. [Google Scholar] [CrossRef] [Green Version]
  9. Sari, N. Physical Inactivity and Its Impact on Healthcare Utilization. Health Econ. 2009, 18, 885–901. [Google Scholar] [CrossRef]
  10. Cohen, D.A.; Marsh, T.; Williamson, S.; Derose, K.P.; Martinez, H.; Setodji, C.; McKenzie, T.L. Parks and Physical Activity: Why Are Some Parks Used More than Others? Prev. Med. 2010, 50, S9–S12. [Google Scholar] [CrossRef] [Green Version]
  11. Adkins, A.; Makarewicz, C.; Scanze, M.; Ingram, M.; Luhr, G. Contextualizing Walkability: Do Relationships between Built Environments and Walking Vary by Socioeconomic Context? J. Am. Plan. Assoc. 2017, 83, 296–314. [Google Scholar] [CrossRef] [Green Version]
  12. Schuna, J.M.; Johnson, W.D.; Tudor-Locke, C. Adult Self-Reported and Objectively Monitored Physical Activity and Sedentary Behavior: NHANES 2005–2006. Int. J. Behav. Nutr. Phys. Act. 2013, 10, 1. [Google Scholar] [CrossRef] [Green Version]
  13. Lupton, D. Quantifying the Body: Monitoring and Measuring Health in the Age of MHealth Technologies. Crit. Public Health 2013, 23, 393–403. [Google Scholar] [CrossRef]
  14. Hahm, Y.; Yoon, H.; Jung, D.; Kwon, H. Do Built Environments Affect Pedestrians’ Choices of Walking Routes in Retail Districts? A Study with GPS Experiments in Hongdae Retail District in Seoul, South Korea. Habitat Int. 2017, 70, 50–60. [Google Scholar] [CrossRef]
  15. Mazumdar, S.; Bagheri, N.; Chong, S.; Cochrane, T.; Jalaludin, B.; Davey, R. A Hotspot of Walking in and around the Central Business District: Leveraging Coarsely Geocoded Routinely Collected Data. Appl. Spat. Anal. Policy 2020, 13, 649–668. [Google Scholar] [CrossRef]
  16. Taczanowska, K.; González, L.M.; Garcia-Massó, X.; Muhar, A.; Brandenburg, C.; Toca-Herrera, J.L. Evaluating the Structure and Use of Hiking Trails in Recreational Areas Using a Mixed GPS Tracking and Graph Theory Approach. Appl. Geogr. 2014, 55, 184–192. [Google Scholar] [CrossRef]
  17. Zhai, Y.; Baran, P.K.; Wu, C. Spatial Distributions and Use Patterns of User Groups in Urban Forest Parks: An Examination Utilizing GPS Tracker. Urban For. Urban Green. 2018, 35, 32–44. [Google Scholar] [CrossRef]
  18. Krenn, P.J.; Titze, S.; Oja, P.; Jones, A.; Ogilvie, D. Use of Global Positioning Systems to Study Physical Activity and the Environment: A Systematic Review. Am. J. Prev. Med. 2011, 41, 508–515. [Google Scholar] [CrossRef] [PubMed] [Green Version]
  19. Reis, R.S.; Salvo, D.; Ogilvie, D.; Lambert, E.V.; Goenka, S.; Brownson, R.C. Scaling up Physical Activity Interventions Worldwide: Stepping up to Larger and Smarter Approaches to Get People Moving. Lancet 2016, 24, 1337–1348. [Google Scholar] [CrossRef] [Green Version]
  20. Seoul Metropolitan Government. Community Health Survey of Seoul; Park, N., Ed.; Seoul, Korea, 2018; Available online: http://news.seoul.go.kr/welfare/files/2019/08/5d525dc5520936.58223693.pdf (accessed on 19 December 2021).
  21. Kruger, J.; Ham, S.A.; Berrigan, D.; Ballard-Barbash, R. Prevalence of Transportation and Leisure Walking among U.S. Adults. Prev. Med. 2008, 47, 329–334. [Google Scholar] [CrossRef]
  22. Paterson, D.H.; Warburton, D.E.R. Physical Activity and Functional Limitations in Older Adults: A Systematic Review Related to Canada’s Physical Activity Guidelines. Int. J. Behav. Nutr. Phys. Act. 2010, 7, 1–22. [Google Scholar] [CrossRef] [Green Version]
  23. Tudor-Locke, C.; Craig, C.L.; Brown, W.J.; Clemes, S.A.; De Cocker, K.; Giles-Corti, B.; Hatano, Y.; Inoue, S.; Matsudo, S.M.; Mutrie, N. How Many Steps/Day Are Enough? For Adults. Int. J. Behav. Nutr. Phys. Act. 2011, 8, 1–17. [Google Scholar] [CrossRef] [Green Version]
  24. Eyler, A.A.; Brownson, R.C.; Bacak, S.J.; Housemann, R.A. The Epidemiology of Walking for Physical Activity in the United States. Med. Sci. Sport. Exerc. 2003, 35, 1529–1536. [Google Scholar] [CrossRef] [Green Version]
  25. Sjöström, M.; Oja, P.; Hagströmer, M.; Smith, B.J.; Bauman, A. Health-Enhancing Physical Activity across European Union Countries: The Eurobarometer Study. J. Public Health 2006, 14, 291–300. [Google Scholar] [CrossRef]
  26. Troiano, R.P.; Berrigan, D.; Dodd, K.W.; Mâsse, L.C.; Tilert, T.; Mcdowell, M. Physical Activity in the United States Measured by Accelerometer. Med. Sci. Sports Exerc. 2008, 40, 181–188. [Google Scholar] [CrossRef]
  27. Tudor-Locke, C.; Aguiar, E.J.; Han, H.; Ducharme, S.W.; Schuna, J.M.; Barreira, T.V.; Moore, C.C.; Busa, M.A.; Lim, J.; Sirard, J.R.; et al. Walking Cadence (Steps/Min) and Intensity in 21-40 Year Olds: CADENCE-Adults. Int. J. Behav. Nutr. Phys. Act. 2019, 16, 1–11. [Google Scholar] [CrossRef] [Green Version]
  28. Park, Y.; Chung, H.; Park, S. Changes of Walking Activity During the First Cycle Phases of COVID-19 Pandemic: A Case Study of Seoul, Korea. HERD Health Environ. Res. Des. J. 2021, 14, 43–57. [Google Scholar] [CrossRef] [PubMed]
  29. Bort-Roig, J.; Gilson, N.D.; Puig-Ribera, A.; Contreras, R.S.; Trost, S.G. Measuring and Influencing Physical Activity with Smartphone Technology: A Systematic Review. Sport. Med. 2014, 44, 671–686. [Google Scholar] [CrossRef] [PubMed]
  30. Taylor, K.; Silver, L. Smartphone Ownership Is Growing Rapidly around the World, but Not Always Equally; Pew Research Center: Washington, DC, USA, 2019; pp. 1–47. [Google Scholar]
  31. Schipperijn, J.; Ekholm, O.; Stigsdotter, U.K.; Toftager, M.; Bentsen, P.; Kamper-Jørgensen, F.; Randrup, T.B. Factors Influencing the Use of Green Space: Results from a Danish National Representative Survey. Landsc. Urban Plan. 2010, 95, 130–137. [Google Scholar] [CrossRef]
Figure 1. Area map of Seocho-gu district and its parks.
Ijerph 19 00395 g001
Figure 2. Research Design.
Ijerph 19 00395 g002
Figure 3. Distribution of steps and duration of walking bouts.
Ijerph 19 00395 g003
Figure 4. Map visualization of ‘well-walked parks’.
Ijerph 19 00395 g004
Table 1. Distribution of regular walking by week and sample selection.
CategoryMonitoring (Week)Regular Walking (Week)PeopleSample Selection
Total--n = 22,744Total Population (Group All)
Monitored for entire research period130339Sample of the physically inactive (Group 0)
131314-
132263-
133270-
134309-
135299-
136316-
137353-
138415-
139495-
1310667-
1311907-
13121764-
13135078Sample of the physically active (Group 13)
Monitored less than 13 weeks1~120~1210,955-
Table 2. Comparing average measures of sample groups’ park walking and non-park walking.
SampleActivityPeopleBoutsBouts/Person
(Bout)
Step/Bout
(Step)
Duration/Bout
(Min)
Cadence/Bout
(Step/Min)
Group 0non-park walking339707420.99960.3815.0863.68
park walking595879.951665.9624.5865.64
Group 13non-park walking507895,71819.02984.0115.2565.54
park walking107812,26011.372108.1326.0976.19
Group Allnon-park walking22,744493,58321.7946.8415.3661.64
park walking533856,65110.611820.0724.2972.87
Table 3. Mann–Whitney u tests for two independent sample groups.
TypeMeasuresMedian of
Group 0
Median of
Group 13
UZp-Value
park walkingstep1169 (n = 587)1191.5 (n = 12,260)3,395,179−2.310.02066 *
duration18.9 (n = 587)16.67 (n = 12,260)3,828,5462.620.008719 **
cadence68.07 (n = 587)77.15 (n = 12,260)2,814,828−8.93<0.001 ***
non-park walkingstep643 (n = 7074)647 (n = 95,718)341,006,2741.020.3087
duration11.06 (n = 7074)10.95 (n = 95,718)342,328,0971.570.1171
cadence61.83 (n = 7074)62.75 (n = 95,718)334,338,611−1.750.08002
*** p < 0.001; ** p < 0.01; * p < 0.05.
Table 4. Comparing measures of sample groups’ park walking, categorized by the level of intensity.
SampleIntensityPeople
(n)
Bouts
(n)
Bouts Ratio
(%)
Step
(Step)
Duration
(Min)
Cadence
(Step/Min)
Group 0Light5953991.821490.6924.1461.75
Moderate14467.843271.6330.51107.22
Vigorous220.341284.518.15157.61
Group 13Light1026990680.81590.723.5467.56
Moderate277221118.034119.2737.24110.63
Vigorous511431.174255.6429.99141.92
Group AllLight510948,18085.051566.5623.4065.99
Moderate1364794914.033258.7229.78109.50
Vigorous2055220.923312.2022.81149.50
Table 5. Comparing TOP 20 ‘mostly-walked parks’.
Group AllGroup 0Group 13
Park IDBouts
(n)
Steps
(n)
Duration
(Min)
Cadence
(Steps/Min)
Park IDBouts
(n)
Steps
(n)
Duration
(Min)
Cadence
(Steps/Min)
Park IDBouts
(n)
Steps
(n)
Duration
(Min)
Cadence
(Steps/Min)
park260 ***50581492.3623.7969.26park286 ***1161306.5919.2366.77park260 ***11881644.0622.2573.59
park33044001786.9823.7372park20162769.0219.4340.61park168 ***8411266.6917.5573.35
park300 **33371122.0616.2568.99park272551518.1120.479.3park286 ***8221553.820.9874
park286 ***29331747.9223.7972.2park312 ***332135.5227.2976.6park330 **7182283.2828.2475.28
park168 ***28211162.0318.5266.56park248 *22759.7713.5951.47park300 **692860.4813.0763.87
park259 ***21672300.9929.9575.37park122 ***192526.7430.7480.83park204 **4771027.2114.0776.85
park204 **21261223.5417.8172.52park168 ***17834.7116.9454.69park312 ***4621414.0518.2272.03
park312 ***20221499.3620.1171.01park118 *161930.7530.6169.52park122 ***4002122.1525.2982.92
park122 ***17271877.4524.7373.04park219 ***161483.8820.5367.8park244 **3865363.7450.8494.68
park264 ***16454483.4647.5488.12park267 *1673614.8141.08park119 ***3811245.8815.7872.7
park119 ***14731400.5317.3176.58park211141255.2926.3241.18park264 ***3214180.5444.8486.36
park219 ***11621371.918.9769.04park264 ***145154.2954.6680.23park2072453666.0736.9299.89
park21111581541.8221.469.71park119 ***102093.321.7394.84park2752322154.9922.2887.46
park23010131293.9321.8964.19park260 ***101385.822.959.28park219 ***2281760.8622.8770.41
park281 **9813699.0741.682.98park259 ***91129.6746.3231.32park259 ***2212215.1430.3470.78
park276 ***9473328.6536.0790.3park276 ***92423.1134.573.52park1172164136.7779.7356.63
park133 ***9022475.3931.6373.69park307 *91326.4415.9688.81park276 ***1943696.6138.8388.64
park244 **8863320.6637.7980.27park133 ***84262.1355.9278.95park133 ***1672809.7234.3673.56
park2018222344.5329.1975.4park136 *82902.3832.8486.2park281 **1642803.2133.7471.54
park1307241996.1924.4972.62park314 *8294431.886.47park164138758.9912.1663.3
*** a park common to three groups; ** a park mostly-walked in Group All & Group 13; * a park only listed in Group 0.
Table 6. List of three types of ‘mostly walked parks’ (from Seoul Urban GIS dataset).
CategoryPark IDCodeName
(Translated from Korean)
Facility TypeArea
(m2)
Length
of
Park
(m)
avg.
Slope
(%)
std.
Slope
Length of
Pedestrian
Trail
(m)
TYPE
MWP-3
a park common to three groups
park2603-AYangjae neighborhood parkMulti-purpose park32,52191500779.3
park2863-BNaegok residential area parkMulti-purpose park118,39762953.24.351449.5
park1683-CEastside Yangjae citizen’s forestMulti-purpose park65478902.31.25155.8
park2593-DSeocho Raemian apartment parkNeighborhood park41,43811118.418.821431
park3123-ESeocho Nature Hill parkNeighborhood park98,62545655.676.17204.1
park1223-FDutbeol parkMulti-purpose park58764590070.5
park2643-GYangjae stream parkMulti-purpose park19,25815261.311.36790.5
park1193-HBanpo neighborhood parkMulti-purpose park26,09211107.176.09672.5
park2193-IBanpo 1-dong community centerMulti-purpose park994283200
park2763-JBanpo apartment 1 playgroundMulti-purpose park54833483.082.12137.6
park1333-KWestside Yangjae citizen’s forestMulti-purpose park182,63220910.890.463734
TYPE
MWP-2
a park common to two groups,
Group All & Group 13
park3302-ASeoripool parkMulti-purpose park652,804840915.358.095439.9
park3002-BGomurae children parkMulti-purpose park18,60910073.433.29581.5
park2042-CJamwon parkMulti-purpose park12,96311620.770.18512
park2812-DNew Banpo parkNeighborhood park13,61010350.890.54392.1
park2442-EDogu-meori parkMulti-purpose park70,338139015.436.931333.2
TYPE
MWP-1
a park which is only listed in
Group 0
park2721-AGaon children parkChildren park30243968.055.8312.1
park1181-BMido children parkMulti-purpose park9881273.221.71
park1361-CCulture and art parkMulti-purpose park74,38512681.662.141429.9
park3071-DSeoul Human Resources InstituteMulti-purpose park24,121140710.074.36502.7
park2671-ESeocho stadium parkSports park18,27810664.43.9360.8
park2481-FBon-maeul children parkMulti-purpose park89212400
park3141-GBangbae neighborhood parkMulti-purpose park265,020249017.627.37362.7
Table 7. Prevalent intensity of parks, finding ‘intensely-walked park’.
CategoryGroup AllGroup 13
Type-MWPPark IDCodeLPA
(n)
LPA
(%)
MVPA
(n)
MVPA
(%)
Prevalent Intensity
(avg.
= 14.95%)
LPA
(n)
LPA
(%)
MVPA
(n)
MVPA
(%)
Prevalent Intensity
(avg.
= 19.20%)
MWP-3park2603-A362187.60%51412.40%L86682.60%18217.40%L
park2863-B149689.50%17610.60%L40588.60%5211.40%L
park1683-C243191.00%2399.00%L61786.70%9513.30%L
park2593-D98886.30%15713.70%L16675.10%5524.90%MV
park3123-E134790.30%1449.70%L32088.90%4011.10%L
park1223-F142783.00%29317.10%MV29675.30%9724.70%MV
park2643-G99668.30%46331.80%MV23677.40%6922.60%MV
park1193-H105385.80%17414.20%L34690.80%359.20%L
park2193-I92990.40%999.60%L17583.70%3416.20%L
park2763-J56666.10%29033.90%MV9367.40%4532.60%MV
park1333-K49886.60%7713.40%L12687.50%1812.50%L
MWP-2park3302-A362887.00%54213.00%L52181.40%11918.60%L
park3002-B287491.20%2768.70%L64495.50%304.50%L
park2042-C170388.50%22111.50%L30286.80%4613.20%L
park2812-D36184.30%6715.60%MV7591.50%78.50%L
park2442-E68176.90%20523.20%MV14357.20%10742.80%MV
MWP-1park2721-A41280.80%9819.20%MV9267.20%4532.80%MV
park1181-B39594.50%235.50%L9097.80%22.20%L
park1361-C15381.40%3518.60%MV1292.30%17.70%L
park3071-D13565.20%7234.80%MV5058.10%3641.80%MV
park2671-E20591.50%198.40%L13100.00%00.00%L
park2481-F6677.60%1922.40%MV956.30%743.80%MV
park3141-G27490.40%299.50%L8885.40%1514.60%L
Table 8. Parks grouped by the prevalent intensity of Group All and Group 13.
Prevalent Intensity
(Group All/Group 13)
L/LL/MVMV/LMV/MV
Counts13127
park code3-A3-D2-D3-F
3-B 1-C3-G
3-C 3-J
3-E 2-E
3-H 1-A
3-I 1-D
3-K 1-F
2-A
2-B
2-C
1-B
1-E
1-G
Publisher’s Note: MDPI stays neutral with regard to jurisdictional claims in published maps and institutional affiliations.

