
Research on Transfer Optimization Model of County Transit Network

Abstract
1. Introduction
2. The Transfer Optimization Model of County Transit Network
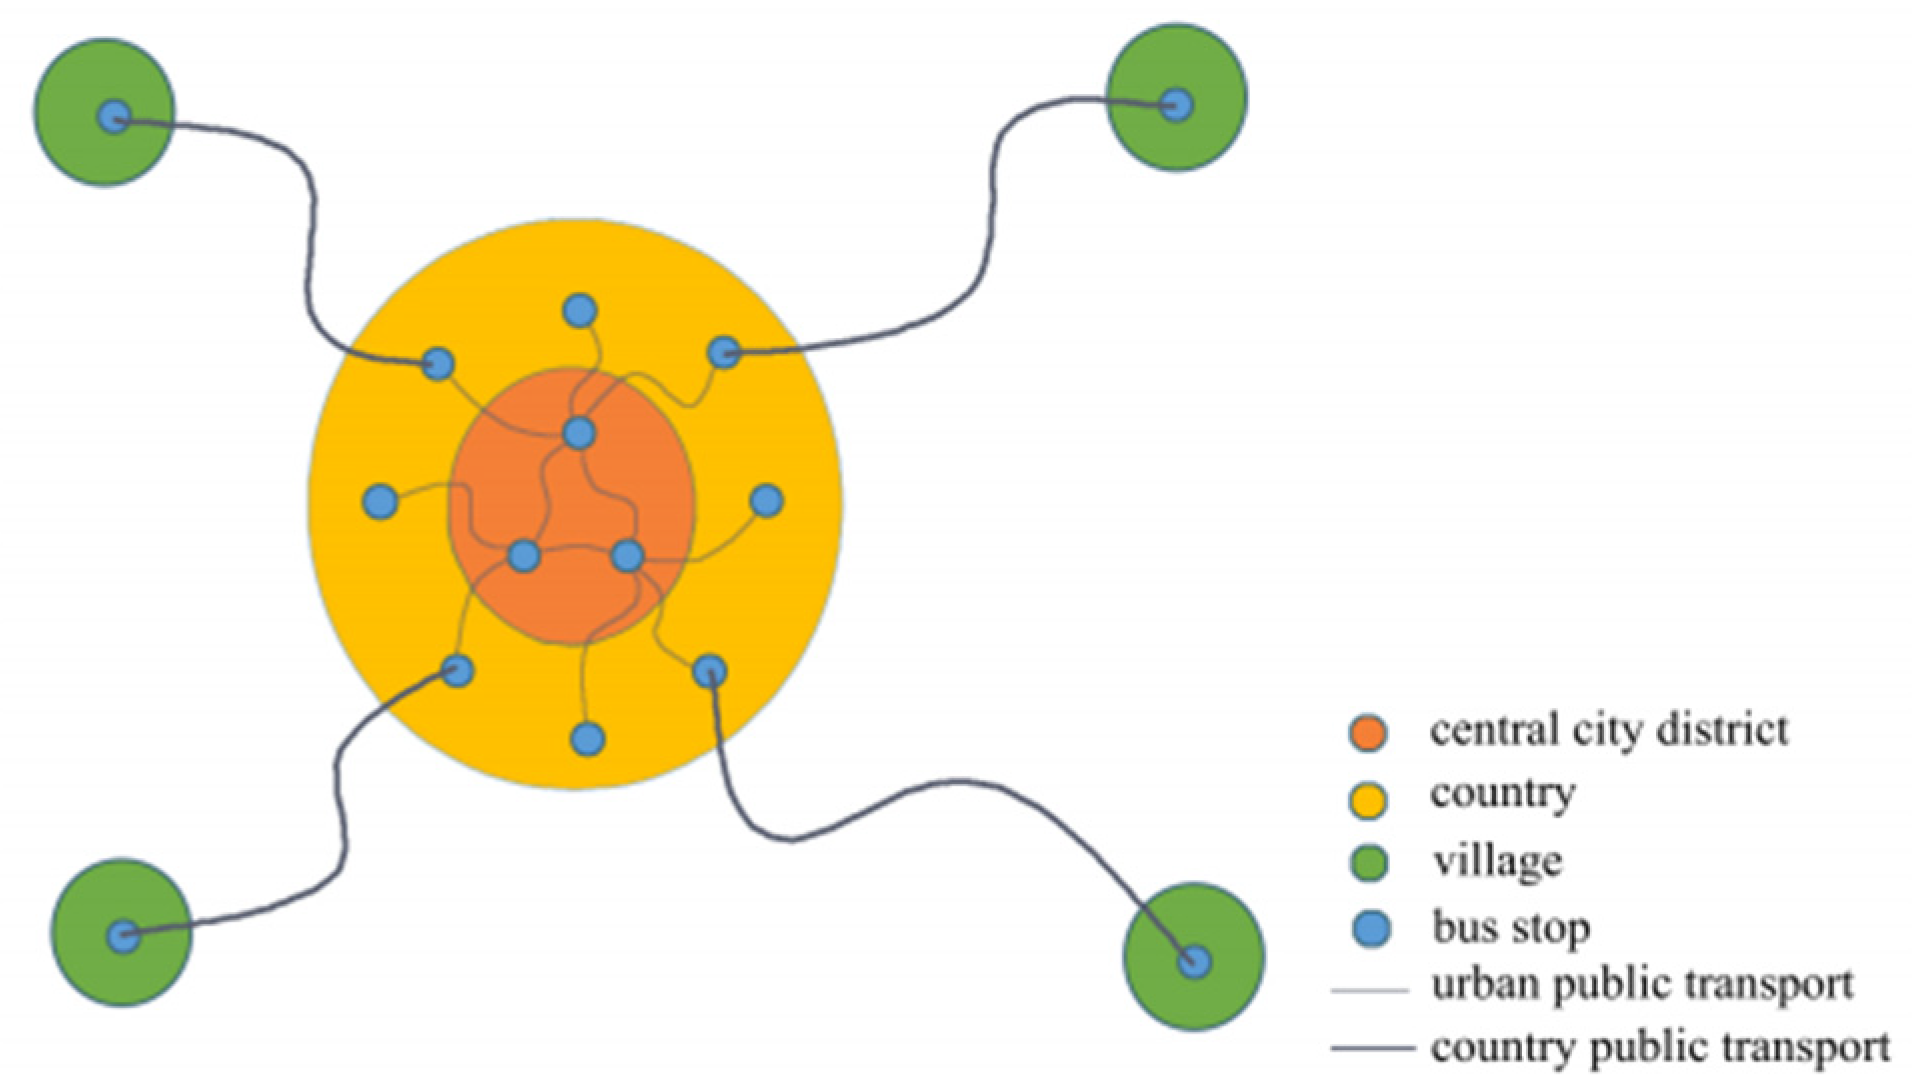
2.1. The Mode Selection of County Transit Layout
2.2. Notations
2.3. Model Formulation
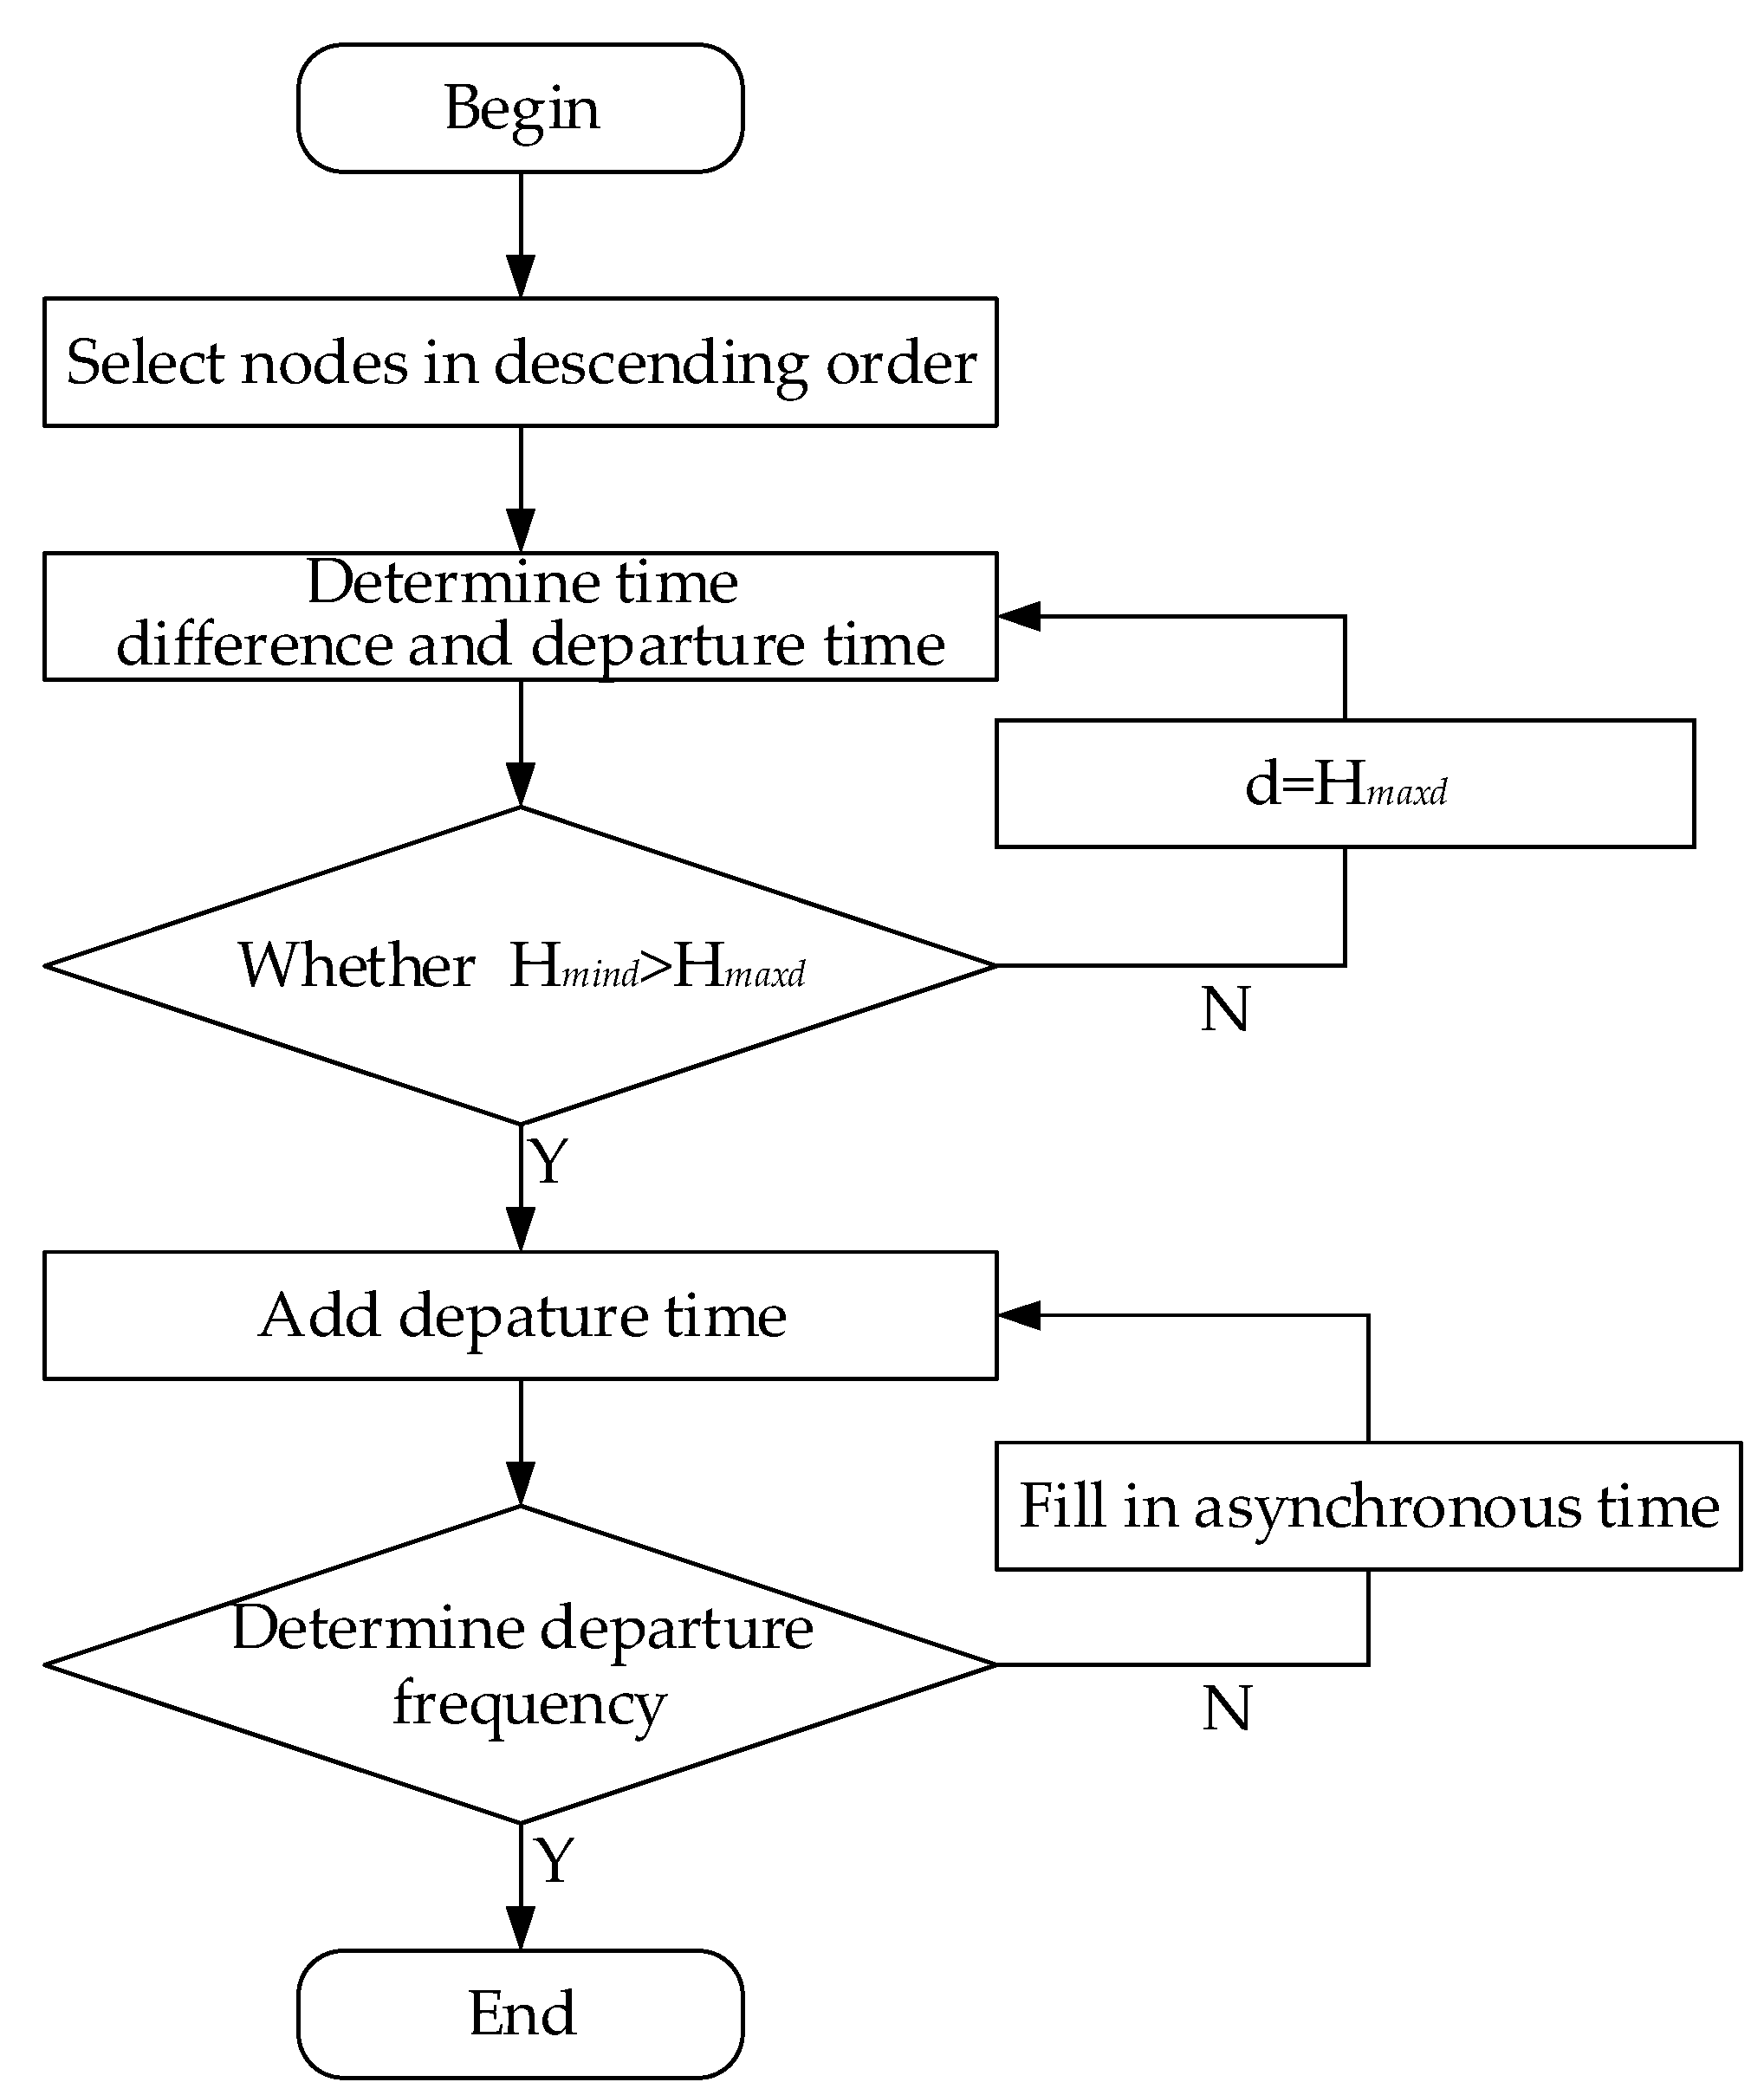
3. Intelligent Optimization Algorithm
- Step 1: Node selection.
- Step 2: Time difference and departure time determinations.
- (i)
- If , two lines cannot form a stable difference and can only set the first traveling time. The shorter traveling time is set to 0 and the other lines’ departure time is set to meet at the node.
- (ii)
- If , is chosen as the stable difference of two buses at the same line. is added to the first departure time to ensure each bus meets at the same node, which maximizes the number of encounters. When accumulation reaches the maximum number, departure times and numbers of simultaneous arrival are recorded.
- Step 3: Departure time addition
- (i)
- Add a line departure time and set the first departure time to ensure at least one simultaneous arrival. Then, select the appropriate time interval between the minimum and maximum time interval to form at least one simultaneous arrival. If this is impossible, select the minimum time interval to do the accumulation.
- (ii)
- Add both lines’ departure time, then add the synchronization time as in step 2.
- Step 4: Departure frequency determination
- (i)
- The bus line schedule has large time gaps. Then, appropriate time points are added between gaps.
- (ii)
- The bus line schedule does not have large time gaps. Then, fill in the minimum departure interval in the end, which can satisfy departure frequency or reach the edge of the optimization interval.
- (iii)
- When many unset departure times still exist at the edge of the optimization interval, the last departure time will be removed, and the departure interval will be shortened to reschedule the bus timetable until the schedule is complete.
4. Case Study
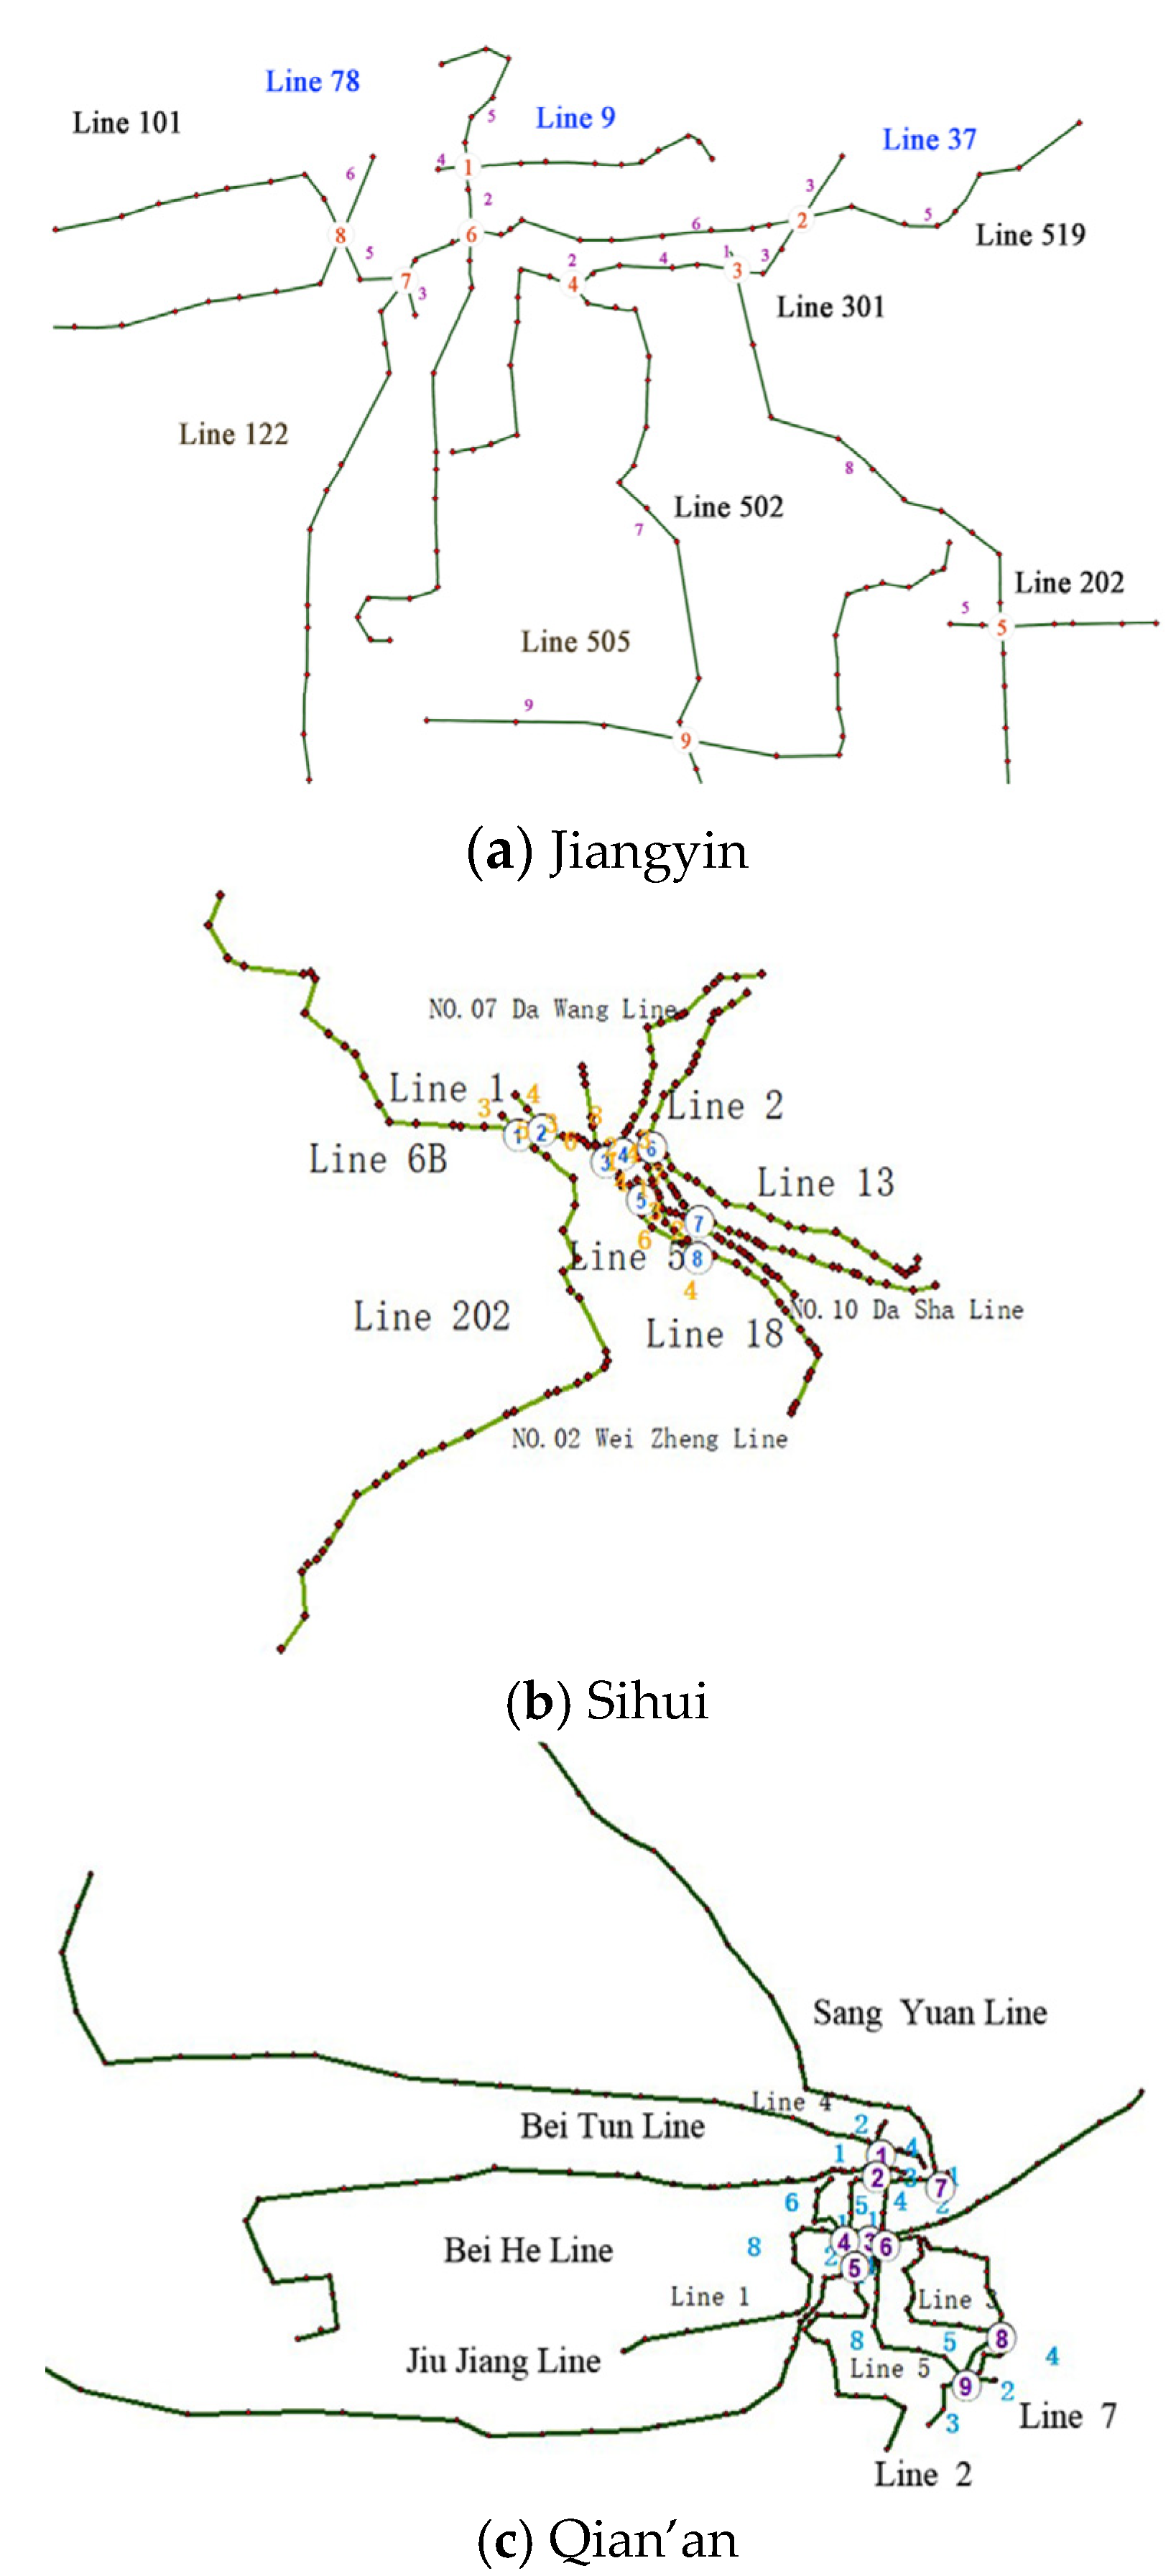
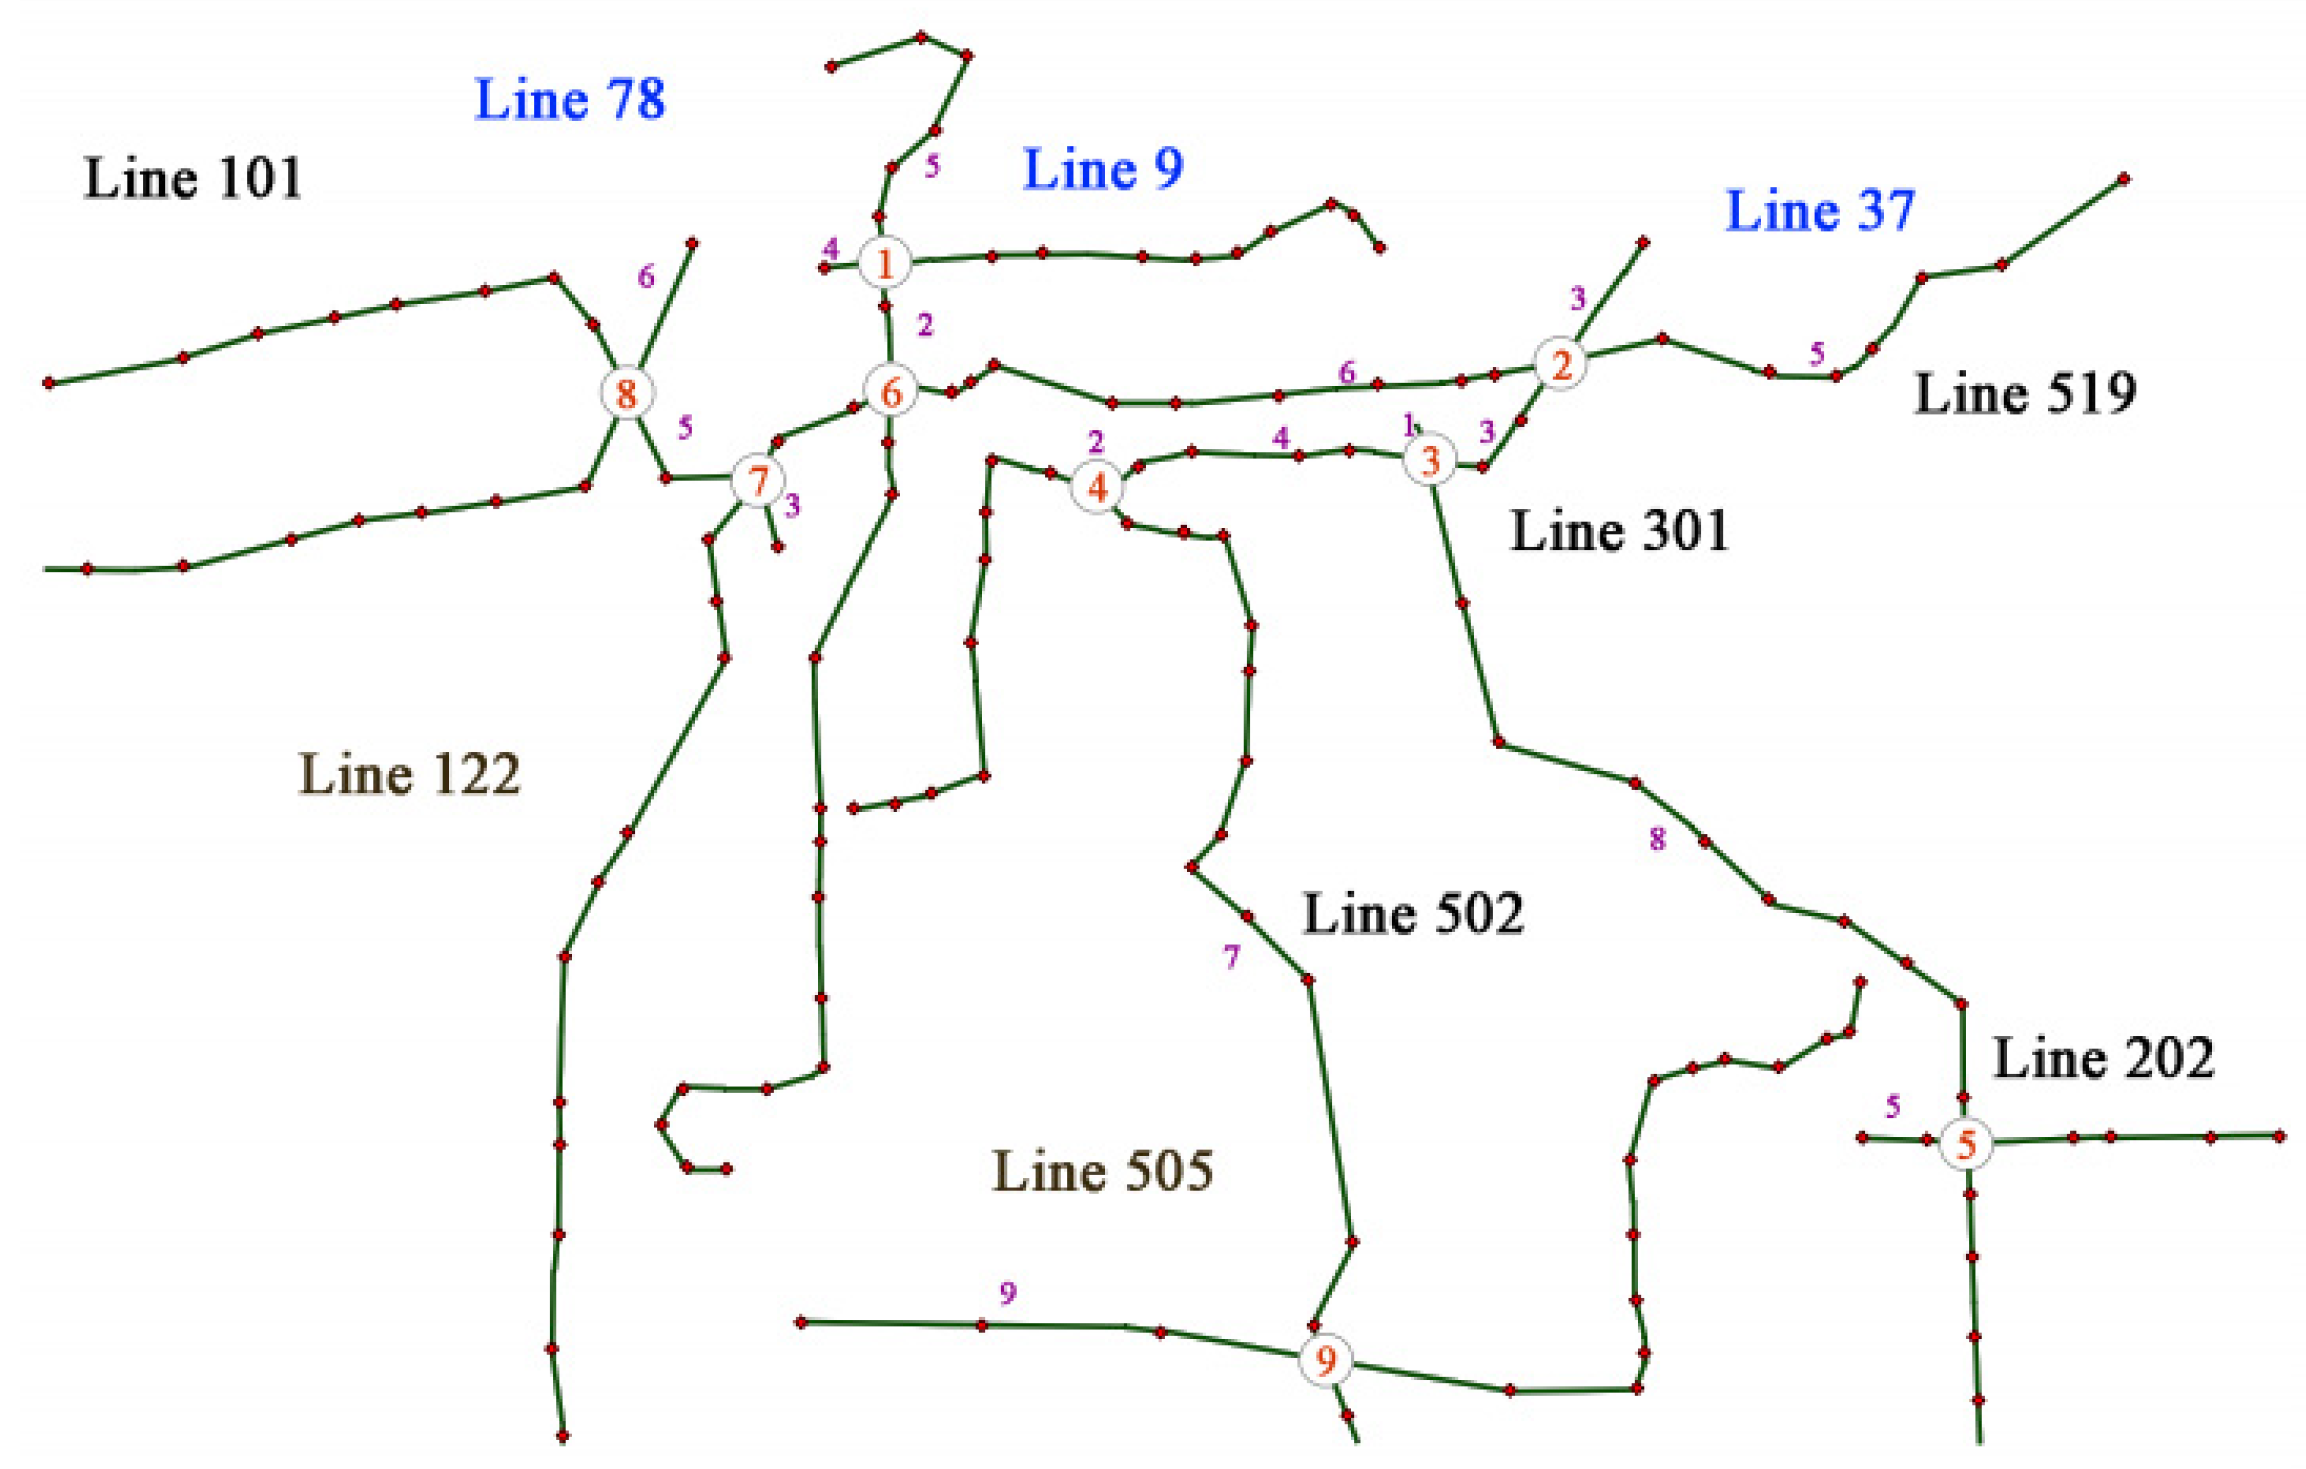
4.1. Example Network Configuration
4.2. Case Calculation
- Step 1: Node selection:
- Step 2: Time difference and departure time determinations:
- Node ① takes the time difference d = 6. Departure times of Line 78 are 0, 6, 12, 18, 24, 30, 36, and Line 5 are 1, 7, 13, 19, 25, 31, 37, 43, 49. Synchronization time S = 5.
- Node ② takes the time difference d = 10. Departure times of Line 519 are 0, 10, 20, 30, 40, and Line 37 are 2, 12, 22, 32, 42, 52. Synchronization time S = 7 + 5 = 12.
- Node ⑤ takes the time difference d = 12. Departure time of Line 301 are 0, 12, 24, 36, 48, and Line 37 are 4, 16, 28, 40. Synchronization time S = 12 + 4 = 16.
- Node ③ is the node of line 37 and line 301, and the departure time of both lines has been set without simultaneous arrival. The number of synchronization S remains 16.
- Node ⑧ takes the time difference d = 12. Departure times of Line 101 are 0, 12, 24, 36, 48, and Line 122 are 2, 14, 26, 38. Synchronization time S = 16 + 4 = 20.
- Node ⑨ takes the time difference d = 10. Departure times of Line 505 are 0, 10, 20, 30, 40, and Line 502 are0, 10, 20, 30, 40, 50. synchronization time S = 20 + 5 = 25.
- Node ④ is the node of line 37 and line 502, and the departure time of both lines has been set with 5 simultaneous arrives. Synchronization time S = 25 + 5 = 31.
- Node ⑥ is the node of line 78 and line 519, and the departure time of both lines has been set with 1 simultaneous arrive. Synchronization time S = 30 + 1 = 31.
- Node ⑦ is the node of line 101 and line 519, and the departure time of both lines has been set without simultaneous arrival. The number of synchronization S remains 31.
- Step 3: Departure time addition:
- Step 4: Departure frequency determination:
4.3. Results and Discussions
- (1)
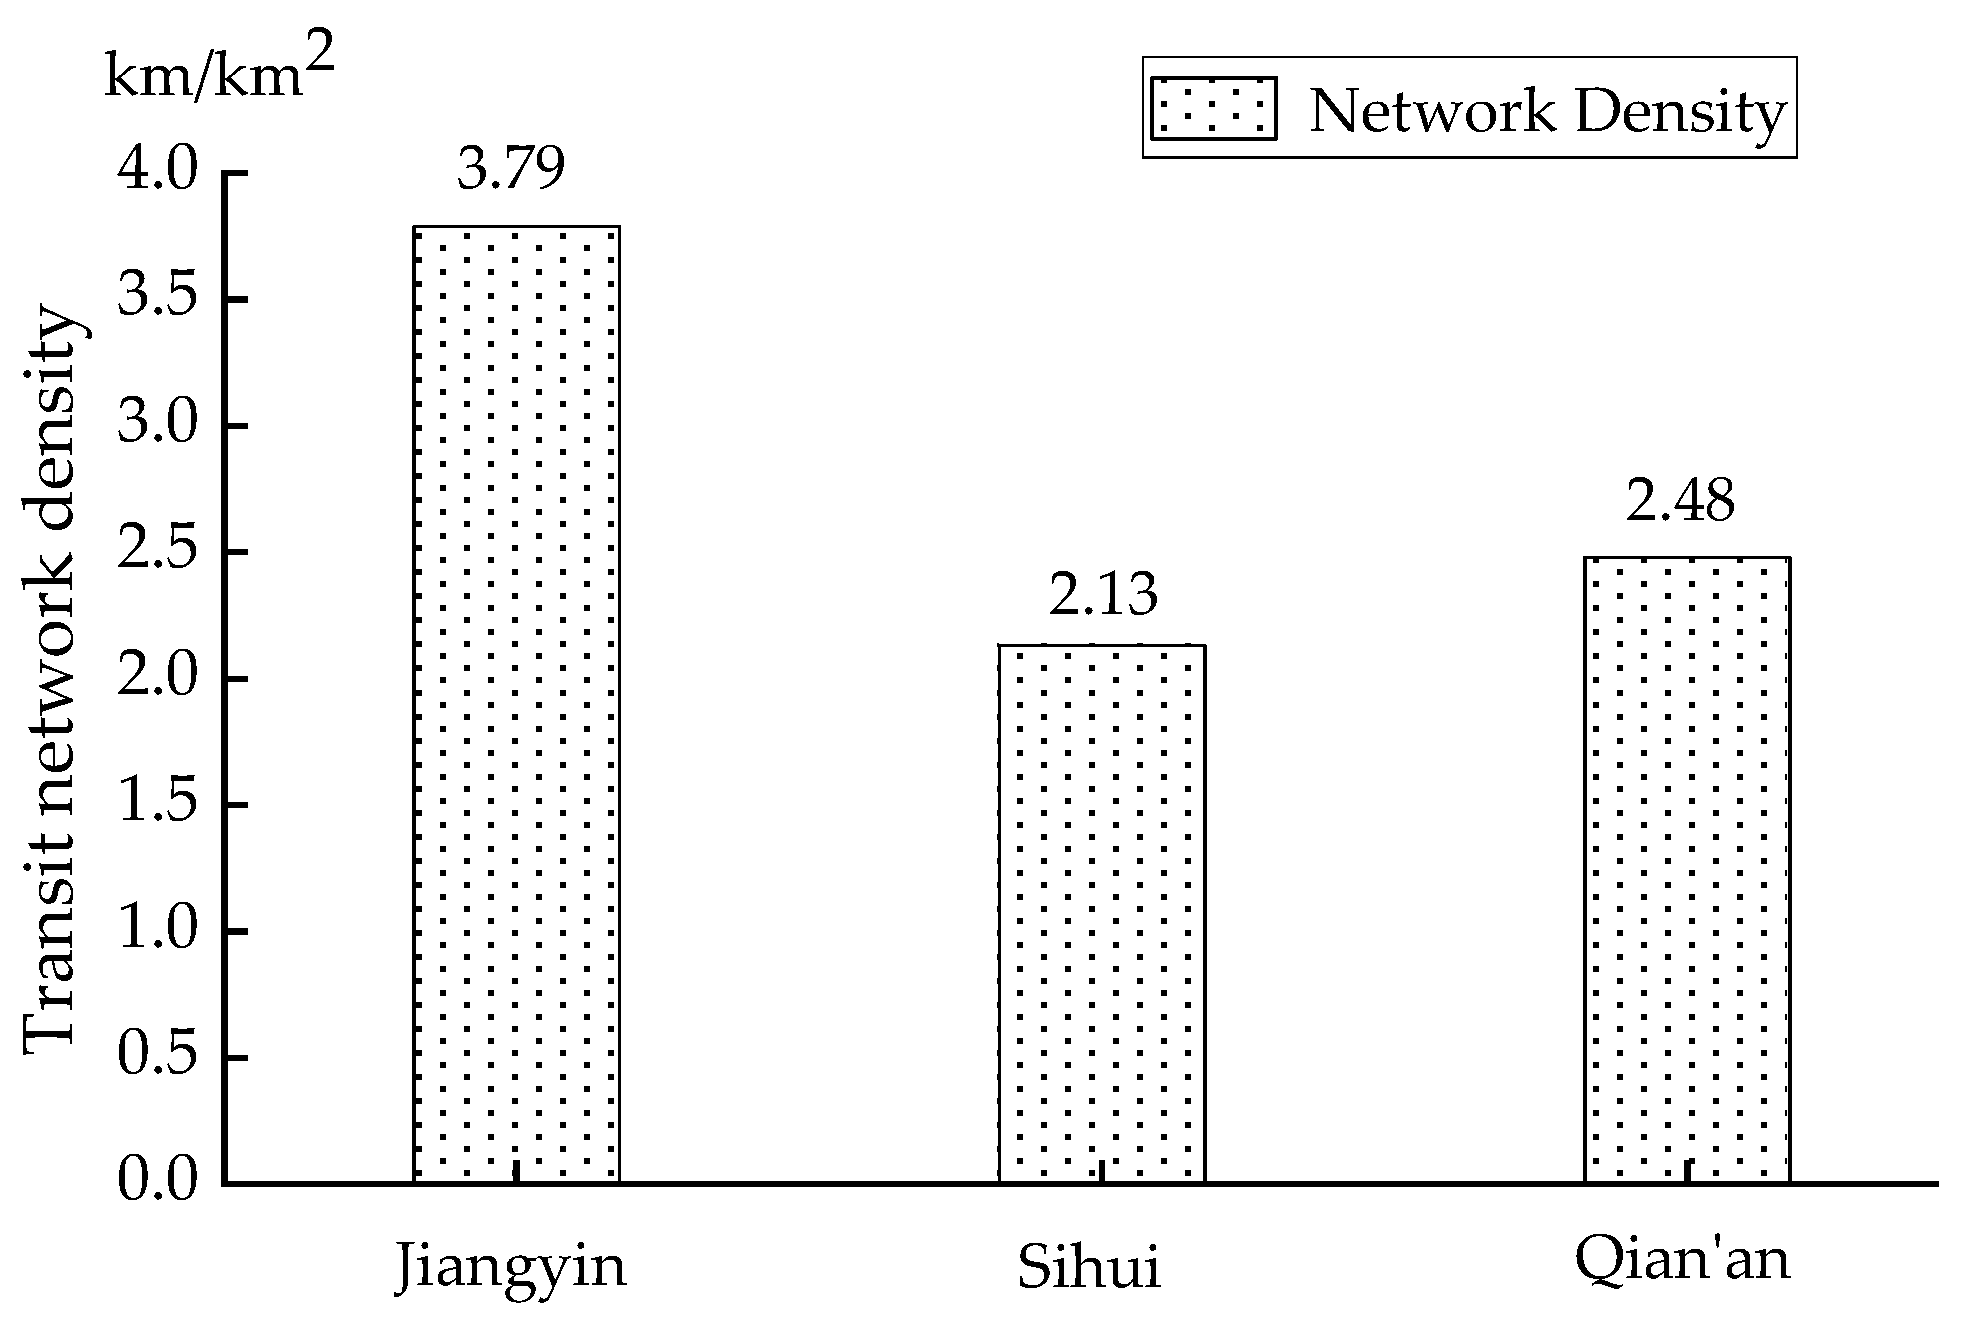
- Transit network density
- (2)
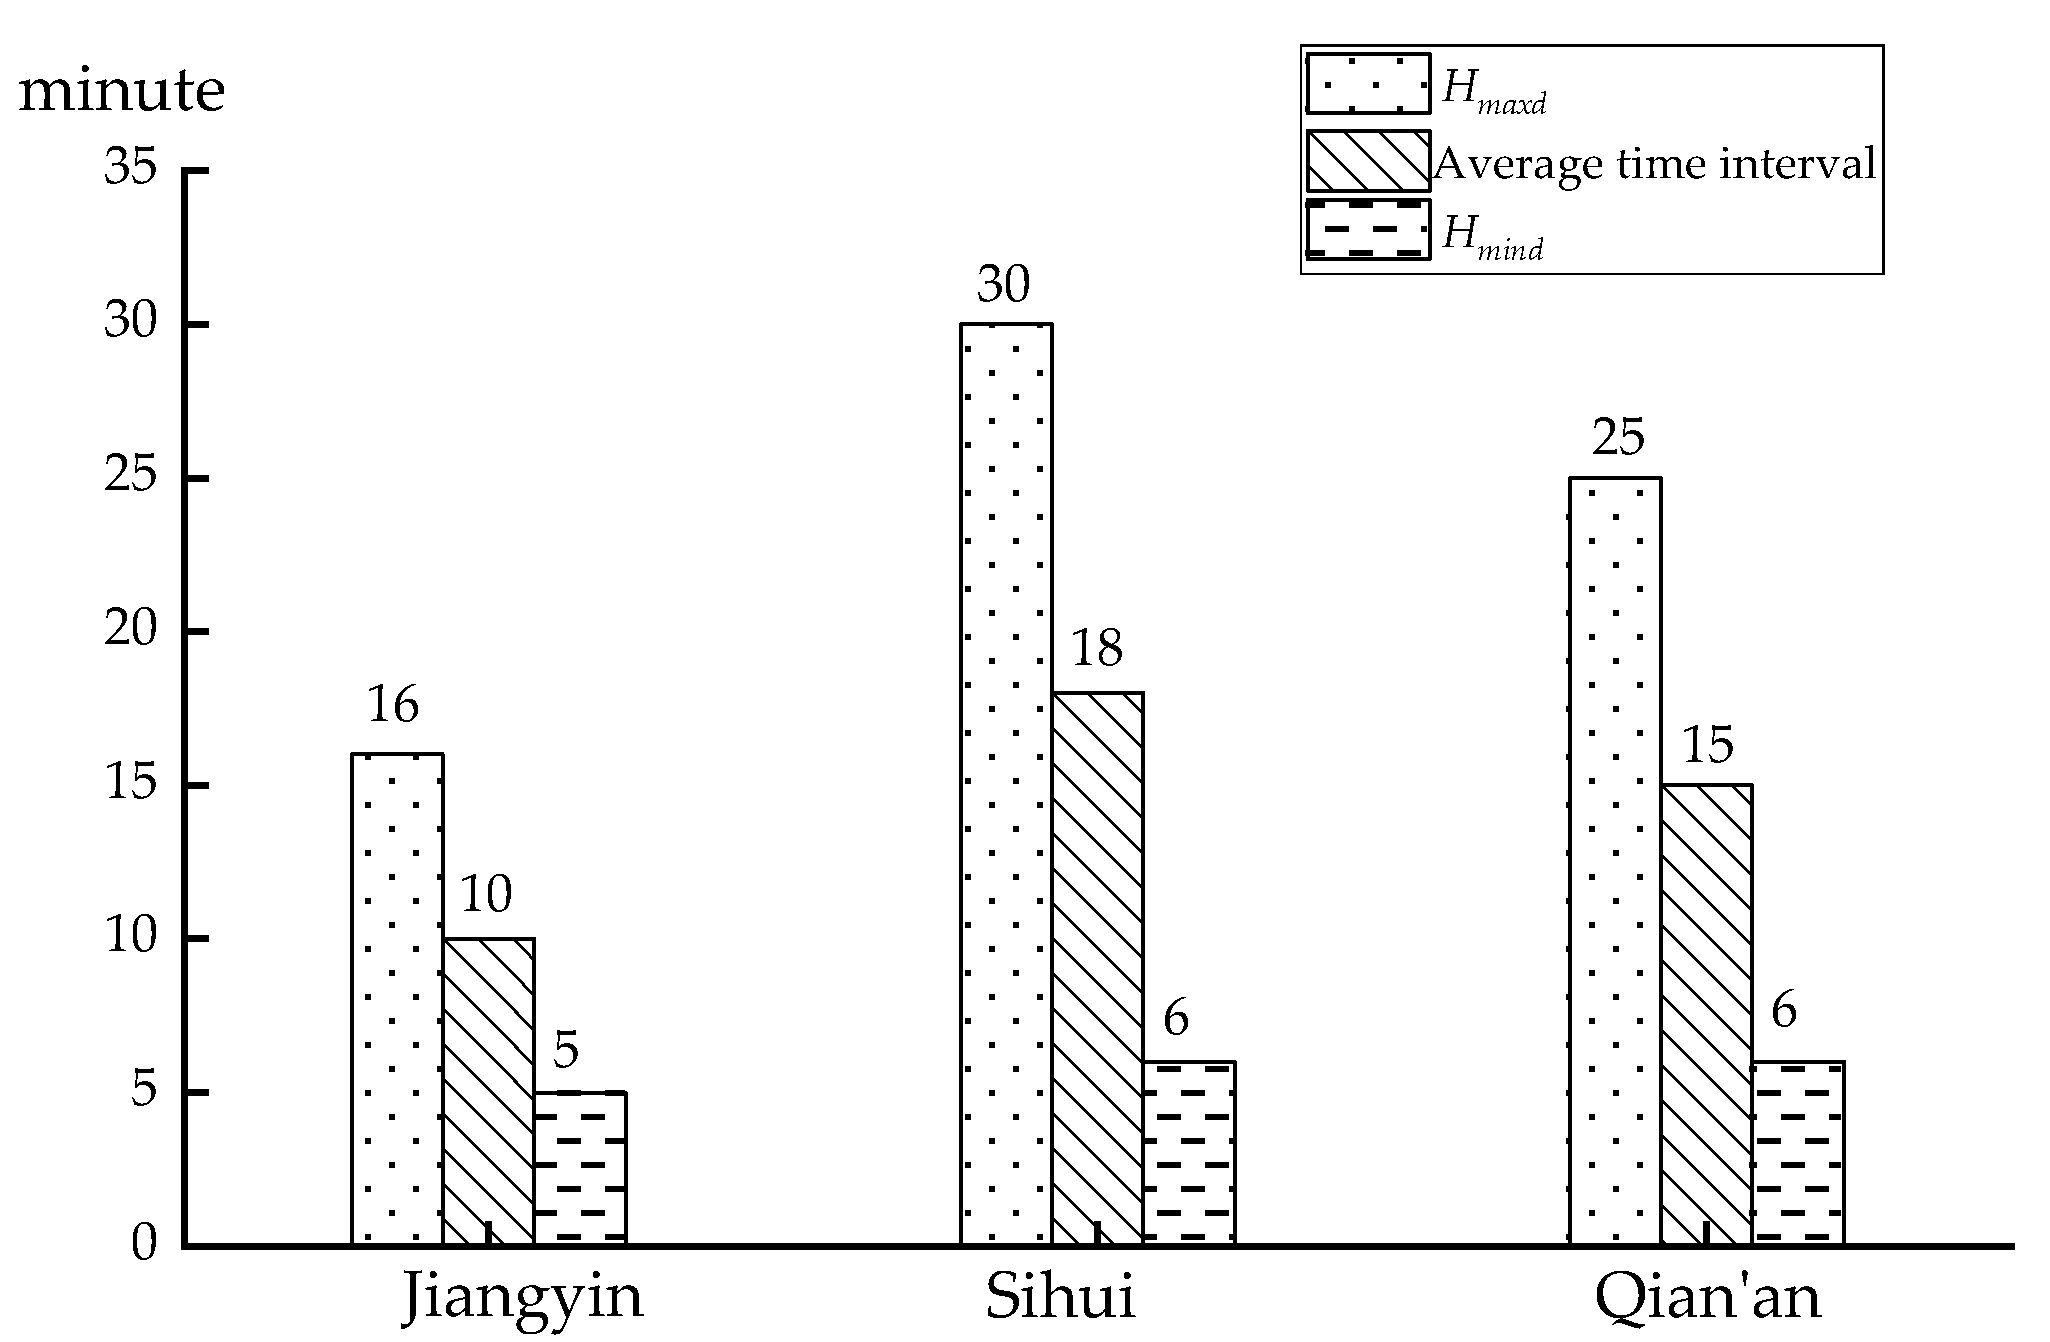
- Departure interval
- (3)
- Population size of counties:
- (4)
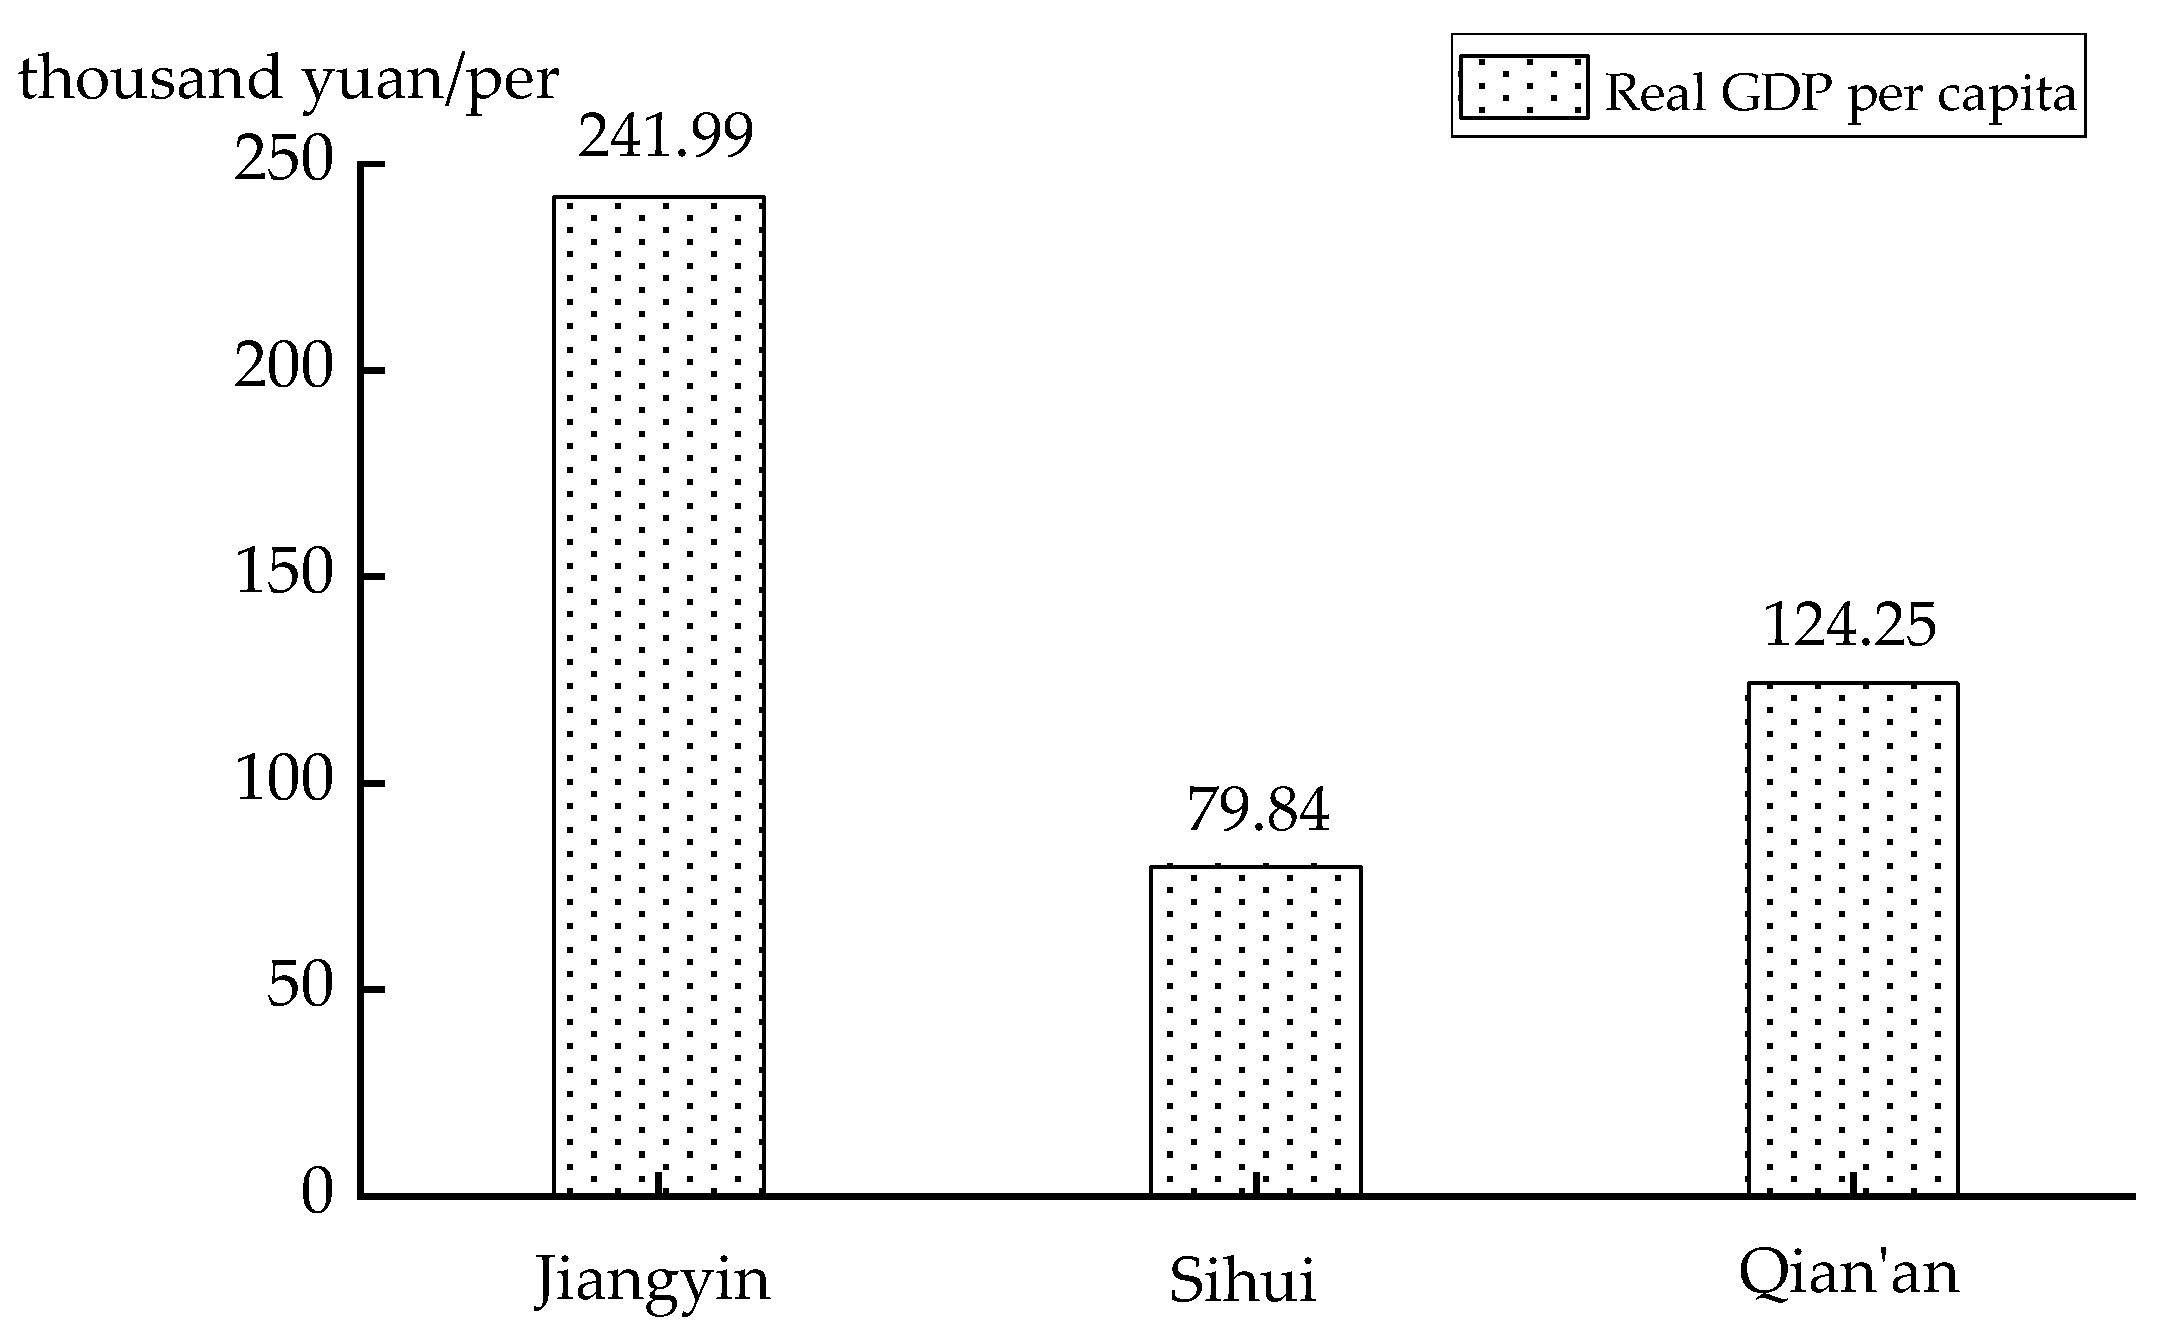
- Economic development level:
5. Conclusions
Author Contributions
Funding
Institutional Review Board Statement
Informed Consent Statement
Data Availability Statement
Conflicts of Interest
References
- Holroyd, E.M. The optimum bus service: A theoretical model for a large uniform urban area. In Proceedings of the Third International Symposium on the Theory of Traffic Flow, New York, NY, USA, June 1965; pp. 308–328. Available online: https://trid.trb.org (accessed on 4 February 2021).
- Byrne, B.F. Public transportation line positions and headways for minimum user and system cost in a radial case. Transp. Res. 1975, 9, 97–102. [Google Scholar] [CrossRef]
- Guan, J.F.; Hai, Y.; Wirasinghe, S.C. Simultaneous optimization of transit line configuration and passenger line assignment. Transp. Res. Part B Methodol. 2006, 40, 885–902. [Google Scholar] [CrossRef]
- Szeto, W.Y.; Jiang, Y. Transit route and frequency design: Bi-level modeling and hybrid artificial bee colony algorithm approach. Transp. Res. Part B Methodol. 2014, 67, 235–263. [Google Scholar] [CrossRef]
- Fan, L.; Mumford, C.L. A metaheuristic approach to the urban transit routing problem. J. Heuristics 2010, 16, 353–372. [Google Scholar] [CrossRef]
- Ahmed, L.; Mumford, C.; Kheiri, A. Solving urban transit route design problem using selection hyper-heuristics. Eur. J. Oper. Res. 2019, 274, 545–559. [Google Scholar] [CrossRef]
- Lampkin, W.; Saalmans, P.D. The design of routes, service frequencies, and schedules for a municipal bus undertaking: Acase study. J. Oper. Res. Soc. 1967, 18, 375–397. [Google Scholar] [CrossRef]
- Newell, G.F. Dispatching policies for a transportation route. Transp. Sci. 1971, 5, 91–105. [Google Scholar] [CrossRef]
- Xiang, W.; Xiu, C.G.; Zhi, B.G.; Tu, F.Q. Research on the overall arrangement and linking up mode of the urban public transit network. Mod. Transp. Technol. 2005, 4, 68–71. [Google Scholar]
- Song, C. Research on Development Planning of Urban and Rural Public Passenger Transportation in the County. Ph.D. Thesis, Chang’an University, Shanxi, China, 2011. [Google Scholar]
- Luo, X.X. Study on county-rural transit network planning-cang nan county as an example. Rural Econ. Sci. Technol. 2015, 7, 223–224+195. [Google Scholar]
- Zhang, Y.; Zhang, H.Q. Graphical practice and exploration of rural passenger transport networks. Math. Pract. Theory 2006, 2, 198–206. [Google Scholar]
- Baaj, M.H.; Mahmassani, H.S. Hybrid route generation heuristic algorithm for the design of transit networks. Transp. Res. Part C Emerg. Technol. 1995, 3, 31–50. [Google Scholar] [CrossRef]
- Martinez, H.; Mauttone, A.; Urquhart, M.E. Frequency optimization in public transportation systems: Formulation and metaheuristic approach. Eur. J. Oper. Res. 2014, 236, 27–36. [Google Scholar] [CrossRef]
- Jie, Y.; Feng, X.; Xie, Z.; Liu, Y.; Zhu, X. Optimization Research on Public Transit Network Based on Travel Efficiency Improvement. J. Wuhan Univ. Technol. 2018, 42, 263–273. [Google Scholar] [CrossRef]
- An, S.; Cui, W.; Wang, J. Bus area timetable optimization method based on interchange window. Highw. Automot. Appl. 2015, 5, 57–61. [Google Scholar] [CrossRef]
- Zhu, W.F. Research on Optimization of Bus Departure Timetable Scheduling Base on Dynamic Programming. Master’s Thesis, Beijing Jiaotong University, Beijin, China, 2015. [Google Scholar]
- Yin, W.; Zuo, Z.; Zhang, Y.; Niu, S. Research on Optimization Method of Bus Departure Interval in Vehicle Network Environment. J. Dalian Jiaotong Univ. 2018, 39, 7–11. [Google Scholar]
- Lou, X.L.; Jiang, Y.S. Synchronous Optimization of Transit Network and Frequency for Small and Medium-sized Cities. Ind. Eng. J. 2017, 20, 25–30. [Google Scholar] [CrossRef]
- Ten, J.; Lin, L.; Chen, T. Optimizing the Combination of Timetable and Vehicle Scheduling for Pure Electric Buses. J. Tongji Univ. 2019, 47, 1748–1755. [Google Scholar]
- Ren, J.; Peng, M.B.; Zhang, N. Departure timetable adjustment of commuters-based single bus line. J. Hebei Univ. Technol. 2019, 48, 53–59. [Google Scholar]
- Jiang, Z.B.; Gu, J.J. Compilation of Regional Timetable Based on Transit Network Layout. J. Highw. Transp. Res. Dev. 2016, 33, 113–117. [Google Scholar] [CrossRef]
- Ran, X.C.; Chen, S.K.; Chen, L.; Jia, W.Z. An Energy-efficient Timetable Optimization Method for Metro Operation Considering Spatial Distribution of Passenger Flow. J. Transp. Syst. Eng. Inf. Technol. 2020, 20, 103–110. [Google Scholar]
- Gu, J.J.; Jiang, Z.B. An Optimization of Bus Timetable During Peak Periods Based on Forecasts Passenger Flow Using Neural Network. J. Transp. Inf. Saf. 2017, 35, 109–114. [Google Scholar] [CrossRef]
- Hu, B.-Y.; Zhao, H.; Sun, X.-L.; Wang, D.-X.; Liu, N. Synchronous Transfer Model between Bus Lines and Rural Passenger Lines. J. Highw. Transp. Res. Dev. (Engl. Ed.) 2019, 36, 144–150. [Google Scholar] [CrossRef]


| Transit Mode | Network Layout | Traffic Pressure | Directness | Service Level | Organizational Difficulty |
|---|---|---|---|---|---|
| Radius linear | connects city and city outlying | increases pressure on the central city | high | high | low |
| Pulling-through | a connection between towns | increases pressure on the central city and route repetition | high | long routes; provides low services | high, increase operating cost |
| End-point connection | connects villages and city outlying, then transfers into the city | no press on the central city | low | high | low |
| Symbol | Definition |
|---|---|
| Set of the country transit network; | |
| Set of arc meaning the traveling path of the bus line; | |
| Set of transfer nodes; | |
| N | Number of transfer nodes; |
| T | Set of optimization time in the interval [0,T]; |
| z | Bus line Level in country, city bus z = 1; town bus z = 2; village bus z = 3. |
| Number of bus line; | |
| Number of bus line-level ; | |
| minimum and maximum of the departure interval of bus line and the departure time must in ; | |
| Number of departures for line during the interval [0,T]; | |
| Traveling time from starting point in line of level to node x. Not passing node x is represented by ; | |
| The departure time of the bus in line of level ; | |
| , if line of level meets line of level at node x, the variable is 1; otherwise, it yields the value 0. | |
| 0–1 variable, when the bus in line of level meets the bus in line of level at node , it yields the value 1; otherwise, the variable is 0; when , , otherwise, it yields the value 0. |
| Country | City Cluster | Contain Towns | Population (Million) | Line Classification and Number |
|---|---|---|---|---|
| Jiangyin | Yangtze River Delta | 9 | 126.41 | City Lines 8 Town Lines 25 Village Lines 72 |
| Sihui | Pearl River Delta | 10 | 49.73 | City Lines 22 Town Lines 11 |
| Qian’an | Beijing-Tianjin-Hebei | 17 | 77.7 | City Lines 17 Town Lines 20 |
| Line Level | Line Number | Setting Parameters | ||
|---|---|---|---|---|
| Departure Frequency | ||||
| City Lines | 9 | 5 | 8 | 8 |
| 37 | 7 | 10 | 6 | |
| 78 | 6 | 8 | 7 | |
| Town Lines | 101 | 10 | 12 | 5 |
| 202 | 12 | 16 | 4 | |
| 301 | 8 | 12 | 6 | |
| 502 | 6 | 10 | 6 | |
| 519 | 10 | 12 | 5 | |
| Village Lines | 122 | 12 | 15 | 4 |
| 505 | 10 | 13 | 5 | |
| Line Level | Line Number | Departure Time | |||||||
|---|---|---|---|---|---|---|---|---|---|
| City Lines | 9 | 1 | 7 | 13 | 19 | 25 | 31 | 37 | 43 |
| 37 | 2 | 12 | 22 | 32 | 42 | 52 | |||
| 78 | 0 | 6 | 12 | 18 | 24 | 30 | 36 | ||
| Country Lines | 101 | 0 | 12 | 24 | 36 | 48 | |||
| 202 | 4 | 16 | 28 | 40 | |||||
| 301 | 0 | 12 | 24 | 36 | 48 | 57 | |||
| 502 | 0 | 10 | 20 | 30 | 40 | 50 | |||
| 519 | 0 | 10 | 20 | 30 | 40 | ||||
| Village Lines | 122 | 2 | 14 | 26 | 38 | ||||
| 505 | 0 | 10 | 20 | 30 | 40 | ||||
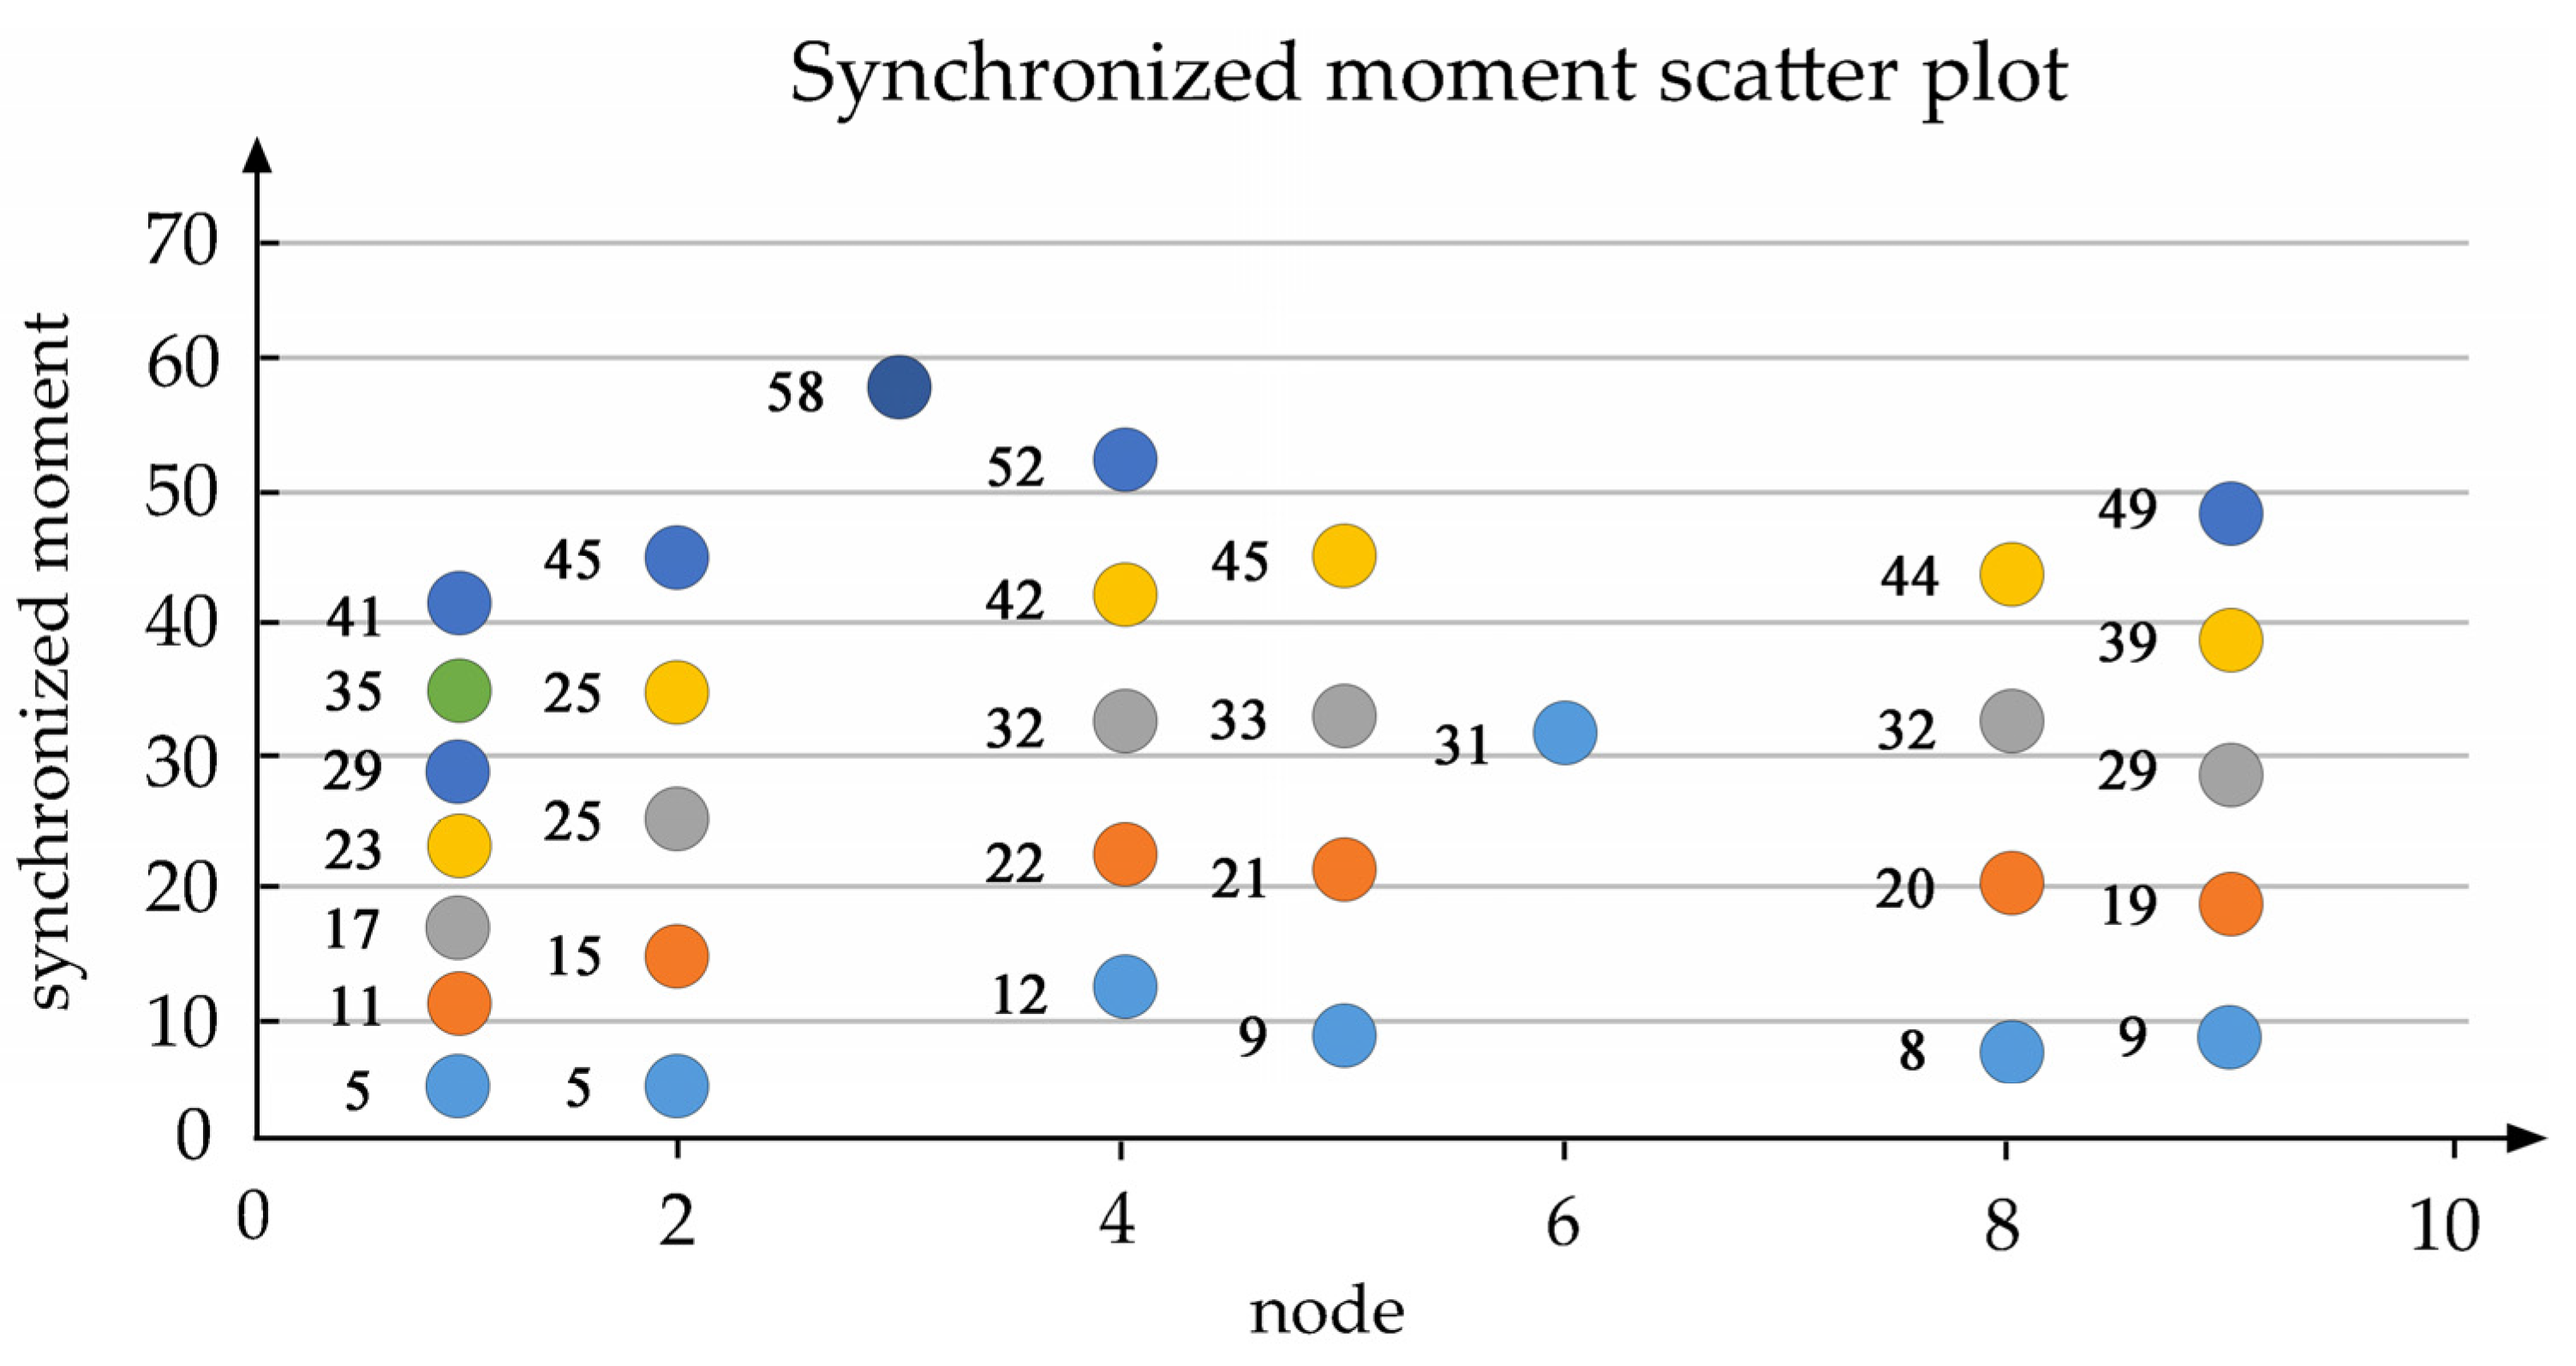
| Synchronized Time (Node) | |||
|---|---|---|---|
| 4 (①,②) | 8 (⑧) | 9 (⑤,⑨) | 11 (①) |
| 12 (④) | 15 (②) | 17 (①) | 19 (⑨) |
| 20 (⑧) | 21 (⑤) | 22 (④) | 23 (①) |
| 25 (②) | 29 (①,⑨) | 31 (⑥) | 32 (④,⑧) |
| 33 (⑤) | 35 (①,②) | 39 (⑨) | 41 (①) |
| 42 (④) | 44 (⑧) | 45 (②,⑤) | 49 (⑨) |
| 52 (④) | 58 (③) | ||
| Line Level | Line Number | Departure Time | ||||||
|---|---|---|---|---|---|---|---|---|
| City Lines | 1 | 0 | 10 | 20 | 30 | 40 | 50 | 60 |
| 2 | 0 | 12 | 24 | 32 | 39 | 46 | ||
| 5 | 2 | 12 | 22 | 32 | ||||
| 6B | 1 | 11 | 21 | 31 | 41 | |||
| 13 | 3 | 19 | 35 | |||||
| 18 | 3 | 9 | 15 | 21 | 27 | 33 | ||
| 202 | 6 | 20 | 34 | 48 | ||||
| Country Lines | NO.02Weizheng line | 0 | 13 | |||||
| NO.07Dawang line | 1 | 13 | 25 | |||||
| NO.10Dasha line | 15 | 30 | 45 | 60 | ||||
| Line Level | Line Number | Departure Time | |||||||
|---|---|---|---|---|---|---|---|---|---|
| City Lines | 1 | 8 | 13 | 20 | 27 | 34 | 41 | 48 | 55 |
| 2 | 1 | 10 | 19 | 28 | 37 | 46 | |||
| 3 | 0 | 9 | 18 | 27 | |||||
| 4 | 0 | 14 | 28 | 42 | 56 | ||||
| 5 | 2 | 17 | 32 | ||||||
| 7 | 4 | 13 | 22 | 31 | 40 | 49 | |||
| Country Lines | Binhe line | 0 | 14 | 28 | |||||
| Sangyuan line | 13 | 38 | |||||||
| Beitun line | 12 | 26 | 40 | ||||||
| Jiujiang line | 6 | 21 | 36 | 47 | |||||
Publisher’s Note: MDPI stays neutral with regard to jurisdictional claims in published maps and institutional affiliations. |
© 2021 by the authors. Licensee MDPI, Basel, Switzerland. This article is an open access article distributed under the terms and conditions of the Creative Commons Attribution (CC BY) license (https://creativecommons.org/licenses/by/4.0/).
Share and Cite
Sun, X.; Lin, K.; Jiao, P.; Deng, Z.; He, W. Research on Transfer Optimization Model of County Transit Network. Int. J. Environ. Res. Public Health 2021, 18, 4962. https://doi.org/10.3390/ijerph18094962
Sun X, Lin K, Jiao P, Deng Z, He W. Research on Transfer Optimization Model of County Transit Network. International Journal of Environmental Research and Public Health. 2021; 18(9):4962. https://doi.org/10.3390/ijerph18094962
Chicago/Turabian StyleSun, Xu, Kun Lin, Pengpeng Jiao, Zelin Deng, and Wei He. 2021. "Research on Transfer Optimization Model of County Transit Network" International Journal of Environmental Research and Public Health 18, no. 9: 4962. https://doi.org/10.3390/ijerph18094962
APA StyleSun, X., Lin, K., Jiao, P., Deng, Z., & He, W. (2021). Research on Transfer Optimization Model of County Transit Network. International Journal of Environmental Research and Public Health, 18(9), 4962. https://doi.org/10.3390/ijerph18094962