
The Influence of Specific Bioactive Collagen Peptides on Body Composition and Muscle Strength in Middle-Aged, Untrained Men: A Randomized Controlled Trial

 , ,
, ,
Abstract
1. Introduction
2. Materials and Methods
2.1. Study Design and Participants
2.2. Efficacy Outcomes
2.3. Investigational Products
2.4. Exercise Intervention Program
2.5. Statistical Analysis
3. Results
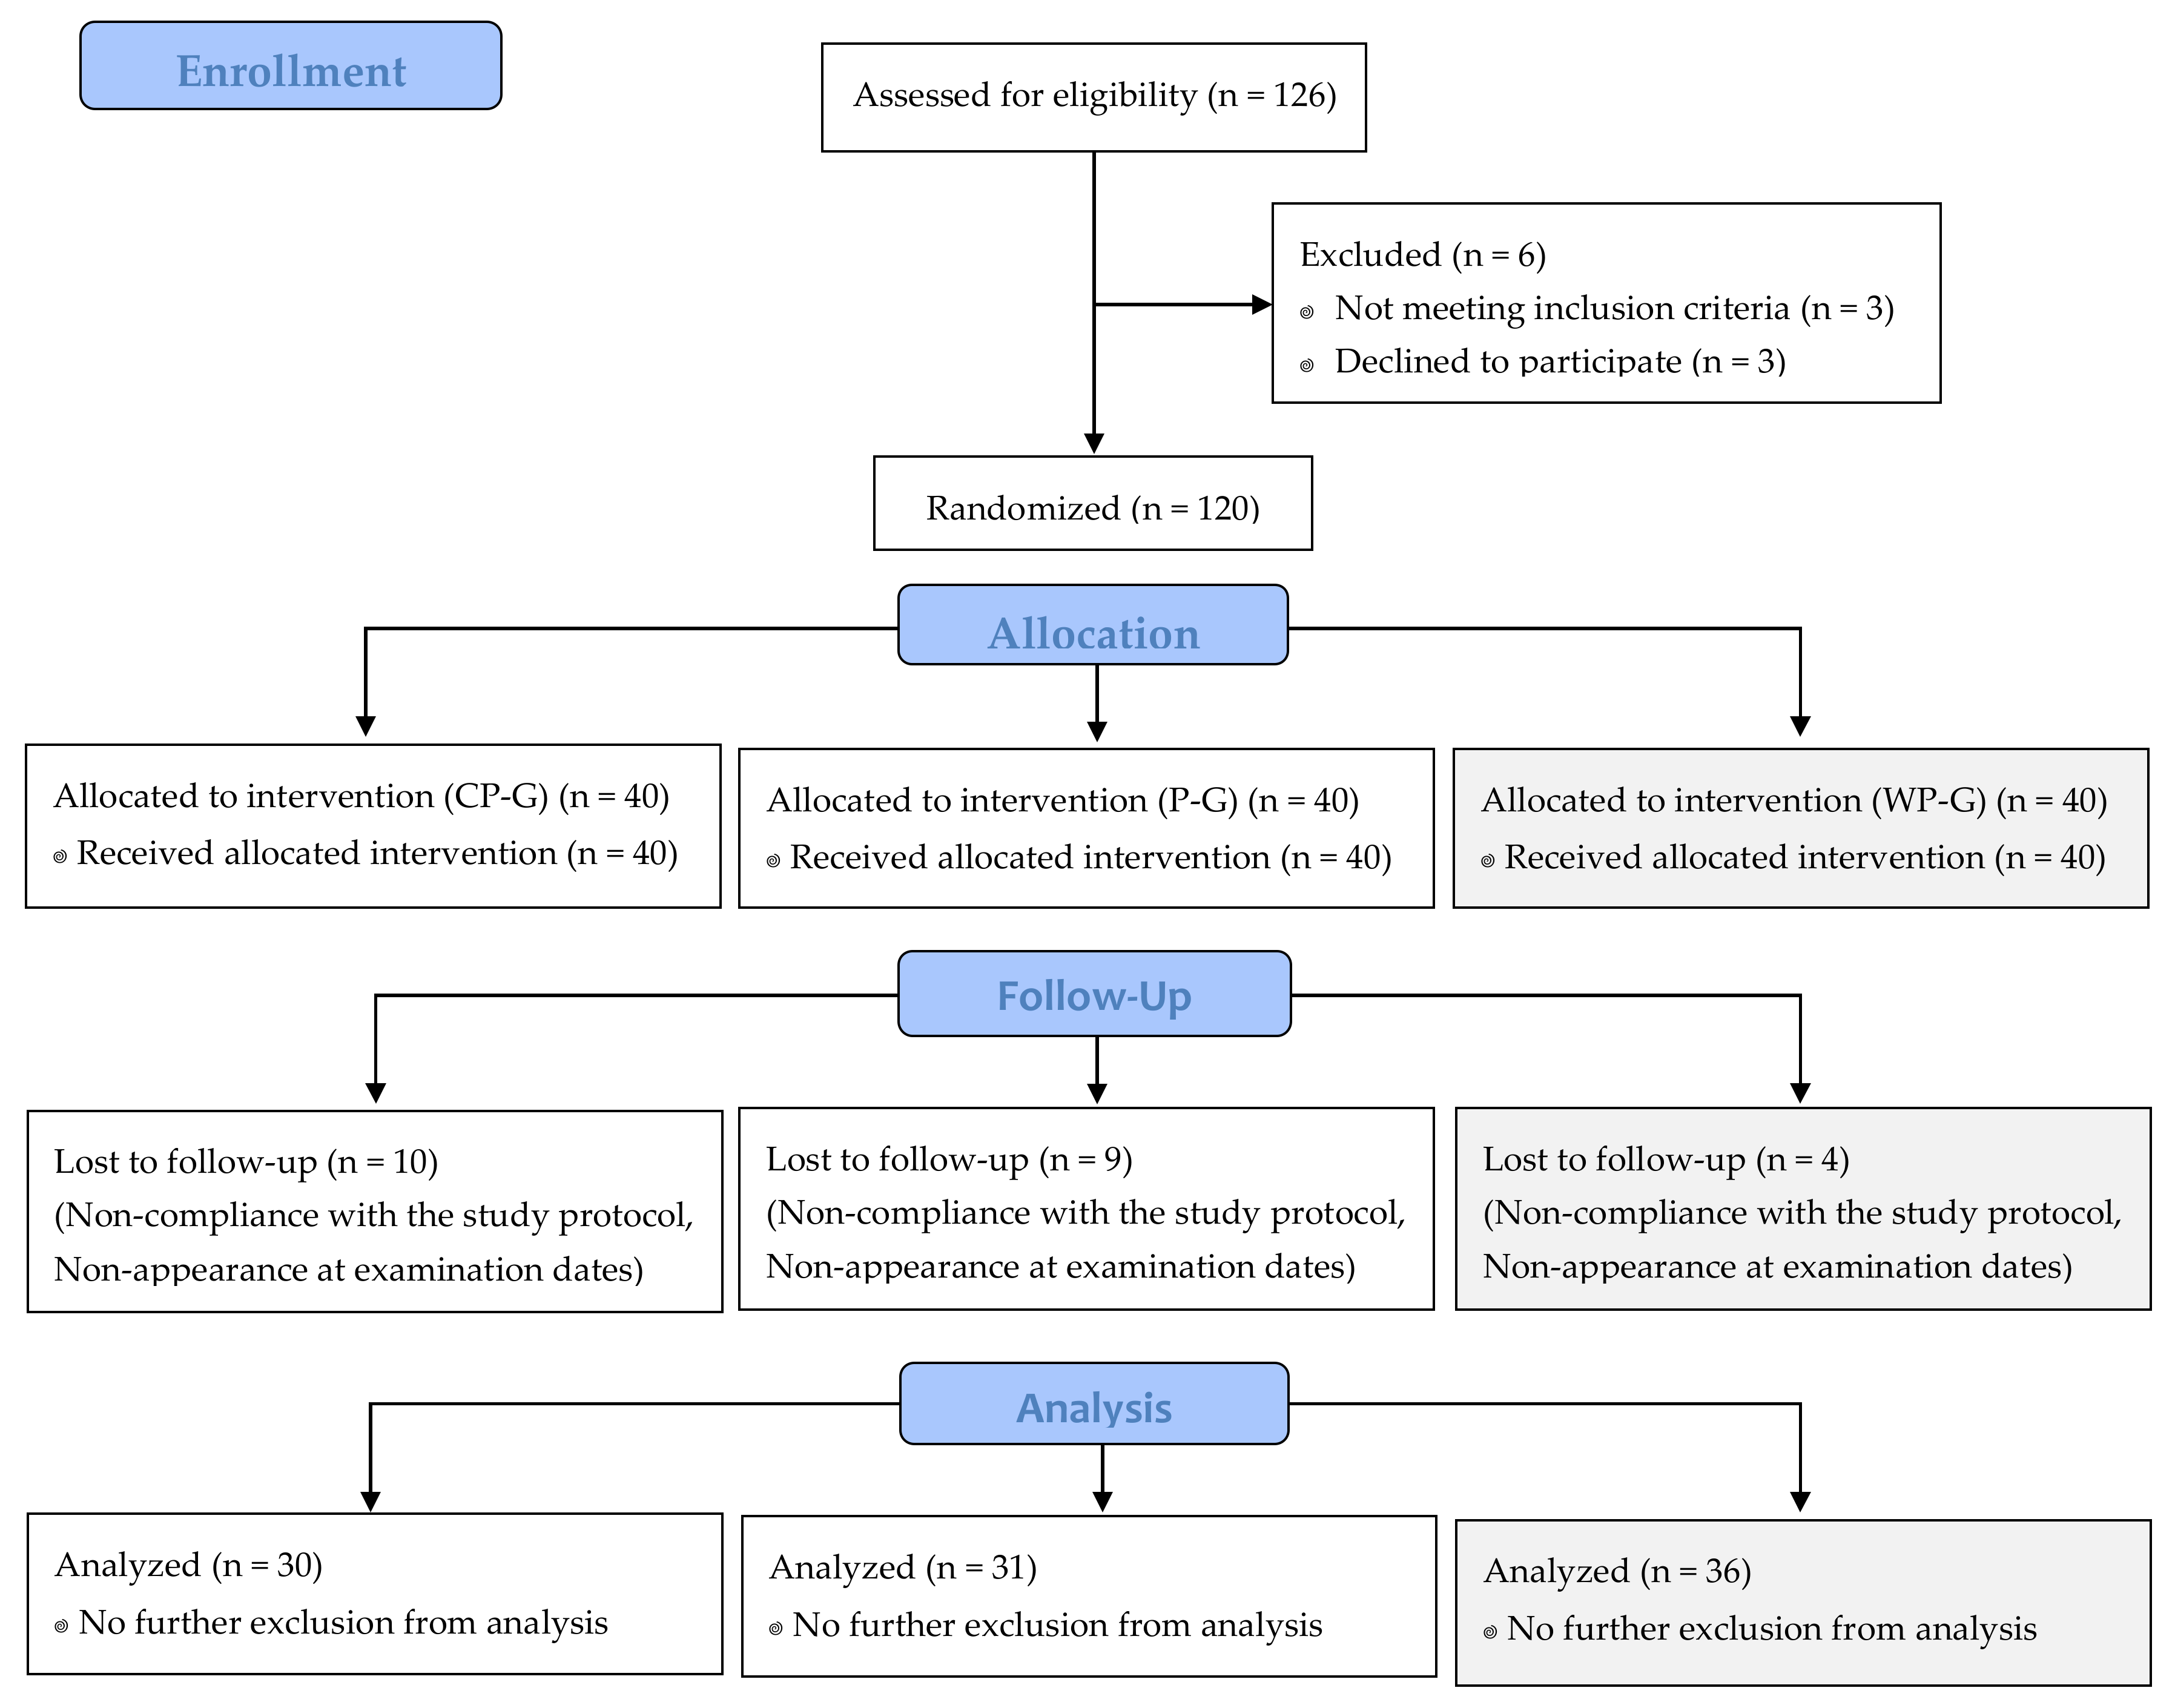
3.1. Subjects
3.2. Main Analysis of Body Composition and Muscle Strength
3.3. Exploratory Analysis of Body Composition and Muscle Strength
3.4. Dietary Intake
4. Discussion
5. Conclusions
Supplementary Materials
Author Contributions
Funding
Institutional Review Board Statement
Informed Consent Statement
Data Availability Statement
Acknowledgments
Conflicts of Interest
References
- Malafarina, V.; Uriz-Otano, F.; Iniesta, R.; Gil-Guerrero, L. Sarcopenia in the Elderly: Diagnosis, Physiopathology and Treatment. Maturitas 2012, 71, 109–114. [Google Scholar] [CrossRef] [PubMed]
- Cruz-Jentoft, A.J.; Baeyens, J.P.; Bauer, J.M.; Boirie, Y.; Cederholm, T.; Landi, F.; Martin, F.C.; Michel, J.-P.; Rolland, Y.; Schneider, S.M.; et al. Sarcopenia: European Consensus on Definition and Diagnosis: Report of the European Working Group on Sarcopenia in Older People. Age Ageing 2010, 39, 412–423. [Google Scholar] [CrossRef]
- Stephen, W.C.; Janssen, I. Sarcopenic-Obesity and Cardiovascular Disease Risk in the Elderly. J. Nutr. Health Aging 2009, 13, 460–466. [Google Scholar] [CrossRef] [PubMed]
- Stenholm, S.; Harris, T.B.; Rantanen, T.; Visser, M.; Kritchevsky, S.B.; Ferrucci, L. Sarcopenic Obesity: Definition, Cause and Consequences. Curr. Opin. Clin. Nutr. Metab. Care 2008, 11, 693–700. [Google Scholar] [CrossRef]
- Peterson, M.D.; Sen, A.; Gordon, P.M. Influence of Resistance Exercise on Lean Body Mass in Aging Adults: A Meta-Analysis. Med. Sci. Sports Exerc. 2011, 43, 249–258. [Google Scholar] [CrossRef] [PubMed]
- American College of Sports Medicine American College of Sports Medicine Position Stand. Progression Models in Resistance Training for Healthy Adults. Med. Sci Sports Exerc. 2009, 41, 687–708. [Google Scholar] [CrossRef] [PubMed]
- Morton, R.W.; Murphy, K.T.; McKellar, S.R.; Schoenfeld, B.J.; Henselmans, M.; Helms, E.; Aragon, A.A.; Devries, M.C.; Banfield, L.; Krieger, J.W.; et al. A Systematic Review, Meta-Analysis and Meta-Regression of the Effect of Protein Supplementation on Resistance Training-Induced Gains in Muscle Mass and Strength in Healthy Adults. Br. J. Sports Med. 2018, 52, 376–384. [Google Scholar] [CrossRef] [PubMed]
- Hoppeler, H. Molecular Networks in Skeletal Muscle Plasticity. J. Exp. Biol. 2016, 219, 205–213. [Google Scholar] [CrossRef] [PubMed]
- Jäger, R.; Kerksick, C.M.; Campbell, B.I.; Cribb, P.J.; Wells, S.D.; Skwiat, T.M.; Purpura, M.; Ziegenfuss, T.N.; Ferrando, A.A.; Arent, S.M.; et al. International Society of Sports Nutrition Position Stand: Protein and Exercise. J. Int. Soc. Sports Nutr. 2017, 14, 20. [Google Scholar] [CrossRef] [PubMed]
- Zdzieblik, D.; Oesser, S.; Baumstark, M.W.; Gollhofer, A.; König, D. Collagen Peptide Supplementation in Combination with Resistance Training Improves Body Composition and Increases Muscle Strength in Elderly Sarcopenic Men: A Randomised Controlled Trial. Br. J. Nutr. 2015, 114, 1237–1245. [Google Scholar] [CrossRef]
- Feng, M.; Betti, M. Transepithelial Transport Efficiency of Bovine Collagen Hydrolysates in a Human Caco-2 Cell Line Model. Food Chem. 2017, 224, 242–250. [Google Scholar] [CrossRef]
- Taga, Y.; Kusubata, M.; Ogawa-Goto, K.; Hattori, S. Highly Accurate Quantification of Hydroxyproline-Containing Peptides in Blood Using a Protease Digest of Stable Isotope-Labeled Collagen. J. Agric. Food Chem. 2014, 62, 12096–12102. [Google Scholar] [CrossRef] [PubMed]
- Taga, Y.; Kusubata, M.; Ogawa-Goto, K.; Hattori, S. Efficient Absorption of X-Hydroxyproline (Hyp)-Gly after Oral Administration of a Novel Gelatin Hydrolysate Prepared Using Ginger Protease. J. Agric. Food Chem. 2016, 64, 2962–2970. [Google Scholar] [CrossRef] [PubMed]
- Wang, L.; Wang, Q.; Liang, Q.; He, Y.; Wang, Z.; He, S.; Xu, J.; Ma, H. Determination of Bioavailability and Identification of Collagen Peptide in Blood after Oral Ingestion of Gelatin. J. Sci. Food Agric. 2015, 95, 2712–2717. [Google Scholar] [CrossRef]
- Schunck, M.; Oesser, S. Specific Collagen Peptides Benefit the Biosynthesis of Matrix Molecules of Tendons and Ligaments. J. Int. Soc. Sports Nutr. 2013, 10, P23. [Google Scholar] [CrossRef]
- Oesser, S.; Seifert, J. Stimulation of Type II Collagen Biosynthesis and Secretion in Bovine Chondrocytes Cultured with Degraded Collagen. Cell Tissue Res. 2003, 311, 393–399. [Google Scholar] [CrossRef]
- McAlindon, T.E.; Nuite, M.; Krishnan, N.; Ruthazer, R.; Price, L.L.; Burstein, D.; Griffith, J.; Flechsenhar, K. Change in Knee Osteoarthritis Cartilage Detected by Delayed Gadolinium Enhanced Magnetic Resonance Imaging Following Treatment with Collagen Hydrolysate: A Pilot Randomized Controlled Trial. Osteoarthr. Cartil. 2011, 19, 399–405. [Google Scholar] [CrossRef] [PubMed]
- Clark, K.L.; Sebastianelli, W.; Flechsenhar, K.R.; Aukermann, D.F.; Meza, F.; Millard, R.L.; Deitch, J.R.; Sherbondy, P.S.; Albert, A. 24-Week Study on the Use of Collagen Hydrolysate as a Dietary Supplement in Athletes with Activity-Related Joint Pain. Curr. Med. Res. Opin. 2008, 24, 1485–1496. [Google Scholar] [CrossRef] [PubMed]
- Zdzieblik, D.; Oesser, S.; Gollhofer, A.; König, D. Improvement of Activity-Related Knee Joint Discomfort Following Supplementation of Specific Collagen Peptides. Appl. Physiol. Nutr. Metab. 2017, 1–8. [Google Scholar] [CrossRef]
- Zdzieblik, D.; Brame, J.; Oesser, S.; Gollhofer, A.; König, D. The Influence of Specific Bioactive Collagen Peptides on Knee Joint Discomfort in Young Physically Active Adults: A Randomized Controlled Trial. Nutrients 2021, 13, 523. [Google Scholar] [CrossRef]
- Praet, S.F.E.; Purdam, C.R.; Welvaert, M.; Vlahovich, N.; Lovell, G.; Burke, L.M.; Gaida, J.E.; Manzanero, S.; Hughes, D.; Waddington, G. Oral Supplementation of Specific Collagen Peptides Combined with Calf-Strengthening Exercises Enhances Function and Reduces Pain in Achilles Tendinopathy Patients. Nutrients 2019, 11, 76. [Google Scholar] [CrossRef]
- Baar, K. Stress Relaxation and Targeted Nutrition to Treat Patellar Tendinopathy. Int. J. Sport Nutr. Exerc. Metab. 2019, 29, 453–457. [Google Scholar] [CrossRef]
- Dressler, P.; Gehring, D.; Zdzieblik, D.; Oesser, S.; Gollhofer, A.; König, D. Improvement of Functional Ankle Properties Following Supplementation with Specific Collagen Peptides in Athletes with Chronic Ankle Instability. J. Sports Sci. Med. 2018, 17, 298–304. [Google Scholar] [CrossRef]
- Sun, K.; Wu, Z.; Ji, Y.; Wu, G. Glycine Regulates Protein Turnover by Activating Protein Kinase B/Mammalian Target of Rapamycin and by Inhibiting MuRF1 and Atrogin-1 Gene Expression in C2C12 Myoblasts. J. Nutr. 2016, 146, 2461–2467. [Google Scholar] [CrossRef]
- Kitakaze, T.; Sakamoto, T.; Kitano, T.; Inoue, N.; Sugihara, F.; Harada, N.; Yamaji, R. The Collagen Derived Dipeptide Hydroxyprolyl-Glycine Promotes C2C12 Myoblast Differentiation and Myotube Hypertrophy. Biochem. Biophys. Res. Commun. 2016, 478, 1292–1297. [Google Scholar] [CrossRef]
- Liu, Y.; Wang, X.; Wu, H.; Chen, S.; Zhu, H.; Zhang, J.; Hou, Y.; Hu, C.-A.A.; Zhang, G. Glycine Enhances Muscle Protein Mass Associated with Maintaining Akt-MTOR-FOXO1 Signaling and Suppressing TLR4 and NOD2 Signaling in Piglets Challenged with LPS. Am. J. Physiol. Regul. Integr. Comp. Physiol. 2016, 311, R365–R373. [Google Scholar] [CrossRef] [PubMed]
- Rolland, Y.; Czerwinski, S.; Abellan Van Kan, G.; Morley, J.E.; Cesari, M.; Onder, G.; Woo, J.; Baumgartner, R.; Pillard, F.; Boirie, Y.; et al. Sarcopenia: Its Assessment, Etiology, Pathogenesis, Consequences and Future Perspectives. J. Nutr. Health Aging 2008, 12, 433–450. [Google Scholar] [CrossRef] [PubMed]
- Aagaard, P.; Suetta, C.; Caserotti, P.; Magnusson, S.P.; Kjaer, M. Role of the Nervous System in Sarcopenia and Muscle Atrophy with Aging: Strength Training as a Countermeasure. Scand. J. Med. Sci. Sports 2010, 20, 49–64. [Google Scholar] [CrossRef] [PubMed]
- Waters, D.L.; Baumgartner, R.N.; Garry, P.J.; Vellas, B. Advantages of Dietary, Exercise-Related, and Therapeutic Interventions to Prevent and Treat Sarcopenia in Adult Patients: An Update. Clin. Interv. Aging 2010, 5, 259–270. [Google Scholar] [CrossRef]
- Riebe, D.; Franklin, B.A.; Thompson, P.D.; Garber, C.E.; Whitfield, G.P.; Magal, M.; Pescatello, L.S. Updating ACSM’s Recommendations for Exercise Preparticipation Health Screening. Med. Sci. Sports Exerc. 2015, 47, 2473–2479. [Google Scholar] [CrossRef] [PubMed]
- Urbaniak, G.C.; Plous, S. Research Randomizer (Version 4.0). Available online: https://www.randomizer.org/about (accessed on 29 July 2014).
- Claxton, A.J.; Cramer, J.; Pierce, C. A Systematic Review of the Associations between Dose Regimens and Medication Compliance. Clin. Ther. 2001, 23, 1296–1310. [Google Scholar] [CrossRef]
- Kim, J.; Wang, Z.; Heymsfield, S.B.; Baumgartner, R.N.; Gallagher, D. Total-Body Skeletal Muscle Mass: Estimation by a New Dual-Energy X-Ray Absorptiometry Method. Am. J. Clin. Nutr. 2002, 76, 378–383. [Google Scholar] [CrossRef] [PubMed]
- Cermak, N.M.; Res, P.T.; de Groot, L.C.P.G.M.; Saris, W.H.M.; van Loon, L.J.C. Protein Supplementation Augments the Adaptive Response of Skeletal Muscle to Resistance-Type Exercise Training: A Meta-Analysis. Am. J. Clin. Nutr. 2012, 96, 1454–1464. [Google Scholar] [CrossRef] [PubMed]
- Finger, D.; Goltz, F.R.; Umpierre, D.; Meyer, E.; Rosa, L.H.T.; Schneider, C.D. Effects of Protein Supplementation in Older Adults Undergoing Resistance Training: A Systematic Review and Meta-Analysis. Sports Med. 2015, 45, 245–255. [Google Scholar] [CrossRef]
- Phillips, S.M.; Tang, J.E.; Moore, D.R. The Role of Milk- and Soy-Based Protein in Support of Muscle Protein Synthesis and Muscle Protein Accretion in Young and Elderly Persons. J. Am. Coll. Nutr. 2009, 28, 343–354. [Google Scholar] [CrossRef]
- Kirmse, M.; Oertzen-Hagemann, V.; de Marées, M.; Bloch, W.; Platen, P. Prolonged Collagen Peptide Supplementation and Resistance Exercise Training Affects Body Composition in Recreationally Active Men. Nutrients 2019, 11, 1154. [Google Scholar] [CrossRef] [PubMed]
- Rindom, E.; Nielsen, M.H.; Kececi, K.; Jensen, M.E.; Vissing, K.; Farup, J. Effect of Protein Quality on Recovery after Intense Resistance Training. Eur. J. Appl. Physiol. 2016, 116, 2225–2236. [Google Scholar] [CrossRef]
- Oertzen-Hagemann, V.; Kirmse, M.; Eggers, B.; Pfeiffer, K.; Marcus, K.; de Marées, M.; Platen, P. Effects of 12 Weeks of Hypertrophy Resistance Exercise Training Combined with Collagen Peptide Supplementation on the Skeletal Muscle Proteome in Recreationally Active Men. Nutrients 2019, 11, 1072. [Google Scholar] [CrossRef] [PubMed]
- Zdzieblik, D.; Oesser, S.; Dressler, P.; Gollhofer, A.; König, D. Effect of Specific Collagen Peptides with Various Dosages on Body Composition in Untrained Men. Proc. Nutr. Soc. 2017, 76. [Google Scholar] [CrossRef]
- Hamaia, S.; Farndale, R.W. Integrin Recognition Motifs in the Human Collagens. Adv. Exp. Med. Biol. 2014, 819, 127–142. [Google Scholar] [CrossRef] [PubMed]
- Gullberg, D.E.; Lundgren-Akerlund, E. Collagen-Binding I Domain Integrins—What Do They Do? Prog. Histochem. Cytochem. 2002, 37, 3–54. [Google Scholar] [CrossRef]
- Turrina, A.; Martínez-González, M.A.; Stecco, C. The Muscular Force Transmission System: Role of the Intramuscular Connective Tissue. J. Bodyw. Mov. Ther. 2013, 17, 95–102. [Google Scholar] [CrossRef]
- Purslow, P.P. The Structure and Functional Significance of Variations in the Connective Tissue within Muscle. Comp. Biochem. Physiol. Part A Mol. Integr. Physiol. 2002, 133, 947–966. [Google Scholar] [CrossRef]
- Kjaer, M.; Jørgensen, N.R.; Heinemeier, K.; Magnusson, S.P. Exercise and Regulation of Bone and Collagen Tissue Biology. Prog. Mol. Biol. Transl. Sci. 2015, 135, 259–291. [Google Scholar] [CrossRef]
- Gattazzo, F.; Urciuolo, A.; Bonaldo, P. Extracellular Matrix: A Dynamic Microenvironment for Stem Cell Niche. Biochim. Biophys. Acta 2014, 1840, 2506–2519. [Google Scholar] [CrossRef] [PubMed]
- Fry, C.S.; Kirby, T.J.; Kosmac, K.; McCarthy, J.J.; Peterson, C.A. Myogenic Progenitor Cells Control Extracellular Matrix Production by Fibroblasts during Skeletal Muscle Hypertrophy. Cell Stem Cell 2017, 20, 56–69. [Google Scholar] [CrossRef] [PubMed]
- Weh, L.; Petau, C. Änderung Der Gewebeeigenschaften Durch Gelatineeinnahme—Eine Biomechanische in Vivo-Pilotstudie. Extr. Orthop. 2001, 4, 12–15. [Google Scholar]
- Toselli, S.; Badicu, G.; Bragonzoni, L.; Spiga, F.; Mazzuca, P.; Campa, F. Comparison of the Effect of Different Resistance Training Frequencies on Phase Angle and Handgrip Strength in Obese Women: A Randomized Controlled Trial. Int. J. Environ. Res. Public Health 2020, 17, 1163. [Google Scholar] [CrossRef] [PubMed]
- Klop, B.; Elte, J.W.F.; Castro Cabezas, M. Dyslipidemia in Obesity: Mechanisms and Potential Targets. Nutrients 2013, 5, 1218–1240. [Google Scholar] [CrossRef] [PubMed]
- Mekary, R.A.; Grøntved, A.; Despres, J.-P.; De Moura, L.P.; Asgarzadeh, M.; Willett, W.C.; Rimm, E.B.; Giovannucci, E.; Hu, F.B. Weight Training, Aerobic Physical Activities, and Long-Term Waist Circumference Change in Men. Obesity 2015, 23, 461–467. [Google Scholar] [CrossRef] [PubMed]
- Dos Santos, L.; Ribeiro, A.S.; Nunes, J.P.; Tomeleri, C.M.; Nabuco, H.C.G.; Nascimento, M.A.; Sugihara Junior, P.; Fernandes, R.R.; Campa, F.; Toselli, S.; et al. Effects of Pyramid Resistance-Training System with Different Repetition Zones on Cardiovascular Risk Factors in Older Women: A Randomized Controlled Trial. Int. J. Environ. Res. Public Health 2020, 17, 6115. [Google Scholar] [CrossRef] [PubMed]
- Faienza, M.F.; Lassandro, G.; Chiarito, M.; Valente, F.; Ciaccia, L.; Giordano, P. How Physical Activity across the Lifespan Can Reduce the Impact of Bone Ageing: A Literature Review. Int. J. Environ. Res. Public Health 2020, 17, 1862. [Google Scholar] [CrossRef] [PubMed]
- Guadalupe-Grau, A.; Fuentes, T.; Guerra, B.; Calbet, J.A.L. Exercise and Bone Mass in Adults. Sports Med. 2009, 39, 439–468. [Google Scholar] [CrossRef]
- Hall, K.D.; Sacks, G.; Chandramohan, D.; Chow, C.C.; Wang, Y.C.; Gortmaker, S.L.; Swinburn, B.A. Quantification of the Effect of Energy Imbalance on Bodyweight. Lancet 2011, 378. [Google Scholar] [CrossRef]
- National Research Council (US). Recommended Dietary Allowances, 10th ed.; National Academies Press: Washington, DC, USA, 1989.
- Heseker, H.; Heseker, B. Die Nährwerttabelle; Umschau: Neustadt an der Weinstraße, Germany, 2010. [Google Scholar]
- Mendez, M.A.; Popkin, B.M.; Buckland, G.; Schroder, H.; Amiano, P.; Barricarte, A.; Huerta, J.-M.; Quirós, J.R.; Sánchez, M.-J.; González, C.A. Alternative Methods of Accounting for Underreporting and Overreporting When Measuring Dietary Intake-Obesity Relations. Am. J. Epidemiol. 2011, 173, 448–458. [Google Scholar] [CrossRef]


| CP-G (n = 30) | P-G (n = 31) | WP-G (n = 36) | p Value | |
|---|---|---|---|---|
| Age (y) | 51.8 ± 4.56 | 47.4 ± 7.26 | 49.6 ± 7.98 | 0.058 # |
| Height (m) | 1.80 ± 0.07 | 1.79 ± 0.05 | 1.80 ± 0.06 | 0.596 * |
| Body weight (kg) | 99.6 ± 9.00 | 95.5 ± 10.8 | 98.3 ± 11.5 | 0.293 # |
| BMI (kg/m2) | 31.0 ± 2.93 | 29.9 ± 2.56 | 30.2 ± 2.60 | 0.416 # |
| BP sys (mm Hg) | 143.3 ± 16.9 | 136.3 ± 16.0 | 141.6 ± 16.3 | 0.241 # |
| BP dia (mm Hg) | 91.5 ± 8.63 | 87.4 ± 10.3 | 89.4 ± 9.32 | 0.180 # |
| CP-G (n = 30) | P-G (n = 31) | p Value LMM | |||
|---|---|---|---|---|---|
| T0 | T12 | T0 | T12 | ||
| Fat free mass (kg) | 60.4 ± 4.78 | 63.8 ± 6.03 *** | 58.5 ± 6.29 | 60.3 ± 5.71 *** | 0.010 |
| Fat free mass (%) | 60.8 ± 4.50 | 65.3 ± 4.76 *** | 61.4 ± 4.31 | 64.4 ± 5.02 *** | 0.023 |
| Skeletal muscle mass 1 | 30.8 ± 2.42 | 32.1 ± 3.02 *** | 30.0 ± 3.18 | 30.5 ± 2.85 * | 0.011 |
| Fat mass (kg) | 35.9 ± 7.11 | 30.6 ± 6.48 *** | 33.7 ± 6.89 | 30.3 ± 7.57 *** | 0.023 |
| Fat mass (%) | 35.8 ± 4.71 | 31.1 ± 5.06 *** | 35.1 ± 4.53 | 31.9 ± 5.30 *** | 0.031 |
| Bone mineral content (kg) | 3.34 ± 0.339 | 3.57 ± 0.460 ** | 3.34 ± 0.380 | 3.49 ± 0.442 * | 0.330 |
| Bone mineral content (%) | 3.37 ± 0.376 | 3.66 ± 0.439 *** | 3.52 ± 0.371 | 3.76 ± 0.533 ** | 0.602 |
| Body weight (kg) | 99.6 ± 9.00 | 98.0 ± 8.49 *** | 95.5 ± 10.8 | 94.1 ± 10.8 * | 0.743 |
| Waist circumference (cm) | 107.5 ± 6.67 † | 104.1 ± 6.49 *** | 102.9 ± 7.00 † | 100.4 ± 7.77 ** | 0.292 |
| Muscle strength (N) | 1695 ± 378.7 | 1858 ± 399.2 *** | 1706 ± 351.8 | 1806 ± 365.9 ** | 0.158 |
| CP-G (n = 30) | P-G (n = 31) | WP-G (n = 36) | p Value LMM | ||||
|---|---|---|---|---|---|---|---|
| T0 | T12 | T0 | T12 | T0 | T12 | ||
| Fat free mass (kg) | 60.4 ± 4.78 | 63.8 ± 6.03 *** | 58.5 ± 6.29 | 60.3 ± 5.71 *** | 59.6 ± 6.22 | 61.9 ± 6.76 *** | 0.033 |
| Fat free mass (%) | 60.8 ± 4.50 | 65.3 ± 4.76 *** | 61.4 ± 4.31 | 64.4 ± 5.02 *** | 60.8 ± 3.29 | 64.3 ± 4.67 *** | 0.066 |
| Skeletal muscle mass 1 | 30.8 ± 2.42 | 32.1 ± 3.02 *** | 30.0 ± 3.18 | 30.5 ± 2.85 * | 30.5 ± 3.13 | 31.2 ± 3.33 ** | 0.037 |
| Fat mass (kg) | 35.9 ± 7.11 | 30.6 ± 6.48 *** | 33.7 ± 6.89 | 30.3 ± 7.57 *** | 35.4 ± 6.44 | 31.3 ± 7.40 *** | 0.054 |
| Fat mass (%) | 35.8 ± 4.71 | 31.1 ± 5.06 *** | 35.1 ± 4.53 | 31.9 ± 5.30 *** | 35.8 ± 3.45 | 32.1 ± 4.94 *** | 0.083 |
| Bone mineral content (kg) | 3.34 ± 0.339 | 3.57 ± 0.460 ** | 3.34 ± 0.380 | 3.49 ± 0.442 * | 3.25 ± 0.350 | 3.40 ± 0.311 ** | 0.325 |
| Bone mineral content (%) | 3.37 ± 0.376 | 3.66 ± 0.439 *** | 3.52 ± 0.371 | 3.76 ± 0.533 ** | 3.37 ± 0.393 | 3.58 ± 0.423 *** | 0.642 |
| Body weight (kg) | 99.6 ± 9.00 | 98.0 ± 8.49 *** | 95.5 ± 10.8 | 94.1 ± 10.8 * | 98.3 ± 11.5 | 96.6 ± 11.5 *** | 0.899 |
| Waist circumference (cm) | 107.5 ± 6.67 † | 104.1 ± 6.49 *** | 102.9 ± 7.00 † | 100.4 ± 7.77 ** | 105.6 ± 7.11 | 103.2 ± 7.86 *** | 0.561 |
| Muscle strength (N) | 1695 ± 378.7 | 1858 ± 399.2 *** | 1706 ± 351.8 | 1806 ± 365.9 ** | 1633 ± 370.5 | 1753 ± 355.7 ** | 0.444 |
| CP-G (n = 30) | P-G (n = 31) | WP-G (n = 31) | p Value LMM | ||||
|---|---|---|---|---|---|---|---|
| T0 | T12 | T0 | T12 | T0 | T12 | ||
| Energy (kcal) | 2739 ± 672.8 | 2863 ± 686.4 | 2573 ± 585.7 | 2419 ± 614.9 * | 2780 ± 897.6 | 2619 ± 791.5 | 0.059 |
| Protein (g) | 105.0 ± 20.7 | 107.0 ± 28.1 | 102.8 ± 29.1 | 96.6 ± 28.1 | 108.1 ± 34.0 | 103.2 ± 34.2 | 0.508 |
| Protein (g/kg BW) | 1.05 ± 0.209 | 1.10 ± 0.289 | 1.09 ± 0.318 | 1.03 ± 0.304 | 1.11 ± 0.385 | 1.08 ± 0.360 | 0.750 |
| Protein (%) | 16.1 ± 2.78 | 15.6 ± 3.08 | 16.4 ± 3.45 | 16.5 ± 3.11 | 16.2 ± 3.42 | 16.2 ± 2.65 | 0.469 |
| Fat (g) | 113.3 ± 37.4 | 116.9 ± 36.4 | 100.4 ± 24.4 | 99.6 ± 31.6 | 116.6 ± 48.2 | 118.5 ± 48.1 | 0.855 |
| Fat (%) | 37.0 ± 7.37 | 36.1 ± 5.23 | 34.2 ± 6.96 | 36.6 ± 5.12 | 36.5 ± 5.17 | 38.6 ± 6.67 | 0.155 |
| Carbohydrates (g) | 282.8 ± 95.6 | 301.4 ± 85.8 | 276.8 ± 79.6 | 253.7 ± 76.6 | 268.2 ± 92.2 | 253.0 ± 75.5 | 0.060 |
| Carbohydrates (%) | 42.5 ± 7.91 | 43.0 ± 6.97 | 43.8 ± 6.92 | 43.0 ± 7.11 | 41.4 ± 7.15 | 40.1 ± 7.06 | 0.669 |
Publisher’s Note: MDPI stays neutral with regard to jurisdictional claims in published maps and institutional affiliations. |
© 2021 by the authors. Licensee MDPI, Basel, Switzerland. This article is an open access article distributed under the terms and conditions of the Creative Commons Attribution (CC BY) license (https://creativecommons.org/licenses/by/4.0/).
Share and Cite
Zdzieblik, D.; Jendricke, P.; Oesser, S.; Gollhofer, A.; König, D. The Influence of Specific Bioactive Collagen Peptides on Body Composition and Muscle Strength in Middle-Aged, Untrained Men: A Randomized Controlled Trial. Int. J. Environ. Res. Public Health 2021, 18, 4837. https://doi.org/10.3390/ijerph18094837
Zdzieblik D, Jendricke P, Oesser S, Gollhofer A, König D. The Influence of Specific Bioactive Collagen Peptides on Body Composition and Muscle Strength in Middle-Aged, Untrained Men: A Randomized Controlled Trial. International Journal of Environmental Research and Public Health. 2021; 18(9):4837. https://doi.org/10.3390/ijerph18094837
Chicago/Turabian StyleZdzieblik, Denise, Patrick Jendricke, Steffen Oesser, Albert Gollhofer, and Daniel König. 2021. "The Influence of Specific Bioactive Collagen Peptides on Body Composition and Muscle Strength in Middle-Aged, Untrained Men: A Randomized Controlled Trial" International Journal of Environmental Research and Public Health 18, no. 9: 4837. https://doi.org/10.3390/ijerph18094837
APA StyleZdzieblik, D., Jendricke, P., Oesser, S., Gollhofer, A., & König, D. (2021). The Influence of Specific Bioactive Collagen Peptides on Body Composition and Muscle Strength in Middle-Aged, Untrained Men: A Randomized Controlled Trial. International Journal of Environmental Research and Public Health, 18(9), 4837. https://doi.org/10.3390/ijerph18094837