
Patterns and Predictors of Sitting among Women from Disad-Vantaged Neighbourhoods over Time: A 5-Year Prospective Cohort Study

Abstract
1. Introduction
- Describe patterns of time spent in sitting over time;
- Identify baseline sociodemographic predictors of sitting time patterns over time.
2. Methods
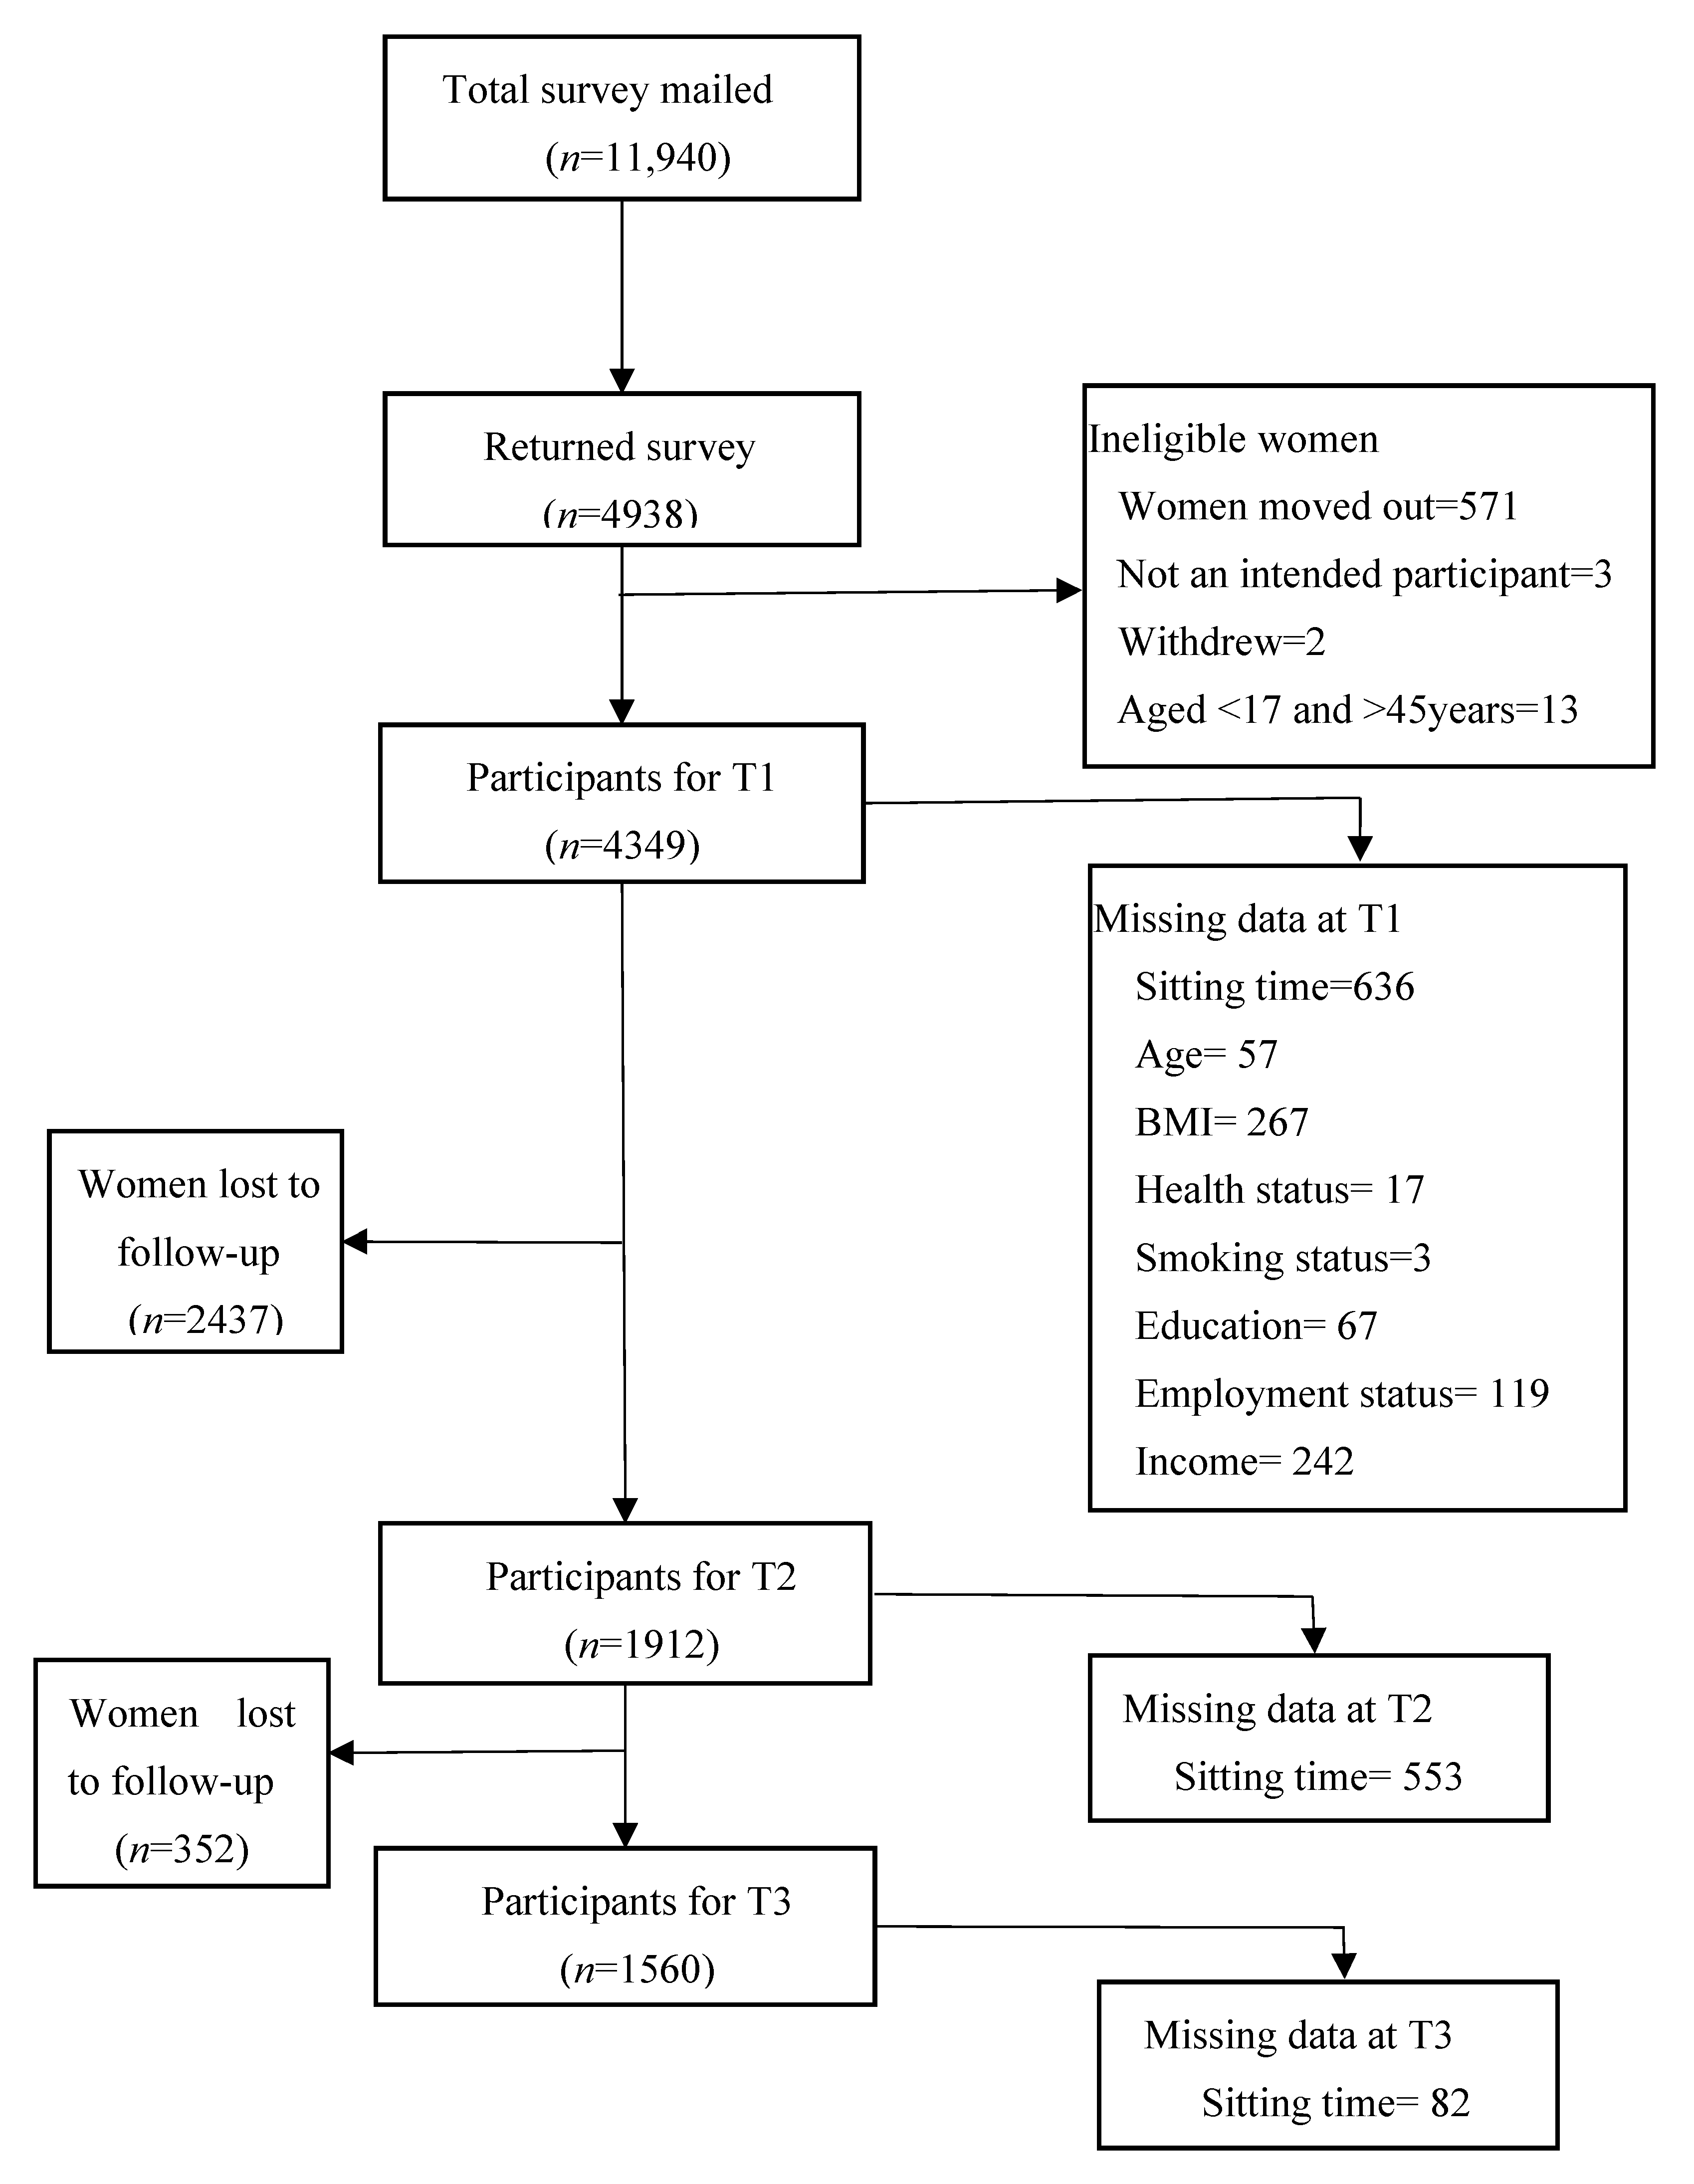
2.1. Participants
2.2. Measures
2.2.1. Outcome: Weekly Sitting Time
2.2.2. Exposures: Baseline Sociodemographic and Health Characteristics
2.3. Statistical Analysis
2.4. Sensitivity Analyses
3. Results
3.1. Characteristics of the Sample
3.2. Loss to Follow-Up
3.3. Observed Sitting Time Patterns for Demographic and Health-Related Factors
3.4. Sociodemographic and Health-Related Factors Associated with Sitting Time
3.5. Sensitivity Analyses
4. Discussion
4.1. Patterns and Predictors of Sitting
4.2. Strength and Limitations
5. Conclusions
Supplementary Materials
Author Contributions
Funding
Institutional Review Board Statement
Informed Consent Statement
Data Availability Statement
Acknowledgments
Conflicts of Interest
References
- Network, S.B.R. Letter to the editor: Standardized use of the terms “sedentary” and “sedentary behaviours”. Appl. Physiol. Nutr. Metab. 2012, 37, 540–542. [Google Scholar]
- Bailey, D.P. Editorial: Sedentary Behavior in Human Health and Disease. Front. Physiol. 2017, 8, 901. [Google Scholar] [CrossRef]
- Teychenne, M.; Ball, K.; Salmon, J. Sedentary Behavior and Depression among Adults: A Review. Int. J. Behav. Med. 2010, 17, 246–254. [Google Scholar] [CrossRef]
- Biswas, A.; Oh, P.I.; Faulkner, G.E.; Bajaj, R.R.; Silver, M.A.; Mitchell, M.S.; Alter, D.A. Sedentary time and its association with risk for disease incidence, mortality, and hospitalization in adults: A systematic review and meta-analysis. Ann. Intern. Med. 2015, 162, 123–132. [Google Scholar] [CrossRef] [PubMed]
- Thorp, A.A.; Owen, N.; Neuhaus, M.; Dunstan, D.W. Sedentary Behaviors and Subsequent Health Outcomes in Adults: A Systematic Review of Longitudinal Studies, 1996–2011. Am. J. Prev. Med. 2011, 41, 207–215. [Google Scholar] [CrossRef] [PubMed]
- Turrell, G.; Mathers, C.D. Socioeconomic status and health in Australia. Med. J. Aust. 2000, 172, 434–438. [Google Scholar] [CrossRef] [PubMed]
- Cockerham, W.C.; Hamby, B.W.; Oates, G.R. The Social Determinants of Chronic Disease. Am. J. Prev. Med. 2017, 52, S5–S12. [Google Scholar] [CrossRef] [PubMed]
- Prince, S.A.; Reed, J.L.; McFetridge, C.; Tremblay, M.S.; Reid, R.D. Correlates of sedentary behaviour in adults: A systematic review. Obes. Rev. 2017, 18, 915–935. [Google Scholar] [CrossRef]
- Celis-Morales, C.; Salas, C.; Alduhishy, A.; Sanzana, R.; Martínez, M.A.; Leiva, A.; Diaz, X.; Martínez, C.; Álvarez, C.; Leppe, J.; et al. Socio-demographic patterns of physical activity and sedentary behaviour in Chile: Results from the National Health Survey 2009–2010. J. Public Health 2015, 38, e98–e105. [Google Scholar] [CrossRef]
- Clemes, S.A.; Houdmont, J.; Munir, F.; Wilson, K.; Kerr, R.; Addley, K. Descriptive epidemiology of domain-specific sitting in working adults: The Stormont Study. J. Public Health 2015, 38, 53–60. [Google Scholar] [CrossRef] [PubMed]
- Huffman, S.; Szafron, M. Social correlates of leisure-time sedentary behaviours in Canadian adults. Prev. Med. Rep. 2017, 5, 268–274. [Google Scholar] [CrossRef] [PubMed]
- Varo, J.J.; A Martínez-González, M.; De Irala-Estévez, J.; Kearney, J.; Gibney, M.; Martínez, J.A. Distribution and determinants of sedentary lifestyles in the European Union. Int. J. Epidemiol. 2003, 32, 138–146. [Google Scholar] [CrossRef]
- Walsh, S.M.; Meyer, M.R.U.; Stamatis, A.; Morgan, G.B. Why Women Sit: Determinants of Leisure Sitting Time for Working Women. Women’s Health Issues 2015, 25, 673–679. [Google Scholar] [CrossRef] [PubMed]
- Clark, B.K.; Kolbe-Alexander, T.L.; Duncan, M.J.; Brown, W. Sitting Time, Physical Activity and Sleep by Work Type and Pattern—The Australian Longitudinal Study on Women’s Health. Int. J. Environ. Res. Public Health 2017, 14, 290. [Google Scholar] [CrossRef]
- Uijtdewilligen, L.; Twisk, J.W.; Singh, A.S.; Chinapaw, M.J.; Van Mechelen, W.; Brown, W.J. Biological, socio-demographic, work and lifestyle determinants of sitting in young adult women: A prospective cohort study. Int. J. Behav. Nutr. Phys. Act. 2014, 11, 7. [Google Scholar] [CrossRef] [PubMed]
- Brown, W.J.; Miller, Y.D.; Miller, R. Sitting time and work patterns as indicators of overweight and obesity in Australian adults. Int. J. Obes. 2003, 27, 1340–1346. [Google Scholar] [CrossRef] [PubMed]
- Proper, K.; Cerin, E.; Brown, W.J.; Owen, N. Sitting time and socio-economic differences in overweight and obesity. Int. J. Obes. 2006, 31, 169–176. [Google Scholar] [CrossRef]
- Van Uffelen, J.G.Z.; Heesch, K.C.; Brown, W. Correlates of Sitting Time in Working Age Australian Women: Who Should Be Targeted with Interventions to Decrease Sitting Time? J. Phys. Act. Health 2012, 9, 270–287. [Google Scholar] [CrossRef]
- Wallmann-Sperlich, B.; Bucksch, J.; Hansen, S.; Schantz, P.; Froboese, I. Sitting time in Germany: An analysis of socio-demographic and environmental correlates. BMC Public Health 2013, 13, 196. [Google Scholar] [CrossRef]
- Stamatakis, E.; Coombs, N.; Rowlands, A.V.; Shelton, N.; Hillsdon, M. Objectively-assessed and self-reported sedentary time in relation to multiple socioeconomic status indicators among adults in England: A cross-sectional study. BMJ Open 2014, 4, e006034. [Google Scholar] [CrossRef]
- Katzmarzyk, P.T.; Church, T.S.; Craig, C.L.; Bouchard, C. Sitting Time and Mortality from All Causes, Cardiovascular Disease, and Cancer. Med. Sci. Sports Exerc. 2009, 41, 998–1005. [Google Scholar] [CrossRef]
- Ball, K.; Cleland, V.; Salmon, J.; Timperio, A.F.; McNaughton, S.; Thornton, L.; Campbell, K.; Jackson, M.; Baur, L.; Mishra, G.; et al. Cohort Profile: The Resilience for Eating and Activity Despite Inequality (READI) study. Int. J. Epidemiol. 2012, 42, 1629–1639. [Google Scholar] [CrossRef] [PubMed]
- Craig, C.L.; Marshall, A.L.; Sjöström, M.; Bauman, A.E.; Booth, M.L.; Ainsworth, B.E.; Pratt, M.; Ekelund, U.; Yngve, A.; Sallis, J.F.; et al. International Physical Activity Questionnaire: 12-Country Reliability and Validity. Med. Sci. Sports Exerc. 2003, 35, 1381–1395. [Google Scholar] [CrossRef] [PubMed]
- Rosenberg, D.E.; Bull, F.C.; Marshall, A.L.; Sallis, J.F.; Bauman, A.E. Assessment of Sedentary Behavior with the International Physical Activity Questionnaire. J. Phys. Act. Health 2008, 5, S30–S44. [Google Scholar] [CrossRef] [PubMed]
- IPAQ Group. International Physical Activity Questionnaire Guidelines for the Data Processing and Analysis of the “International Physical Activity Questionnaire”: Short and Long Forms; IPAQ Group: Palo Alto, CA, USA, 2012. [Google Scholar]
- Sleep Health Foundation How Much Sleep Do You Really Need? Available online: https://www.sleephealthfoundation.org.au/how-much-sleep-do-you-really-need.html (accessed on 22 November 2020).
- World Health Organization. Obesity: Preventing and Managing the Global Epidemic: Report of a WHO Consultation; WHO Technical Report Series 894; WHO: Geneva, Switzerland, 2000. [Google Scholar]
- Howe, C.J.; Cole, S.R.; Lau, B.; Napravnik, S.; Eron, J.J. Selection Bias Due to Loss to Follow Up in Cohort Studies. Epidemiology 2016, 27, 91–97. [Google Scholar] [CrossRef]
- Mickey, R.M.; Greenland, S. The impact of confounder selection criteria on effect estimation. Am. J. Epidemiol. 1989, 129, 125–137. [Google Scholar] [CrossRef] [PubMed]
- White, I.R.; Royston, P.; Wood, A.M. Multiple imputation using chained equations: Issues and guidance for practice. Stat. Med. 2010, 30, 377–399. [Google Scholar] [CrossRef] [PubMed]
- Lall, R. How Multiple Imputation Makes a Difference. Polit. Anal. 2016, 24, 414–433. [Google Scholar] [CrossRef]
- Tilling, K.; Williamson, E.J.; Spratt, M.; Sterne, J.A.; Carpenter, J.R. Appropriate inclusion of interactions was needed to avoid bias in multiple imputation. J. Clin. Epidemiol. 2016, 80, 107–115. [Google Scholar] [CrossRef]
- Rubin, B.D. Multiple Imputation for Nonresponse in Surveys; John Wiley & Sons: Hoboken, NJ, USA, 1987. [Google Scholar]
- Milton, K.; Gale, J.; Stamatakis, E.; Bauman, A. Trends in prolonged sitting time among European adults: 27 country analysis. Prev. Med. 2015, 77, 11–16. [Google Scholar] [CrossRef]
- Harrington, D.M.; Barreira, T.V.; Staiano, A.E.; Katzmarzyk, P.T. The descriptive epidemiology of sitting among US adults, NHANES 2009/2010. J. Sci. Med. Sport 2014, 17, 371–375. [Google Scholar] [CrossRef]
- Straker, L.; Mathiassen, S.E. Increased physical work loads in modern work—A necessity for better health and performance? Ergonomics 2009, 52, 1215–1225. [Google Scholar] [CrossRef] [PubMed]
- Ekelund, U.; Brage, S.; Besson, H.; Sharp, S.; Wareham, N.J. Time spent being sedentary and weight gain in healthy adults: Reverse or bidirectional causality? Am. J. Clin. Nutr. 2008, 88, 612–617. [Google Scholar] [CrossRef] [PubMed]
- Pulsford, R.M.; Stamatakis, E.; Britton, A.R.; Brunner, E.J.; Hillsdon, M.M. Sitting Behavior and Obesity: Evidence from the Whitehall II Study. Am. J. Prev. Med. 2013, 44, 132–138. [Google Scholar] [CrossRef] [PubMed]
- Clark, B.K.; Sugiyama, T.; Healy, G.N.; Salmon, J.; Dunstan, D.W.; Shaw, J.E.; Zimmet, P.Z.; Owen, N. Socio-Demographic Correlates of Prolonged Television Viewing Time in Australian Men and Women: The AusDiab Study. J. Phys. Act. Health 2010, 7, 595–601. [Google Scholar] [CrossRef]
- Van Uffelen, J.G.Z.; Watson, M.J.; Dobson, A.J.; Brown, W.J. Comparison of Self-Reported Week-Day and Weekend-Day Sitting Time and Weekly Time-Use: Results from the Australian Longitudinal Study on Women’s Health. Int. J. Behav. Med. 2010, 18, 221–228. [Google Scholar] [CrossRef] [PubMed][Green Version]
- Jin, R.L.; Shah, C.P.; Svoboda, T.J. The impact of unemployment on health: A review of the evidence. Can. Med. Assoc. J. 1995, 153, 529–540. [Google Scholar] [CrossRef]
- Scanlan, J.N.; Bundy, A.C.; Matthews, L.R. Promoting wellbeing in young unemployed adults: The importance of identifying meaningful patterns of time use. Aust. Occup. Ther. J. 2011, 58, 111–119. [Google Scholar] [CrossRef]
- Robert, G.; Wood, B. The effects of marriage on health: A synthesis of recent research. Math. Policy Res. 2007, 3, 1–10. [Google Scholar]


| Variables | T1 (n = 4349) | T2 (n = 1912) | T3 (n = 1560) |
|---|---|---|---|
| Age (years) (mean (SD)) | 34.4 (8.1) | 39.0 (7.7) | 41.2 (7.6) |
| Age category n (%) | |||
| 18–25 years | 741 (17.4) | 121 (6.6) | 42 (2.97) |
| 26–35 years | 1299 (30.1) | 422 (23.1) | 307 (20.3) |
| 36–45 years | 2252 (52.4) | 1286 (70.3) | 1161 (76.8) |
| BMI (kg/m2) (mean, SD) | 26.05 (6.0) | 26.8 (6.3) | 26.7 (6.3) |
| BMI category (kg/m2) n (%) | |||
| Normal (18–25) | 2153 (52.7) | 801 (43.2) | 682 (44.7) |
| Overweight (2630) | 1037 (25.4) | 479 (25.9) | 323 (25.9) |
| Obese (>30) | 892 (21.8) | 572 (30.9) | 439 (29.4) |
| General health n (%) | |||
| Excellent | 392 (9.1) | 205 (11.2) | 176 (11.7) |
| Very good | 1508 (34.8) | 706 (38.2) | 581 (38.6) |
| Good | 1799 (41.5) | 730 (39.5) | 571 (39.7) |
| Poor or fair | 631 (14.6) | 207 (11.2) | 149 (9.9) |
| Smoking n (%) | |||
| Never smoked | 2183 (50.2) | 955 (51.7) | 817 (53.5) |
| Used to smoke | 1066 (24.5) | 542 (29.4) | 440 (29.8) |
| Smoke occasionally | 411 (9.5) | 125 (6.7) | 97 (6.5) |
| Current smoker | 684 (15.8) | 225 (12.1) | 153 (10.2) |
| Area of residence n (%) | |||
| Urban | 2016 (46.4) | 669 (39.6) | 587 (39.7) |
| Rural | 2331 (53.6) | 1020 (60.4) | 891 (60.3) |
| Marital Status n (%) | |||
| Married | 2829 (65.5) | 1384 (73.3) | 1122 (74.6) |
| Widowed/separated/divorced | 370 (8.5) | 83 (4.5) | 67 (4.4) |
| Never married | 1122 (26.0) | 413 (22.4) | 315 (20.9) |
| Education level n (%) | |||
| Low (did not complete high school) | 946 (22.1) | 372 (20.6) | 266 (17.7) |
| Medium (completed high school) | 2216 (51.7) | 899 (48.6) | 713 (47.4) |
| High (completed tertiary education) | 1120 (26.2) | 580 (30.9) | 525 (34.9) |
| Employment status n (%) | |||
| Working full-time | 1613 (38.1) | 739 (38.9) | 610 (39.6) |
| Working part-time | 1245 (29.4) | 652 (34.4) | 576 (37.4) |
| Not working | 1372 (32.4) | 505 (26.6) | 354 (22.9) |
| Household gross income n (%) | |||
| No income | 294 (7.4) | 125 (7.0) | 98 (6.6) |
| $1–699 AUD/week | 2235 (56.5) | 885 (49.8) | 667 (45.2) |
| $700–1499 AUD/week | 880 (22.2) | 485 (27.3) | 465 (31.5) |
| $1500 AUD and above /week | 99 (2.5) | 103 (5.8) | 115 (7.8) |
| Do not know/want to answer | 448 (11.3) | 179 (10.1) | 131 (8.9) |
| Number of children n (%) | |||
| None | 1678 (39.4) | 63 (5.1) | 99 (9.7) |
| One | 787 (18.5) | 327 (26.3) | 270 (26.4) |
| Two | 1086 (25.5) | 511 (41.2) | 403 (39.4) |
| Three or more | 713 (16.7) | 340 (27.4) | 252 (24.6) |
| Variables | Sitting Time (h/week) | ||
|---|---|---|---|
| T1 (2007–2008) | T2 (2010–2011) | T3 (2012–2013) | |
| Age (years) | |||
| 18–25 | 44.0 (20.9) | 41.2 (20.2) | 46.3 (18.3) |
| 26–35 | 42.6 (22.0) | 41.7 (21.7) | 39.9 (20.1) |
| 36–45 | 39.2 (29.2) | 39.9 (21.4) | 40.0 (20.6) |
| BMI (kg/m2) | |||
| Normal (18–25) | 39.7 (21.4) | 38.8 (19.0) | 39.2 (19.9) |
| Overweight (26–30) | 41.2 (21.3) | 41.9 (20.8) | 40.0 (20.1) |
| Obese (>30) | 43.1 (21.9) | 43.3 (21.4) | 42.1 (20.2) |
| Area of residence | |||
| Urban | 43.7 (22.0) | 43.1 (21.3) | 42.3 (20.9) |
| Rural | 38.6 (20.7) | 38.6 (21.3) | 38.6 (20.1) |
| General health | |||
| Excellent | 38.4 (20.9) | 38.0 (21.3) | 38.4 (20.0) |
| Very good | 40.9 (21.4) | 39.1 (20.9) | 39.3 (19.6) |
| Good | 41.4 (21.6) | 41.2 (21.2) | 40.1 (20.4) |
| Poor/fair | 42.6 (21.3) | 44.9 (23.7) | 46.3 (23.5) |
| Smoking | |||
| Never smoked | 40.8 (21.3) | 40.1 (21.3) | 40.3 (21.2) |
| Used to smoke | 40.9 (23.2) | 40.3 (20.9) | 40.7 (19.3) |
| Smoke occasionally | 41.0 (21.0) | 41.2 (23.7) | 40.9 (19.2) |
| Smoke regularly | 41.4 (22.3) | 41.8 (22.1) | 37.2 (20.1) |
| Education | |||
| Low | 38.9 (21.5) | 40.8 (22.8) | 39.1 (19.8) |
| Medium | 41.4 (22.0) | 40.7 (19.3) | 39.8 (20.4) |
| High | 41.9 (20.5) | 40.0 (20.3) | 41.2 (21.0) |
| Employment | |||
| Working full-time | 45.9 (21.2) | 43.2 (21.0) | 44.1 (20.2) |
| Working part-time | 38.8 (21.6) | 38.6 (20.8) | 37.3 (19.2) |
| Not working | 37.2 (20.8) | 38.5 (20.3) | 37.8 (21.9) |
| Average gross household income | |||
| None | 36.0 (21.6) | 37.9 (21.8) | 37.4 (21.7) |
| $1–699 AUD/week | 39.8 (21.4) | 39.2 (21.5) | 37.0 (18.7) |
| $700–1499 AUD/week | 45.8 (20.6) | 44.1 (20.2) | 44.1 (20.8) |
| $1500 AUD and above/week | 54.1 (20.9) | 45.1 (20.6) | 48.6 (20.6) |
| Don’t know/want to answer | 40.4 (21.8) | 38.8 (22.2) | 36.7 (20.3) |
| Marital status | |||
| Married | 39.4 (21.2) | 39.3 (21.4) | 39.5 (20.5) |
| Separated/divorced/widowed | 39.3 (21.7) | 38.1 (20.2) | 35.4 (19.4) |
| Never married | 46.8 (21.3) | 44.8 (21.4) | 45.0 (20.4) |
| Number of children | |||
| None | 46.8 (20.9) | 47.2 (21.9) | 41.8 (22.7) |
| One | 39.7 (22.0) | 38.8 (21.4) | 37.6 (19.6) |
| Two | 37.3 (21.1) | 37.2 (21.4) | 37.3 (19.9) |
| Three or more | 34.7 (19.5) | 34.9 (19.8) | 35.1 (19.5) |
| Unadjusted Model | Adjusted Model | ||||||
|---|---|---|---|---|---|---|---|
| Variables | β-Coefficient (95% CI) | p-Value | β-Coefficient (95% CI) | p-Value | |||
| Age category a | Baseline difference | ||||||
| 18–25 years | Ref | Ref | |||||
| 26–35 years | −1.3 | (−3.9, 0.8) | 0.216 | −0.4 | (−2.5, 1.6) | 0.694 | |
| 36–45 years | −4.5 | (−6.4, −2.6) | <0.001 | −1.3 | (−3.2, −0.7) | 0.214 | |
| Average change per year | −0.3 | (−1.0, 0.3) | 0.312 | −0.3 | (−0.9, 0.3) | 0.328 | |
| 18–25 years | |||||||
| 26–35 years | −0.3 | (−1.1, 0.4) | 0.382 | −0.2 | (−1.0, 0.5) | 0.499 | |
| 36–45 years | 0.5 | (−0.2, 1.2) | 0.164 | 0.5 | (−0.2, 1.1) | 0.166 | |
| BMI b | Baseline difference | ||||||
| Normal | Ref | Ref | |||||
| Overweight (26–30) | 1.8 | (0.1, 3.4) | 0.038 | 2.0 | (0.6, 3.8) | 0.008 | |
| Obese (>30) | 3.3 | (1.6, 5.1) | <0.001 | 3.3 | (1.5, 5.1) | <0.001 | |
| Average change per year | 0.0 | (−0.3, 0.3) | 0.963 | 0.1 | (−0.2, 0.4) | 0.495 | |
| Normal | |||||||
| Overweight | −0.3 | (−0.8, 0.3) | 0.302 | −0.3 | (−0.8, 0.2) | 0.194 | |
| Obese (>30) | −0.4 | (−0.9, 0.2) | 0.178 | −0.4 | (−1.0, 0.1) | 0.131 | |
| Area of Residence c | Baseline difference | ||||||
| Urban | Ref | Ref | |||||
| Rural | −5.1 | (−6.4, −3.7) | <0.001 | −3.5 | (−4.9, −2.2) | <0.001 | |
| Average change per year | −0.2 | (−0.6, 0.1) | 0.174 | −0.2 | (−0.5, 0.1) | 0.217 | |
| Urban | |||||||
| Rural | 0.2 | (−0.2, 0.6) | 0.322 | 0.2 | (−0.2, 0.7) | 0.279 | |
| General | Baseline difference | ||||||
| Health d | Excellent | Ref | Ref | ||||
| Very good | 1.7 | (−0.7, 4.3) | 0.174 | 0.8 | (−1.6, 3.2) | 0.541 | |
| Good | 2.8 | (0.3, 5.2) | 0.020 | 1.1 | (−1.3, 3.6) | 0.350 | |
| Poor/fair | 4.5 | (1.6, 7.3) | 0.002 | 1.7 | (−1.2, 4.7) | 0.238 | |
| Average change per year | −0.1 | (−0.8, 0.5) | 0.678 | −0.1 | (−0.6, 0.7) | 0.961 | |
| Excellent | |||||||
| Very good | 0.1 | (−0.7, 0.8) | 0.833 | 0.0 | (−0.7, 0.8) | 0.900 | |
| Good | −0.2 | (−0.9, 0.5) | 0.580 | −0.3 | (−1.0, 0.5) | 0.475 | |
| Poor/fair | 0.4 | (−0.5, 1.2) | 0.363 | 0.3 | (−0.6, 1.1) | 0.488 | |
| Smoking | Baseline difference | ||||||
| Status e | No smoking | Ref | Ref | ||||
| Used to smoke | 0.0 | (−1.6, 1.7) | 0.956 | 1.0 | (−0.6, 2.7) | 0.213 | |
| Smoke occasionally | 0.1 | (−2.3, 2.5) | 0.958 | −0.8 | (−3.1, 1.6) | 0.511 | |
| Smoke regularly | 1.1 | (−0.8, 3.1) | 0.256 | 1.1 | (−0.9, 3.1) | 0.297 | |
| Average change per year | −0.1 | (−0.4, 0.2) | 0.410 | 0.0 | (−0.3, 0.3) | 0.962 | |
| No smoking | |||||||
| Used to smoke | 0.0 | (−0.5, 0.5) | 0.918 | 0.0 | (−0.5, 0.5) | 0.896 | |
| Smoke occasionally | 0.3 | (−0.5, 1.1) | 0.407 | 0.3 | (−0.5, 1.1) | 0.488 | |
| Smoke regularly | −0.5 | (−1.1, 0.2) | 0.170 | −0.5 | (−1.2, 0.1) | 0.102 | |
| Education | Baseline difference | ||||||
| Status f | Low | Ref | Ref | ||||
| Medium | 1.9 | (0.1, 3.6) | 0.035 | 0.2 | (−1.5, 1.9) | 0.813 | |
| High | 2.2 | (0.3, 4.2) | 0.025 | 0.0 | (−1.9, 2.0) | 0.986 | |
| Average change per year | 0.0 | (−0.5, 0.4) | 0.914 | 0.0 | (−0.5, 0.4) | 0.891 | |
| Low | |||||||
| Medium | −0.2 | (−0.8, 0.3) | 0.380 | −0.1 | (−0.7, 0.4) | 0.617 | |
| High | 0.0 | (−0.6, 0.5) | 0.913 | 0.1 | (−0.5, 0.7) | 0.781 | |
| Employment | Baseline difference | ||||||
| Status g | Full-time | Ref | Ref | ||||
| Working part-time | −6.4 | (−8.1, −4.8) | <0.001 | −5.1 | (−6.7, −3.4) | <0.001 | |
| Not working | −8.4 | (−10.0, −6.8) | <0.001 | −7.6 | (−9.2, −6.0) | <0.001 | |
| Average change per year | −0.5 | (−0.8, −0.1) | 0.006 | −0.4 | (−0.7, −0.05) | 0.023 | |
| Full-time | |||||||
| Working part-time | 0.4 | (−0.1, 0.9) | 0.083 | 0.4 | (−0.04, 1.01) | 0.146 | |
| Not working | 0.6 | (0.05, 1.1) | 0.026 | 0.5 | (0.05, 1.1) | 0.031 | |
| Average Gross Income h | Baseline difference | ||||||
| Nil | Ref | Ref | |||||
| $1–699 AUD/week | 2.9 | (0.5, 5.3) | 0.017 | 1.8 | (−0.6, 4.2) | 0.503 | |
| $700–1499 AUD/week | 8.5 | (5.8, 11.3) | <0.001 | 6.3 | (3.5, 9.0) | 0.002 | |
| $1500 AUD and above/week | 16.5 | (11.6, 21.3) | <0.001 | 14.4 | (9.7, 19.2) | <0.001 | |
| Don’t know/want to answer | 3.2 | (0.1, 6.3) | 0.042 | 1.6 | (−1.4, 4.7) | 0.736 | |
| Average change per year | −0.3 | (−0.9, 0.4) | 0.386 | −0.1 | (−0.7, 0.6) | 0.960 | |
| Nil | |||||||
| $1–699 AUD/week | 0.3 | (−0.4, 1.0) | 0.414 | 0.2 | (−0.5, 0.9) | 0.633 | |
| $700–1499 AUD/week | −0.1 | (−0.9, 0.7) | 0.744 | −0.3 | (−1.1, 0.5) | 0.771 | |
| $1500 AUD and above/week | −1.2 | (−2.6, 0.2) | 0.104 | −1.3 | (−2.7, 0.1) | 0.267 | |
| Don’t know/want to answer | −0.5 | (−1.4, 0.6) | 0.343 | −0.7 | (−1.7, 0.3) | 0.186 | |
| Marital Status i | Baseline difference | ||||||
| Married | Ref | Ref | |||||
| Separated/divorced/widowed | 0.1 | (−2.3, 2.6) | 0.915 | −0.3 | (−2.7, 2.1) | 0.819 | |
| Never married | 7.4 | (5.8, 9.0) | <0.001 | 4.8 | (2.9, 6.5) | <0.001 | |
| Average change per year | −0.1 | (−0.3, 0.1) | 0.382 | −0.1 | (−0.3, 0.2) | 0.542 | |
| Married | |||||||
| Separated/divorced/widowed | 0.4 | (−0.4, 1.2) | 0.291 | 0.4 | (−0.4, 1.2) | 0.357 | |
| Never married | −0.1 | (−0.6, 0.4) | 0.696 | −0.2 | (−0.8, 0.3) | 0.503 | |
| Number of Children j | Baseline difference | ||||||
| No children | Ref | Ref | |||||
| One | −6.3 | (−8.5, −4.7) | <0.001 | −3.7 | (−5.7, −1.7) | <0.001 | |
| Two | −9.1 | (−10.8, −7.4) | <0.001 | −5.5 | (−7.3, −3.6) | <0.001 | |
| Three or more | −11.8 | (−13.7, −9.8) | <0.001 | −7.4 | (−9.5, −5.3) | <0.001 | |
| Average change per year | −0.7 | (−1.1, −0.4) | <0.001 | −0.6 | (−1.1, −0.3) | 0.001 | |
| No children | |||||||
| One | 0.5 | (−0.1, 1.1) | 0.114 | 0.5 | (−0.1, 1.1) | 0.102 | |
| Two | 0.9 | (0.3, 1.4) | 0.001 | 1.0 | (0.4, 1.5) | <0.001 | |
| Three or more | 1.5 | (0.9, 2.1) | <0.001 | 1.5 | (0.9, 2.1) | <0.001 | |
Publisher’s Note: MDPI stays neutral with regard to jurisdictional claims in published maps and institutional affiliations. |
© 2021 by the authors. Licensee MDPI, Basel, Switzerland. This article is an open access article distributed under the terms and conditions of the Creative Commons Attribution (CC BY) license (https://creativecommons.org/licenses/by/4.0/).
Share and Cite
Nayak, M.; Wills, K.; Teychenne, M.; Salmon, J.; Cleland, V. Patterns and Predictors of Sitting among Women from Disad-Vantaged Neighbourhoods over Time: A 5-Year Prospective Cohort Study. Int. J. Environ. Res. Public Health 2021, 18, 4625. https://doi.org/10.3390/ijerph18094625
Nayak M, Wills K, Teychenne M, Salmon J, Cleland V. Patterns and Predictors of Sitting among Women from Disad-Vantaged Neighbourhoods over Time: A 5-Year Prospective Cohort Study. International Journal of Environmental Research and Public Health. 2021; 18(9):4625. https://doi.org/10.3390/ijerph18094625
Chicago/Turabian StyleNayak, Minakshi, Karen Wills, Megan Teychenne, Jo Salmon, and Verity Cleland. 2021. "Patterns and Predictors of Sitting among Women from Disad-Vantaged Neighbourhoods over Time: A 5-Year Prospective Cohort Study" International Journal of Environmental Research and Public Health 18, no. 9: 4625. https://doi.org/10.3390/ijerph18094625
APA StyleNayak, M., Wills, K., Teychenne, M., Salmon, J., & Cleland, V. (2021). Patterns and Predictors of Sitting among Women from Disad-Vantaged Neighbourhoods over Time: A 5-Year Prospective Cohort Study. International Journal of Environmental Research and Public Health, 18(9), 4625. https://doi.org/10.3390/ijerph18094625