
From Livable Communities to Livable Metropolis: Challenges for Urban Mobility in Lisbon Metropolitan Area (Portugal)


Abstract
1. Introduction
2. Literature Review
2.1. Urban Mobility against Expected Urban Livability
2.2. Measuring Urban Mobility as a Component of Urban Livability
- (1)
- Economic vibrancy and competitive economic performance, economic openness, and infrastructure.
- (2)
- Environmental friendliness and sustainability: pollution, depletion of natural resources, and environmental initiatives.
- (3)
- Domestic security and stability: crime rate, threats to national stability, and civil unrest.
- (4)
- Sociocultural conditions: medical and health care, education and housing, sanitation and transportation, income equality and demographic burden, and diversity and community cohesion.
- (5)
- Political governance: policy-making and implementation, government system, transparency and accountability, corruption.
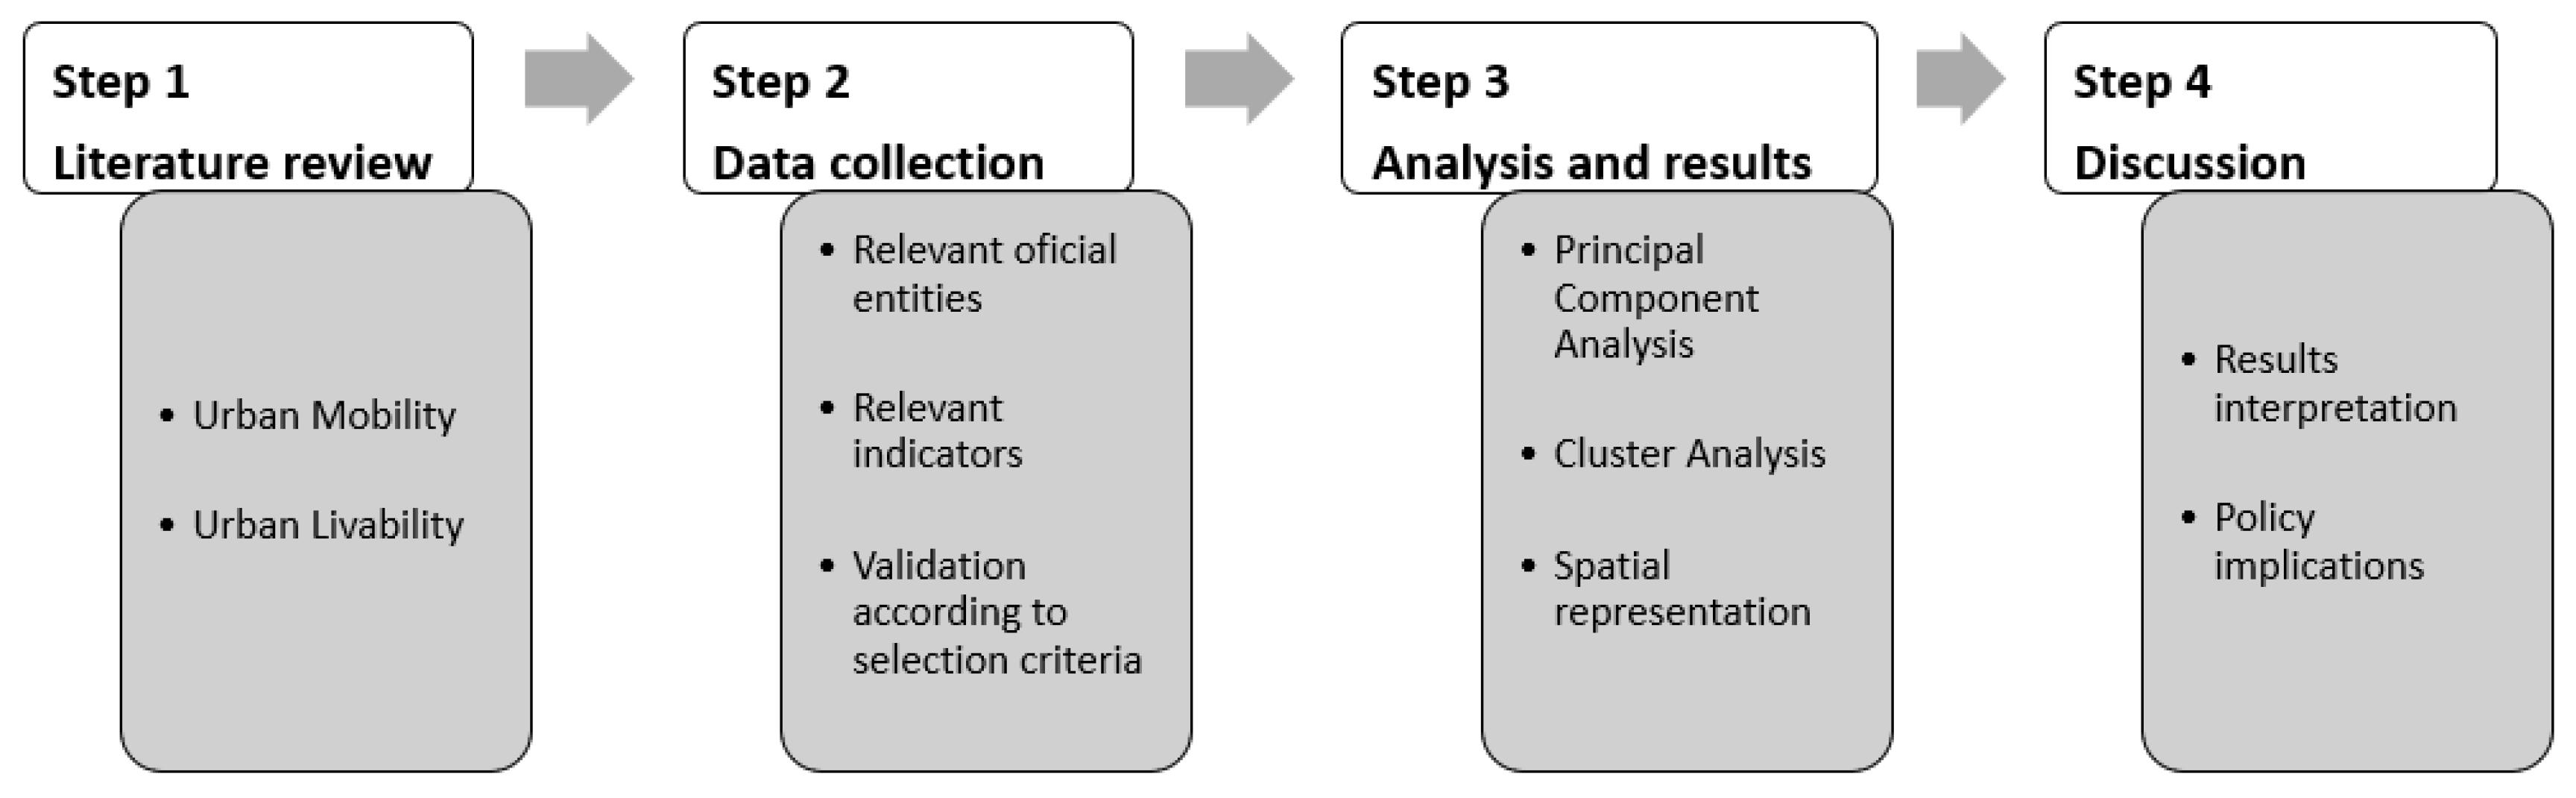
3. Methodology
3.1. Methodological Steps
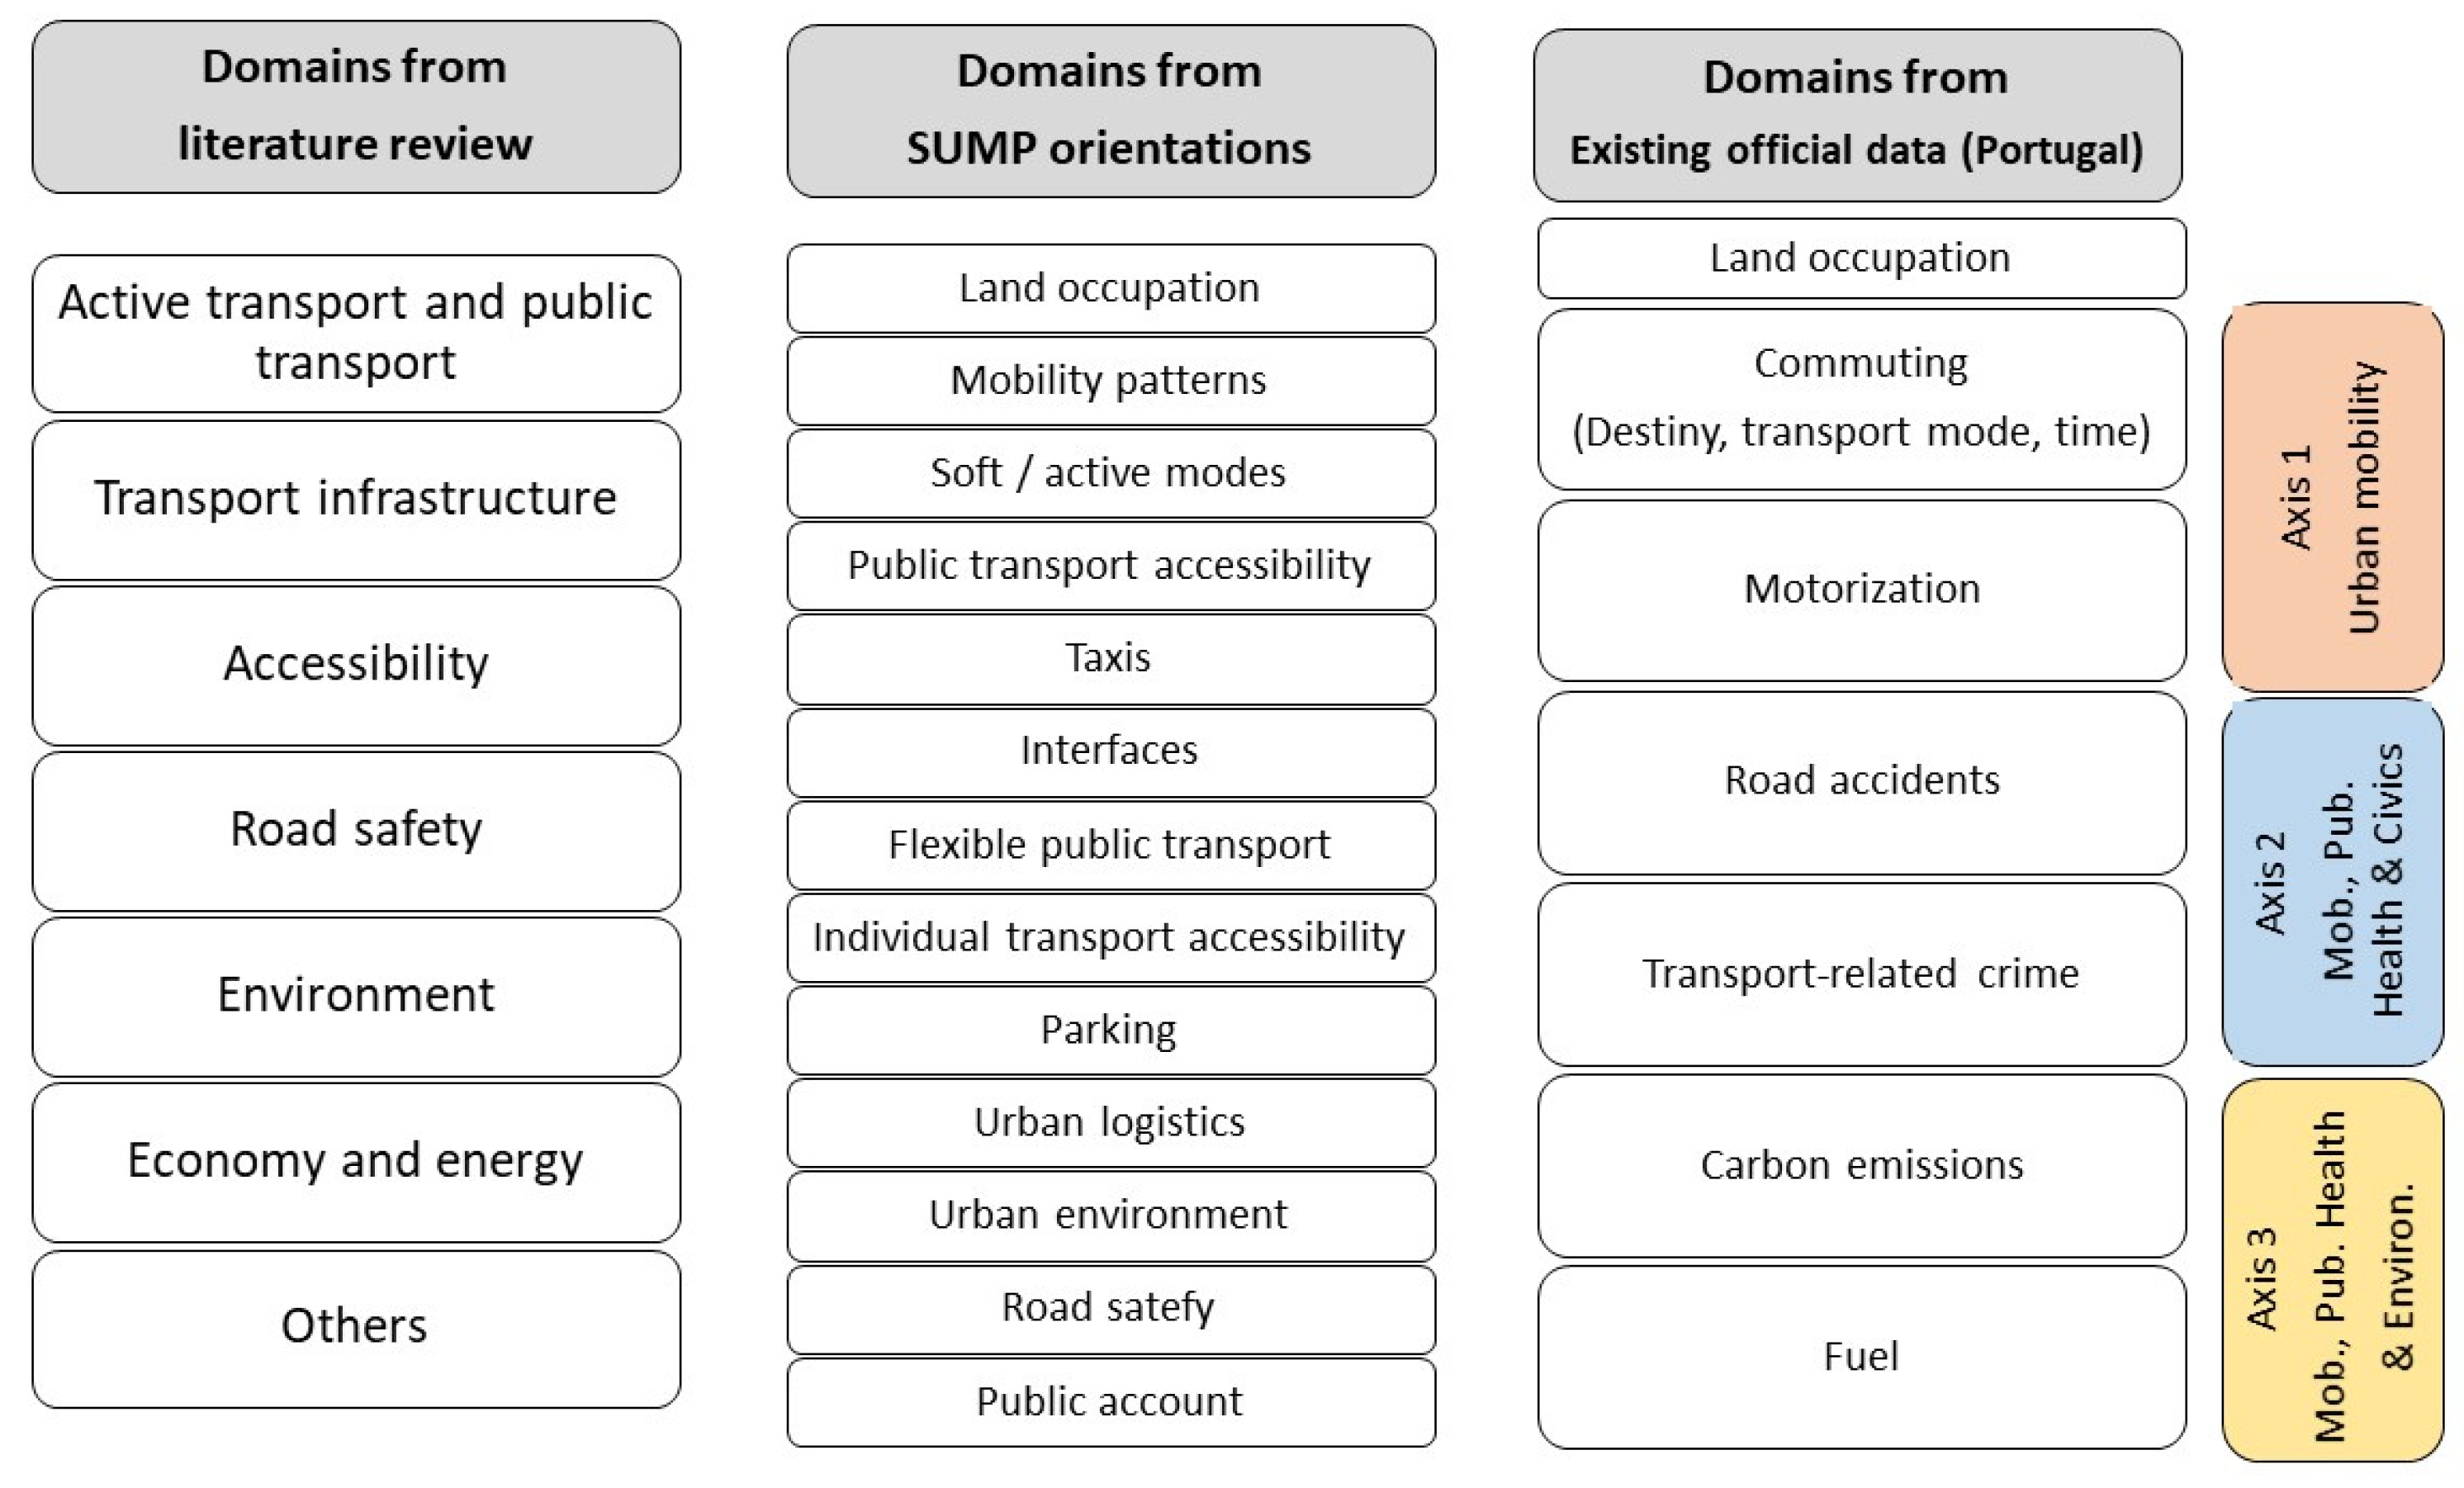
3.2. Data Collection and Main Sources
3.3. Statistical Analysis
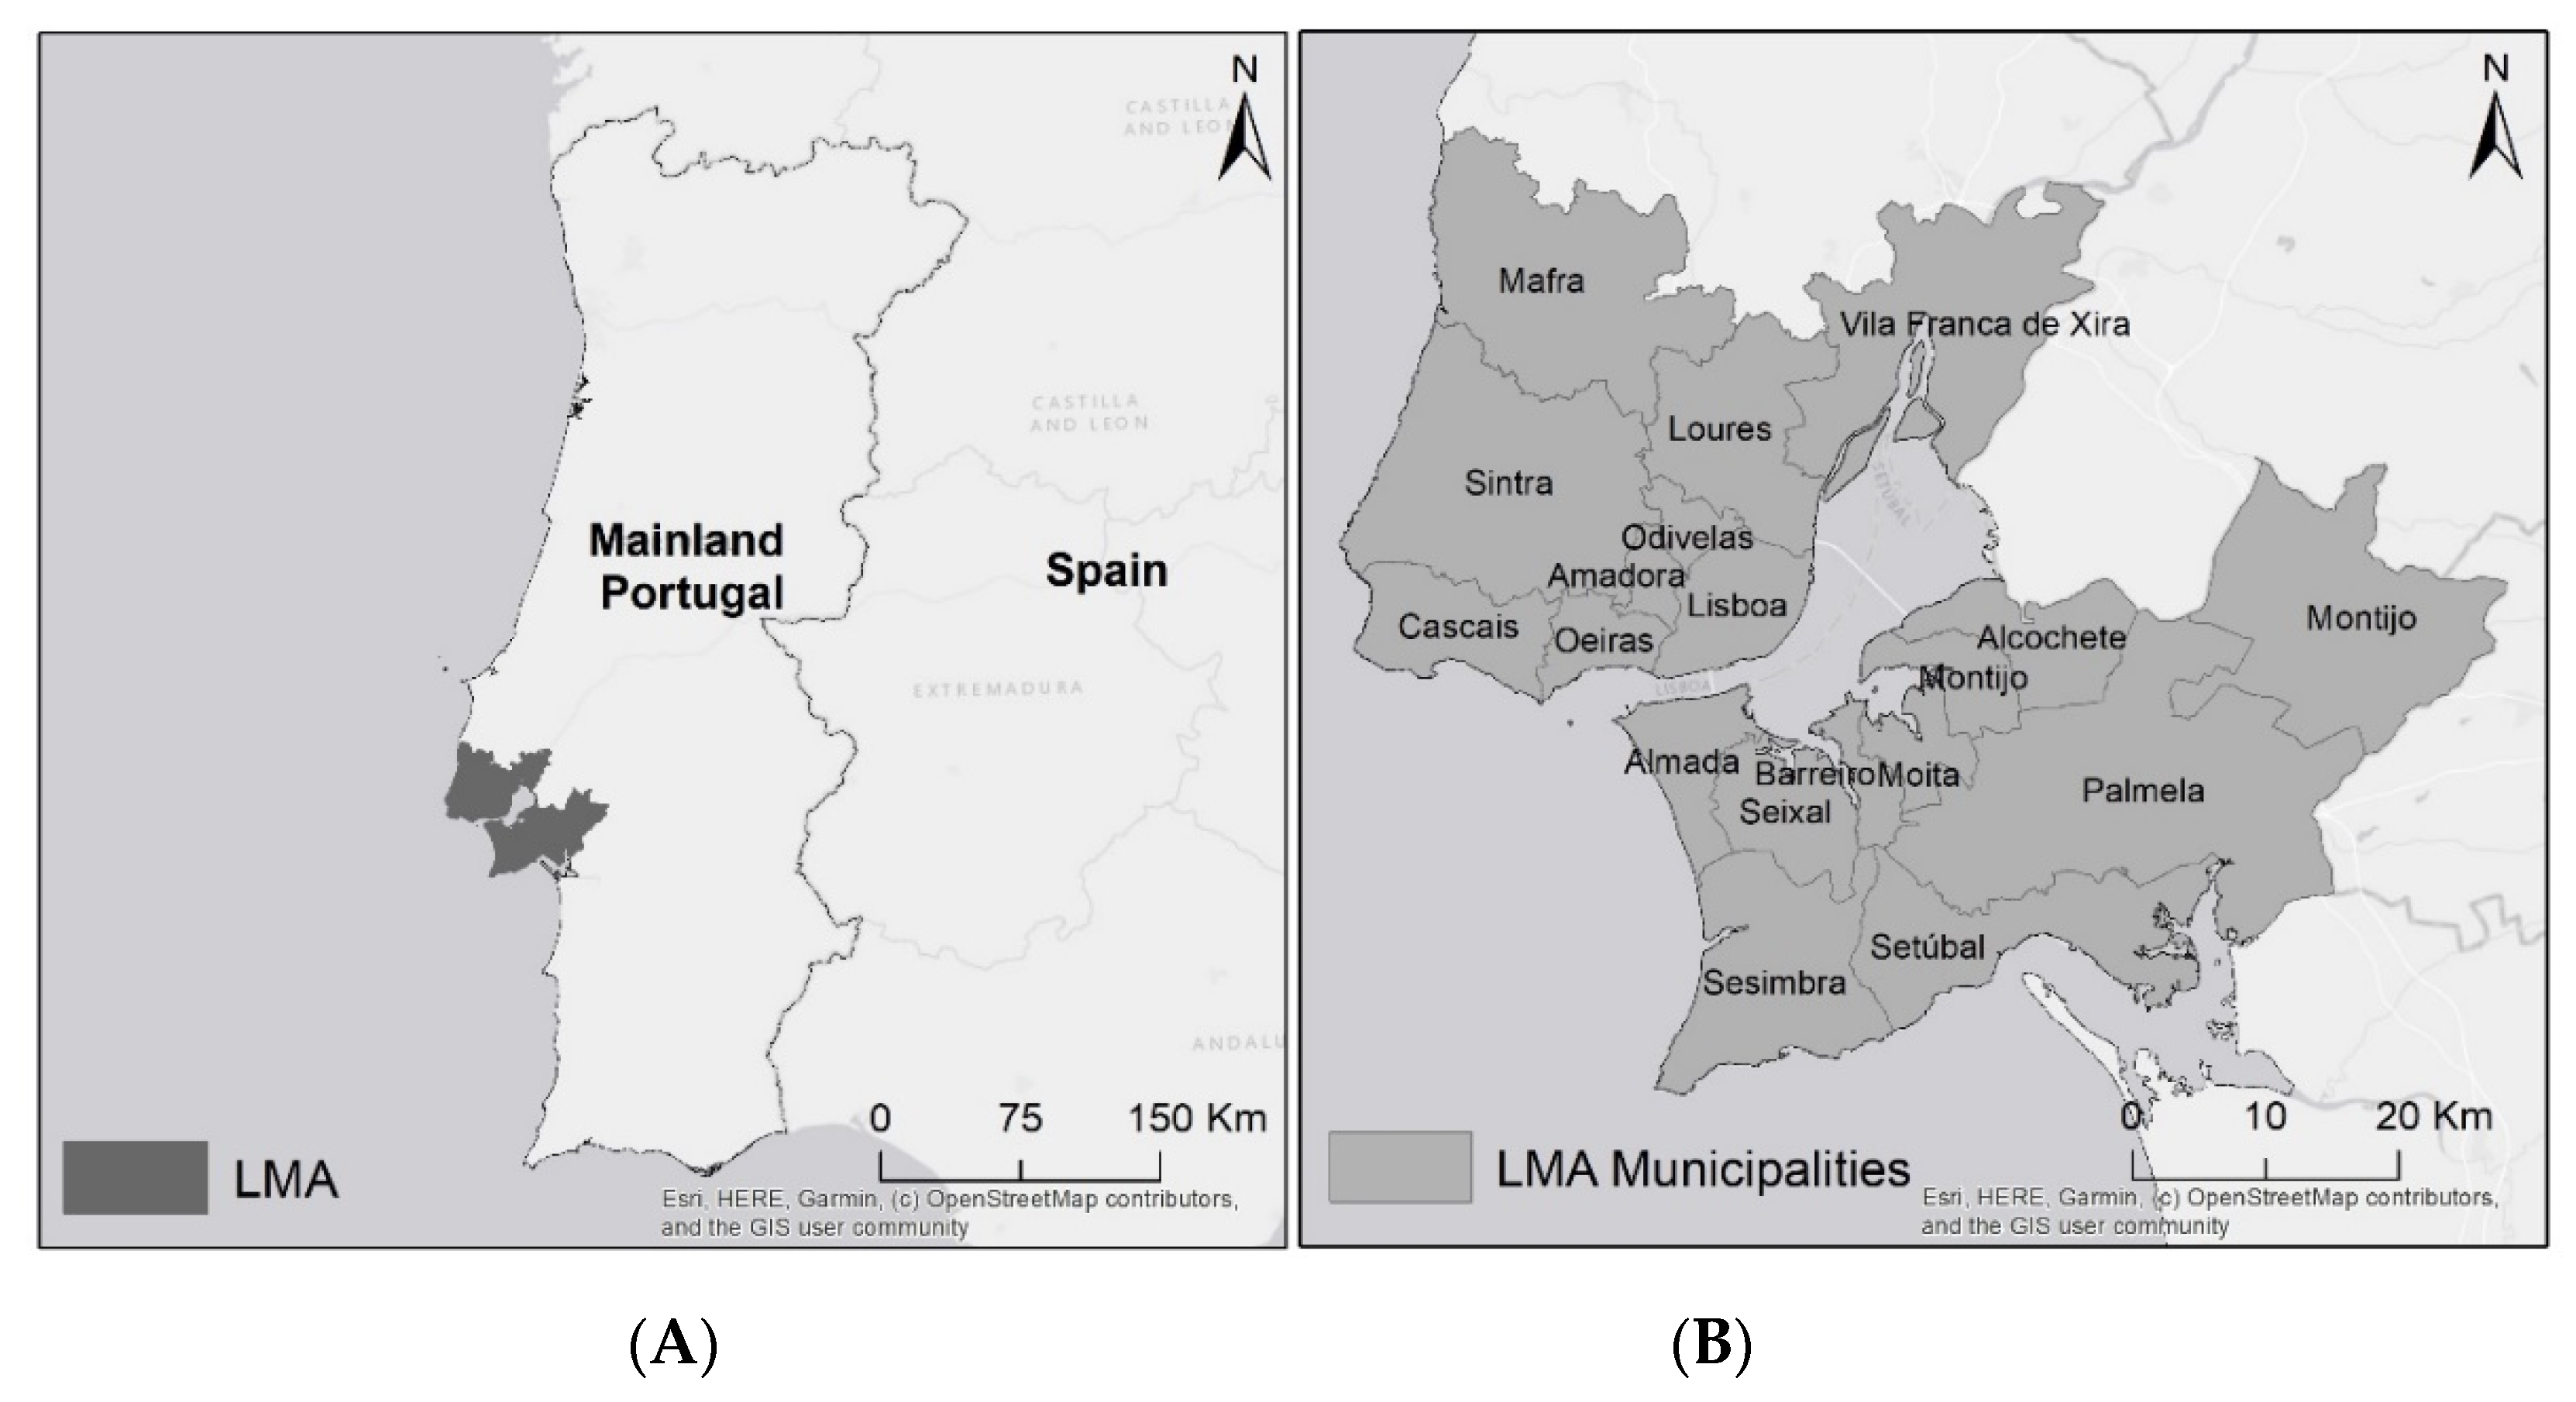
4. Lisbon Metropolitan Area as Study Area
5. Results
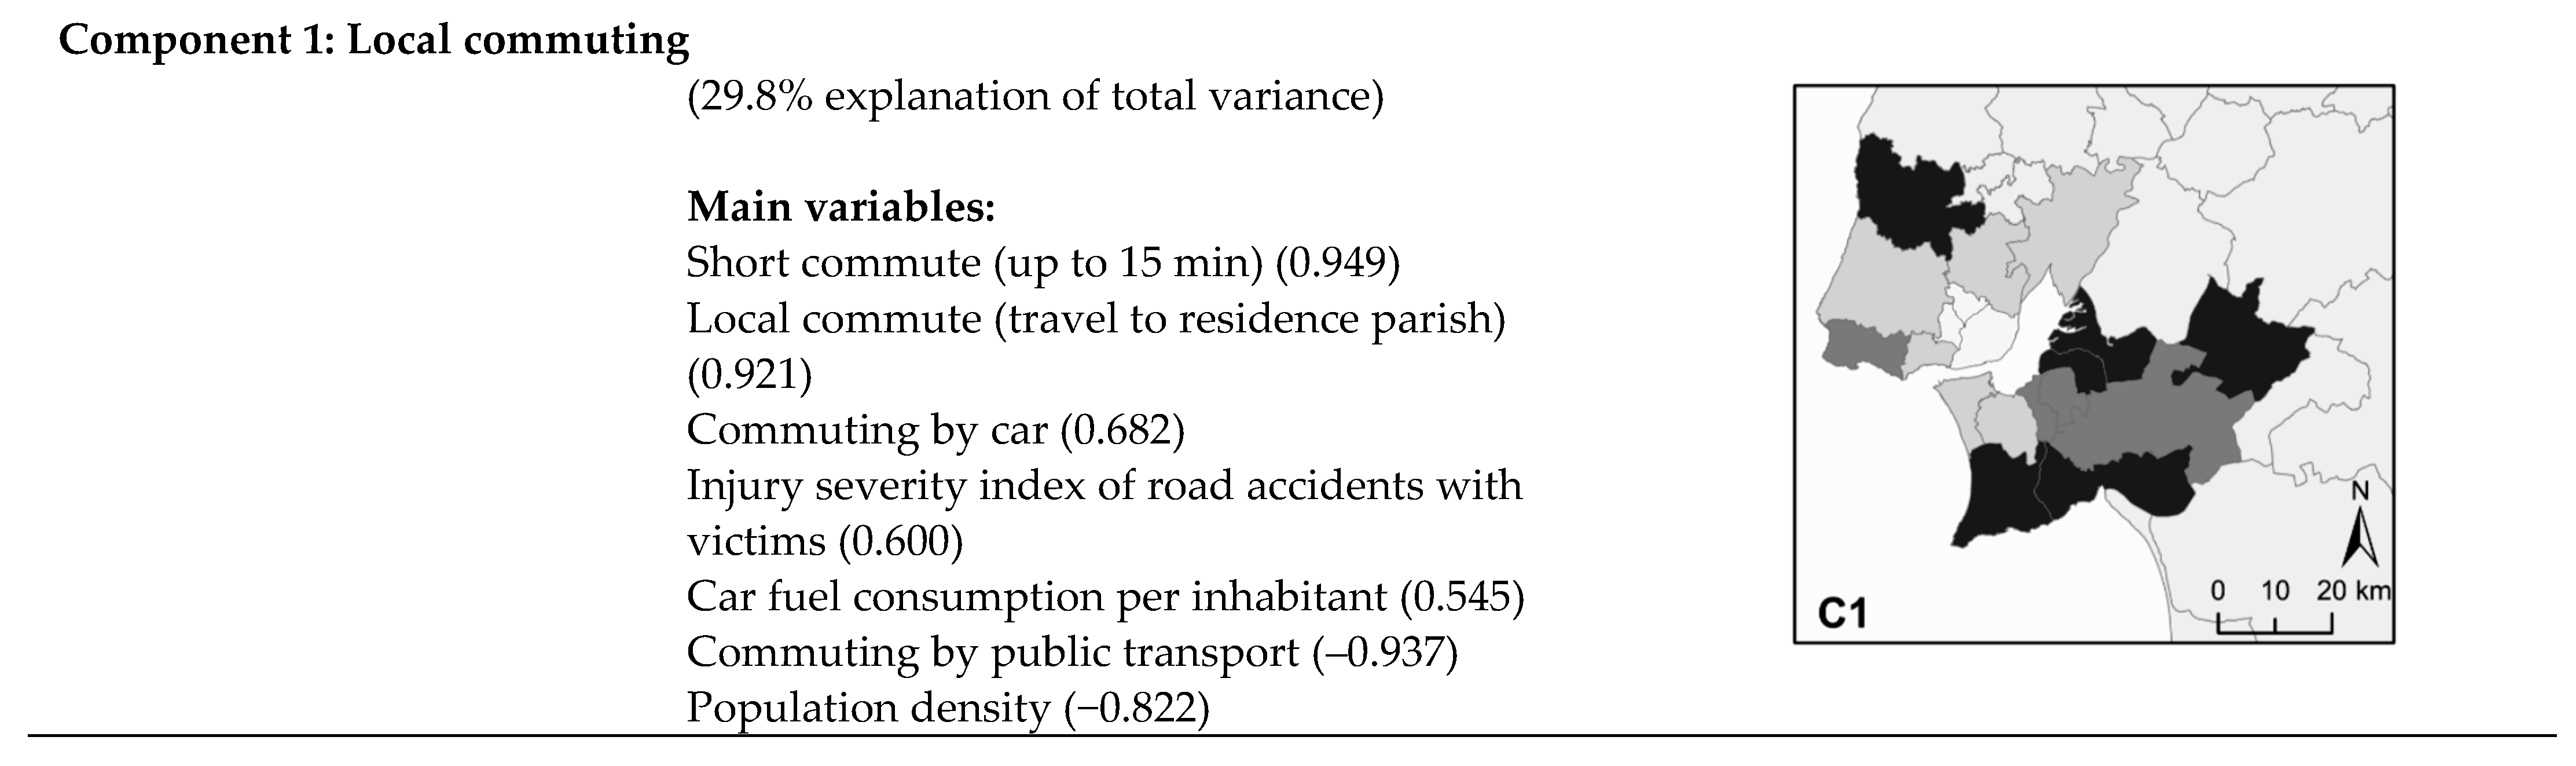
5.1. Results of PCA
5.2. Cluster Analysis Results
6. Discussion
7. Conclusions
Author Contributions
Funding
Institutional Review Board Statement
Informed Consent Statement
Data Availability Statement
Conflicts of Interest
Appendix A

| Clusters | Components | Pop. Density 2011 (Inhab./km2) | Average Distance to Lisbon Major Urban Centers by Car (km) | Employment Attraction Rate (% of Residents) | ||||
|---|---|---|---|---|---|---|---|---|
| C1 | C2 | C3 | C4 | C5 | ||||
| A | −0.81 | −0.53 | 0.00 | −0.11 | 0.37 | 2715 | 22.4 | 11.9 |
| B | 0.01 | −1.03 | −1.28 | −0.73 | −0.91 | 1221 | 41.0 | 6.7 |
| C | 1.22 | 0.37 | −0.25 | −0.52 | −0.30 | 266 | 42.7 | 12.2 |
| D | 0.33 | 0.17 | 1.51 | −0.49 | −0.63 | 1824 | 31.7 | 19.8 |
| E | 0.03 | −0.27 | −2.13 | 1.24 | −1.97 | 2171 | 37.0 | 12.9 |
| F | 1.48 | 0.00 | −0.87 | 0.39 | 2.78 | 101 | 41.0 | 24.3 |
| G | 0.61 | −0.04 | 1.02 | 3.10 | 0.05 | 115 | 47.0 | 24.0 |
| H | −1.12 | 3.44 | −0.50 | −0.17 | 0.26 | 6645 | 0.0 | 77.7 |
| C1 | C2 | C3 | C4 | C5 | |
|---|---|---|---|---|---|
| Pop. density 2011 (inhab./km2) | −0.85746 | 0.779223 | −0.11731 | −0.27728 | −0.14123 |
| Average distance between Lisbon and major urban centers by car (km) | −0.89592 | 0.85031 | −0.13634 | −0.26102 | −0.16353 |
| Employment attraction rate (% of residents) | −0.93532 | 0.899425 | −0.17987 | −0.32285 | −0.19551 |
References
- Black, W.R. Sustainable Transportation—Problems and Solutions; The Guilford Press: New York, NY, USA, 2010. [Google Scholar]
- Pacote da Mobilidade. Available online: http://www.imt-ip.pt/sites/IMTT/Portugues/Planeamento/DocumentosdeReferencia/PacotedaMobilidade/Paginas/QuadrodeReferenciaparaPlanosdeMobilidadeAcessibilidadeeTransportes.aspx (accessed on 19 May 2020).
- Urban Mobility Package. Available online: https://ec.europa.eu/transport/themes/urban/urban-mobility/urban-mobility-package_en (accessed on 19 May 2020).
- Nieuwenhuijsen, M. Urban and transport planning pathways to carbon neutral, liveable and healthy cities; A review of the current evidence. Environ. Int. 2020, 140, 105661. [Google Scholar] [CrossRef]
- Balsas, C. Measuring the livability of an urban centre: An exploratory study of key performance indicators. Plan. Pract. Res. 2004, 19, 101–110. [Google Scholar] [CrossRef]
- Madrid, D.P. The Silesia Megapolis. Master’s Thesis, Blekinge Institute of Technology, School of Technoculture, Humanities and Planning, Tychy, Poland, 2008. [Google Scholar]
- GO TO 2014—Chicago Metropolitan Agency for Planning. Available online: https://www.cmap.illinois.gov/about/2040 (accessed on 19 July 2020).
- Namini, R.S.; Loda, M.; Meshkini, A.; Roknedineftekhari, A. Comparative evaluation of livability indicators of the metropolitan Tehran’s districts. Int. J. Urban Sustain. Dev. 2019, 11, 48–67. [Google Scholar] [CrossRef]
- Al-Thani, S.K.; Amato, A.; Koç, M.; Al-Ghamdi, S.G. Urban Sustainability and Livability: An Analysis of Doha’s Urban-form and Possible Mitigation Strategies. Sustainability 2019, 11, 786. [Google Scholar] [CrossRef]
- UPAT. Livable Cities in a Rapidly Urbanizing World; ISOCARP: Singapore, 2010; p. 28. [Google Scholar]
- Geller, A.L. Smart Growth: A Prescription for Livable Cities. Am. J. Public Health 2003, 93, 1410–1415. [Google Scholar] [CrossRef]
- Genter, J.A.; Donovan, S.; Petrenas, B.; Badland, H. Valuing the Health Benefits of Active Transport Modes; NZTA Research Report 359; NZ Transport Agency: Wellington, New Zealand, 2008; p. 72.
- Sallis, J.F.; Frank, L.D.; Saelens, B.E.; Kraft, M.K. Active transportation and physical activity: Opportunities for collaboration on transportation and public health research. Transp. Res. Part A Policy Pract. 2004, 38, 249–268. [Google Scholar] [CrossRef]
- Zijlema, W.L.; Avila-Palencia, I.; Triguero-Mas, M.; Gidlow, C.; Maas, J.; Kruize, H.; Andrusaityte, S.; Grazuleviciene, R.; Nieuwenhuijen, M.J. Active commuting through natural environments is associated with better mental health: Results from the PHENOTYPE project. Environ. Int. 2018, 121, 721–727. [Google Scholar] [CrossRef]
- Avila-Palencia, I.; Panis, L.I.; Dons, E.; Gaupp-Berghausen, M.; Raser, E.; Götschi, R.; Brand, C.; Nazelle, A.; Orjuela, J.P.; Anaya-Boing, E.; et al. The effects of transport mode use on self-perceived health, mental health, and social contact measures: A cross-sectional and longitudinal study. Environ. Int. 2018, 120, 199–206. [Google Scholar] [CrossRef]
- Dons, E.; Rojas-Rueda, D.; Anaya-Boing, E.; Avila-Palencia, I.; Brand, C.; Cole-Hunter, T.; Nazelle, A.; Eriksson, U.; Gaupp-Berghausen, M.; Gerike, R.; et al. Transport mode choice and body mass index: Cross-sectional and longitudinal evidence from a European-wide study. Environ. Int. 2018, 119, 108–116. [Google Scholar] [CrossRef]
- Louro, A.; Marques da Costa, N.; Marques da Costa, E. Active transport for livable communities in Lisbon Metropolitan Area (Portugal)—Who, where, and for what? In Proceedings of the American Association of Geographers Annual Meeting, Washington, DC, USA, 3–7 April 2019. [Google Scholar]
- Banister, D. The sustainable mobility paradigm. Transp. Policy 2008, 15, 73–80. [Google Scholar] [CrossRef]
- Shamsuddin, S.; Abu Hassan, N.R.; Bilyamin, S.F.I. Walkable Environment in Increasing the Liveability of a City. Procedia Soc. Behav. Sci. 2012, 50, 167–178. [Google Scholar] [CrossRef]
- De Montis, A.; Chessa, A.; Campagna, M.; Caschili, S.; Deplano, G. Modeling commuting systems through a complex network analysis. J. Transp. Land Use 2010, 2, 39–55. [Google Scholar] [CrossRef]
- Ferreira, J.P.; Barata, E.; Nogueira Ramos, P.; Cruz, L. Economic, social, energy and environmental assessment of inter-municipality commuting: The case of Portugal. Energy Policy 2014, 66, 411–418. [Google Scholar] [CrossRef]
- Fan, Y.; Khattak, A.; Rodríguez, D. Household excess travel and neighbourhood characteristics: Associations and trade-offs. Urban Stud. 2010, 48, 1235–1253. [Google Scholar] [CrossRef]
- Kang-Rae, M.; Banister, D. Excess Commuting: A Critical Review. Transp. Rev. 2016, 26, 749–767. [Google Scholar] [CrossRef]
- Choi, J.; Coughlin, J.F.; D’Ambrosio, L. Travel time and subjective well-being. Transp. Res. Rec. 2013, 2357, 100–108. [Google Scholar] [CrossRef]
- Johnson, R.; Shaw, J.; Berding, J.; Gather, M.; Rebstock, M. European national government approaches to older people’s transport system needs. Transp. Policy 2017, 59, 17–27. [Google Scholar] [CrossRef]
- Serebrisky, T.; Gómez-Lobo, A.; Estupiñán, N.; Muñoz-Raskin, R. Affordability and Subsidies in Public Urban Transport: What Do We Mean, What Can Be Done? Transp. Rev. 2009, 29, 715–739. [Google Scholar] [CrossRef]
- Cervero, R. State Roles in Providing Affordable Mass Transport Services for Low-Income Residents; International Transport Forum Discussion Paper, No. 2011-17; Organisation for Economic Co-operation and Development (OECD), International Transport Forum: Paris, France, 2011. [Google Scholar]
- Simon, M.C.; Hermitte, T.; Page, Y. Intersection road accident causation: A European view. In Proceedings of the 21st International Technical Conference on the Enhanced Safety of Vehicles, Stuttgart, Germany, 15–18 June 2009. [Google Scholar]
- Eksler, V.; Lassarre, S.; Thomas, I. Regional analysis of road mortality in Europe. Public Health 2008, 122, 826–837. [Google Scholar] [CrossRef]
- Farchi, S.; Molino, N.; Rossi, P.G.; Borgia, P.; Krzyzanowski, M.; Dalbokova, D.; Kim, R. Defining a common set of indicators to monitor road accidents in the European Union. BMC Public Health 2006, 6, 183. [Google Scholar] [CrossRef]
- Louro, A.; Marques da Costa, N.; Marques da Costa, E. Sustainable urban mobility policies as a path to Healthy Cities—The case study of LMA, Portugal. Sustainability 2019, 11, 2929. [Google Scholar] [CrossRef]
- Wang, J.; Lu, H.; Sun, Z.; Wang, T. Exploring Factors Influencing Injury Severity of Vehicle At-Fault Accidents: A Comparative Analysis of Passenger and Freight Vehicles. Int. J. Environ. Res. Public Health 2020, 17, 1146. [Google Scholar] [CrossRef]
- Siliquini, R.; Bert, F.; Alonso, F. Correlation between driving-related skill and alcohol use in young-adults from six European countries: The TEN-D by Night Project. BMC Public Health 2011, 11, 1–11. [Google Scholar] [CrossRef]
- Jonah, B.A.; Boase, P. Speeding and other risky. In Handbook of Teen and Novice Drivers. Research, Practice, Policy, and Directions; Fisher, D.L., Caird, J., Horrey, W., Trick, L., Eds.; CRC Press: Boca Raton, FL, USA, 2016; pp. 145–168. [Google Scholar]
- Aarts, L.; van Schagen, I. Driving speed and the risk of road crashes: A review. Accid. Anal. Prev. 2006, 38, 215–224. [Google Scholar] [CrossRef] [PubMed]
- Boulagouas, W.; García-Herrero, S.; Chaib, R.; Febres, J.D.; Mariscal, M.Á.; Djebabra, M. An Investigation into Unsafe Behaviors and Traffic Accidents Involving Unlicensed Drivers: A Perspective for Alignment Measurement. Int. J. Environ. Res. Public Health 2020, 17, 6743. [Google Scholar] [CrossRef]
- Ayres, J.G.; Forsberg, B.; Annesi-Maesano, I.; Dey, R.; Ebi, K.L.; Helms, P.J.; Medina-Ramón, M.; Windt, M.; Forastiere, F. Climate change and respiratory disease: European Respiratory Society position statement. Eur. Respir. J. 2009, 34, 295–302. [Google Scholar] [CrossRef]
- Sommar, J.N.; Johansoon, C.; Lövenheim, B.; Markstedt, A.; Strömgren, M.; Forsberg, B. Potential Effects on Travelers’ Air Pollution Exposure and Associated Mortality Estimated for a Mode Shift from Car to Bicycle Commuting. Int. J. Environ. Res. Public Health 2020, 17, 7635. [Google Scholar] [CrossRef] [PubMed]
- Mueller, N.; Rojas-Rueda, D.; Basaganã, X.; Cirach, M.; Cole-Hunter, T.; Dadvand, P.; Donaire-Gonzalez, D.; Foraster, M.; Gascon, M.; Martinez, D.; et al. Urban and Transport Planning Related Exposures and Mortality: A Health Impact Assessment for Cities. Environ. Health Perspect. 2017, 125, 89–96. [Google Scholar] [CrossRef] [PubMed]
- Mueller, N.; Rojas-Rueda, D.; Basaganã, X.; Cirach, M.; Cole-Hunter, T.; Dadvand, P.; Donaire-Gonzalez, D.; Foraster, M.; Gascon, M.; Martinez, D.; et al. Health impacts related to urban and transport planning: A burden of disease assessment. Environ. Int. 2017, 107, 243–256. [Google Scholar] [CrossRef]
- Black, W.R.; Sato, N. From Global Warming to Sustainable Transport 1989–2006. Int. J. Sustain. Transp. 2007, 1, 73–89. [Google Scholar] [CrossRef]
- Koetse, M.J.; Rietveld, P. Adaptation to Climate Change in the Transport Sector. Transp. Rev. 2012, 32, 267–286. [Google Scholar] [CrossRef]
- Vrijheid, M.; Casas, M.; Gascon, M.; Valvi, D.; Nieuwenhuijsen, M. Environmental pollutants and child health—A review of recent concerns. Int. J. Hyg. Environ. Health 2016, 219, 331–342. [Google Scholar] [CrossRef] [PubMed]
- Khomenko, S.; Nieuwenhuijsen, M.; Ambròs, A.; Wegener, S.; Mueller, N. Is a liveable city a healthy city? Health impacts of urban and transport planning in Vienna, Austria. Environ. Res. 2020, 183, 109238. [Google Scholar] [CrossRef] [PubMed]
- Kan, Z.; Tang, L.; Kwan, M.-P.; Zhang, X. Estimating Vehicle Fuel Consumption and Emissions Using GPS Big Data. Int. J. Environ. Res. Public Health 2018, 15, 566. [Google Scholar] [CrossRef]
- Transport—Energy and Carbon Footprint from Transport. Available online: https://rea.apambiente.pt/content/energy-and-carbon-footprint-transport?language=en (accessed on 23 June 2020).
- Eurostat. Energy, Transport and Environment Statistics 2019 Editionl; EU: Luxembourg, 2019; p. 222. [Google Scholar]
- Pérez Pérez, M.; Martínez Sánchez, A.; Pilar de Luis Carnicer, M.; José Vela Jiménez, M. The environmental impacts of teleworking: A model of urban analysis and a case study. Manag. Environ. Qual. 2004, 15, 656–671. [Google Scholar] [CrossRef]
- Orlov, A.; Kallbekken, S. The impact of consumer attitudes towards energy efficiency on car choice: Survey results from Norway. J. Clean. Prod. 2019, 214, 816–822. [Google Scholar] [CrossRef]
- Acar, C.; Dincer, I. The potential role of hydrogen as a sustainable transportation fuel to combat global warming. Int. J. Hydrogen Energy 2020, 45, 3396–3406. [Google Scholar] [CrossRef]
- Khorrami, Z.; Ye, T.; Sadatmoosavi, A.; Mirzaee, M.; Davarani, M.; Khanjani, N. The Indicators and Methods used for Measuring Urban Liveability: A Scoping Review. Res. Sq. 2020. [Google Scholar] [CrossRef]
- Jolliffe, I.T.; Cadima, J. Principal component analysis: A review and recent developments. Phil. Trans. R. Soc. 2016, 374, 20150202. [Google Scholar] [CrossRef] [PubMed]
- Alverti, M.N.; Themistocleous, K.; Kyriakidis, P.C.; Hadjimitsis, D. A study of the interaction of human smart characteristics with demographic dynamics and built environment: The case of Limassol, Cyprus. Smart Cities 2020, 3, 48–73. [Google Scholar] [CrossRef]
- Marques da Costa, E. Socio-economia. In Atlas Digital da Área Metropolitana de Lisboa—Textos de Enquadramento Analítico; Rocha, J., Ed.; AML: Lisboa, Portugal, 2016; pp. 1–28. [Google Scholar]
- SPSS Tutorial AEB 37/AE 802. Marketing Research Methods Week 7. Available online: https://www.mvsolution.com/wp-content/uploads/SPSS-Tutorial-Cluster-Analysis.pdf (accessed on 12 April 2020).
- Tan, P.N.; Steinbach, M.; Kumar, V. Cluster analysis: Basic concepts and algorithms. In Introduction to Data Mining; Tan, P.N., Steinbach, M., Karpatne, A., Kumar, V., Eds.; Pearson Education India: New Delhi, India, 2006; pp. 487–568. [Google Scholar]
- INE. Retrato Territorial de Portugal 2019; INE: Lisboa, Portugal, 2019. [Google Scholar]
- Recenseamento Geral da População. 2011. Available online: https://censos.ine.pt/xportal/xmain?xpid=CENSOS&xpgid=ine_censos_publicacao_det&menuBOUI=13707294&contexto=pu&PUBLICACOESpub_boui=73212469&PUBLICACOESmodo=2&selTab=tab1 (accessed on 21 April 2020).
- Corine Land Cover. Available online: https://land.copernicus.eu/pan-european/corine-land-cover (accessed on 21 April 2020).
- Louro, A.; Marques da Costa, N.; Marques da Costa, E. A Cidade Saudável no planeamento municipal: Exemplos de atuação na AML, Portugal. In Construindo Cidades Saudáveis: Utopias e Práticas, v. II.; Ribeiro Soares, B., Marques da Costa, N., Lima, S.C., Marques da Costa, E., Eds.; Assis Editora: Uberlândia, Brasil, 2017; pp. 35–72. [Google Scholar]
- Abrantes, P. Ordenamento e Planeamento do território. In Atlas Digital da Área Metropolitana de Lisboa—Textos de Enquadramento Analítico; Rocha, J., Ed.; AML: Lisboa, Portugal, 2016; pp. 1–17. [Google Scholar]
- Aguiléra, A.; Wenglenski, S.; Proulhac, L. Employment suburbanisation, reverse commuting and travel behaviour by residents of the central city in the Paris metropolitan area. Transp. Res. Part A Policy Pract. 2009, 43, 685–691. [Google Scholar] [CrossRef]
- Hu, L.; Sun, T.; Wang, L. Evolving urban spatial structure and commuting patterns: A case study of Beijing, China. Transp. Res. Part D Transp. Environ. 2018, 59, 11–22. [Google Scholar] [CrossRef]
- Marques da Costa, N. Dispersão urbana e mobilidade na Área Metropolitana de Lisboa. In Proceedings of the V Congresso da Geografia Portuguesa, Guimarães, Portugal, 14–16 October 2004. [Google Scholar]
- Louro, A.; Marques da Costa, N. Commuting Flow Patterns in LMA: Towards an effective contribution to Sustainable Development (presentation). In Proceedings of the 12th International Symposium on Urban Planning and Environment, Lisbon, Portugal, 31 May–3 June 2016. [Google Scholar]
- Saghapour, T.; Moridpour, S.; Thompson, R.G. Public transport accessibility in metropolitan areas: A new approach incorporating population density. J. Transp. Geogr. 2016, 54, 273–285. [Google Scholar] [CrossRef]
- Badland, H.; Pearce, J. The role of transport in supporting an equitable, liveable city: A review of the evidence. J. Transp. Health 2019, 14, 100635. [Google Scholar] [CrossRef]
- Shefer, D. Congestion, air pollution, and road fatalities in urban areas. Accid. Anal. Prev. 1994, 26, 501–509. [Google Scholar] [CrossRef]
- Chatziioannou, I.; Alvarez-Icaza, L.; Bakogiannis, E.; Kyriakidis, C.; Chias-Becerril, L. A Structural Analysis for the Categorization of the Negative Externalities of Transport and the Hierarchical Organization of Sustainable Mobility’s Strategies. Sustainability 2020, 12, 6011. [Google Scholar] [CrossRef]
- Rojas-Rueda, D.; Nazelle, A.; Tainio, M.; Nieuwenhuijsen, M.J. The health risks and benefits of cycling in urban environments compared with car use: Health impact assessment study. BMJ 2011, 343, d4521. [Google Scholar] [CrossRef] [PubMed]
- Rabl, A.; Nazelle, A. Benefits of shift from car to active transport. Transp. Policy 2012, 19, 121–131. [Google Scholar] [CrossRef]
- Marques da Costa, N. Mobilidade e Transporte em Áreas Urbanas. O caso da Área Metropolitana de Lisboa. Ph.D. Thesis, Universidade de Lisboa, Lisboa, Portugal, 2007. [Google Scholar]
- Wang, Y.; Gu, J.; Wang, S.; Wang, J. Understanding consumers’ willingness to use ride-sharing services: The roles of perceived value and perceived risk. Transp. Res. Part C Emerg. Technol. 2019, 105, 504–519. [Google Scholar] [CrossRef]
- Sopjani, L.; Stier, J.J.; Ritzén, S.; Hesselgren, M.; Georén, P. Involving users and user roles in the transition to sustainable mobility systems: The case of light electric vehicle sharing in Sweden. Transp. Res. Part D Transp. Environ. 2019, 71, 207–221. [Google Scholar] [CrossRef]
- Cascajo, R.; Lopez, E.; Herrero, F.; Monzon, A. User perception of transfers in multimodal urban trips: A qualitative study. Int. J. Sustain. Transp. 2019, 13, 393–406. [Google Scholar] [CrossRef]
- Allard, R.F.; Moura, F. Effect of transport transfer quality on intercity passenger mode choice. Transp. Res. Part A Policy Pract. 2018, 109, 89–107. [Google Scholar] [CrossRef]
- Muñoz-Villamizar, A.; Montoya-Torres, J.R.; Faulin, J. Impact of the use of electric vehicles in collaborative urban transport networks: A case study. Transp. Res. Part D Transp. Environ. 2017, 50, 40–54. [Google Scholar] [CrossRef]
- Mizdrak, A.; Blakely, T.; Cleghorn, C.L.; Cobiac, L.J. Potential of active transport to improve health, reduce healthcare costs, and reduce greenhouse gas emissions: A modelling study. PLoS ONE 2019, 14, e0219316. [Google Scholar] [CrossRef]
- Curtis, K.; Kennedy, B.; Lam, M.K.; Mitchell, R.J.; Black, D.; Burns, B.; Loudfoot, A.; Tall, G.; Dinh, M.; Beech, C.; et al. Prehospital care and transport costs of severely injured children in NSW Australia. Injury 2020. [Google Scholar] [CrossRef] [PubMed]
- Ma, J.; Li, C.; Kwan, M.-P.; Chai, Y. A Multilevel Analysis of Perceived Noise Pollution, Geographic Contexts and Mental Health in Beijing. Int. J. Environ. Res. Public Health 2018, 15, 1479. [Google Scholar] [CrossRef]
- Pan, X.; Kwan, M.-P.; Yang, L.; Zhou, S.; Zuo, Z.; Wan, B. Evaluating the Accessibility of Healthcare Facilities Using an Integrated Catchment Area Approach. Int. J. Environ. Res. Public Health 2018, 15, 2051. [Google Scholar] [CrossRef] [PubMed]
- Louro, A. Contributos da Gestão e Planeamento da Mobilidade Urbana Para a Construção de Cidades Saudáveis. Ph.D. Thesis, Universidade de Lisboa, Lisboa, Portugal, 2019. [Google Scholar]
- Ribeiro Filho, V.; Marques da Costa, E. Os deslocamentos das pessoas com mobilidade reduzida na construção de uma Seixal Saudável. In Construindo Cidades Saudáveis; Lima, S.C., Marques da Costa, E., Eds.; Assis Editora: Uberlândia, Brasil, 2013; pp. 169–194. [Google Scholar]
- Morgado, P. Uso e ocupação do solo. In Atlas Digital da Área Metropolitana de Lisboa—Textos de Enquadramento Analítico; Rocha, J., Ed.; AML: Lisboa, Portugal, 2016; pp. 1–21. [Google Scholar]
- Wang, X.; Shao, C.; Yin, C.; Zhuge, C. Exploring the Influence of Built Environment on Car Ownership and Use with a Spatial Multilevel Model: A Case Study of Changchun, China. Int. J. Environ. Res. Public Health 2018, 15, 1868. [Google Scholar] [CrossRef]
- Zhou, X.; Yu, W.; Sullivan, W.C. Making pervasive sensing possible: Effective travel mode sensing based on smartphones. Comput. Environ. Urban Syst. 2016, 58, 52–59. [Google Scholar] [CrossRef]
- Caprotti, F.; Cowley, R.; Datta, A.; Broto, V.C.; Gao, E.; Georgeson, L.; Herrick, C.; Odendaal, N.; Joss, S. The New Urban Agenda: Key opportunities and challenges for policy and practice. Urban Res. Pract. 2017, 10, 367–378. [Google Scholar] [CrossRef]
- Joseph, L.; Neven, A.; Martens, K.; Kweka, O.; Wets, G.; Janssens, D. Measuring individuals’ travel behaviour by use of a GPS-based smartphone application in Dar es Salaam, Tanzania. J. Transp. Geogr. 2019, 102477, 1–14. [Google Scholar] [CrossRef]
- SIDP-AML—Sistema de Informação e de Decisão Partilhados da AML. Available online: https://www.aml.pt/index.php?cp=COMPONENT_TEXT&sr=SUS57EBF2B5C9620&item= (accessed on 16 June 2020).


| Main Domains | No. of References | Examples |
|---|---|---|
| Active transport and public transport | 18 | Bicycle lanes and footpaths (availability, quality, ability to ride a bike) Public transport availability, length, quality, capacity, number of stops/stations, number of vehicles, satisfaction, access |
| Transport infrastructure | 13 | Road infrastructure: length, length per capita, density, access, quality level; Network average speed, road traffic, congestion |
| Accessibility | 13 | Distance/time: average distance to equipment, goods, or services and to city center Distance/time: average distance to bus stops, railway stations, subway stations |
| Road safety | 12 | Traffic accidents, deaths from traffic accidents, economic loss per traffic accident, road signs, protection of street with priority for pedestrians, safe sidewalks and overpasses, separation of pedestrians and road traffic |
| Environment | 8 | Air pollution: CO2 emissions, concentrations of PM2.5 and PM10, days with good air quality Noise pollution from traffic |
| Economy and energy | 5 | Expenditure on transportation per capita, transportation costs Energy consumption |
| Others | 3 | Parking |
| Indicator | Unit | Year | Source | |
|---|---|---|---|---|
| Land occupancy | (1) Population density | % | 2011 | INE |
| Axis 1: Urban mobility | ||||
| Domain 1 Commuting: Main destination | (2) Local commuting (travel to residence parish) | % | 2011 | INE |
| (3) Intermunicipal commuting (travel to another municipality) | % | 2011 | INE | |
| (4) Population entering municipality for daily work | % | 2011 | INE | |
| Domain 2 Commuting: Main transport mode | (5) Commuting by car | % | 2011 | INE |
| (6) Commuting by public transport | % | 2011 | INE | |
| (7) Commuting on foot | % | 2011 | INE | |
| Domain 3 Commuting: Travel time (one trip) | (8) Short commute (up to 15 min) | % | 2011 | INE |
| (9) Long commute (longer than 60 min) | % | 2011 | INE | |
| Domain 4 Motorization | (10) New light passenger vehicles sold per 1000 inhab. | No./1000 inhab. | 2016 | INE |
| (11) Motorization rate (light vehicles) | No./1000 inhab. | 2016 | CRA | |
| Axis 2: Mobility, public health, and civics | ||||
| Domain 5 Road accidents | (12) Traffic accident victims per 1000 inhab. | Victims of road accidents/1000 inhab. | 2016 | ANSR/INE |
| (13) Injury severity index of road accidents with victims | Killed on road accidents/road accidents × 100 | 2016 | ANSR/INE | |
| Domain 6 Transport-related crime | (14) Crime rate for driving under the influence of alcohol (alcohol level ≥ 1.2 g/L) | % | 2017 | DGPJ/INE |
| (15) Crime rate for driving without legal qualification | % | 2017 | DGPJ/INE | |
| Axis 3: Mobility, public health, and environment | ||||
| Domain 7 Carbon emissions | (16) Carbon emissions from transportation sector per 1000 inhab. | Ton CO2/1000 inhab. | 2011 | PROT-AML/APA |
| Domain 8 Fuel | (17) Car fuel consumption per inhabitant | tonne of oil equivalent (toe) inhab. | 2016 | DGEG/INE |
| Variables | Components | ||||||
|---|---|---|---|---|---|---|---|
| 1 | 2 | 3 | 4 | 5 | |||
| (1) Population density | −0.822 | 0.347 | −0.074 | −0.083 | 0.032 | ||
| Axis 1: Urban transport and mobility | Domain 1 Commuting, main destination | (2) Local commuting (travel to residence parish) | 0.921 | −0.107 | 0.147 | 0.011 | 0.069 |
| (3) Intermunicipal commuting (travel to other municipality) | −0.226 | −0.843 | 0.033 | 0.141 | 0.100 | ||
| (4) Population entering municipality for daily work | −0.253 | 0.893 | −0.002 | 0.165 | 0.188 | ||
| Domain 2 Commuting, main transport mode | (5) Commuting by car | 0.682 | 0.054 | 0.708 | −0.027 | 0.096 | |
| (6) Commuting by public transport | −0.937 | 0.005 | −0.048 | −0.090 | 0.148 | ||
| (7) Commuting on foot | 0.006 | 0.007 | −0.935 | −0.011 | −0.016 | ||
| Domain 3 Commuting, time spent (one trip) | (8) Short commute (up to 15 min) | 0.949 | 0.111 | −0.094 | −0.003 | 0.137 | |
| (9) Long commute (longer than 60 min) | 0.169 | −0.434 | −0.579 | 0.070 | −0.571 | ||
| Domain 4 Motorization | (10) New light passenger vehicles sold per 1000 inhab. | −0.352 | 0.752 | 0.254 | 0.028 | −0.030 | |
| (11) Motorization rate (light vehicles) | 0.072 | 0.507 | 0.749 | 0.019 | −0.189 | ||
| Axis 2: Transport, public health, and civics | Domain 5 Road safety | (12) Traffic accident victims per 1000 inhab. | 0.014 | 0.789 | 0.364 | 0.371 | 0.215 |
| (13) Injury severity index of road accidents with victims | 0.600 | −0.197 | −0.198 | 0.175 | 0.632 | ||
| Domain 6 Transport-related crime | (14) Crime rate for driving under the influence of alcohol (alcohol level ≥ 1.2 g/L) | −0.003 | 0.749 | 0.056 | 0.497 | −0.199 | |
| (15) Crime rate for driving without legal qualification | 0.029 | 0.309 | −0.333 | 0.804 | −0.251 | ||
| Axis 3: Transport, public health and environment | Domain 7 Carbon emissions | (16) Carbon emissions from transportation sector per 1000 inhab. | 0.122 | −0.017 | 0.240 | 0.835 | 0.234 |
| Domain 8 Fuel | (17) Car fuel consumption per inhabitant | 0.545 | 0.302 | −0.264 | 0.448 | 0.269 | |
| Eigenvalue | 5.067 | 4.76 | 2.591 | 1.307 | 1.019 | ||
| % of variance | 29.806 | 27.999 | 15.240 | 7.690 | 5.997 | ||
| Cumulative % of variance | 29.806 | 57.805 | 73.045 | 80.735 | 86.732 | ||
Publisher’s Note: MDPI stays neutral with regard to jurisdictional claims in published maps and institutional affiliations. |
© 2021 by the authors. Licensee MDPI, Basel, Switzerland. This article is an open access article distributed under the terms and conditions of the Creative Commons Attribution (CC BY) license (http://creativecommons.org/licenses/by/4.0/).
Share and Cite
Louro, A.; Marques da Costa, N.; Marques da Costa, E. From Livable Communities to Livable Metropolis: Challenges for Urban Mobility in Lisbon Metropolitan Area (Portugal). Int. J. Environ. Res. Public Health 2021, 18, 3525. https://doi.org/10.3390/ijerph18073525
Louro A, Marques da Costa N, Marques da Costa E. From Livable Communities to Livable Metropolis: Challenges for Urban Mobility in Lisbon Metropolitan Area (Portugal). International Journal of Environmental Research and Public Health. 2021; 18(7):3525. https://doi.org/10.3390/ijerph18073525
Chicago/Turabian StyleLouro, Ana, Nuno Marques da Costa, and Eduarda Marques da Costa. 2021. "From Livable Communities to Livable Metropolis: Challenges for Urban Mobility in Lisbon Metropolitan Area (Portugal)" International Journal of Environmental Research and Public Health 18, no. 7: 3525. https://doi.org/10.3390/ijerph18073525
APA StyleLouro, A., Marques da Costa, N., & Marques da Costa, E. (2021). From Livable Communities to Livable Metropolis: Challenges for Urban Mobility in Lisbon Metropolitan Area (Portugal). International Journal of Environmental Research and Public Health, 18(7), 3525. https://doi.org/10.3390/ijerph18073525