Article

Systemic Inflammation (C-Reactive Protein) in Older Chinese Adults Is Associated with Long-Term Exposure to Ambient Air Pollution

1
Faculty of Medicine and Health, Sydney School of Public Health, The University of Sydney, Sydney, NSW 2006, Australia
2
Department of Hematology and Transfusion Medicine, National Institute of Health, Yerevan 0051, Armenia
3
Bouvé College of Health Sciences, Northeastern University, Boston, MA 02115, USA
4
School of Public Health, University Centre for Rural Health, The University of Sydney, Sydney, NSW 2006, Australia
5
Department of Epidemiology and Preventive Medicine, School of Public Health and Preventive Medicine, Monash University, Clayton, VIC 3800, Australia
6
Shanghai Municipal Center for Disease Control and Prevention, Shanghai 200336, China
*
Author to whom correspondence should be addressed.
Int. J. Environ. Res. Public Health 2021, 18(6), 3258; https://doi.org/10.3390/ijerph18063258
Submission received: 19 January 2021 / Revised: 7 March 2021 / Accepted: 15 March 2021 / Published: 22 March 2021
(This article belongs to the Special Issue Air Pollution Exposure and Health of Vulnerable Groups)

Abstract

:
There is an established association between air pollution and cardiovascular disease (CVD), which is likely to be mediated by systemic inflammation. The present study evaluated links between long-term exposure to ambient air pollution and high-sensitivity C reactive protein (hs-CRP) in an older Chinese adult cohort (n = 7915) enrolled in the World Health Organization (WHO) study on global aging and adult health (SAGE) China Wave 1 in 2008–2010. Multilevel linear and logistic regression models were used to assess the associations of particulate matter (PM) and nitrogen dioxide (NO2) on log-transformed hs-CRP levels and odds ratios of CVD risk derived from CRP levels adjusted for confounders. A satellite-based spatial statistical model was applied to estimate the average community exposure to outdoor air pollutants (PM with an aerodynamic diameter of 10 μm or less (PM10), 2.5 μm or less (PM2.5), and 1 μm or less (PM1) and NO2) for each participant of the study. hs-CRP levels were drawn from dried blood spots of each participant. Each 10 μg/m3 increment in PM10, PM2.5, PM1, and NO2 was associated with 12.8% (95% confidence interval; (CI): 9.1, 16.6), 15.7% (95% CI: 10.9, 20.8), 10.2% (95% CI: 7.3, 13.2), and 11.8% (95% CI: 7.9, 15.8) higher serum levels of hs-CRP, respectively. Our findings suggest that air pollution may be an important factor in increasing systemic inflammation in older Chinese adults.

1. Introduction

Air pollution is a significant global health challenge [1]. According to recent data from the World Health Organization (WHO), 91% of the world’s population lives in places where air pollution exceeds the WHO recommendations [2], contributing to over four million premature deaths every year, as well as the development and exacerbation of numerous chronic diseases, such as cardiovascular disease (CVD), respiratory disorders, and cancer [3,4].
Among air pollutants, the negative impact on health is best established for particulate matter of less than 10 and 2.5 microns in diameter (PM10 and PM2.5, respectively) [5,6,7]. Outdoor PM2.5 was shown to be the fifth leading cause of mortality in 2015 [8], and the worst impacts from ambient air pollution are seen in low- and middle-income countries due to rapid industrialization and a lack of environmental regulation [8]. Southeast Asia is at the highest risk in this regard [2]. Moreover, populations from these geographic areas bear a high burden of chronic, noncommunicable diseases such as CVD [9]. The impact of air pollution on the development and progression of CVD is of particular concern, as numerous studies have demonstrated important and significant associations consistent with a causal relationship between air pollution and CVD [10,11,12]. CVD accounts for most of the mortality attributed to air pollution. Conversely, ambient air pollution is attributed to 17.1% and 14.2% of deaths from ischemic heart disease and cerebrovascular disease, respectively [8].
One of the primary suggested mechanisms via which outdoor air pollutants might lead to CVD is chronic systemic inflammation [13]. Air pollution can directly lead to pulmonary inflammation through activation of alveolar macrophages and the upregulation of inflammatory cytokine expression, such as tumor necrosis factors and interleukins [14,15]. These inflammatory cytokines can, in sufficient concentration, lead to a hepatic acute phase response, with resultant increases in numerous serum proteins associated with systemic inflammation, including C-reactive protein (CRP). CRP is a well-known inflammatory biomarker and can be a valuable indicator for both acute and chronic inflammation [16]. Although high blood levels of CRP can be caused by a range of health conditions, chronic and sustained increases in this protein have been consistently tied to the development and progression of CVD [17].
Several previous studies studied the association between particulate matter air pollution and CRP; however, significant questions remain [18,19,20]. For example, in a recent meta-analysis of 40 observational studies, including a total of 244,681 participants, investigators found that, while long-term exposure to ambient air pollution was more strongly associated with CRP levels than short-term exposure, the majority of prior literature focused on short-term exposure windows [21]. Additionally, while the burden of air pollution exposure is known to be significantly greater in developing nations, the studies linking PM to CRP so far have been disproportionally performed in populations from economically developed regions [22], such as Europe and the United States (US) [21]. To date, there have been no studies evaluating the long-term relationship between ambient air pollution and levels of CRP in the Chinese population, which is still, despite substantial progress, exposed to high levels of outdoor pollution [23]. The results of studies assessing associations between NO2 exposure and CRP levels were inconclusive [24,25,26,27], and no data have been published regarding PM1, which is believed to be even more toxic than other pollutants [28]. Lastly, most prior studies were conducted on young populations, which may be at lower risk for the detrimental cardiovascular consequences of air pollution-induced chronic inflammation [21].
Thus, the current study aims to fill these gaps in the literature by examining the association between exposure to long-term, ambient air pollutants and levels of serum hs-CRP among older Chinese adults.

2. Materials and Methods

2.1. Study Popultation

The current study is based on the data collected from the WHO’s study on global aging and adult health (SAGE)—a longitudinal study evaluating in detail the health and wellbeing of adult populations in middle-income countries (China, Ghana, Mexico, India, Russia, and South Africa). Our study analyzed the cross-sectional, baseline, interview-based survey data of older Chinese adult respondents from 2008 to 2010 (SAGE China Wave 1). Multistage clustering and probability sampling were applied for participant recruitment, described in detail elsewhere [29]. This resulted in a nationally representative sample from 64 townships across China. The study was approved by the Ethics Committee of The Chinese Center for Disease Control and Prevention.

2.2. Exposure Assessment

Predictive models estimated exposure concentrations of PM1, PM2.5, PM10, and NO2 on the basis of satellite remote sensing, meteorology, land use, and other data combined with ground-monitored information on the pollutants from stations throughout mainland China. For PM1, daily ground-level measurements were acquired from 77 stations of the China Atmosphere Watch Network (CAWNET) during September 2013 and December 2014. For the other three pollutants, the data were obtained from 1479 stations of the China National Environmental Monitoring Center (CNEMC) from May 2014 to December 2016.
Detailed descriptions of the predictive models for each pollutant can be found elsewhere [30,31]. In short, two National Aeronautics and Space Administration (NASA) Moderate Resolution Imaging Spectroradiometer (MODIS) data processing algorithms and inverse variance weighting at 0.1° (10 km) grid cell resolution provided data on aerosol optical depth (AOD). These data, along with data on land use, vegetation, and meteorology, were combined with ground-monitored PM1 data via a generalized additive model for the prediction of daily PM1 grid cell concentrations from 2005 to 2014. The same methods were applied for the prediction of grid cell concentrations of PM2.5 and PM10 from 2005 to 2016.
For NO2, the OMI-NO2 level 3 data product (OMNO2d version 3) provided data on satellite-derived tropospheric column densities of NO2 (molecules/cm2) at 0.25° (13 × 24 km2) resolution [32]. Predictions of daily grid cell concentrations for NO2 from 2013 to 2016 were obtained via a random forest model using ground-monitored NO2 data linked with data on satellite NO2, vegetation, land use, road density, and meteorology [33].
Monitored pollutant data and 10-fold cross-validation were used to assess the predictive ability of the models for all four pollutants (Table S2, Supplementary Materials). The long-term exposure to air pollutant was defined as the moving average concentrations in the participants’ township for the 1, 3, and 5 year periods prior to the participant entering the study. As each township entered the study and provided biological samples at a different time during the 2008–2010 baseline study period, the moving average exposure was different for each township. Participants’ community locations were geo-coded, and participant-specific long-term concentration estimates were calculated for PM10, PM2.5, PM1, and NO2.

2.3. Hs-CRP Level Measuremenets

Hs-CRP is a systemic inflammatory marker that is produced in the liver after stimulation through cytokines. Hs-CRP levels were measured using the dried blood spot (DBS) technique considering difficulties related to the collection, processing, and storage of the serum specimens. DBS was validated as a feasible tool for the assessment of CRP levels on a population level, as its values have been consistently correlated with those measured by standard serum sampling [34,35]. Hs-CRP levels were analyzed using an enzyme-linked immunosorbent assay (ELISA) (Diagnostic Biochem Canada Inc, London, Canada) with less than 16% of the coefficient of variability (CV) for the assay. A higher accuracy of the detection range (0.01–10 mg/L) of hs-CRP is most applicable for the establishment of low-degree inflammatory states, especially in individuals without clinical manifestations of inflammation and CVD [36].

2.4. Covariates

Covariates were selected for inclusion in our health effects models according to prior associations with air pollution and hs-CRP. These include demographic, health behavior, socioeconomic status, indoor air pollution, and comorbid disease variables. Demographic data included sex, age, and body mass index (BMI). Health behavior variables included dietary intake of fruits and vegetables, alcohol and tobacco use, and physical activity. Fruit and vegetable consumption was included in a binary fashion as either sufficient (two and more daily servings of fruits and three or more daily servings of vegetables) or insufficient. Alcohol use (current use or no current use) and smoking status (current use or no current use) were likewise included as binary variables. Physical activity was characterized by the global physical activity questionnaire, which included questions on the duration, frequency, and intensity of physical activity during work, transport activities, and recreation/leisure time activities. Correspondingly, these responses were collapsed into three groups (low, moderate, and high physical activity) defined according to total energy requirements in metabolic equivalents representing the intensity and time spent on each activity. Socioeconomic variables included the level of education and self-reported household income. The level of education was categorized as having attended (1) no school, (2) primary school, (3) middle school, or (4) high school and higher. Self-reported household income was included in a binary fashion (high versus low), using the median household income of 20,000 CNY as a cutoff. Indoor pollution was assessed using data on the type of fuel being used for cooking at home. It was, thus, classified as either clean (electricity and natural gas) or unclean (coal, wood, dung, and agricultural residues). Lastly, self-reported comorbidities, such as hypertension, chronic lung disease, and diabetes, were also assessed and included through participant self-report.

2.5. Statistical Analysis

We examined the association between log hs-CRP levels and 10 μg/m3 increases in the 3 year moving average of annual average PM10, PM2.5, PM1, and NO2 in single-pollutant, multilevel linear, and logistic regression models, where participants were considered as the first-level unit and the township as the second-level unit. For linear models, hs-CRP was log-transformed to approximate a more normal distribution; for logistic regression models, we examined the probability of a hs-CRP >3 mg/L, as this cutoff point has been used as a clinical indicator for high-risk CVD [37]. In all models, we included the following covariates: age, sex, BMI, tobacco use, physical activity, education level, fruit and vegetable intake, alcohol use, type of fuel used at home, median household income, and location of residence (urban/rural).
Stratified analyses were performed to investigate possible effect modification. Stratifications were made for several socioeconomic values that could have a direct impact on susceptibility to inflammation or could be linked with pollution [38,39]. These values involved level of education (high-school graduation or less versus college degree or more) and annual household income (<20,000 CNY versus ≥20,000 CNY with the median used as the cutoff point). Further subdivisions included several health indicators, conditions, or behaviors with a potential to enhance inflammation, such as age (<65 versus >65 years), diabetes, and chronic lung disease (using self-reported diagnosis). The evaluation of effect modification was carried out by the inclusion of multiplicative terms between pollutant variables and the potential effect modifiers in the adjusted models. For the significance of effect modification, the p-value for the hypothesis test of the interaction was selected as <0.01. The percentage change in hs-CRP was used to present the results of the linear regression analysis and the percentage change in probability of hs-CRP above 3 mg/L (CVD risk threshold) was used for the results of the binary model. Both results were calculated using [exp(10 × β) − 1] × 100.
Several sensitivity analyses were carried out to ensure our results were robust to different model specifications. These included (1) examining different pollution exposure windows (i.e., 1 year and 5 year), and (2) excluding participants with comorbidities which may represent causal intermediates between air pollution exposures and CRP levels, such as respiratory and cardiovascular comorbidities. For all analyses, STATA version 15 (StataCorp, College Station, TX, USA) was used. The statistical significance was determined as a p-value <0.05.

3. Results

3.1. Study Population

The baseline characteristics of participants involved in this study are presented in Table 1. In total, 7915 individuals were included in the final analysis, representing 59.2% of the study population of 13,367 aged 50 and older. Baseline demographic characteristics for the participants with complete hs-CRP measurements and nonparticipants due to incomplete hs-CRP were compared (Table S2, Supplementary Materials).
The mean age of the participants was 63.22 years (±9.35), 52% of whom were female. Most of the participants were residents of rural areas (54%) who used clean types of fuel at home (58%) with no current use of tobacco (67%) or alcohol (70%) and who had sufficient intake of fruits and vegetables (58%). About 53% reported having less than 20,000 CNY of annual household income. Most of the study population had no history of diabetes (93%) or chronic lung disease (92%).

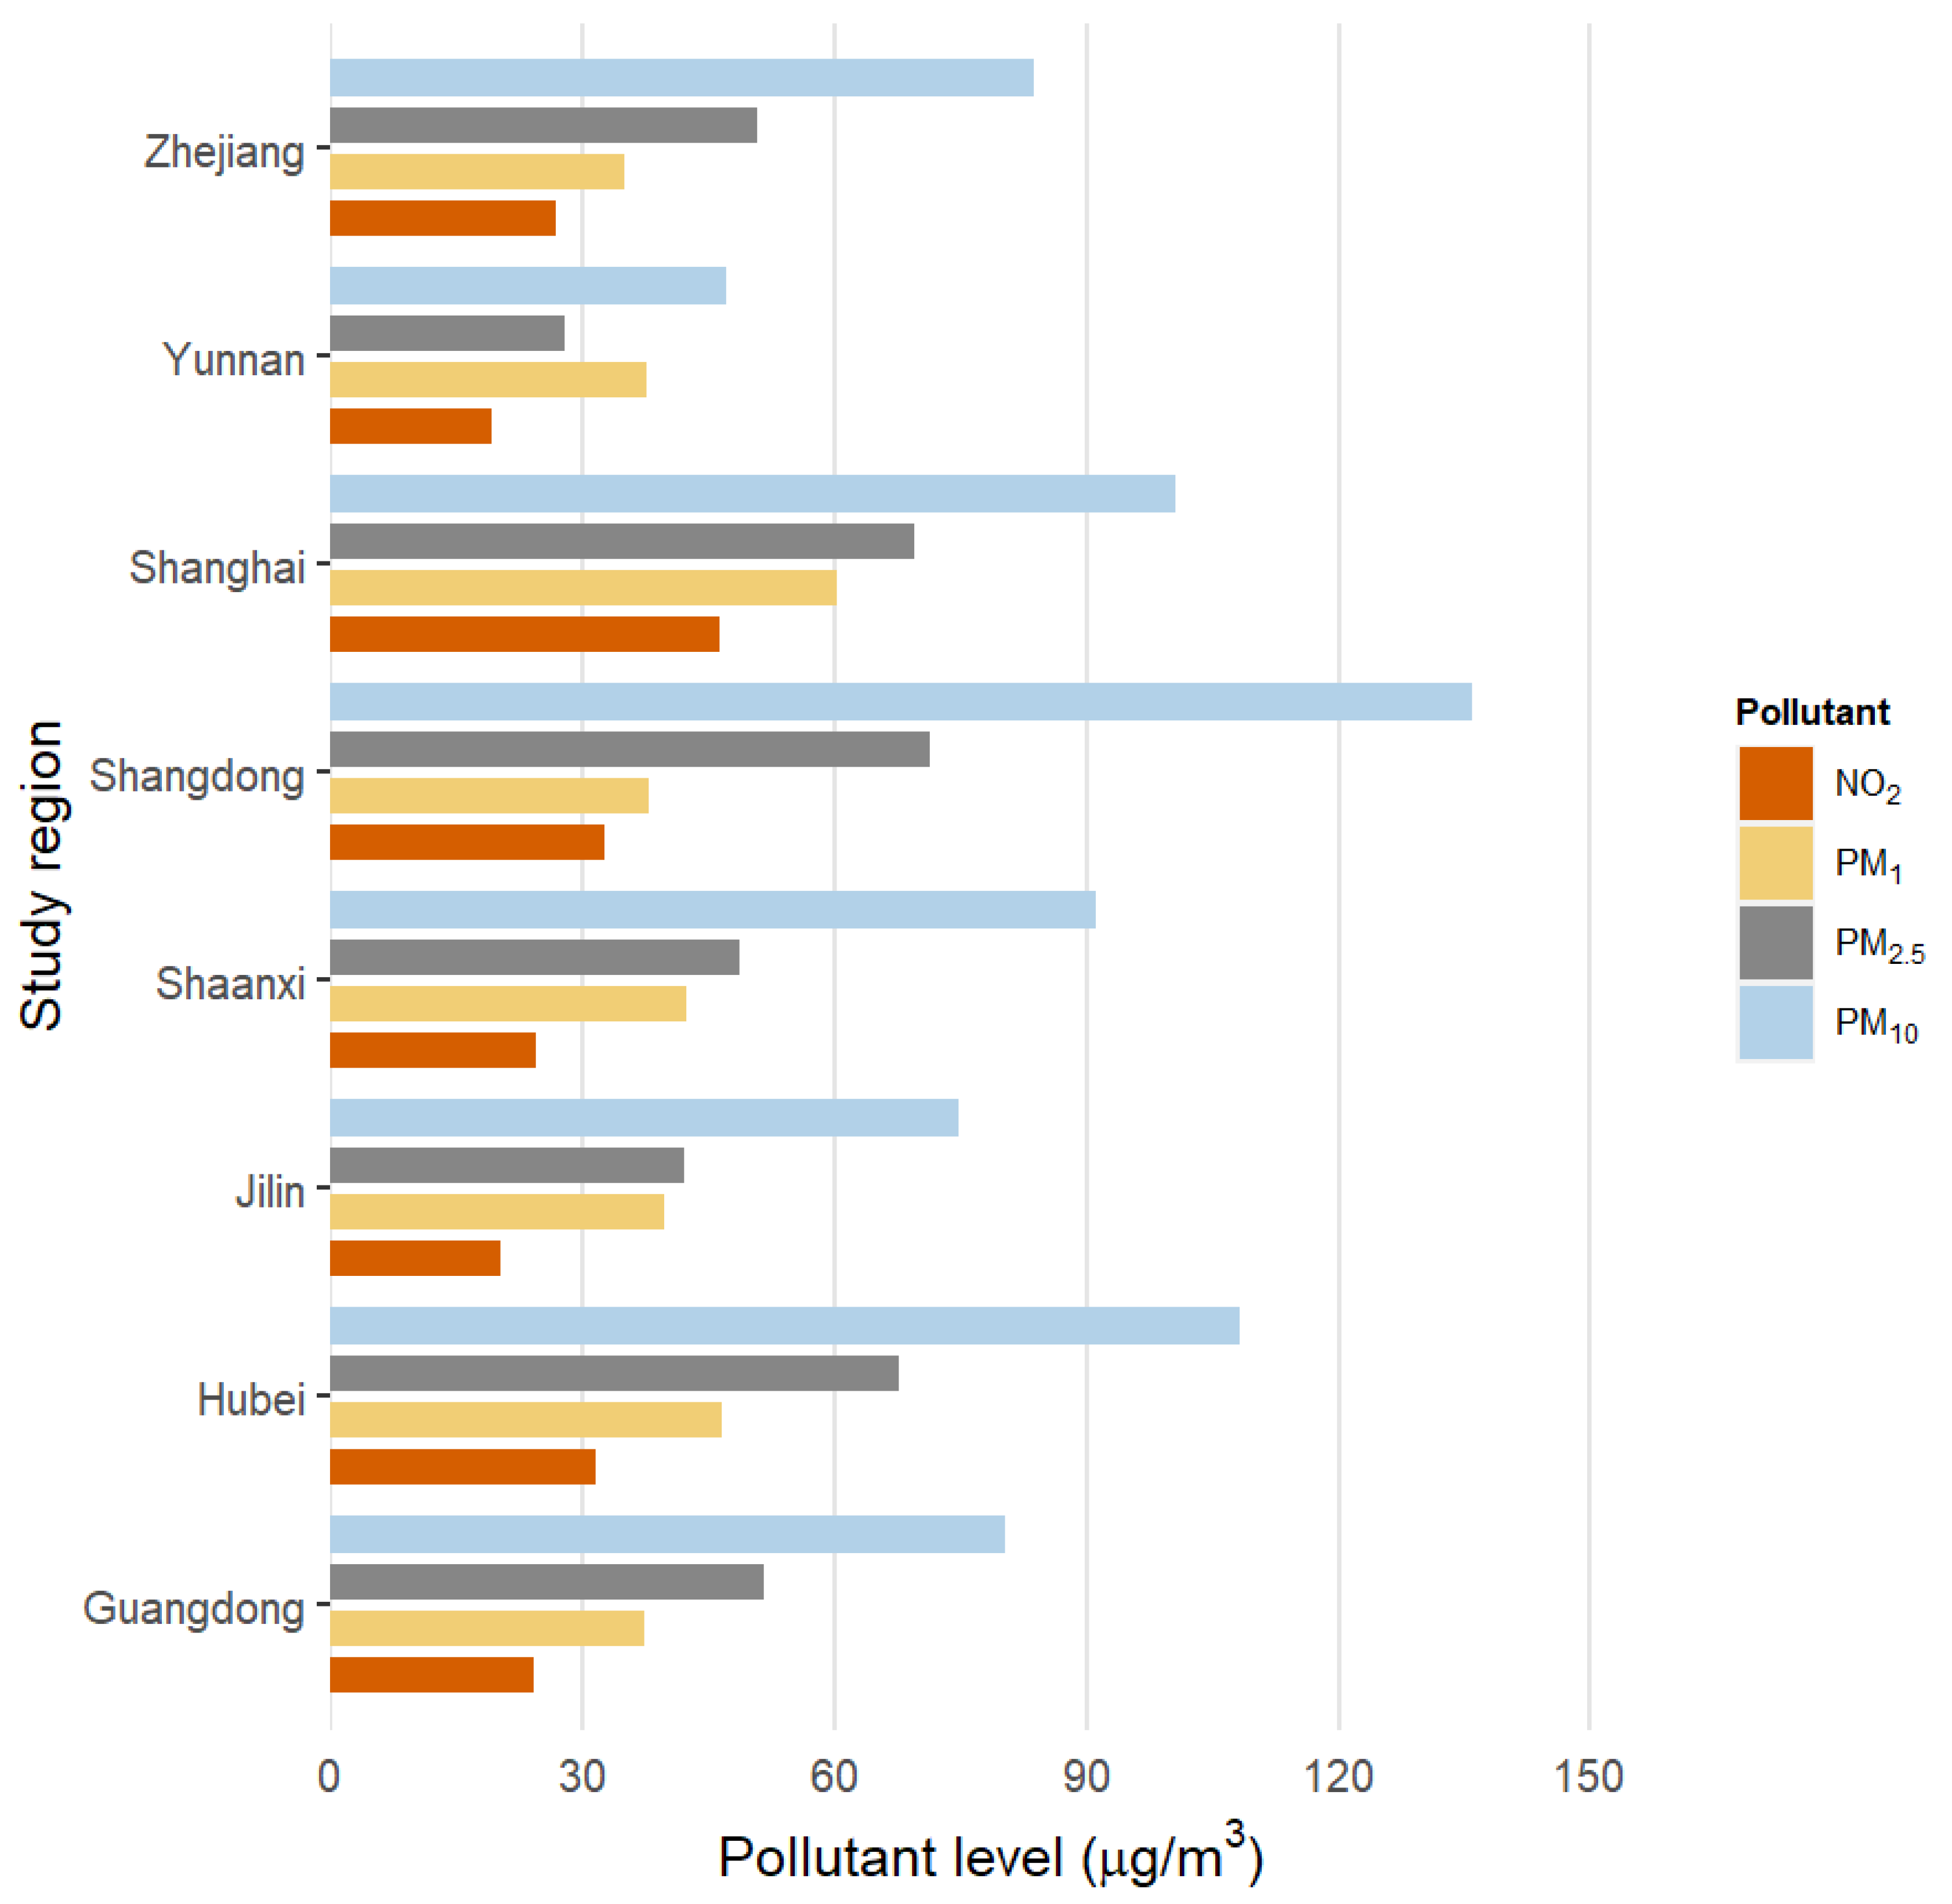
3.2. Air Pollution Exposure

Figure 1 shows the distribution of residential ambient air pollution concentrations. Mean (±SD) annual estimates of PM10, PM2.5, and NO2 were 91.11 (±28.95 µg/m3), 54.02 (±17.02 µg/m3), and 28.97 (±22.42 µg/m3), respectively. NO2 concentrations were highly correlated with PM2.5 (r = 0.92), but less so with PM10.

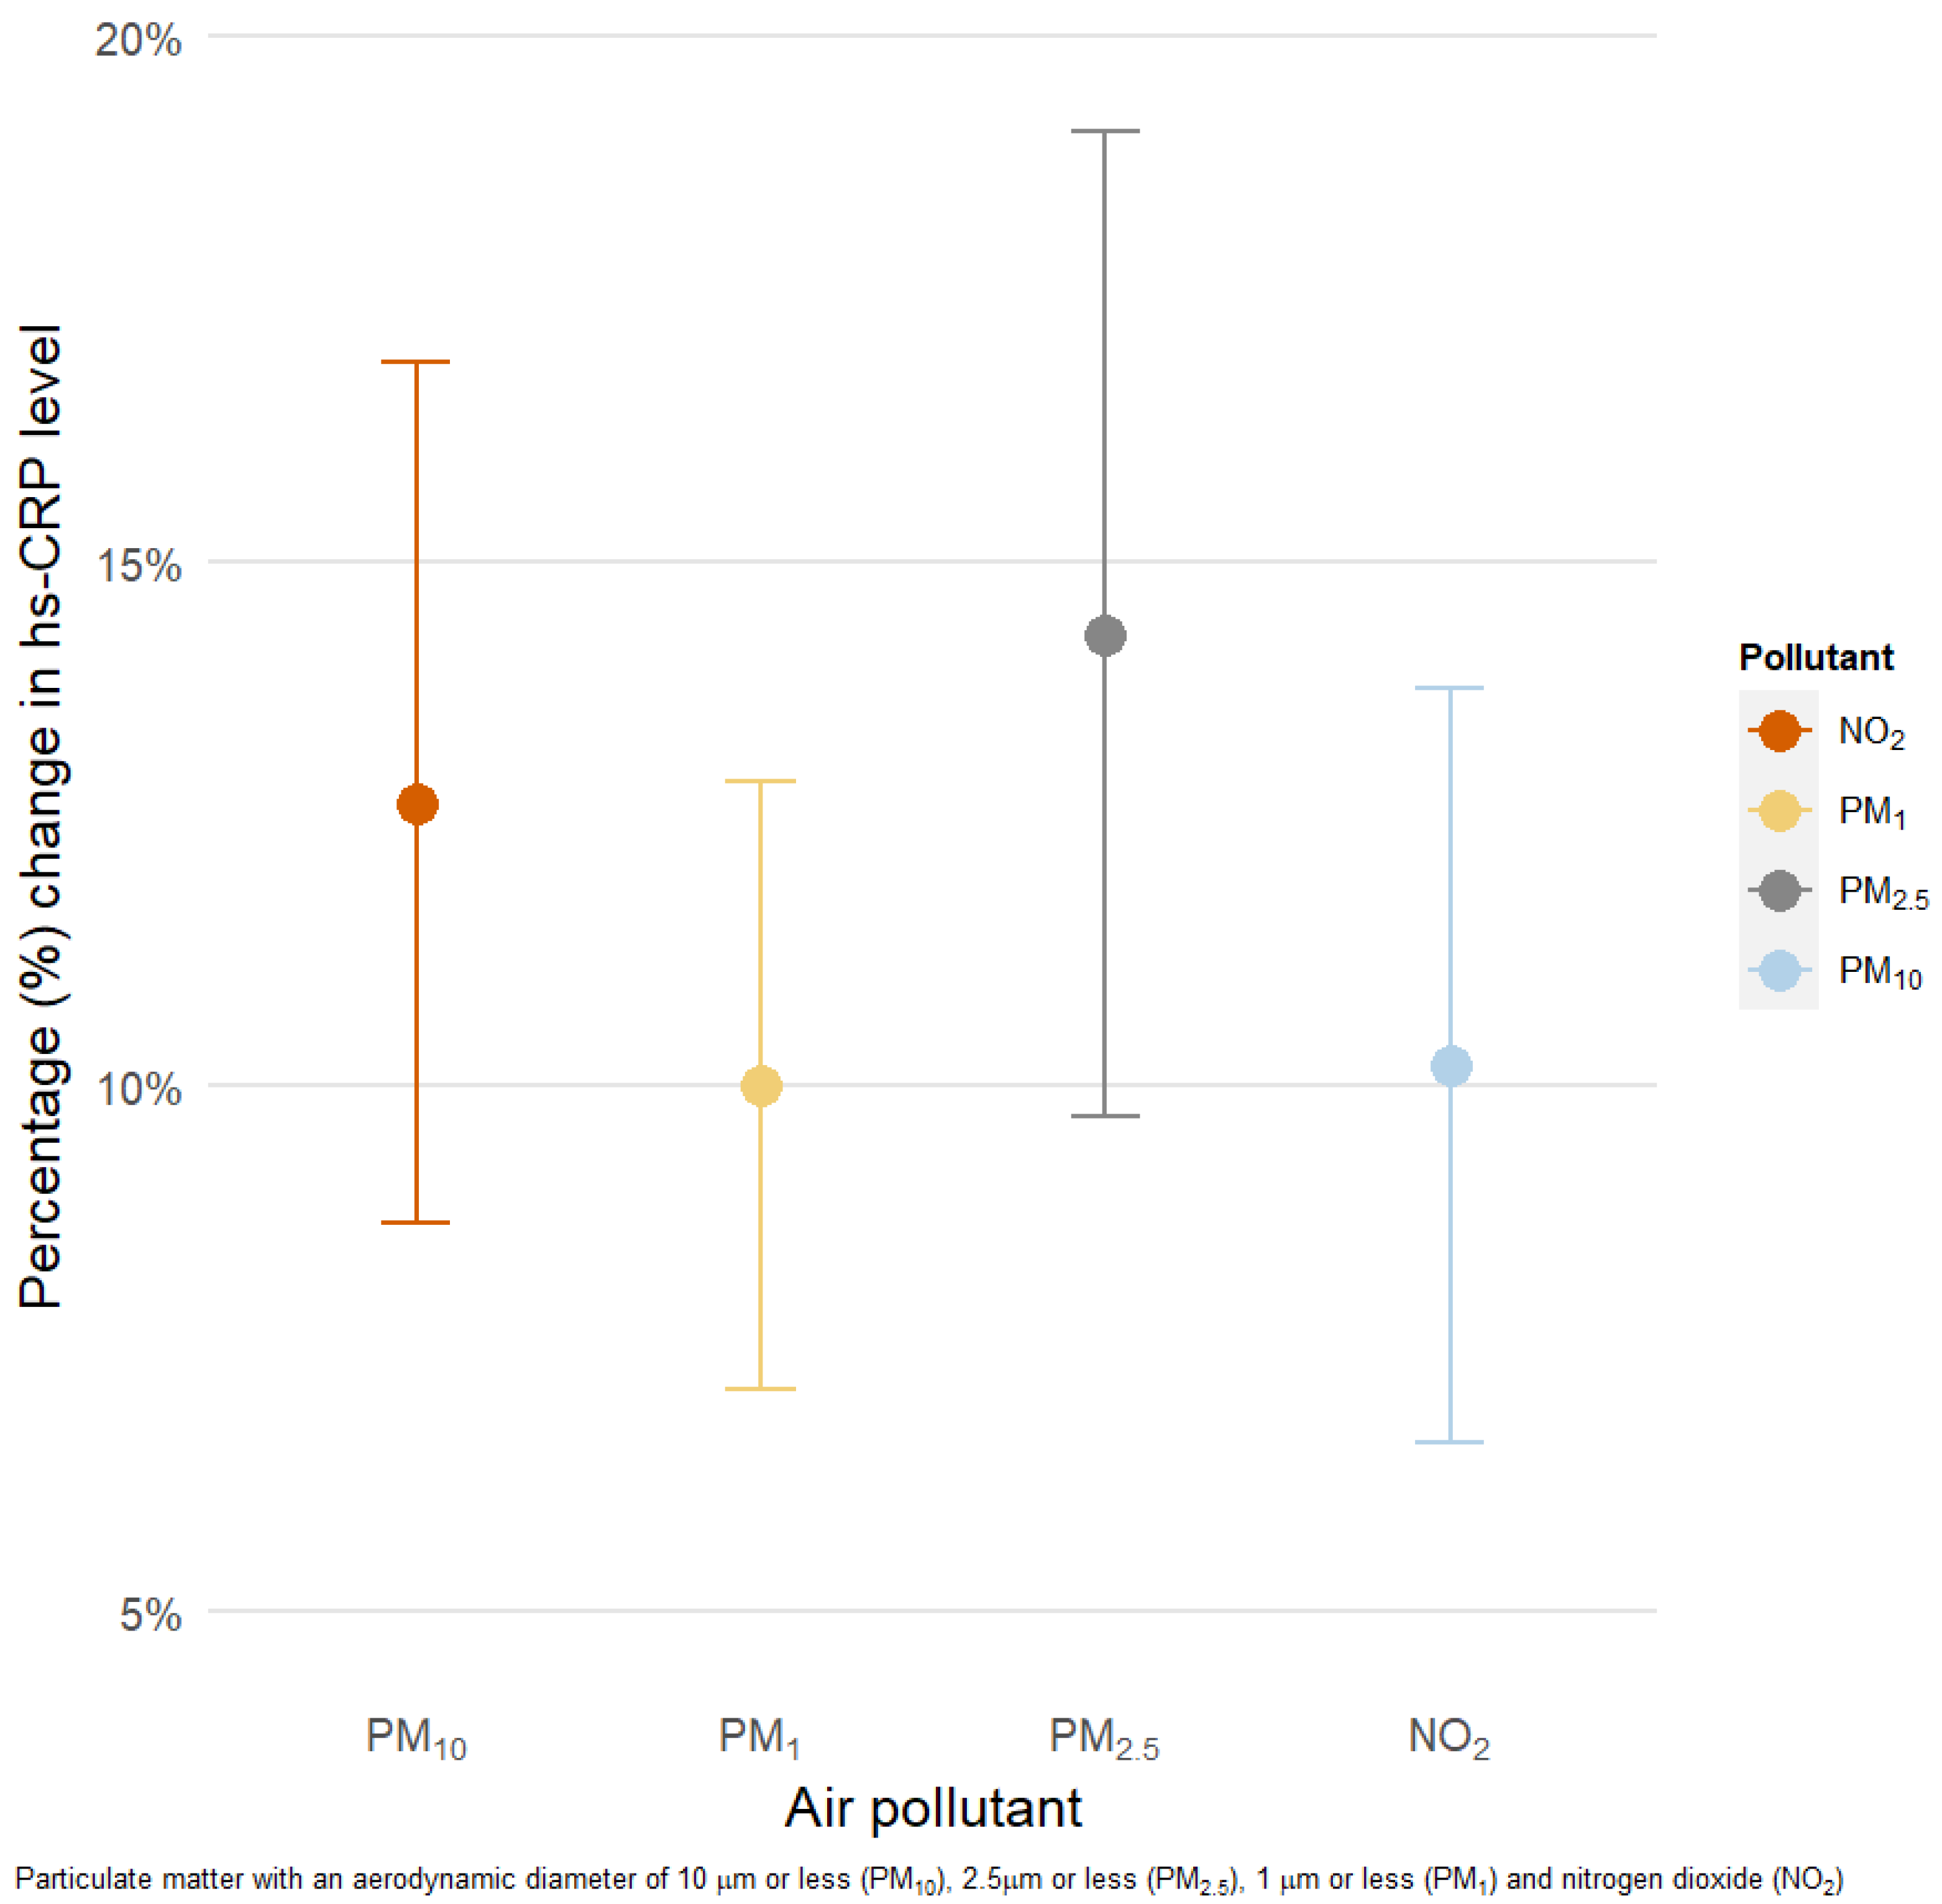
3.3. Association of Exposure to PM and NO2 with hs-CRP Levels

For all pollutants, we found statistically significant positive associations with serum hs-CRP (Figure 2). Each 10 μg/m3 increment in 3 year moving averages of PM10, PM2.5, PM1, and NO2 was associated with 12.8% (95% confidence interval (CI): 9.1, 16.6), 15.7% (95% CI: 10.9, 20.8), 10.2% (95% CI: 7.3, 13.2), and 11.8% (95% CI: 7.9, 15.8) higher serum levels of hs-CRP, respectively.

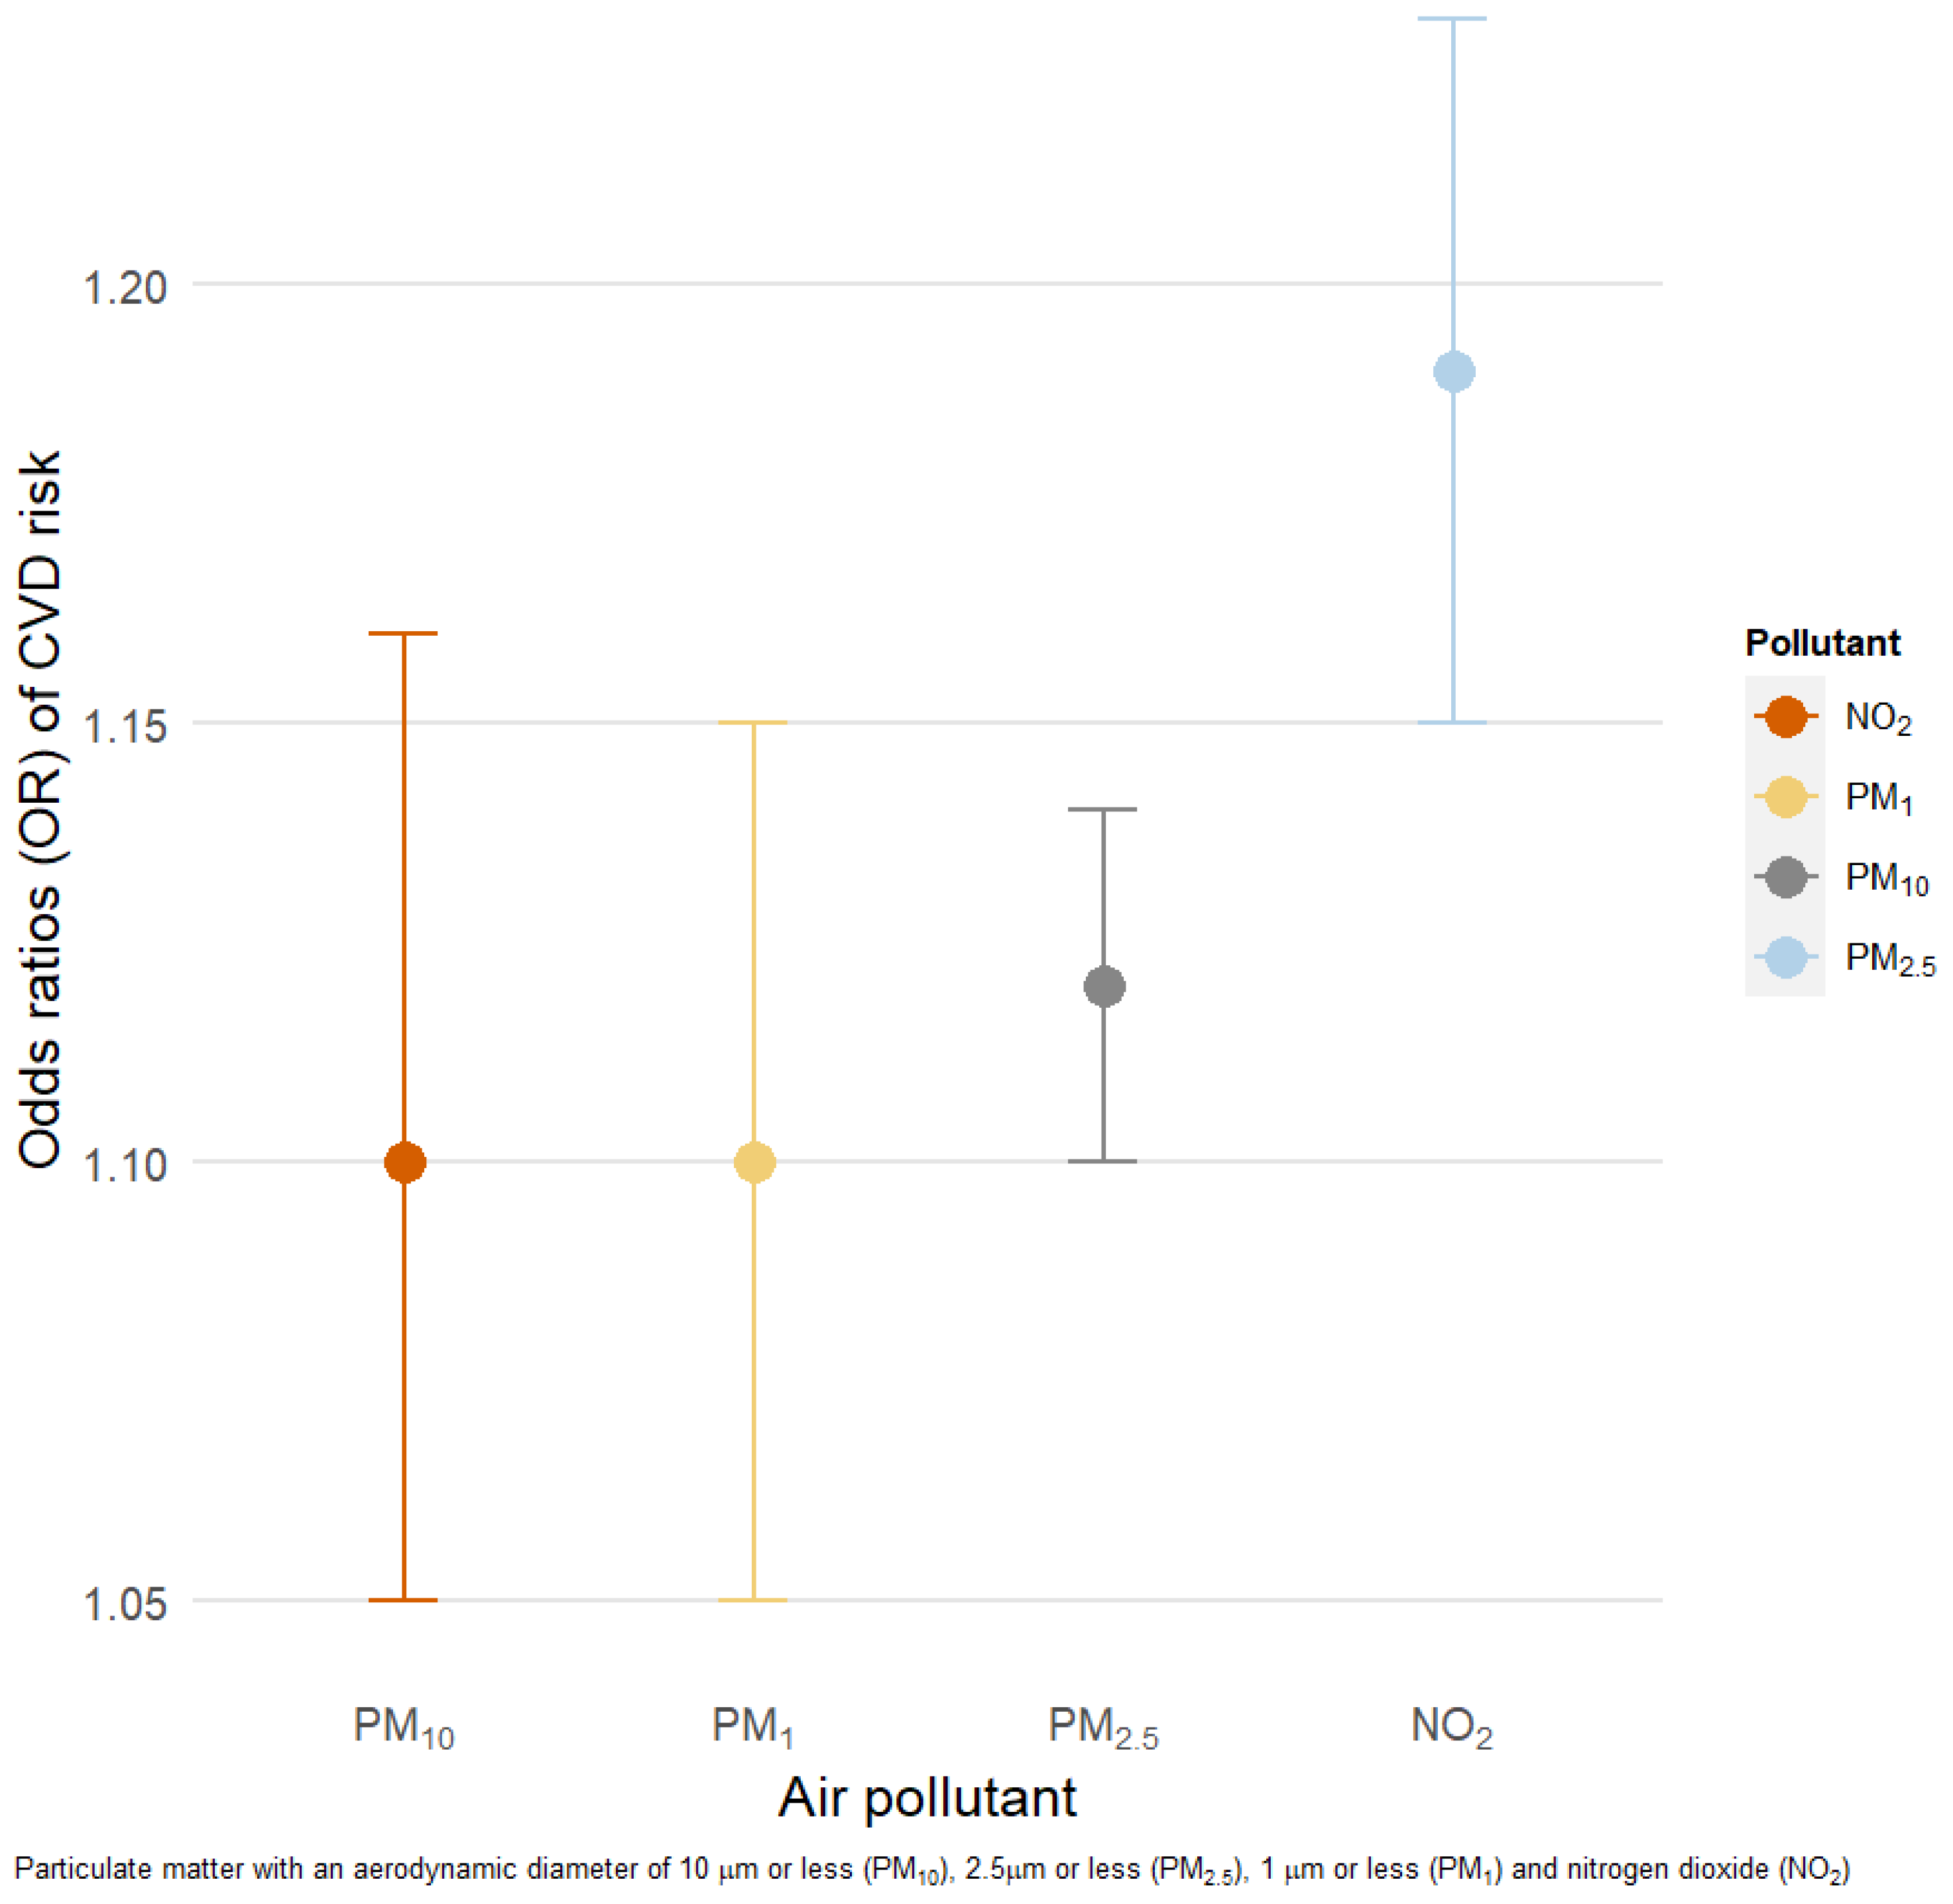
3.4. Odds Ratio of CVD Risk Increase

Figure 3 presents the results of the logistic regression models. We observed higher odds ratios (ORs) of CVD risk (defined as hs-CRP > 3 mg/L) for 10 μg/m3 increments of PM10 (OR: 1.12 (95% CI: 1.10, 1.14)), PM2.5 (1.19 (95% CI: 1.15, 1.23)), PM1 (1.10 (95% CI: 1.05, 1.15)), and NO2 (1.10 (95% CI: 1.05, 1.16)).

3.5. Sensitivity Analysis

Our sensitivity analyses examining 5 year and 1 year exposure windows (Figures S1 and S2, Supplementary Materials) did not differ meaningfully from our main models, in terms of both the magnitude and the direction of the effect estimates, for every pollutant assessed. Likewise, when excluding potential causal intermediates (respiratory and cardiovascular comorbidities) we did not observe important changes in our effect estimates (data not shown).

3.6. Effect Modification

The results of our effect modification models are presented in Table 2 for linear models and in Table 3 for logistic regression models. In our linear models, we observed a statistically significant effect modification for median household income on PM1 exposure (p < 0.001), with larger associations observed for household incomes above the median (percentage change hs-CRP: 8.38, 95% CI: 3.46, 13.53) than below the median (% change hs-CRP: 7.56, 95% CI: 3.62, 11.64). Similar effects for NO2, PM2.5, and PM10 did not reach statistical significance. Participants over 65 years of age had nominally, although nonsignificant, larger effects due to PM2.5 and PM10 exposure. No significant effect modification was observed for other investigated variables in our linear models. A similar pattern was observed in our logistic regression models, although no statistically significant effect modification was observed (Table 3).

4. Discussion

We found that NO2 and multiple size fractions of PM were all strongly and significantly associated with increased levels of hs-CRP in an older Chinese population. The significance of these associations persisted after several sensitivity and subgroup analyses. All investigated air pollutants were strongly and significantly associated with clinical important elevations in hs-CRP (defined as hs- CRP > 3 mg/L), a level which has been previously associated with the development of CVD.
Our results are consistent with findings from most previous studies of PM, although the prior literature was mainly limited to short-term investigations in high-income countries demonstrating larger increases in CRP levels compared to those presented here [21]. This can presumably be explained by the substantially larger cumulative effects on tissue damage and inflammation which occur with long-term exposure to elevated air pollution levels [21].
A pooled data meta-analysis of nine studies by Liu et al. demonstrated statistically significant associations between elevations in PM and increases in serum CRP levels (p = 0.003), indicating an 18.01% and 5.61% increase in CRP with every 10 μg/m3 increment in PM2.5 and PM10, respectively [21]. Moreover, after stratification by study location, i.e., Asian populations (both from Taiwan), the effects remained strong (p < 0.001). Several publications not included in this systematic review also supported these findings [19,40,41]. Nonetheless, a study by Tsai et al. did not find any significant association with PM10 exposure in a Swiss cohort of 8121 participants [42].
The present study is among the first to evaluate the negative associations between PM1 and inflammation. PM1 is rarely assessed in health studies compared to other air pollutants. As a result, there is no standardized reference for PM1 levels set by the WHO. PM1 may play a greater role than PM2.5 in associations with CVD [43]. Moreover, fine and ultrafine particulates (with a diameter of <2.5 μm and <1 μm, respectively) are even more harmful since they can penetrate deeper into lung tissues and spread throughout the body via the bloodstream, causing both acute and chronic health effects [28,44,45]. Consistent with this, increased exposure to PM has been shown to be associated with an increased prevalence of chronic lung diseases, respiratory infections, CVD, and diabetes, whereby inflammation is regarded as the key underlying mechanism of adverse effects from air pollution [46].
These associations, however, have been less consistent in the case of nitrogen dioxide. Multiple studies from European countries, as well as one study from the US and another one from Taiwan, failed to demonstrate any substantial links between levels of ambient NO2 and serum CRP levels [24,26,27,40,47,48,49,50,51,52]. On the contrary, an analysis of two large European cohorts involving 51,459 participants found a 1.9% increase in hs-CRP in association with a 7.4 μg/m3 increment in NO2 exposure [53]. Our study revealed stronger associations (11.8% per 10 μg/m3 increase in 3 year moving averages of outdoor NO2), which can be possibly explained by the older mean age of participants (63.2 vs. 47.6 years), as well as greater co-exposure of other pollutants.
Contrary to some of the previous research, our study did not find any effect modification from common covariates, such as age, sex, smoking, and income level. The only exception was that the individuals with an average household income of more than 20,000 CNY had a higher percentage change in hs-CRP levels with every 10 μg/m3 exposure to PM1. Prior evidence showed stronger associations among the elderly, smokers, people with diabetes and higher BMI, alcohol consumers, those with poorer education, and those with lower income levels. Use of certain medications, such as hormone therapy and statins, as well as marital status, was also shown to have an effect modification [54,55,56].
To our best knowledge, this is the first study to investigate the long-term effects of air pollution exposure and levels of hs-CRP among residents from China. Previous studies were primarily focused on populations from European and North American countries, apart from two reports from Taiwan [49,57]. In an analysis of 30,034 Taiwanese residents, Zhang et al. showed that every 5 μg/m3 of PM2.5 increase was linked with an average of 1.31% higher concentrations of CRP [57], considerably lower than the effects observed in our study (15.7%, 95% CI: 10.9, 20.8), which are more comparable with those from European and US cohorts [18,19,41,54,55,58]. On the contrary, Huang et al. found no statistically significant associations between either PM or NO2 levels and increases in serum CRP in a small sample of 175 patients undergoing continuous peritoneal dialysis [49]. In general, the magnitude of positive associations between CRP and PM10 seen in our participants was similar to those seen in previous studies [18,40,53,55].
Countries with developing economies and booming industrialization suffer most from environmental problems, including air pollution [22]. For example, China, despite the progress made over recent years, still has one of the highest levels of outdoor air pollution compared to the rest of the world [23,59]. China also shares one of the highest burdens from CVDs, to which 40% of all deaths in the country are attributed [60].
The elderly population may be particularly susceptible to the negative cardiovascular impacts from ambient air pollution, given their substantial burden of chronic inflammatory disorders, perturbations in immune function, and changes to physical activity that accompany aging [12,61,62]. With the global population projected to get older over the next decades, the combination of elevated exposure and susceptibility may lead to significant increases in disease burden associated with air pollution exposure [63,64,65].

Strength and Limitations

The findings of the current study are enhanced by a number of significant methodological strengths. First, we were able to investigate the detrimental health effects of air pollution in a specific population known to be at particular risk: older adults from a developing country with higher-than-average air pollution. Second, the study sample included a geographically diverse population of residents which is representative of China. Third, individual-level data on many common risk factors enabled adjustment for a range of personal confounders. Fourth, the applied models incorporated satellite-based estimates of PM exposures, which, despite the absence of air monitoring data, created total spatial coverage among participants of this study. Lastly, the present work is among very few studies examining associations between CRP and PM1 and NO2, the data on which are largely limited and inconsistent. The findings of this study can help to fill the gap in PM1 data, further serving as an evidence background for pollution standards, public policies, and guidelines for concentration cut-offs.
Our study also has limitations. The significance of the results is limited by its cross-sectional design, restricting the observed associations to a single time point, although estimates for air pollution exposure were derived from 2005–2007 with hs-CRP concentrations measured in 2008–2010 as outcomes. Data on other important personal confounders of participants, which potentially could have impacted the levels of hs-CRP, such as the use of anti-inflammatory medications, second-hand smoke exposure, and presence of chronic or acute inflammatory conditions, were unfortunately not obtained during the survey. Additionally, no information on specific chemical components of PM, which could have determined the effects, was available. Furthermore, the findings should be taken cautiously since the inflammatory response was characterized by only one biomarker, which has its own limitations in terms of sensitivity and specificity. Our models did not include detailed information about residential differences, such as socioeconomic status, healthcare access, available green space, or temperature changes, all of which are deemed to be potential confounders for the exposure and outcome. The likelihood of exposure misclassification is also increased by the absence of the participants’ specific activity patterns, such as traffic and indoor time. Although we were not able to adjust for short-term air pollution exposure, which may potentially affect the long-term associations between inflammatory markers and outdoor air pollution exposure, measurements of hs-CRP excluded participants with CRP levels >10 mg/L, which reduced the likelihood of impact on outcome measurements, as previous long-term investigations also demonstrated no effect of short-term pollution on long-term associations [18,26,55]. Lastly, not all surveyed participants consented to provide their blood samples, which limited the generalizability of our findings and may have created a selection bias, as the final sample consisted of healthier, wealthier, and more educated participants. Nonetheless, the strength of observed associations is supported by statistical robustness, with the PR and CI being well above the value of one.

5. Conclusions

In our study in a nationally representative sample of older Chinese adults, we observed significant and consistent associations between long-term concentrations of ambient air pollution (PM10, PM1, and NO2) and high-sensitivity C reactive protein (hs-CRP). Our findings add further to the literature suggesting that air pollution may be an important factor in increasing systemic inflammation in older Chinese adults.

Supplementary Materials

The following are available online at https://www.mdpi.com/1660-4601/18/6/3258/s1: Figure S1. Percentage change (95% CI) in hs-CRP levels associated with 10 ug/m3 increase in 5 year moving averages of air pollution; Figure S2. Percentage change (95% CI) in hs-CRP levels associated with 10 μg/m3 increase in 1 year moving averages of air pollution; Table S1. Results of 10-fold cross-validation for PM1, PM2.5, PM10, and NO2; Table S2. Characteristics of the study participants and nonparticipants (without CRP sample).

Author Contributions

Study design and conceptualization, M.E., T.H. and J.N.; data curation, M.E., Y.G. (Yuming Guo) and Y.G. (Yanfei Guo); statistical analysis, M.E.; funding acquisition, M.E.; methodology, M.E., T.H., G.M., and J.N.; interpretation of the findings, M.E., A.O. and T.H.; data visualization, M.E.; original and final draft writing, M.E., A.O. and T.H. All authors have read and agreed to the published version of the manuscript.

Funding

This research was supported by a PhD Top-up Award from the NHMRC Center for Air Quality and Health Research and Evaluation and the School of Public Health Aging Research Award from the University of Sydney Fund.

Institutional Review Board Statement

The study was conducted according to the guidelines of the Declaration of Helsinki and approved by the Ethics Committee of the Chinese Center for Disease Control and Prevention (approval number 200601).

Informed Consent Statement

Informed consent was obtained from all subjects involved in the study.

Data Availability Statement

Data may be obtained from a third party and are not publicly available. We used data from the WHO Study on global AGEing and adult health (SAGE) to analyze and report the findings. Data access policy is available on https://apps.who.int/healthinfo/systems/surveydata/index.php/catalog/13 (accessed on 24 October 2013).

Acknowledgments

We would like to acknowledge Patrick Kelly for his input in the statistical analysis and interpretation of our findings. We are also grateful to our study participants and field staff; without their support, the study’s implementation would have been impossible.

Conflicts of Interest

The authors declare no conflict of interest. The funders had no role in the study’s design; in the collection, analyses, or interpretation of data; in the writing of the manuscript, or in the decision to publish the results.

References

  1. Boogaard, H.; Walker, K.; Cohen, A.J. Air pollution: The emergence of a major global health risk factor. Int. Health 2019, 11, 417–421. [Google Scholar] [CrossRef]
  2. World Health Organization. Ambient Air Pollution: A Global Assessment of Exposure and Burden of Disease; World Health Organization: Geneva, Switzerland, 2016; pp. 23–50. [Google Scholar]
  3. Al-Kindi, S.G.; Brook, R.D.; Biswal, S.; Rajagopalan, S. Environmental determinants of cardiovascular disease: Lessons learned from air pollution. Nat. Rev. Cardiol. 2020, 17, 656–672. [Google Scholar] [CrossRef]
  4. Cohen, A.J.; Anderson, H.R.; Ostro, B.; Pandey, K.D.; Krzyzanowski, M.; Künzli, N.; Gutschmidt, K.; Pope, A.; Romieu, I.; Samet, J.M.; et al. The global burden of disease due to outdoor air pollution. J. Toxicol. Environ. Health Part A 2005, 68, 1301–1307. [Google Scholar] [CrossRef] [PubMed]
  5. Rückerl, R.; Schneider, A.; Breitner, S.; Cyrys, J.; Peters, A. Health effects of particulate air pollution: A review of epidemiological evidence. Inhal. Toxicol. 2011, 23, 555–592. [Google Scholar] [CrossRef]
  6. Lu, F.; Xu, D.; Cheng, Y.; Dong, S.; Guo, C.; Jiang, X.; Zheng, X. Systematic review and meta-analysis of the adverse health effects of ambient PM2.5 and PM10 pollution in the Chinese population. Environ. Res. 2015, 136, 196–204. [Google Scholar] [CrossRef] [PubMed]
  7. Sosa, B.S.; Porta, A.; Colman Lerner, J.E.; Banda Noriega, R.; Massolo, L. Human health risk due to variations in PM10-PM2.5 and associated PAHs levels. Atmos. Environ. 2017, 160, 27–35. [Google Scholar] [CrossRef]
  8. Cohen, A.J.; Brauer, M.; Burnett, R.; Anderson, H.R.; Frostad, J.; Estep, K.; Balakrishnan, K.; Brunekreef, B.; Dandona, L.; Dandona, R.; et al. Estimates and 25-year trends of the global burden of disease attributable to ambient air pollution: An analysis of data from the Global Burden of Diseases Study 2015. Lancet 2017, 389, 1907–1918. [Google Scholar] [CrossRef] [Green Version]
  9. Roth, G.A.; Abate, D.; Abate, K.H.; Abay, S.M.; Abbafati, C.; Abbasi, N.; Abbastabar, H.; Abd-Allah, F.; Abdela, J.; Abdelalim, A.; et al. Global, regional, and national age-sex-specific mortality for 282 causes of death in 195 countries and territories, 1980–2017: A systematic analysis for the Global Burden of Disease Study 2017. Lancet 2018, 392, 1736–1788. [Google Scholar] [CrossRef] [Green Version]
  10. Metzger, K.B.; Tolbert, P.E.; Klein, M.; Peel, J.L.; Flanders, W.D.; Todd, K.; Mulholland, J.A.; Ryan, P.B.; Frumkin, H. Ambient air pollution and cardiovascular emergency department visits. Epidemiology 2004, 15, 46–56. [Google Scholar] [CrossRef] [PubMed] [Green Version]
  11. Kan, H.; Huang, W.; Chen, B.; Zhao, N. Impact of outdoor air pollution on cardiovascular health in Mainland China. CVD Prev. Control 2009, 4, 71–78. [Google Scholar] [CrossRef]
  12. Brook, R.D.; Rajagopalan, S.; Pope, C.A.; Brook, J.R.; Bhatnagar, A.; Diez-Roux, A.V.; Holguin, F.; Hong, Y.; Luepker, R.V.; Mittleman, M.A.; et al. Particulate matter air pollution and cardiovascular disease: An update to the scientific statement from the american heart association. Circulation 2010, 121, 2331–2378. [Google Scholar] [CrossRef] [Green Version]
  13. Patel, V.; Kantipudi, N.; Jones, G.; Upton, A.; Kamath, M.V. Air pollution and cardiovascular disease: A review. Crit. Rev. Biomed. Eng. 2016, 44, 327–346. [Google Scholar] [CrossRef] [PubMed]
  14. Van Eeden, S.F.; Tan, W.C.; Suwa, T.; Mukae, H.; Terashima, T.; Fujii, T.; Qui, D.; Vincent, R.; Hogg, J.C. Cytokines involved in the systemic inflammatory response induced by exposure to particulate matter air pollutants (PM10). Am. J. Respir. Crit. Care Med. 2001, 164, 826–830. [Google Scholar] [CrossRef]
  15. Becker, S.; Mundandhara, S.; Devlin, R.B.; Madden, M. Regulation of cytokine production in human alveolar macrophages and airway epithelial cells in response to ambient air pollution particles: Further mechanistic studies. Toxicol. Appl. Pharmacol. 2005, 207, 269–275. [Google Scholar] [CrossRef]
  16. Sproston, N.R.; Ashworth, J.J. Role of C-reactive protein at sites of inflammation and infection. Front. Immunol. 2018, 9, 754. [Google Scholar] [CrossRef]
  17. Cozlea, D.L.; Farcas, D.M.; Nagy, A.; Keresztesi, A.A.; Tifrea, R.; Cozlea, L.; Carașca, E. The impact of C reactive protein on global cardiovascular risk on patients with coronary artery disease. Curr. Health Sci. J. 2013, 39, 225–231. [Google Scholar]
  18. Hennig, F.; Fuks, K.; Moebus, S.; Weinmayr, G.; Memmesheimer, M.; Jakobs, H.; Bröcker-Preuss, M.; Führer-Sakel, D.; Möhlenkamp, S.; Erbel, R.; et al. Association between source-specific particulate matter air pollution and hs-CRP: Local traffic and industrial emissions. Environ. Health Perspect. 2014, 122, 703–710. [Google Scholar] [CrossRef] [Green Version]
  19. Hoffmann, B.; Moebus, S.; Dragano, N.; Stang, A.; Möhlenkamp, S.; Schmermund, A.; Memmesheimer, M.; Bröcker-Preuss, M.; Mann, K.; Erbel, R.; et al. Chronic residential exposure to particulate matter air pollution and systemic inflammatory markers. Environ. Health Perspect. 2009, 117, 1302–1308. [Google Scholar] [CrossRef] [Green Version]
  20. Zeka, A.; Sullivan, J.R.; Vokonas, P.S.; Sparrow, D.; Schwartz, J. Inflammatory markers and particulate air pollution: Characterizing the pathway to disease. Int. J. Epidemiol. 2006, 35, 1347–1354. [Google Scholar] [CrossRef] [PubMed] [Green Version]
  21. Liu, Q.; Gu, X.; Deng, F.; Mu, L.; Baccarelli, A.A.; Guo, X.; Wu, S. Ambient particulate air pollution and circulating C-reactive protein level: A systematic review and meta-analysis. Int. J. Hyg. Environ. Health 2019, 222, 756–764. [Google Scholar] [CrossRef]
  22. Mannucci, P.M.; Franchini, M. Health effects of ambient air pollution in developing countries. Int. J. Environ. Res. Public Health 2017, 14, 1048. [Google Scholar] [CrossRef]
  23. Xue, T.; Liu, J.; Zhang, Q.; Geng, G.; Zheng, Y.; Tong, D.; Liu, Z.; Guan, D.; Bo, Y.; Zhu, T.; et al. Rapid improvement of PM2.5 pollution and associated health benefits in China during 2013–2017. Sci. China Earth Sci. 2019, 62, 1847–1856. [Google Scholar] [CrossRef]
  24. Dadvand, P.; Nieuwenhuijsen, M.J.; Agustí, À.; De Batlle, J.; Benet, M.; Beelen, R.; Cirach, M.; Martinez, D.; Hoek, G.; Basagaña, X.; et al. Air pollution and biomarkers of systemic inflammation and tissue repair in COPD patients. Eur. Respir. J. 2014, 44, 603–613. [Google Scholar] [CrossRef] [PubMed] [Green Version]
  25. Bind, M.A.; Baccarelli, A.; Zanobetti, A.; Tarantini, L.; Suh, H.; Vokonas, P.; Schwartz, J. Air pollution and markers of coagulation, inflammation, and endothelial function: Associations and epigene-environment interactions in an elderly cohort. Epidemiology 2012, 23, 332–340. [Google Scholar] [CrossRef] [PubMed] [Green Version]
  26. Pilz, V.; Wolf, K.; Breitner, S.; Rückerl, R.; Koenig, W.; Rathmann, W.; Cyrys, J.; Peters, A.; Schneider, A. C-reactive protein (CRP) and long-term air pollution with a focus on ultrafine particles. Int. J. Hyg. Environ. Health 2018, 221, 510–518. [Google Scholar] [CrossRef] [PubMed] [Green Version]
  27. Chaparro, M.P.; Benzeval, M.; Richardson, E.; Mitchell, R. Neighborhood deprivation and biomarkers of health in Britain: The mediating role of the physical environment. BMC Public Health 2018, 18, 201. [Google Scholar] [CrossRef] [PubMed]
  28. Chen, G.; Li, S.; Zhang, Y.; Zhang, W.; Li, D.; Wei, X.; He, Y.; Bell, M.L.; Williams, G.; Marks, G.B.; et al. Effects of ambient PM1 air pollution on daily emergency hospital visits in China: An epidemiological study. Lancet Planet. Health 2017, 1, e221–e229. [Google Scholar] [CrossRef]
  29. Elbarbary, M.; Honda, T.; Morgan, G.; Guo, Y.; Guo, Y.; Kowal, P.; Negin, J. Ambient Air Pollution Exposure Association with Anaemia Prevalence and Haemoglobin Levels in Chinese Older Adults. Int. J. Environ. Res. Public Health 2020, 17, 3209. [Google Scholar] [CrossRef]
  30. Chen, G.; Knibbs, L.D.; Zhang, W.; Li, S.; Cao, W.; Guo, J.; Ren, H.; Wang, B.; Wang, H.; Williams, G.; et al. Estimating spatiotemporal distribution of PM1 concentrations in China with satellite remote sensing, meteorology, and land use information. Environ. Pollut. 2018, 233, 1086–1094. [Google Scholar] [CrossRef] [PubMed]
  31. Chen, G.; Li, S.; Knibbs, L.D.; Hamm, N.A.S.; Cao, W.; Li, T.; Guo, J.; Ren, H.; Abramson, M.J.; Guo, Y. A machine learning method to estimate PM2.5 concentrations across China with remote sensing, meteorological and land use information. Sci. Total Environ. 2018, 636, 52–60. [Google Scholar] [CrossRef]
  32. Krotkov, N.A.; Lamsal, L.N.; Celarier, E.A.; Swartz, W.H.; Marchenko, S.V.; Bucsela, E.J.; Chan, K.L.; Wenig, M.; Zara, M. The version 3 OMI NO2 standard product. Atmos. Meas. Tech. 2017, 10, 3133–3149. [Google Scholar] [CrossRef] [Green Version]
  33. Zhan, Y.; Luo, Y.; Deng, X.; Zhang, K.; Zhang, M.; Grieneisen, M.L.; Di, B. Satellite-Based Estimates of Daily NO2 Exposure in China Using Hybrid Random Forest and Spatiotemporal Kriging Model. Environ. Sci. Technol. 2018, 52, 4180–4189. [Google Scholar] [CrossRef]
  34. Skogstrand, K.; Ekelund, C.K.; Thorsen, P.; Vogel, I.; Jacobsson, B.; Nørgaard-Pedersen, B.; Hougaard, D.M. Effects of blood sample handling procedures on measurable inflammatory markers in plasma, serum and dried blood spot samples. J. Immunol. Methods 2008, 336, 78–84. [Google Scholar] [CrossRef] [PubMed]
  35. McDade, T.W.; Williams, S.; Snodgrass, J.J. What a drop can do: Dried blood spots as a minimally invasive method for integrating biomarkers into population-based research. Demography 2007, 44, 899–925. [Google Scholar] [CrossRef] [Green Version]
  36. Kamath, D.Y.; Xavier, D.; Sigamani, A.; Pais, P. High sensitivity C-reactive protein (hsCRP) & cardiovascular disease: An Indian perspective. Indian J. Med. Res. 2015, 142, 261–268. [Google Scholar] [CrossRef] [PubMed]
  37. Pearson, T.A.; Mensah, G.A.; Alexander, R.W.; Anderson, J.L.; Cannon, R.O.; Criqui, M.; Fadl, Y.Y.; Fortmann, S.P.; Hong, Y.; Myers, G.L.; et al. Markers of inflammation and cardiovascular disease: Application to clinical and public health practice: A statement for healthcare professionals from the centers for disease control and prevention and the American Heart Association. Circulation 2003, 107, 499–511. [Google Scholar] [CrossRef]
  38. Brulle, R.J.; Pellow, D.N. Environmental justice: Human health and environmental inequalities. Annu. Rev. Public Health 2006, 27, 103–124. [Google Scholar] [CrossRef] [Green Version]
  39. Mohai, P.; Pellow, D.; Roberts, J.T. Environmental justice. Annu. Rev. Environ. Resour. 2009, 34, 405–430. [Google Scholar] [CrossRef]
  40. Lucht, S.; Hennig, F.; Moebus, S.; Führer-Sakel, D.; Herder, C.; Jöckel, K.H.; Hoffmann, B. Air pollution and diabetes-related biomarkers in non-diabetic adults: A pathway to impaired glucose metabolism? Environ. Int. 2019, 124, 370–392. [Google Scholar] [CrossRef]
  41. Erqou, S.; Clougherty, J.E.; Olafiranye, O.; Magnani, J.W.; Aiyer, A.; Tripathy, S.; Kinnee, E.; Kip, K.E.; Reis, S.E. Particulate Matter Air Pollution and Racial Differences in Cardiovascular Disease Risk. Arterioscler. Thromb. Vasc. Biol. 2018, 38, 935–942. [Google Scholar] [CrossRef] [Green Version]
  42. Tsai, D.H.; Riediker, M.; Berchet, A.; Paccaud, F.; Waeber, G.; Vollenweider, P.; Bochud, M. Effects of short- and long-term exposures to particulate matter on inflammatory marker levels in the general population. Environ. Sci. Pollut. Res. 2019, 26, 19697–19704. [Google Scholar] [CrossRef] [PubMed]
  43. Yang, B.Y.; Guo, Y.; Morawska, L.; Bloom, M.S.; Markevych, I.; Heinrich, J.; Dharmage, S.C.; Knibbs, L.D.; Lin, S.; Yim, S.H.L.; et al. Ambient PM1 air pollution and cardiovascular disease prevalence: Insights from the 33 Communities Chinese Health Study. Environ. Int. 2019, 123, 310–317. [Google Scholar] [CrossRef] [PubMed]
  44. Zwozdziak, A.; Sówka, I.; Willak-Janc, E.; Zwozdziak, J.; Kwiecińska, K.; Balińska-Miśkiewicz, W. Influence of PM1 and PM2.5 on lung function parameters in healthy schoolchildren—a panel study. Environ. Sci. Pollut. Res. 2016, 23, 23892–23901. [Google Scholar] [CrossRef] [PubMed]
  45. Yin, P.; Guo, J.; Wang, L.; Fan, W.; Lu, F.; Guo, M.; Moreno, S.B.R.; Wang, Y.; Wang, H.; Zhou, M.; et al. Higher Risk of Cardiovascular Disease Associated with Smaller Size-Fractioned Particulate Matter. Environ. Sci. Technol. Lett. 2020, 7, 95–101. [Google Scholar] [CrossRef]
  46. Schraufnagel, D.E. The health effects of ultrafine particles. Exp. Mol. Med. 2020, 52, 311–317. [Google Scholar] [CrossRef]
  47. Midouhas, E.; Kokosi, T.; Flouri, E. Neighbourhood-level air pollution and greenspace and inflammation in adults. Health Place 2019, 58, 102167. [Google Scholar] [CrossRef] [PubMed]
  48. Forbes, L.J.L.; Patel, M.D.; Rudnicka, A.R.; Cook, D.G.; Bush, T.; Stedman, J.R.; Whincup, P.H.; Strachan, D.P.; Anderson, H.R. Chronic exposure to outdoor air pollution and diagnosed cardiovascular disease: Meta-analysis of three large cross-sectional surveys. Environ. Health 2009, 8, 30. [Google Scholar] [CrossRef] [Green Version]
  49. Huang, W.H.; Yen, T.H.; Chan, M.J.; Su, Y.J. Environmental carbon monoxide level is associated with the level of high-sensitivity c-reactive protein in peritoneal dialysis patients. Medicine 2014, 93, e181. [Google Scholar] [CrossRef]
  50. Hajat, A.; Allison, M.; Diez-Roux, A.V.; Jenny, N.S.; Jorgensen, N.W.; Szpiro, A.A.; Vedal, S.; Kaufman, J.D. Long-term exposure to air pollution and markers of inflammation, coagulation, and endothelial activation a repeat-measures analysis in the multi-ethnic study of atherosclerosis (MESA). Epidemiology 2015, 26, 310–320. [Google Scholar] [CrossRef]
  51. Wolf, K.; Popp, A.; Schneider, A.; Breitner, S.; Hampel, R.; Rathmann, W.; Herder, C.; Roden, M.; Koenig, W.; Meisinger, C.; et al. Association between long-term exposure to air pollution and biomarkers related to insulin resistance, subclinical inflammation, and adipokines. Diabetes 2016, 65, 3314–3326. [Google Scholar] [CrossRef] [Green Version]
  52. Panasevich, S.; Leander, K.; Rosenlund, M.; Ljungman, P.; Bellander, T.; De Faire, U.; Pershagen, G.; Nyberg, F. Associations of long- and short-term air pollution exposure with markers of inflammation and coagulation in a population sample. Occup. Environ. Med. 2009, 66, 747–753. [Google Scholar] [CrossRef]
  53. Cai, Y.; Hansell, A.L.; Blangiardo, M.; Burton, P.R.; De Hoogh, K.; Doiron, D.; Fortier, I.; Gulliver, J.; Hveem, K.; Mbatchou, S.; et al. Long-termexposure to road traffic noise, ambient air pollution, and cardiovascular risk factors in the HUNTand lifelines cohorts. Eur. Heart J. 2017, 38, 2290–2296. [Google Scholar] [CrossRef] [Green Version]
  54. Ostro, B.; Malig, B.; Broadwin, R.; Basu, R.; Gold, E.B.; Bromberger, J.T.; Derby, C.; Feinstein, S.; Greendale, G.A.; Jackson, E.A.; et al. Chronic PM2.5 exposure and inflammation: Determining sensitive subgroups in mid-life women. Environ. Res. 2014, 132, 168–175. [Google Scholar] [CrossRef] [PubMed] [Green Version]
  55. Viehmann, A.; Hertel, S.; Fuks, K.; Eisele, L.; Moebus, S.; Möhlenkamp, S.; Nonnemacher, M.; Jakobs, H.; Erbel, R.; Jöckel, K.H.; et al. Long-term residential exposure to urban air pollution, and repeated measures of systemic blood markers of inflammation and coagulation. Occup. Environ. Med. 2015, 72, 656–663. [Google Scholar] [CrossRef]
  56. Rückerl, R.; Peters, A.; Khuseyinova, N.; Andreani, M.; Koenig, W.; Meisinger, C.; Dimakopoulou, K.; Sunyer, J.; Lanki, T.; Nyberg, F.; et al. Determinants of the acute-phase protein C-reactive protein in myocardial infarction survivors: The role of comorbidities and environmental factors. Clin. Chem. 2009, 55, 322–335. [Google Scholar] [CrossRef] [PubMed] [Green Version]
  57. Zhang, Z.; Chang, L.Y.; Lau, A.K.H.; Chan, T.C.; Chuang, Y.C.; Chan, J.; Lin, C.; Jiang, W.K.; Dear, K.; Zee, B.C.Y.; et al. Satellite-based estimates of long-term exposure to fine particulate matter are associated with C-reactive protein in 30 034 Taiwanese adults. Int. J. Epidemiol. 2017, 46, 1126–1136. [Google Scholar] [CrossRef] [PubMed]
  58. Green, R.; Broadwin, R.; Malig, B.; Basu, R.; Gold, E.B.; Qi, L.; Sternfeld, B.; Bromberger, J.T.; Greendale, G.A.; Kravitz, H.M.; et al. Long- and short-term exposure to air pollution and inflammatory/hemostatic markers in midlife women. Epidemiology 2016, 27, 211–220. [Google Scholar] [CrossRef] [PubMed] [Green Version]
  59. Liu, W.; Xu, Z.; Yang, T. Health effects of air pollution in china. Int. J. Environ. Res. Public Health 2018, 15, 1471. [Google Scholar] [CrossRef] [PubMed] [Green Version]
  60. Zhao, D.; Liu, J.; Wang, M.; Zhang, X.; Zhou, M. Epidemiology of cardiovascular disease in China: Current features and implications. Nat. Rev. Cardiol. 2019, 16, 203–212. [Google Scholar] [CrossRef]
  61. Valiathan, R.; Ashman, M.; Asthana, D. Effects of Ageing on the Immune System: Infants to Elderly. Scand. J. Immunol. 2016, 83, 255–266. [Google Scholar] [CrossRef] [Green Version]
  62. Cvecka, J.; Tirpakova, V.; Sedliak, M.; Kern, H.; Mayr, W.; Hamar, D. Physical activity in elderly. Eur. J. Transl. Myol. 2015, 25, 249. [Google Scholar] [CrossRef] [PubMed]
  63. United Nations. World Population Prospects 2019. Available online: https://digitallibrary.un.org/record/3813698 (accessed on 30 July 2019).
  64. Lelieveld, J.; Klingmüller, K.; Pozzer, A.; Pöschl, U.; Fnais, M.; Daiber, A.; Münzel, T. Cardiovascular disease burden from ambient air pollution in Europe reassessed using novel hazard ratio functions. Eur. Heart J. 2019, 40, 1590–1596. [Google Scholar] [CrossRef] [PubMed] [Green Version]
  65. Roth, G.A.; Johnson, C.; Abajobir, A.; Abd-Allah, F.; Abera, S.F.; Abyu, G.; Ahmed, M.; Aksut, B.; Alam, T.; Alam, K.; et al. Global, Regional, and National Burden of Cardiovascular Diseases for 10 Causes, 1990 to 2015. J. Am. Coll. Cardiol. 2017, 70, 1–25. [Google Scholar] [CrossRef] [PubMed]
Figure 1. Distributions of 3-year average concentrations of air pollutants in study on global aging and adult health (SAGE) China study regions.
Ijerph 18 03258 g001
Figure 2. Percentage change (95% confidence interval (CI)) in high-sensitivity C reactive protein (hs-CRP) levels associated with 10 μg/m3 increase in 3 year moving averages of air pollution. PM10 = particulate matter with a diameter of 10 μm or less, PM2.5 = with a diameter of 2.5 μm or less, PM1 = particulate matter with a diameter of 1 μm or less, NO2 = nitrogen dioxide. Models were adjusted for age, sex, BMI, tobacco use, physical activity, education level, fruit and vegetable intake, alcohol use, type of fuel used at home, median household income, and location of residence (urban/rural).
Ijerph 18 03258 g002
Figure 3. Association between a 10 μg/m3 increment in 3 year moving averages of air pollution and CVD risk. Models adjusted for age, sex, BMI, tobacco use, physical activity, education level, fruit and vegetable intake, alcohol use, type of fuel used at home, median household income, and location of residence (urban/rural). OR = odds ratio.
Ijerph 18 03258 g003
Table 1. Baseline characteristics of study participants.
CharacteristicsMeanSD or %
PM10 1 year (μg/m3)90.2328.80
PM2.5 1 year (μg/m3)53.9417.08
PM1 1 year (μg/m3)43.6713.04
NO2 1 year (μg/m3)30.5212.36
Age (years)63.229.35
BMI (kg/m2)24.114.81
Systolic blood pressure (mmHg)148.2624.55
Diastolic blood pressure (mmHg)84.6413.55
Total annual household incomes
• ≤20,000 CNY418152.82
• >20,000 CNY351244.37
Sex (n, %)
• Male377447.68
• Female414152.32
Smoking status
• Current tobacco use261533.14
• No current tobacco use527566.86
Alcohol use
• Current alcohol drinking237730.19
• No current alcohol drinker549669.81
Education
• No formal education176222.26
• Primary school317340.09
• Middle school152119.22
• High school or higher145918.43
Place of residence
• Rural427654.02
• Urban363945.98
Physical activity
• Low level270734.31
• Moderate level224328.43
• High level293937.25
Nutrition
• Insufficient intake of fruits and vegetables333642.15
• Sufficient intake of fruits and vegetables457957.85
Type of fuel used at home
• Clean458858.42
• Unclean326541.58
History of Diabetes
• Yes5547.06
• No729892.94
History of Chronic lung diseases
• Yes6298
• No723692
BMI = body mass index, PM10 = particulate matter with a diameter of 10 μm or less, PM2.5 = with a diameter of 2.5 μm or less, PM1 = particulate matter with a diameter of 1 μm or less, NO2 = nitrogen dioxide.
Table 2. Stratified analysis of percentage change in hs-CRP level with 10 μg/m3 increase in 3 year moving averages in each pollutant level.
CharacteristicsPM10
%
(95% CI)
PM2.5
%
(95% CI)
PM1
%
(95% CI)
NO2
%
(95% CI)
Sexp = 0.09p = 0.26p = 0.25p = 0.50
• Male11.21 a
(6.44, 16.18)
13.73
(7.21, 20.64)
9.76
(5.68, 14.01)
10.16
(4.86, 15.73)
• Female12.58 a
(7.65, 17.75)
16.06
(9.53, 22.98)
9.71
(5.73, 13.85)
11.91
(96.56, 17.52)
Smokingp = 0.11p = 0.34p = 0.35p = 0.52
• Yes7.22 b
(2.2, 12.67)
7.81
(0.53, 15.63)
6.56
(1.86, 11.49)
3.53
(−2.48, 9.92)
• No14.29 b
(9.75, 19.01)
17.95
(11.99, 24.24)
10.76
(7.18, 14.46)
14.07
(9.29, 19.06)
Agep = 0.02p = 0.03p = 0.68p = 0.34
• ≤65 years11.34 c
(6.93, 15.93)
13.41
(7.59, 19.54)
10.67
(7.13, 14.33)
11.69
(6.97, 16.63)
• >65 years13.78 c
(8.07, 19.80)
19.22
(11.26, 27.75)
9.89
(4.93, 15.08)
11.70
(5.25, 18.55)
Incomep = 0.08p = 0.49p < 0.001p = 0.06
• ≤20,000 CNY9.57 d
(4.58, 14,80)
10.35
(3.47, 17.68)
7.56
(3.62, 11.64)
5.46
(0.20, 10.99)
• >20,000 CNY6.33 d
(0.59, 12.39)
9.55
(1.34, 18.42)
8.38
(3.46, 13.53)
9.19
(2.37, 16.49)
PM10 = particulate matter with a diameter of 10 μm or less, PM2.5 = with a diameter of 2.5 μm or less, PM1 = particulate matter with a diameter of 1 μm or less, NO2 = nitrogen dioxide. a Adjusted for age, BMI, tobacco use, physical activity, education level, fruit and vegetable intake, alcohol use, type of fuel used home, household annual income, location of residence (urban/rural). b Adjusted for age, sex, BMI, physical activity, education level, fruit and vegetable intake, alcohol use, type of fuel used at home, household annual income, and location of residence (urban/rural). c Adjusted for sex, BMI, tobacco use, physical activity, education level, fruit and vegetable intake, alcohol use, type of fuel used at home, household annual income, and location of residence (urban/rural). d Adjusted for age, sex, BMI, tobacco use, physical activity, education level, fruit and vegetable intake, alcohol use, type of fuel used at home, and location of residence (urban/rural).
Table 3. Stratified analysis of the probability of increased risk of CVD associated with 10 μg/m3 increase in 3 year moving averages in each pollutant level.
CharacteristicsPM10
OR
(95% CI)
PM2.5
OR
(95% CI)
PM1
OR
(95% CI)
NO2
OR
(95% CI)
Sexp = 0.93p = 0.66p = 0.07p = 0.309
• Male1.11
(1.08, 1.15) a
1.19
(1.12, 1.26) a
1.07
(0.99, 1.15) a
1.11
(1.03, 1.20) a
• Female1.10
(1.08, 1.13) a
1.20
(1.15, 1.26) a
1.11
(1.04, 1.19) a
1.15
(1.07, 1.23) a
Smokingp = 0.78p = 0.58p = 0.06p = 0.051
• Yes1.12
(1.07, 1.16) b
1.17
(1.09, 1.25) b
1.00
(0.92, 1.10) b
1.03
(0.93, 1.13) b
• No1.10
(1.08, 1.13) b
1.20
(1.16, 1.25) b
1.13
(1.07, 1.21) b
1.18
(1.11, 1.26) b
Agep = 0.06p = 0.04p = 0.35p = 0.08
• ≤65 years1.08
(1.06, 1.11) c
1.14
(1.08, 1.20) c
1.08
(1.01, 1.15) c
1.05
(0.98, 1.13) c
• >65 years1.13
(1.11, 1.16) c
1.27
(1.20, 1.33) c
1.13
(1.04, 1.21) c
1.25
(1.16, 1.36) c
Incomep = 0.73p = 0.93p = 0.05p = 0.86
• ≤20,000 CNY1.10
(1.07, 1.13) d
1.15
(1.09, 1.22) d
1.02
(0.95, 1.09) d
1.08
(0.99, 1.18) d
• >20,000 CNY1.10
(1.07, 1.12) d
1.18
(1.13, 1.24)
1.08
(1.00, 1.17) d
1.12
(1.05, 1.20) d
PM10 = particulate matter with a diameter of 10 μm or less, PM2.5 = with a diameter of 2.5 μm or less, PM1 = particulate matter with a diameter of 1 μm or less, NO2 = nitrogen dioxide. a Adjusted for age, BMI, tobacco use, physical activity, education level, fruit and vegetable intake, alcohol use, type of fuel used home, household annual income, and location of residence (urban/rural). b Adjusted for age, sex, BMI, physical activity, education level, fruit and vegetable intake, alcohol use, type of fuel used at home, household annual income, and location of residence (urban/rural). c Adjusted for sex, BMI, tobacco use, physical activity, education level, fruit and vegetable intake, alcohol use, type of fuel used at home, household annual income, and location of residence (urban/rural). d Adjusted for age, sex, BMI, tobacco use, physical activity, education level, fruit and vegetable intake, alcohol use, type of fuel used at home, and location of residence (urban/rural).
Publisher’s Note: MDPI stays neutral with regard to jurisdictional claims in published maps and institutional affiliations.

