
Differences in Habitual Physical Activity Behavior between Students from Different Vocational Education Tracks and the Association with Cognitive Performance

 ,
, 

Abstract
1. Introduction
2. Materials and Methods
2.1. Design
2.2. Participants
2.3. Procedure
2.4. Materials
2.4.1. Physical Activity Behavior
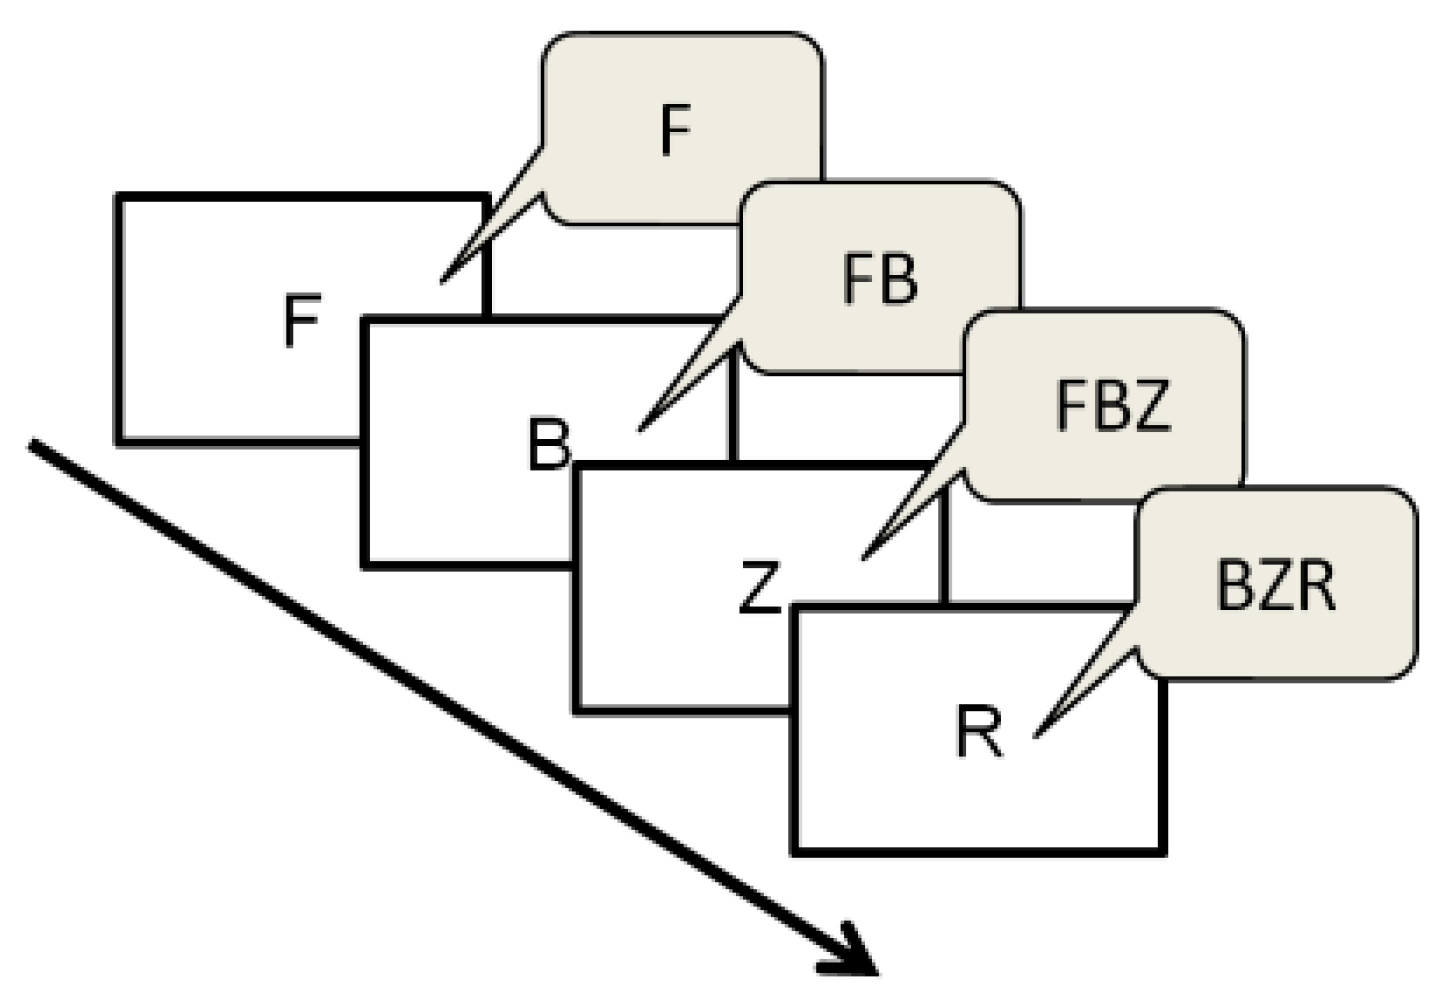
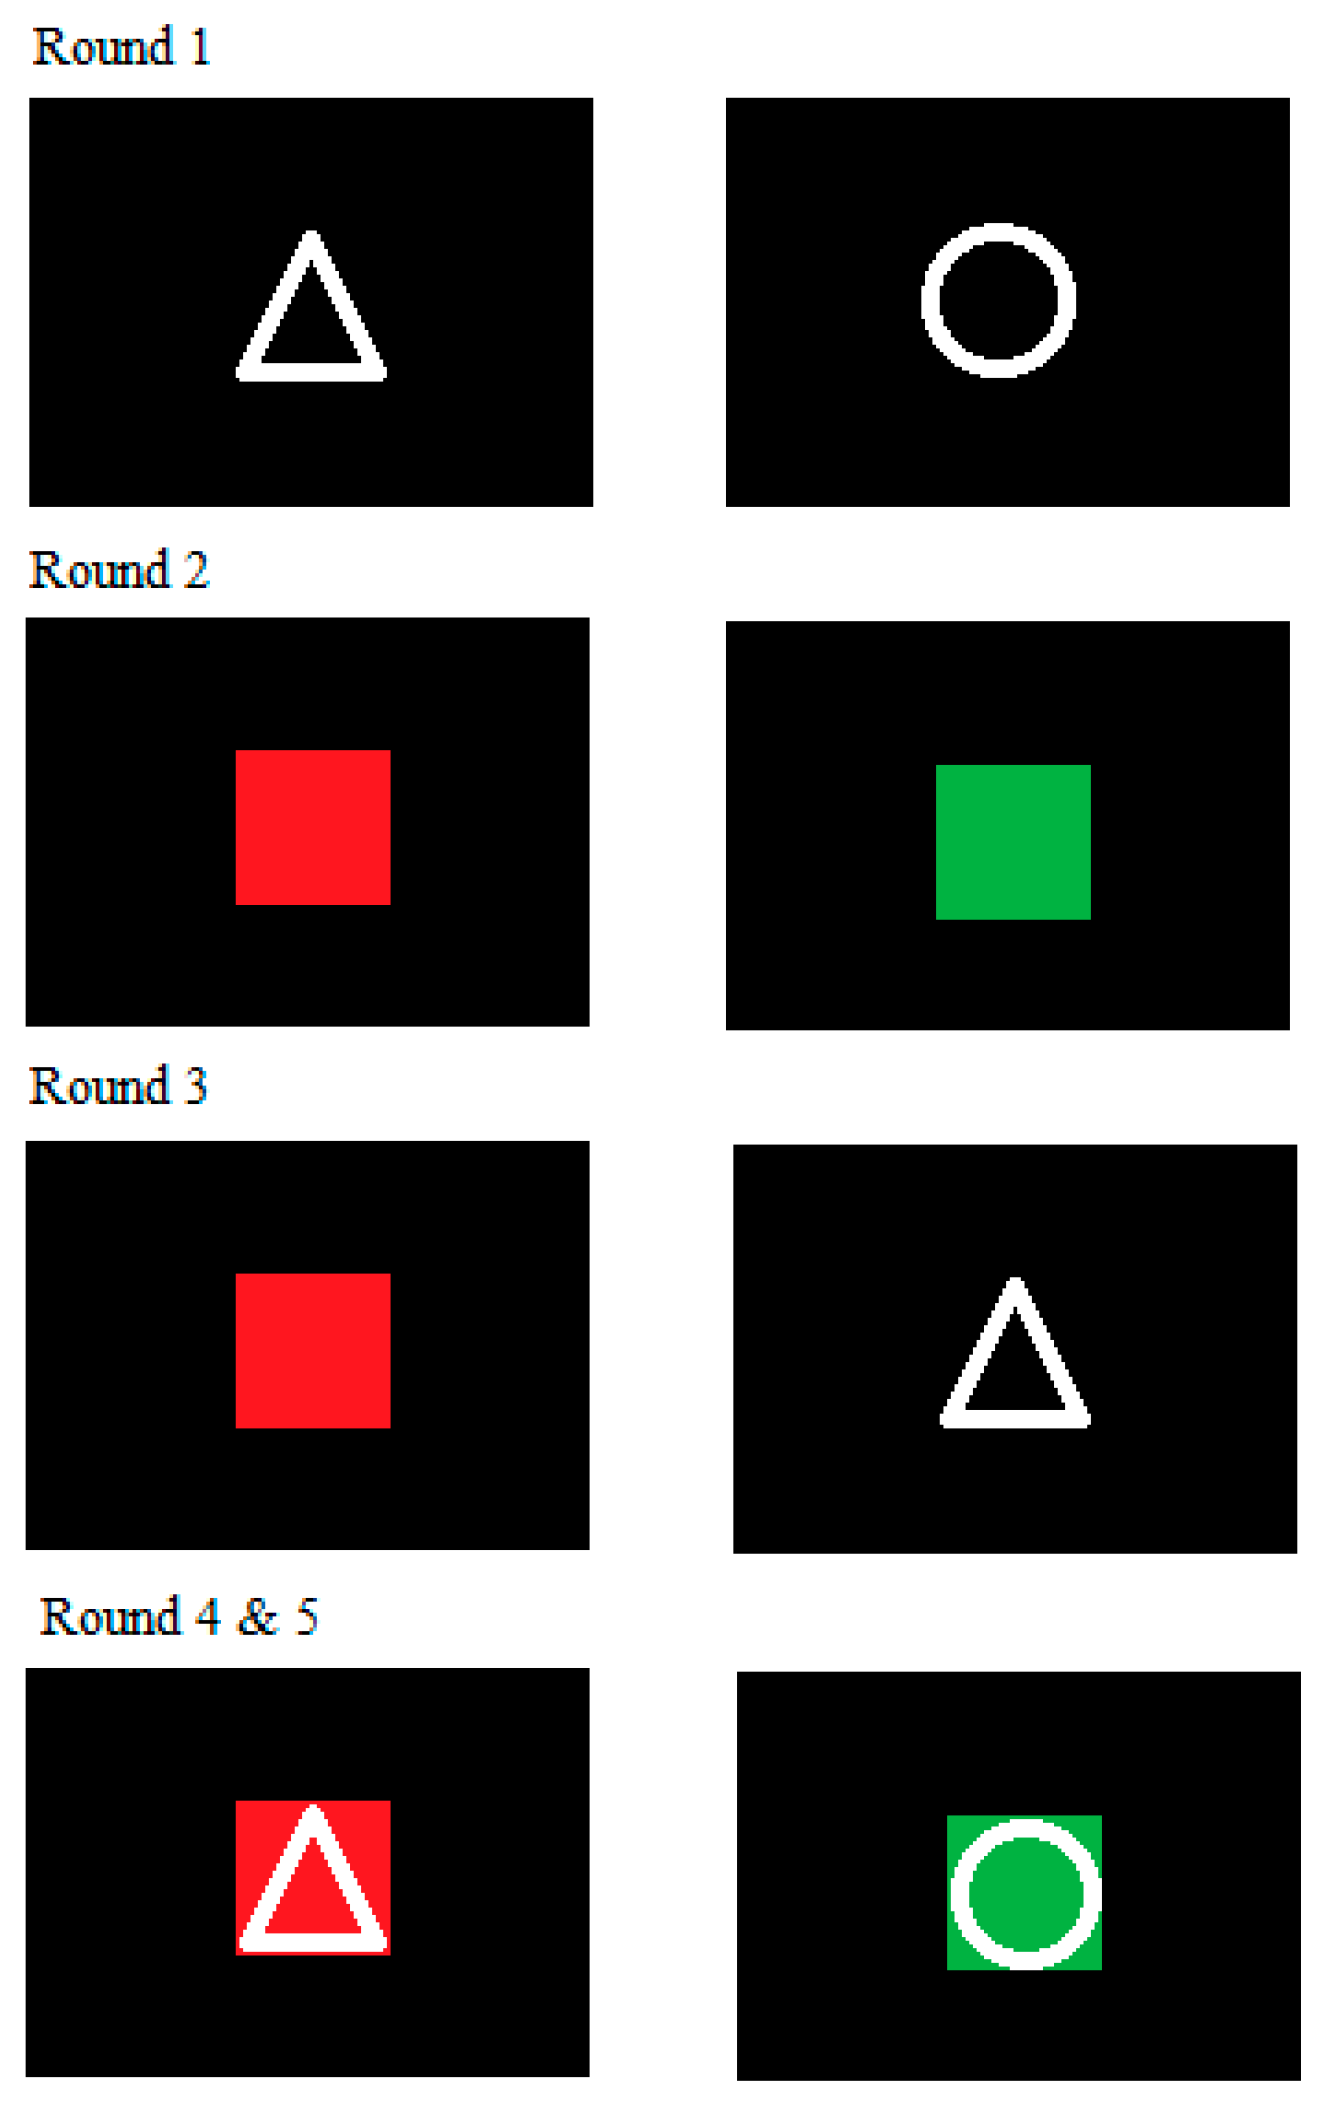
2.4.2. Cognitive Functioning
2.4.3. Questionnaires and Other Measures
2.5. Statistical Analyses
3. Results
3.1. Participant Characteristics
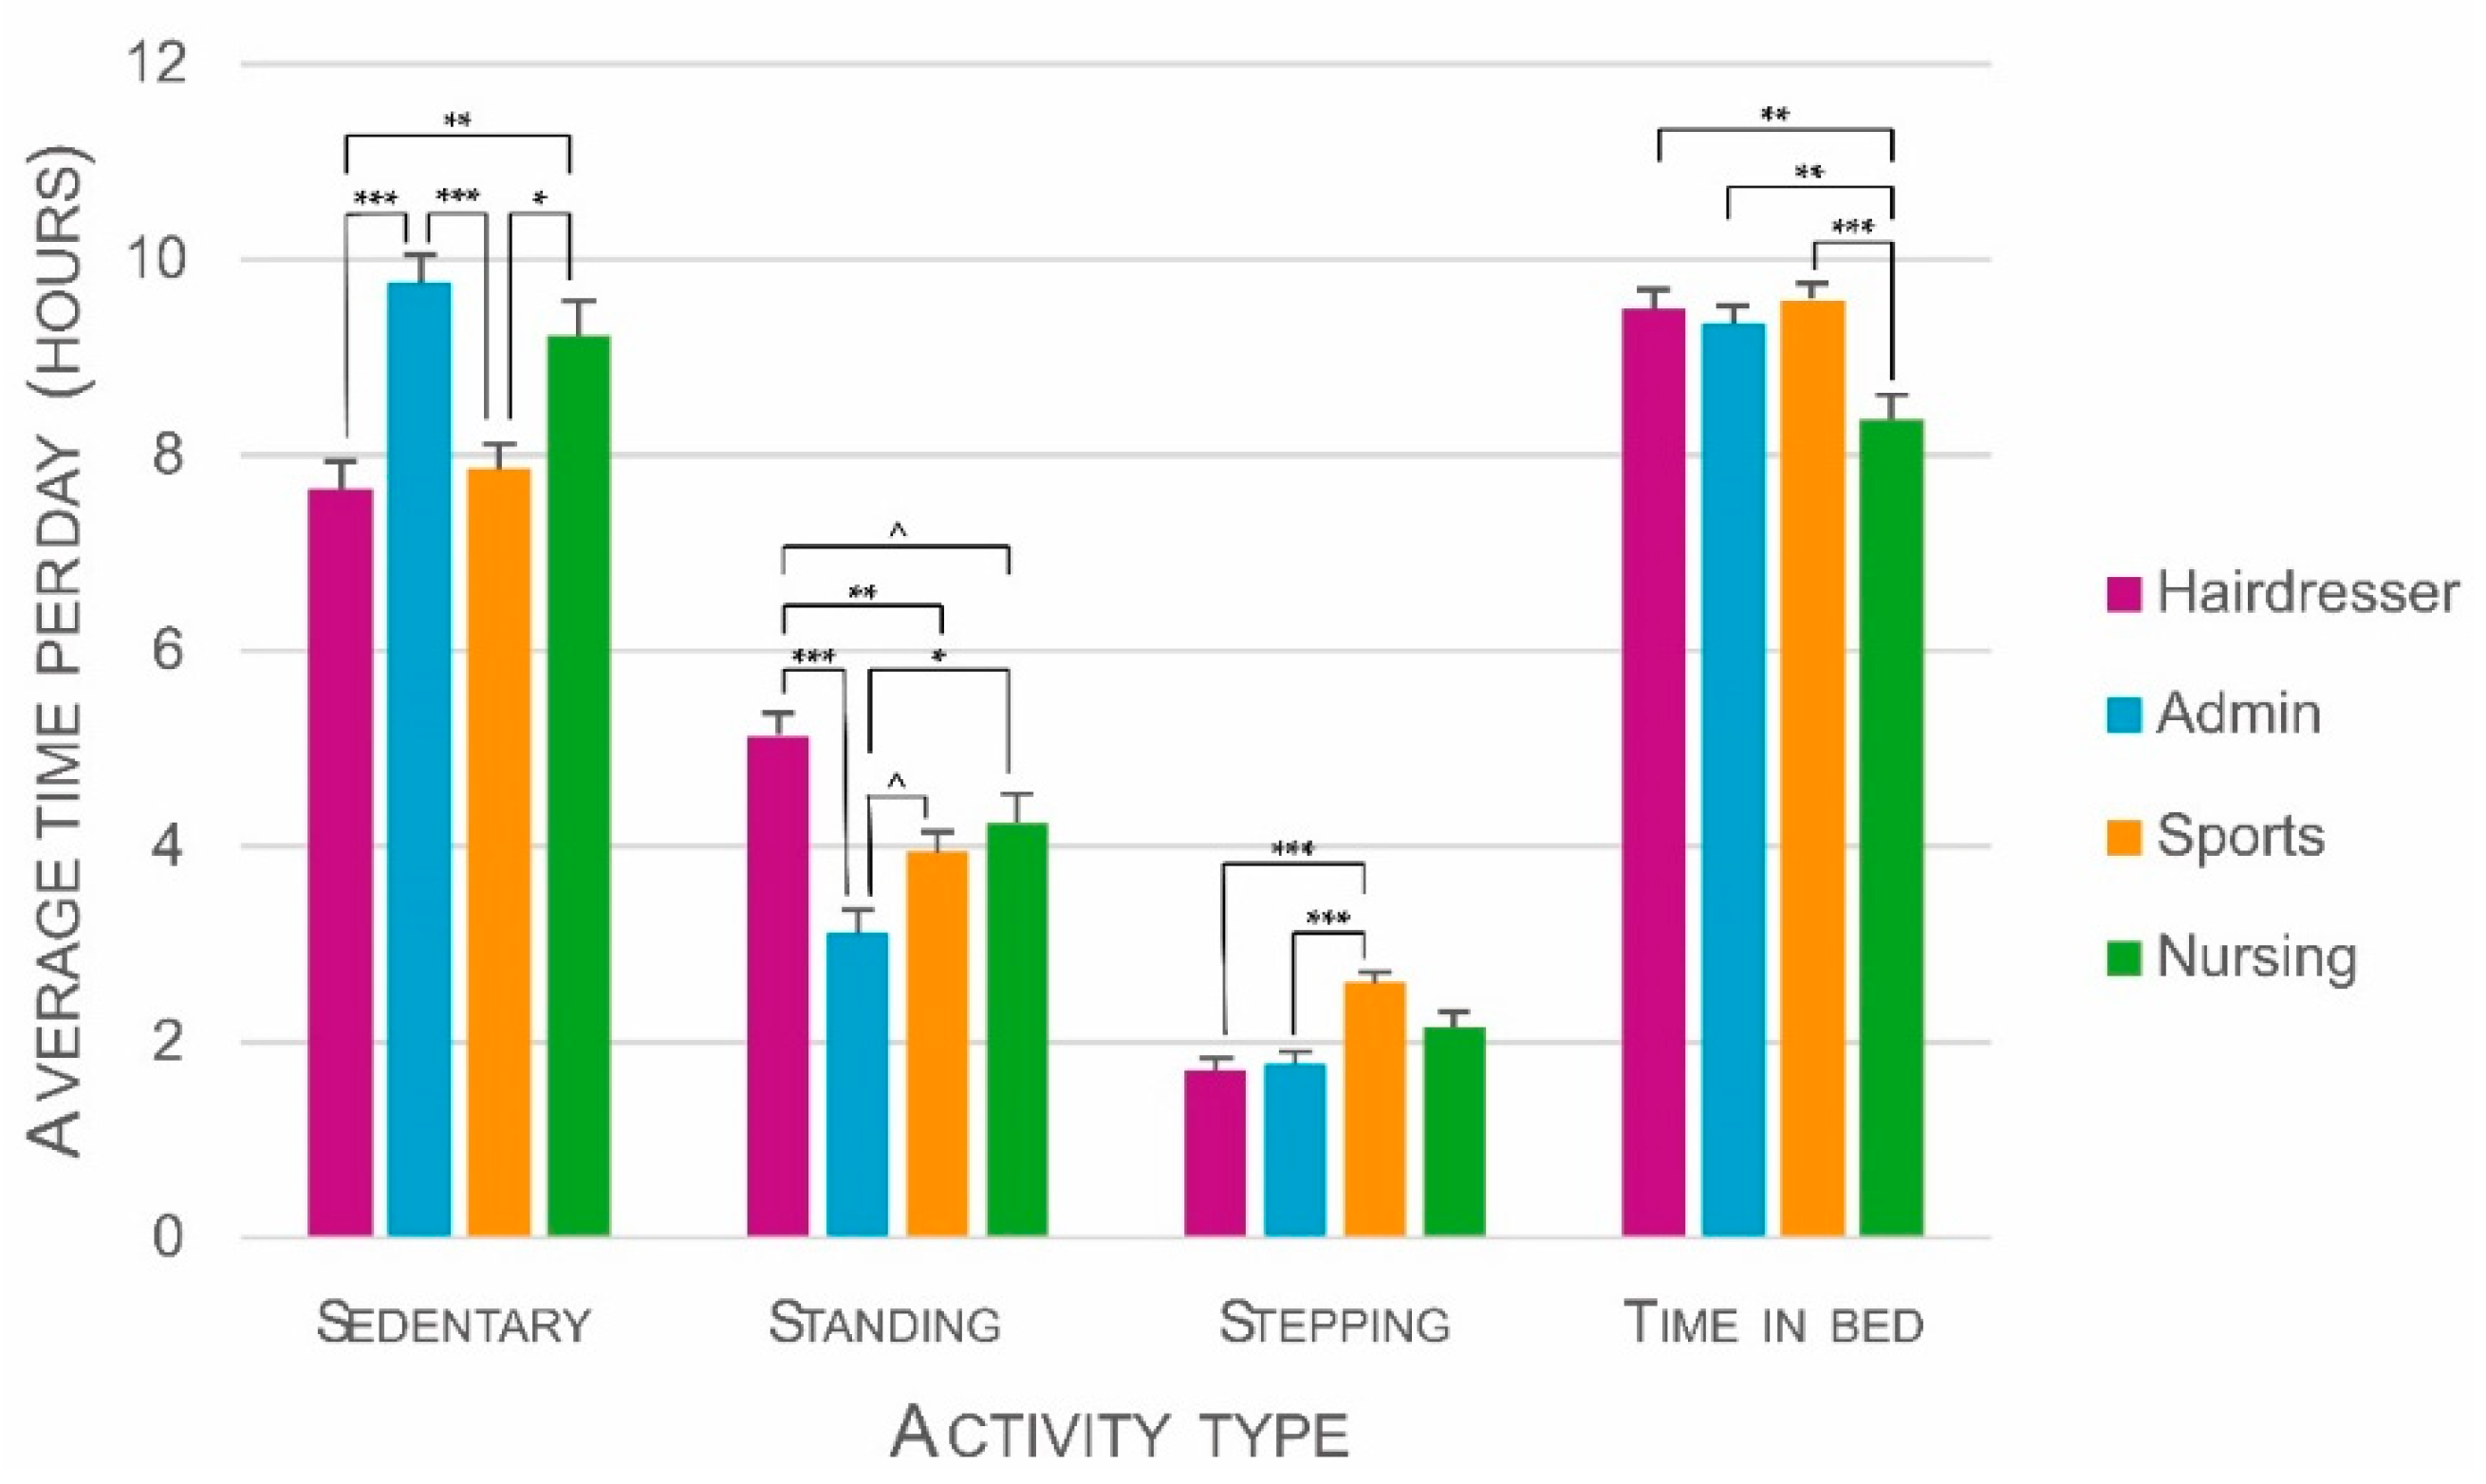
3.2. PAB in VET and Difference between Educational Tracks
3.2.1. Sedentary Time
3.2.2. Standing Time
3.2.3. Stepping Time (All Movement)
3.2.4. Time in Bed
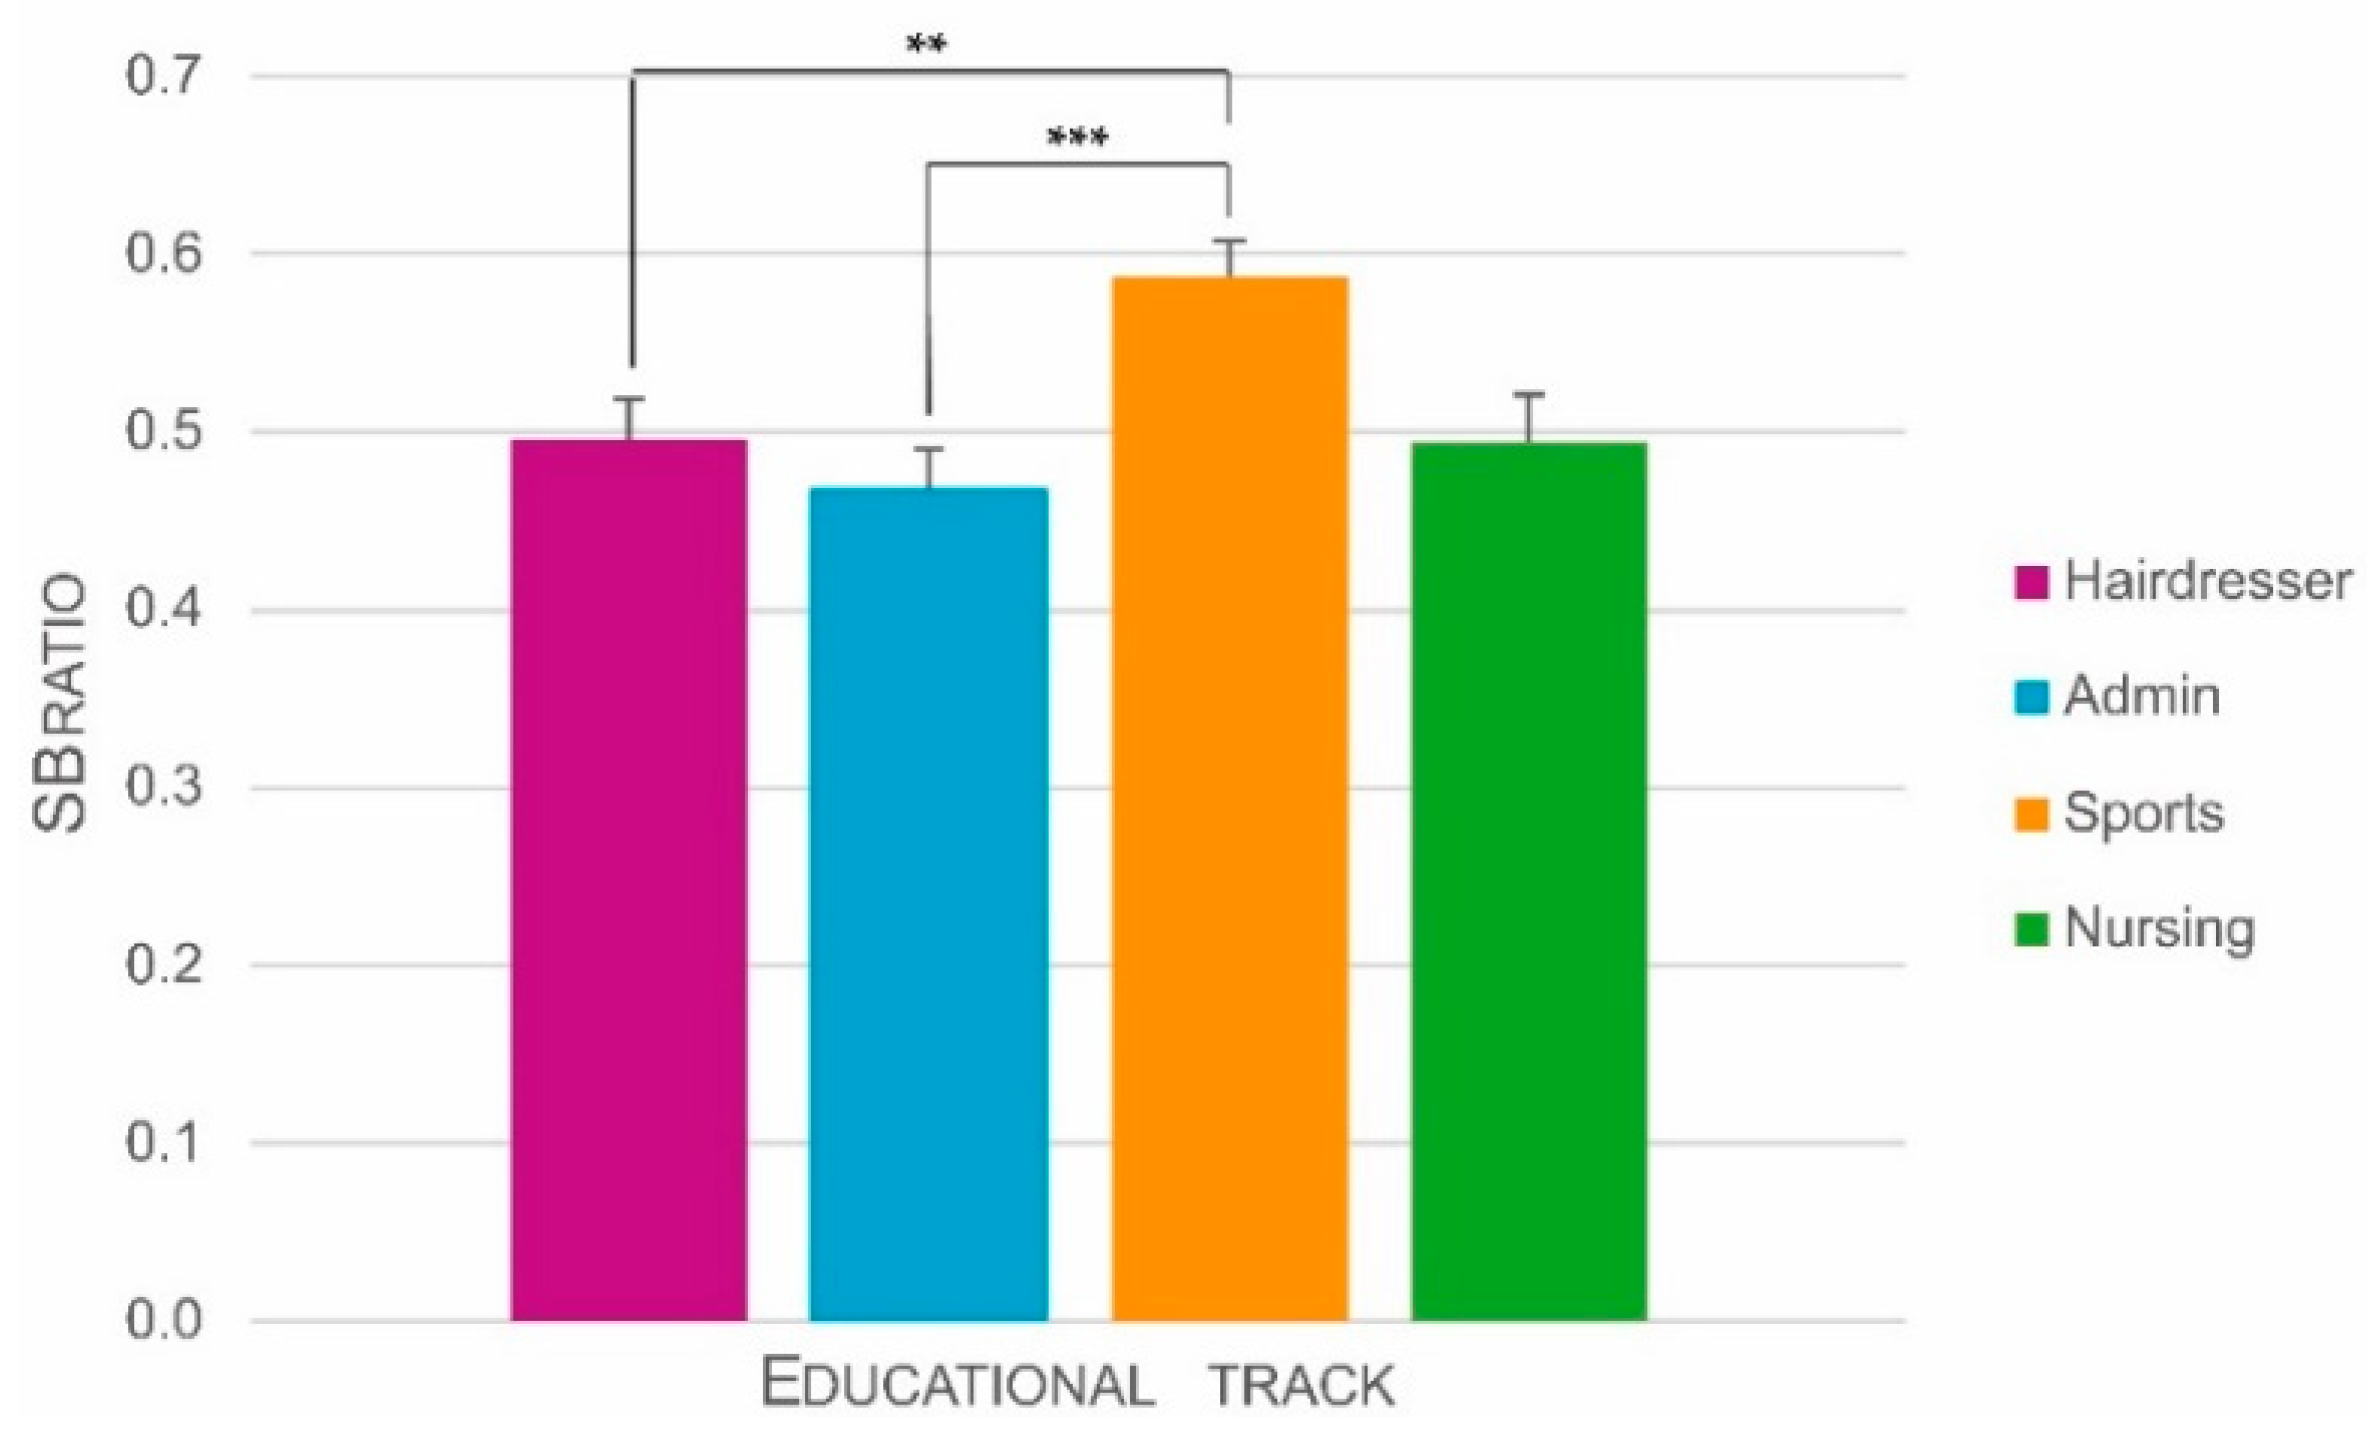
3.2.5. SB-Ratio
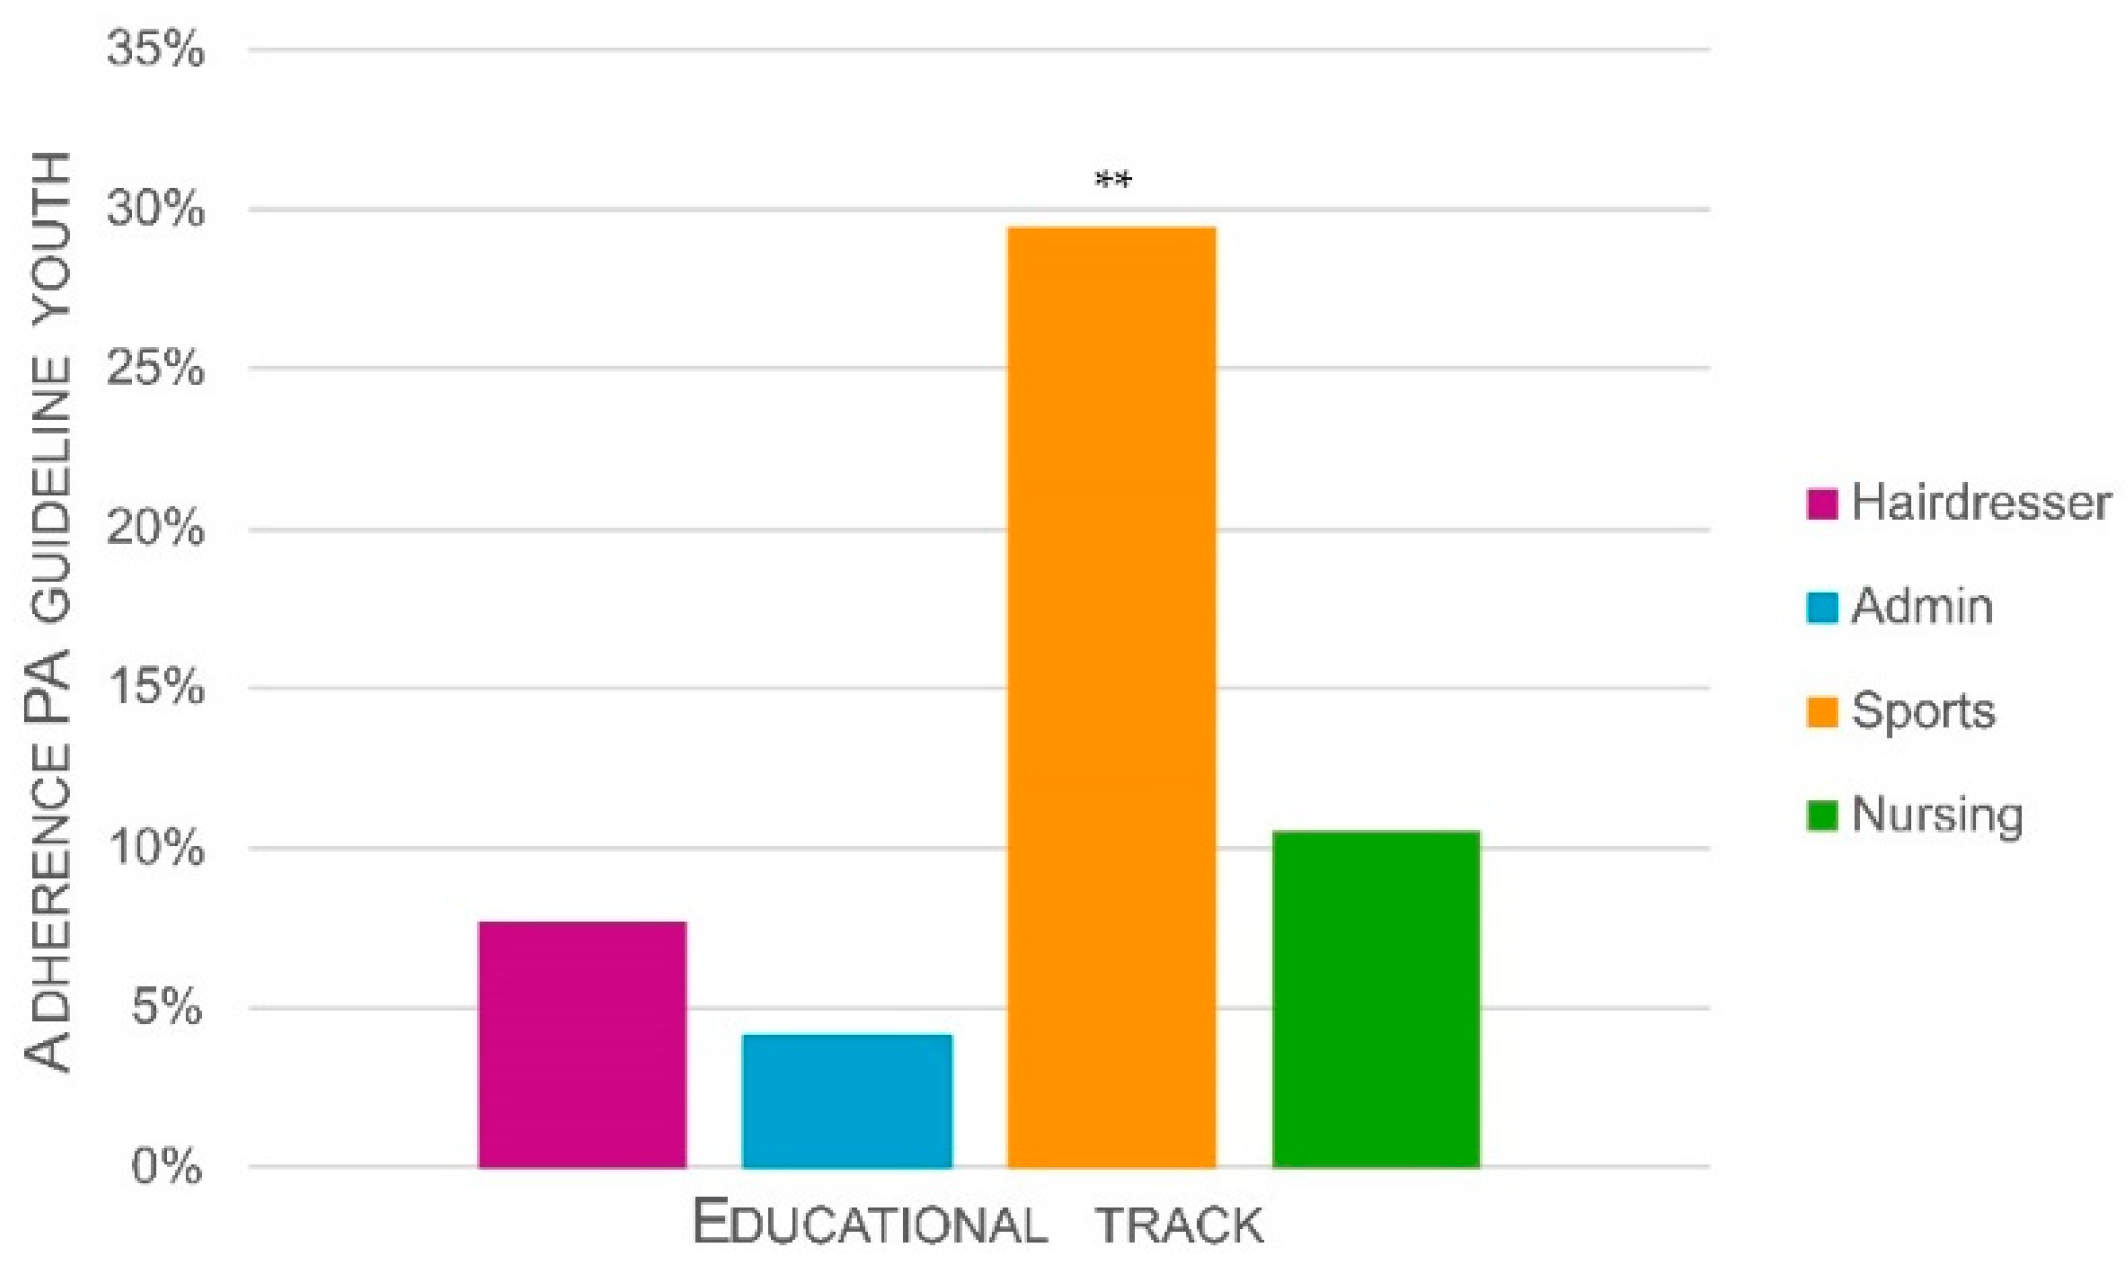
3.2.6. Adherence to PA Guidelines
3.3. PAB and Cognitive Performance
3.4. Covariate Analyses
4. Discussion
4.1. Differences in PA between VET Students from Various Educational Tracks
4.2. PAB and Cognitive Performance
4.3. Strengths and Limitations
5. Conclusions
Author Contributions
Funding
Institutional Review Board Statement
Informed Consent Statement
Data Availability Statement
Acknowledgments
Conflicts of Interest
References
- Warburton, D.E.R.; Bredin, S.S.D. Health benefits of physical activity: A systematic review of current systematic reviews. Curr. Opin. Cardiol. 2017, 32, 541–556. [Google Scholar] [CrossRef] [PubMed]
- Kumar, B.; Robinson, R.; Till, S. Physical activity and health in adolescence. Clin. Med. 2015, 15, 267–272. [Google Scholar] [CrossRef] [PubMed]
- Chaput, J.-P.; Willumsen, J.; Bull, F.; Chou, R.; Ekelund, U.; Firth, J.; Jago, R.; Ortega, F.B.; Katzmarzyk, P.T. 2020 WHO guidelines on physical activity and sedentary behaviour for children and adolescents aged 5–17 years: Summary of the evidence. Int. J. Behav. Nutr. Phys. Act. 2020, 17, 1–9. [Google Scholar] [CrossRef] [PubMed]
- Burkhalter, T.M.; Hillman, C.H. A Narrative Review of Physical Activity, Nutrition, and Obesity to Cognition and Scholastic Performance across the Human Lifespan. Adv. Nutr. 2011, 2, 201S–206S. [Google Scholar] [CrossRef] [PubMed]
- Donnelly, J.E.; Hillman, C.H.; Castelli, D.; Etnier, J.L.; Lee, S.; Tomporowski, P.; Lambourne, K.; Szabo-Reed, A.N. Physical Activity, Fitness, Cognitive Function, and Academic Achievement in Children. Med. Sci. Sports Exerc. 2016, 48, 1197–1222. [Google Scholar] [CrossRef]
- Fedewa, A.L.; Ahn, S. The Effects of Physical Activity and Physical Fitness on Children’s Achievement and Cognitive Outcomes. Res. Q. Exerc. Sport 2011, 82, 521–535. [Google Scholar] [CrossRef]
- Singh, A.S.; Saliasi, E.; Berg, V.V.D.; Uijtdewilligen, L.; De Groot, R.H.M.; Jolles, J.; Andersen, L.B.; Bailey, R.; Chang, Y.-K.; Diamond, A.; et al. Effects of physical activity interventions on cognitive and academic performance in children and adolescents: A novel combination of a systematic review and recommendations from an expert panel. Br. J. Sports Med. 2019, 53, 640–647. [Google Scholar] [CrossRef] [PubMed]
- Erickson, K.I.; Hillman, C.; Stillman, C.M.; Ballard, R.M.; Bloodgood, B.; Conroy, D.E.; Macko, R.; Marquez, D.X.; Petruzzello, S.J.; Powell, K.E. Physical Activity, Cognition, and Brain Outcomes: A Review of the 2018 Physical Activity Guidelines. Med. Sci. Sports Exerc. 2019, 51, 1242–1251. [Google Scholar] [CrossRef]
- Katzmarzyk, P.T.; Powell, K.E.; Jakicic, J.M.; Troiano, R.P.; Piercy, K.; Tennant, B. Sedentary Behavior and Health: Update from the 2018 Physical Activity Guidelines Advisory Committee. Med. Sci. Sports Exerc. 2019, 51, 1227–1241. [Google Scholar] [CrossRef]
- Lee, I.-M.; Shiroma, E.J.; Lobelo, F.; Puska, P.; Blair, S.N.; Katzmarzyk, P.T. Effect of physical inactivity on major non-communicable diseases worldwide: An analysis of burden of disease and life expectancy. Lancet 2012, 380, 219–229. [Google Scholar] [CrossRef]
- Falck, R.S.; Davis, J.C.; Liu-Ambrose, T. What is the association between sedentary behaviour and cognitive function? A systematic review. Br. J. Sports Med. 2017, 51, 800–811. [Google Scholar] [CrossRef]
- Carson, V.; Hunter, S.; Kuzik, N.; Gray, C.E.; Poitras, V.J.; Chaput, J.-P.; Saunders, T.J.; Katzmarzyk, P.T.; Okely, A.D.; Gorber, S.C.; et al. Systematic review of sedentary behaviour and health indicators in school-aged children and youth: An update. Appl. Physiol. Nutr. Metab. 2016, 41, S240–S265. [Google Scholar] [CrossRef]
- Tremblay, M.S.; LeBlanc, A.G.; Kho, M.E.; Saunders, T.J.; Larouche, R.; Colley, R.C.; Goldfield, G.; Gorber, S.C. Systematic review of sedentary behaviour and health indicators in school-aged children and youth. Int. J. Behav. Nutr. Phys. Act. 2011, 8, 98. [Google Scholar] [CrossRef]
- Cliff, D.P.; Hesketh, K.D.; Vella, S.A.; Hinkley, T.; Tsiros, M.D.; Ridgers, N.D.; Carver, A.; Veitch, J.; Parrish, A.-M.; Hardy, L.L.; et al. Objectively measured sedentary behaviour and health and development in children and adolescents: Systematic review and meta-analysis. Obes. Rev. 2016, 17, 330–344. [Google Scholar] [CrossRef]
- Haug, S.; Schaub, M.P.; Gross, C.S.; John, U.; Meyer, C. Predictors of hazardous drinking, tobacco smoking and physical inactivity in vocational school students. BMC Public Health 2013, 13, 475. [Google Scholar] [CrossRef] [PubMed]
- Li, J.W.; O’Connor, H.; O’Dwyer, N.; Orr, R. The effect of acute and chronic exercise on cognitive function and academic performance in adolescents: A systematic review. J. Sci. Med. Sport 2017, 20, 841–848. [Google Scholar] [CrossRef] [PubMed]
- Poitras, V.J.; Gray, C.E.; Borghese, M.M.; Carson, V.; Chaput, J.-P.; Janssen, I.; Katzmarzyk, P.T.; Pate, R.R.; Gorber, S.C.; Kho, M.E.; et al. Systematic review of the relationships between objectively measured physical activity and health indicators in school-aged children and youth. Appl. Physiol. Nutr. Metab. 2016, 41, S197–S239. [Google Scholar] [CrossRef] [PubMed]
- CBS. Available online: https://opendata.cbs.nl/statline/#/CBS/nl/dataset/84645NED/table?ts=1594391644164 (accessed on 10 July 2020).
- Bonevski, B.; Guillaumier, A.; Paul, C.; Walsh, R. The vocational education setting for health promotion: A survey of students’ health risk behaviours and preferences for help. Health Promot. J. Aust. 2013, 24, 185–191. [Google Scholar] [CrossRef] [PubMed]
- Loucaides, C.A.; Jago, R.; Theophanous, M. Physical activity and sedentary behaviours in Greek-Cypriot children and adolescents: A cross-sectional study. Int. J. Behav. Nutr. Phys. Act. 2011, 8, 90. [Google Scholar] [CrossRef]
- Virtanen, J.I.; Muikku, T.; Similä, T.; Cinar, A.B.; Pohjola, V. Physical activity, BMI and oral health behaviour among adolescents: Finnish School Health Promotion Study. Eur. J. Public Health 2018, 29, 296–302. [Google Scholar] [CrossRef]
- Bernaards, C.M.; van Buuren, S. Rapportage Veranderingen in Het Beweeggedrag Van Mbo Studenten; [Report on Changes in Physical Activity Behavior of VET Students]; TNO: Leiden, The Netherland, 2012. [Google Scholar]
- Heino, M.T.J.; Knittle, K.; Fried, E.; Sund, R.; Haukkala, A.; Borodulin, K.; Uutela, A.; Araujo-Soares, V.; Vasankari, T.; Hankonen, N. Visualisation and network analysis of physical activity and its determinants: Demonstrating opportunities in analysing baseline associations in the Let’s Move It trial. Health Psychol. Behav. Med. 2019, 7, 269–289. [Google Scholar] [CrossRef]
- Carl, J.; Grüne, E.; Popp, J.; Pfeifer, K. Physical Activity Promotion for Apprentices in Nursing Care and Automotive Mechatronics–Competence Counts More than Volume. Int. J. Environ. Res. Public Health 2020, 17, 793. [Google Scholar] [CrossRef]
- Heradstveit, O.; Haugland, S.; Hysing, M.; Stormark, K.M.; Sivertsen, B.; Bøe, T. Physical inactivity, non-participation in sports and socioeconomic status: A large population-based study among Norwegian adolescents. BMC Public Health 2020, 20, 1–9. [Google Scholar] [CrossRef]
- Rijpstra, A.; Bernaards, C. De Leefstijl Van Mbo Studenten in Nederland 2009/2010; TNO: Leiden, The Netherlands, 2012. [Google Scholar]
- Hinckson, E.; Salmon, J.; Benden, M.; Clemes, S.A.; Sudholz, B.; Barber, S.E.; Aminian, S.; Ridgers, N.D. Standing Classrooms: Research and Lessons Learned from Around the World. Sports Med. 2015, 46, 977–987. [Google Scholar] [CrossRef]
- Ludyga, S.; Schilling, R.; Colledge, F.; Brand, S.; Pühse, U.; Gerber, M. Association between cardiorespiratory fitness and social cognition in healthy adults. Scand. J. Med. Sci. Sports 2020, 30, 1722–1728. [Google Scholar] [CrossRef]
- Cox, E.P.; O’Dwyer, N.; Cook, R.; Vetter, M.; Cheng, H.L.; Rooney, K.; O’Connor, H. Relationship between physical activity and cognitive function in apparently healthy young to middle-aged adults: A systematic review. J. Sci. Med. Sport 2016, 19, 616–628. [Google Scholar] [CrossRef]
- Diamond, A. Executive Functions. Annu. Rev. Psychol. 2013, 64, 135–168. [Google Scholar] [CrossRef]
- Xue, Y.; Yang, Y.; Huang, T. Effects of chronic exercise interventions on executive function among children and adolescents: A systematic review with meta-analysis. Br. J. Sports Med. 2019, 53, 1397–1404. [Google Scholar] [CrossRef]
- Zeng, X.; Cai, L.; Wong, S.H.-S.; Lai, L.; Lv, Y.; Tan, W.; Jing, J.; Chen, Y. Association of Sedentary Time and Physical Activity With Executive Function Among Children. Acad. Pediatr. 2021, 21, 63–69. [Google Scholar] [CrossRef]
- DANS: Open Universiteit (NL). 2018. Available online: https://doi.org/10.17026/dans-xwa-g7cx (accessed on 18 June 2018).
- Sellers, C.; Dall, P.; Grant, M.; Stansfield, B. Validity and reliability of the activPAL3 for measuring posture and stepping in adults and young people. Gait Posture 2016, 43, 42–47. [Google Scholar] [CrossRef]
- Grant, P.M.; Ryan, C.G.; Tigbe, W.; Granat, M.H. The validation of a novel activity monitor in the measurement of posture and motion during everyday activities. Br. J. Sports Med. 2006, 40, 992–997. [Google Scholar] [CrossRef]
- Edwardson, C.L.; Ette, S. ProcessingPAL 2019. Available online: https://github.com/UOL-COLS/ProcessingPAL/releases/tag/V1.2 (accessed on 18 January 2021).
- Trost, S.G.; Mciver, K.L.; Pate, R.R. Conducting Accelerometer-Based Activity Assessments in Field-Based Research. Med. Sci. Sports Exerc. 2005, 37, S531–S543. [Google Scholar] [CrossRef]
- Rutten, G.M.; Savelberg, H.H.; Biddle, S.J.; Kremers, S.P. Interrupting long periods of sitting: Good STUFF. Int. J. Behav. Nutr. Phys. Act. 2013, 10, 1. [Google Scholar] [CrossRef] [PubMed]
- Gezondheidsraad [Health Council of the Netherlands]. Kernadvies Beweegrichtlijnen 2017; Key Advice Ovement Guidelines 2017; Gezondheidsraad: Den Haag, The Netherlands, 2017. [Google Scholar]
- Harrington, D.M.; Dowd, K.P.; Tudor-Locke, C.; Donnelly, A.E. A Steps/Minute Value for Moderate Intensity Physical Activity in Adolescent Females. Pediatr. Exerc. Sci. 2012, 24, 399–408. [Google Scholar] [CrossRef]
- Edwardson, C.L.; Henson, J.; Biddle, S.J.H.; Davies, M.J.; Khunti, K.; Maylor, B.; Yates, T. activPAL and ActiGraph Assessed Sedentary Behavior and Cardiometabolic Health Markers. Med. Sci. Sports Exerc. 2020, 52, 391–397. [Google Scholar] [CrossRef]
- Ministerie van Onderwijs Cultuur en Wetenschap [Ministry of Education Culture and Science] Aantal Studenten in Het Mbo [Number of Students in VET]. Available online: https://www.onderwijsincijfers.nl/kengetallen/mbo/studenten-mbo/aantallen-studenten-mbo (accessed on 20 October 2020).
- Miyake, A.; Friedman, N.P.; Emerson, M.J.; Witzki, A.H.; Howerter, A.; Wager, T.D. The Unity and Diversity of Executive Functions and Their Contributions to Complex “Frontal Lobe” Tasks: A Latent Variable Analysis. Cogn. Psychol. 2000, 41, 49–100. [Google Scholar] [CrossRef]
- Miyake, A.; Emerson, M.J.; Padilla, F.; Ahn, J.-C. Inner speech as a retrieval aid for task goals: The effects of cue type and articulatory suppression in the random task cuing paradigm. Acta Psychol. 2004, 115, 123–142. [Google Scholar] [CrossRef]
- Miyake, A.; Friedman, N.P. The Nature and Organization of Individual Differences in Executive Functions. Curr. Dir. Psychol. Sci. 2012, 21, 8–14. [Google Scholar] [CrossRef]
- Woods, D.L.; Wyma, J.M.; Yund, E.W.; Herron, T.J.; Reed, B. Factors influencing the latency of simple reaction time. Front. Hum. Neurosci. 2015, 9, 131. [Google Scholar] [CrossRef]
- Cohen, J. A power primer. Psychol. Bull. 1992, 112, 155–159. [Google Scholar] [CrossRef]
- Núñez-Rocha, G.M.; López-Botello, C.K.; Salinas-Martínez, A.M.; Arroyo-Acevedo, H.V.; Martínez-Villarreal, R.T.; Ávila-Ortiz, M.N. Lifestyle, Quality of Life, and Health Promotion Needs in Mexican University Students: Important Differences by Sex and Academic Discipline. Int. J. Environ. Res. Public Health 2020, 17, 8024. [Google Scholar] [CrossRef]
- Acebes-Sánchez, J.; Diez-Vega, I.; Rodriguez-Romo, G.; Sánchez, A.; Vega, D.; Romo, R. Physical Activity among Spanish Undergraduate Students: A Descriptive Correlational Study. Int. J. Environ. Res. Public Health 2019, 16, 2770. [Google Scholar] [CrossRef] [PubMed]
- Grüne, E.; Popp, J.; Carl, J.; Pfeifer, K. What do we know about physical activity interventions in vocational education and training? A systematic review. BMC Public Health 2020, 20, 1–12. [Google Scholar] [CrossRef] [PubMed]
- Chim, H.Q.; Egbrink, M.G.A.O.; Van Gerven, P.W.M.; De Groot, R.H.M.; Winkens, B.; Savelberg, H.H.C.M. Academic Schedule and Day-to-Day Variations in Sedentary Behavior and Physical Activity of University Students. Int. J. Environ. Res. Public Health 2020, 17, 2810. [Google Scholar] [CrossRef]
- Agans, J.P.; Wilson, O.W.; Bopp, M. Required Health and Wellness Courses: Associations With College Student Physical Activity Behavior and Attitudes. J. Phys. Act. Health 2020, 17, 632–640. [Google Scholar] [CrossRef]
- Gay, J.L.; Buchner, D.M.; Smith, J.; He, C. An examination of compensation effects in accelerometer-measured occupational and non-occupational physical activity. Prev. Med. Rep. 2017, 8, 55–59. [Google Scholar] [CrossRef]
- Vandelanotte, C.; Short, C.; Rockloff, M.; Di Millia, L.; Ronan, K.; Happell, B.; Duncan, M.J. How Do Different Occupational Factors Influence Total, Occupational, and Leisure-Time Physical Activity? J. Phys. Act. Health 2015, 12, 200–207. [Google Scholar] [CrossRef]
- Kruger, J.; Yore, M.M.; Ainsworth, B.E.; Macera, C.A. Is Participation in Occupational Physical Activity Associated with Lifestyle Physical Activity Levels? J. Occup. Environ. Med. 2006, 48, 1143–1148. [Google Scholar] [CrossRef]
- Prince, S.A.; Elliott, C.G.; Scott, K.; Visintini, S.; Reed, J.L. Device-measured physical activity, sedentary behaviour and cardiometabolic health and fitness across occupational groups: A systematic review and meta-analysis. Int. J. Behav. Nutr. Phys. Act. 2019, 16, 1–15. [Google Scholar] [CrossRef]
- Telama, R.; Yang, X.; Viikari, J.; Välimäki, I.; Wanne, O.; Raitakari, O. Physical activity from childhood to adulthood. Am. J. Prev. Med. 2005, 28, 267–273. [Google Scholar] [CrossRef]
- Ross, R.; Chaput, J.-P.; Giangregorio, L.M.; Janssen, I.; Saunders, T.J.; Kho, M.E.; Poitras, V.J.; Tomasone, J.R.; El-Kotob, R.; McLaughlin, E.C.; et al. Canadian 24-Hour Movement Guidelines for Adults aged 18–64 years and Adults aged 65 years or older: An integration of physical activity, sedentary behaviour, and sleep. Appl. Physiol. Nutr. Metab. 2020, 45, S57–S102. [Google Scholar] [CrossRef]
- Sherry, A.P.; Pearson, N.; Clemes, S.A. The effects of standing desks within the school classroom: A systematic review. Prev. Med. Rep. 2016, 3, 338–347. [Google Scholar] [CrossRef] [PubMed]
- Minges, K.E.; Chao, A.M.; Irwin, M.L.; Owen, N.; Park, C.; Whittemore, R.; Salmon, J. Classroom Standing Desks and Sedentary Behavior: A Systematic Review. Pediatry 2016, 137, e20153087. [Google Scholar] [CrossRef]
- Gogtay, N.; Giedd, J.N.; Lusk, L.; Hayashi, K.M.; Greenstein, D.; Vaituzis, A.C.; Nugent, T.F.; Herman, D.H.; Clasen, L.S.; Toga, A.W.; et al. Dynamic mapping of human cortical development during childhood through early adulthood. Proc. Natl. Acad. Sci. USA 2004, 101, 8174–8179. [Google Scholar] [CrossRef] [PubMed]
- Hillman, C.H.; Erickson, K.I.; Kramer, A.F. Be smart, exercise your heart: Exercise effects on brain and cognition. Nat. Rev. Neurosci. 2008, 9, 58–65. [Google Scholar] [CrossRef]
- Chim, H.Q.; Gijselaers, H.J.M.; de Groot, R.H.M.; Van Gerven, P.W.M.; oude Egbrink, M.G.A.; Savelberg, H.H.C.M. The effects of light-intensity physical activity on learning in adolescents: A systematic review. Int. Rev. Sport Exerc. Psychol.
- Bojsen-Møller, E.; Boraxbekk, C.-J.; Ekblom, Ö.; Blom, V.; Ekblom, M.M. Relationships between Physical Activity, Sedentary Behaviour and Cognitive Functions in Office Workers. Int. J. Environ. Res. Public Health 2019, 16, 4721. [Google Scholar] [CrossRef] [PubMed]
- Coelho, L.; Hauck, K.; McKenzie, K.; Copeland, J.L.; Kan, I.P.; Gibb, R.L.; Gonzalez, C.L.R. The association between sedentary behavior and cognitive ability in older adults. Aging Clin. Exp. Res. 2020, 32, 2339–2347. [Google Scholar] [CrossRef]
- Wickel, E.E.; Howie, E.K. Prospective bi-directional associations between sedentary time and physical activity with cognitive performance: A cohort study. J. Sports Sci. 2018, 37, 630–637. [Google Scholar] [CrossRef] [PubMed]
- Ekblom, M.M.; Örjan, B.; Börjesson, M.; Bergström, G.; Jern, C.; Wallin, A. Device-Measured Sedentary Behavior, Physical Activity and Aerobic Fitness Are Independent Correlates of Cognitive Performance in Healthy Middle-Aged Adults—Results from the SCAPIS Pilot Study. Int. J. Environ. Res. Public Health 2019, 16, 5136. [Google Scholar] [CrossRef]
- Syväoja, H.J.; Kantomaa, M.T.; Ahonen, T.; Hakonen, H.; Kankaanpää, A.; Tammelin, T.H. Physical Activity, Sedentary Behavior, and Academic Performance in Finnish Children. Med. Sci. Sports Exerc. 2013, 45, 2098–2104. [Google Scholar] [CrossRef] [PubMed]
- Shi, Y.; Huang, W.Y.; Yu, J.J.; Sheridan, S.; Sit, C.H.-P.; Wong, S.H.-S. Compliance and Practical Utility of Continuous Wearing of activPAL™ in Adolescents. Pediatr. Exerc. Sci. 2019, 31, 363–369. [Google Scholar] [CrossRef] [PubMed]
- Edwardson, C.L.; Winkler, E.A.; Bodicoat, D.H.; Yates, T.; Davies, M.J.; Dunstan, D.W.; Healy, G.N. Considerations when using the activPAL monitor in field-based research with adult populations. J. Sport Health Sci. 2017, 6, 162–178. [Google Scholar] [CrossRef] [PubMed]


| Characteristics 1 | Total Group (n = 103) | Hairdresser (n = 26) | Admin (n = 24) | Sports (n = 34) | Nursing (n = 19) | p-Value | Post-Hoc Comparison 2 |
|---|---|---|---|---|---|---|---|
| Mean age (SD) | 19.2 (3.2) | 19.5 (2.3) | 18.6 (2.5) | 17.6 (0.6) | 22.6 (4.9) | <0.001 | H, A, S < N; H > S |
| Female gender (%) | 71 (68.9%) | 26 (100%) | 16 (66.7%) | 13 (38.2%) | 16 (84.2%) | <0.001 | H > A, N; S < A, N |
| Mean BMI (SD) | 22.9 (3.5) | 21.8 (3.7) | 23.8 (4.0) | 22.7 (2.3) | 23.4 (4.0) | 0.22 | - |
| Mean fat percentage (SD) | 27.6 (9.1) | 30.9 (7.2) | 29.0 (9.9) | 22.5 (7.3) | 30.7 (9.7) | <0.001 | H, A, N > S |
| Mean muscle mass percentage (SD) | 32.0 (6.4) | 28.3 (2.4) | 31.1 (7.0) | 36.4 (6.0) | 30.1 (6.0) | <0.001 | H, A, N < S |
| Mean visceral fat score (SD) | 4.0 (1.9) | 3.4 (1.2) | 4.6 (1.7) | 4.9 (1.4) | 4.1 (2.6) | 0.11 | - |
| Difference per Activity Type | Effect Size | 95% CI 1 | p-Value |
|---|---|---|---|
| Sedentary time | |||
| Hairdresser < Admin | −1.59 | −2.25–−0.93 | <0.001 |
| Hairdresser < Nursing | −1.19 | −1.88–−0.50 | 0.004 |
| Sports < Admin | −1.43 | −2.04–−0.82 | <0.001 |
| Sports < Nursing | −1.03 | −1.77–−0.29 | 0.036 |
| Standing time | |||
| Hairdresser > Admin | 1.87 | 1.20–2.54 | <0.001 |
| Hairdresser > Sports | 1.11 | 0.46–1.75 | 0.004 |
| Hairdresser > Nursing | 0.83 | 0.15–1.50 | 0.09 |
| Sports > Admin | 0.76 | 0.18–1.34 | 0.06 |
| Nursing > Admin | 1.04 | 0.32–1.76 | 0.03 |
| Stepping time | |||
| Sports > Hairdresser | 1.51 | 0.85–2.17 | <0.001 |
| Sports > Admin | 1.41 | 0.80–2.01 | <0.001 |
| Time in bed | |||
| Nursing < Hairdresser | −1.26 | −1.95–−0.57 | 0.002 |
| Nursing < Admin | −1.08 | −1.81–−0.37 | 0.02 |
| Nursing < Sports | −1.36 | −2.11–−0.61 | 0.002 |
| Inhibition (n = 82) | Shifting (n = 82) | Updating (n = 70) | |
|---|---|---|---|
| Sitting | 0.032 | −0.055 | 0.144 |
| Standing | 0.018 | 0.138 | −0.147 |
| Stepping | −0.060 | 0.122 | 0.034 |
Publisher’s Note: MDPI stays neutral with regard to jurisdictional claims in published maps and institutional affiliations. |
© 2021 by the authors. Licensee MDPI, Basel, Switzerland. This article is an open access article distributed under the terms and conditions of the Creative Commons Attribution (CC BY) license (http://creativecommons.org/licenses/by/4.0/).
Share and Cite
Golsteijn, R.H.J.; Gijselaers, H.J.M.; Savelberg, H.H.C.M.; Singh, A.S.; de Groot, R.H.M. Differences in Habitual Physical Activity Behavior between Students from Different Vocational Education Tracks and the Association with Cognitive Performance. Int. J. Environ. Res. Public Health 2021, 18, 3031. https://doi.org/10.3390/ijerph18063031
Golsteijn RHJ, Gijselaers HJM, Savelberg HHCM, Singh AS, de Groot RHM. Differences in Habitual Physical Activity Behavior between Students from Different Vocational Education Tracks and the Association with Cognitive Performance. International Journal of Environmental Research and Public Health. 2021; 18(6):3031. https://doi.org/10.3390/ijerph18063031
Chicago/Turabian StyleGolsteijn, Rianne H. J., Hieronymus J. M. Gijselaers, Hans H. C. M. Savelberg, Amika S. Singh, and Renate H. M. de Groot. 2021. "Differences in Habitual Physical Activity Behavior between Students from Different Vocational Education Tracks and the Association with Cognitive Performance" International Journal of Environmental Research and Public Health 18, no. 6: 3031. https://doi.org/10.3390/ijerph18063031
APA StyleGolsteijn, R. H. J., Gijselaers, H. J. M., Savelberg, H. H. C. M., Singh, A. S., & de Groot, R. H. M. (2021). Differences in Habitual Physical Activity Behavior between Students from Different Vocational Education Tracks and the Association with Cognitive Performance. International Journal of Environmental Research and Public Health, 18(6), 3031. https://doi.org/10.3390/ijerph18063031