
Time for ‘Green’ during COVID-19? Inequities in Green and Blue Space Access, Visitation and Felt Benefits


Abstract
1. Introduction
2. Method
2.1. Data
2.2. Green Space Access, Visitation and Felt Benefits
2.3. Covariates
2.4. Statistical Analysis
3. Results
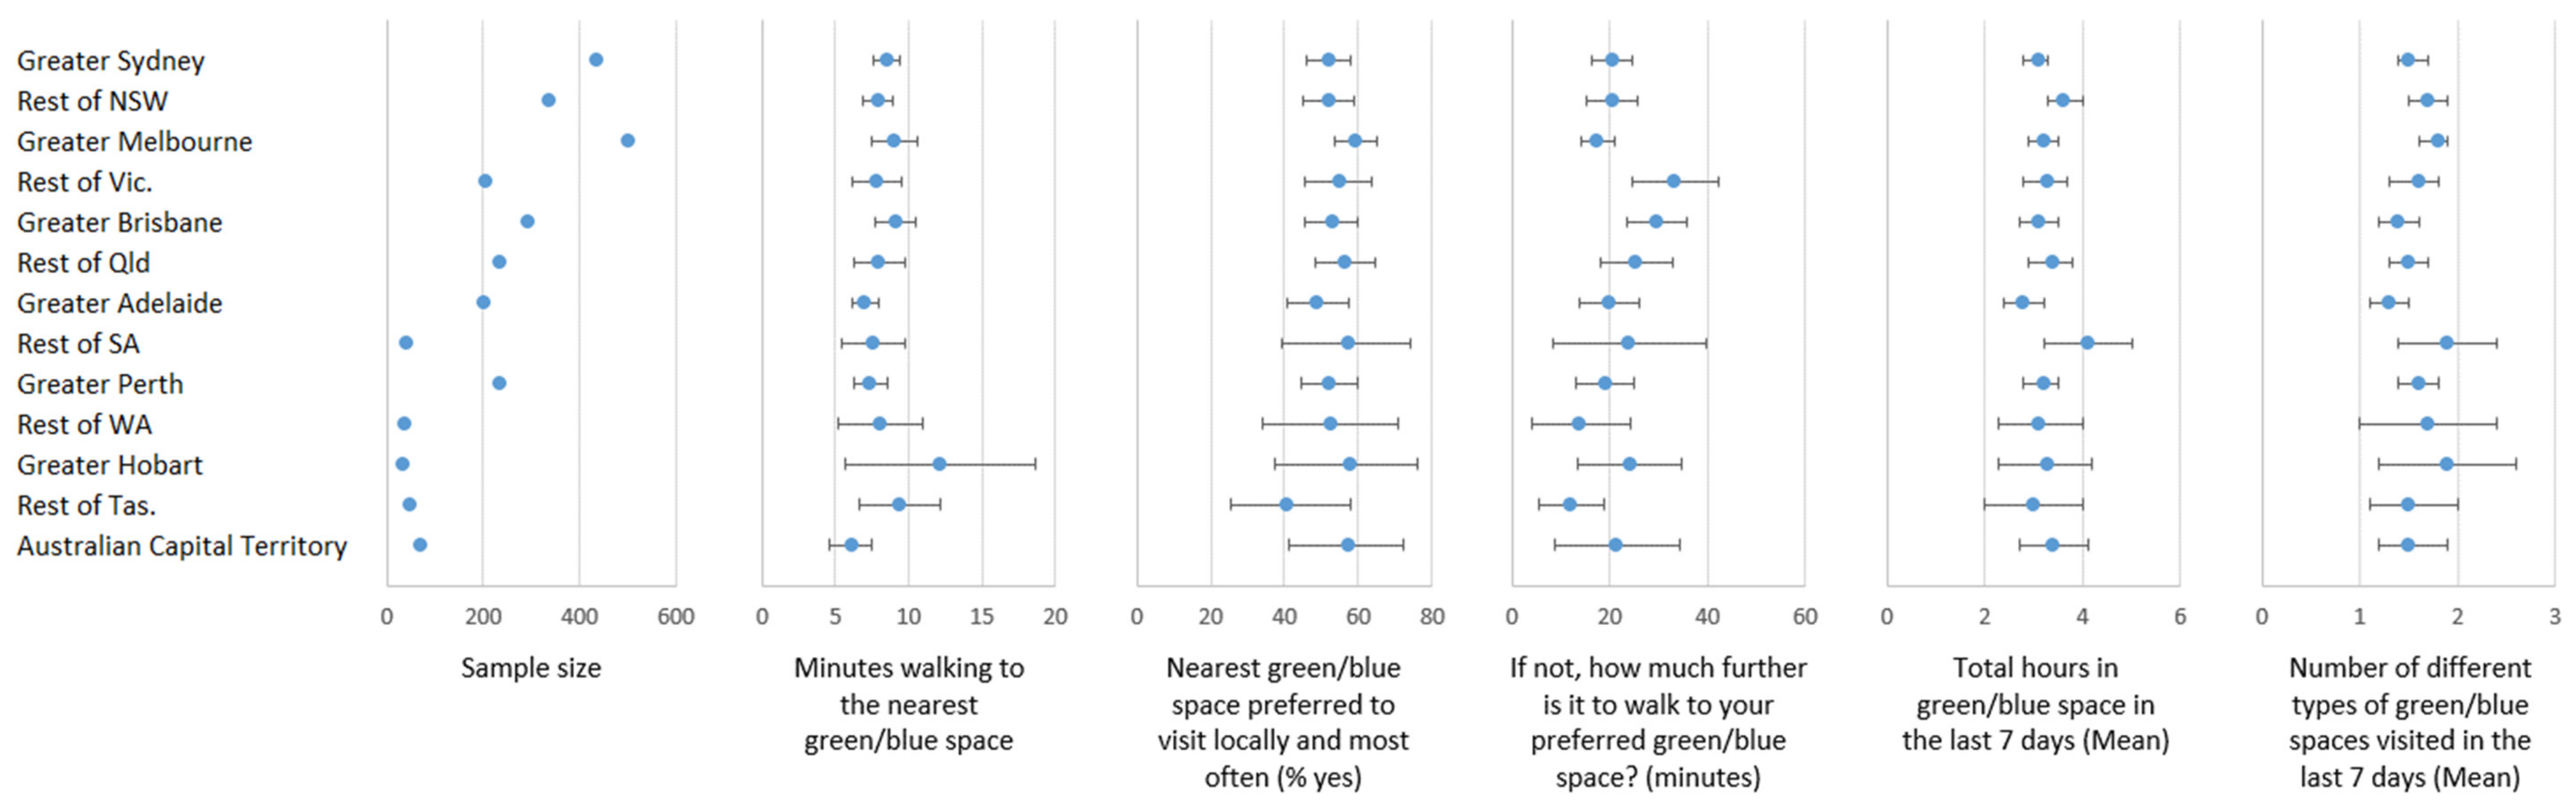
3.1. Access to Green and/or Blue Space
3.2. Green and/or Blue Space Visitation
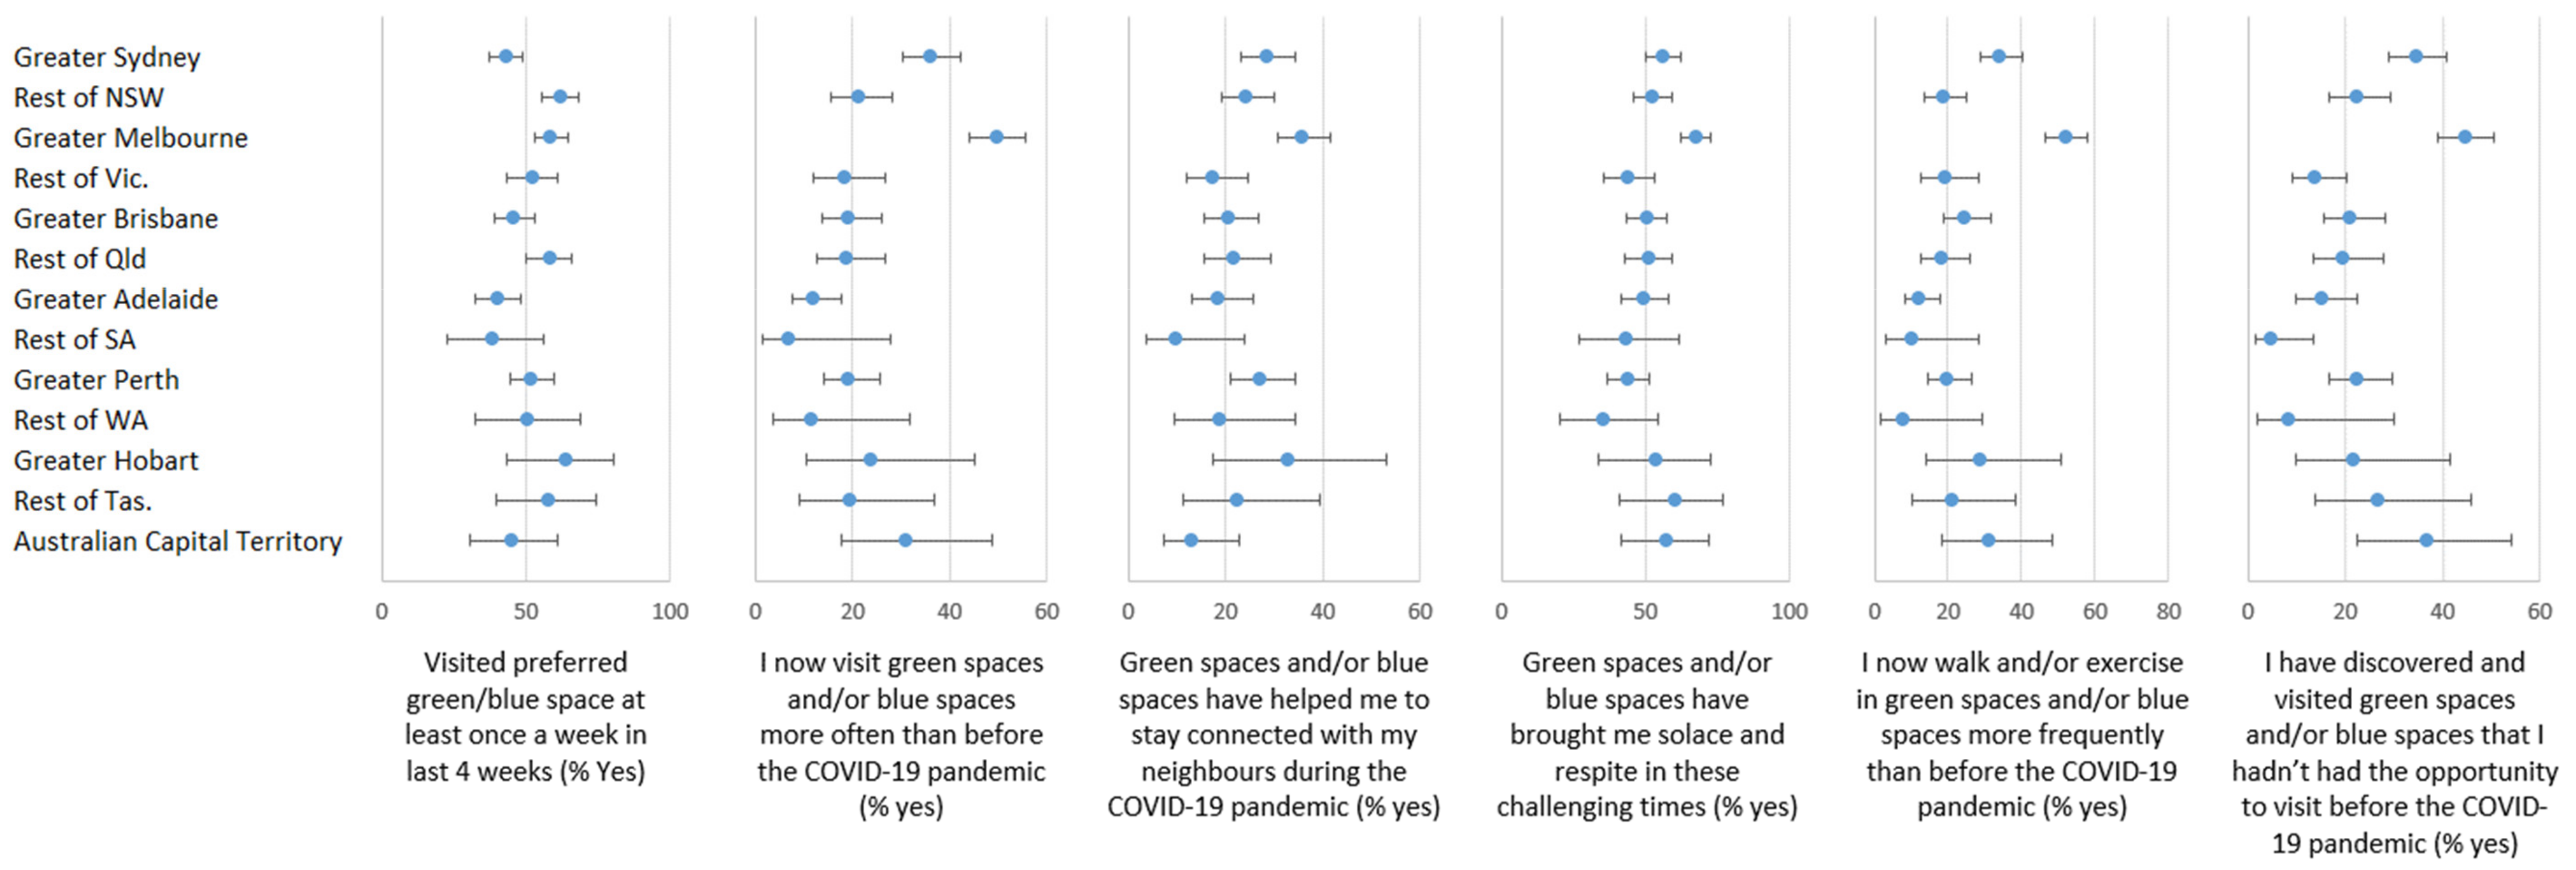
3.3. Changes in Use and Felt Benefits from Visiting Green or Blue Spaces
3.4. Geographic Variation
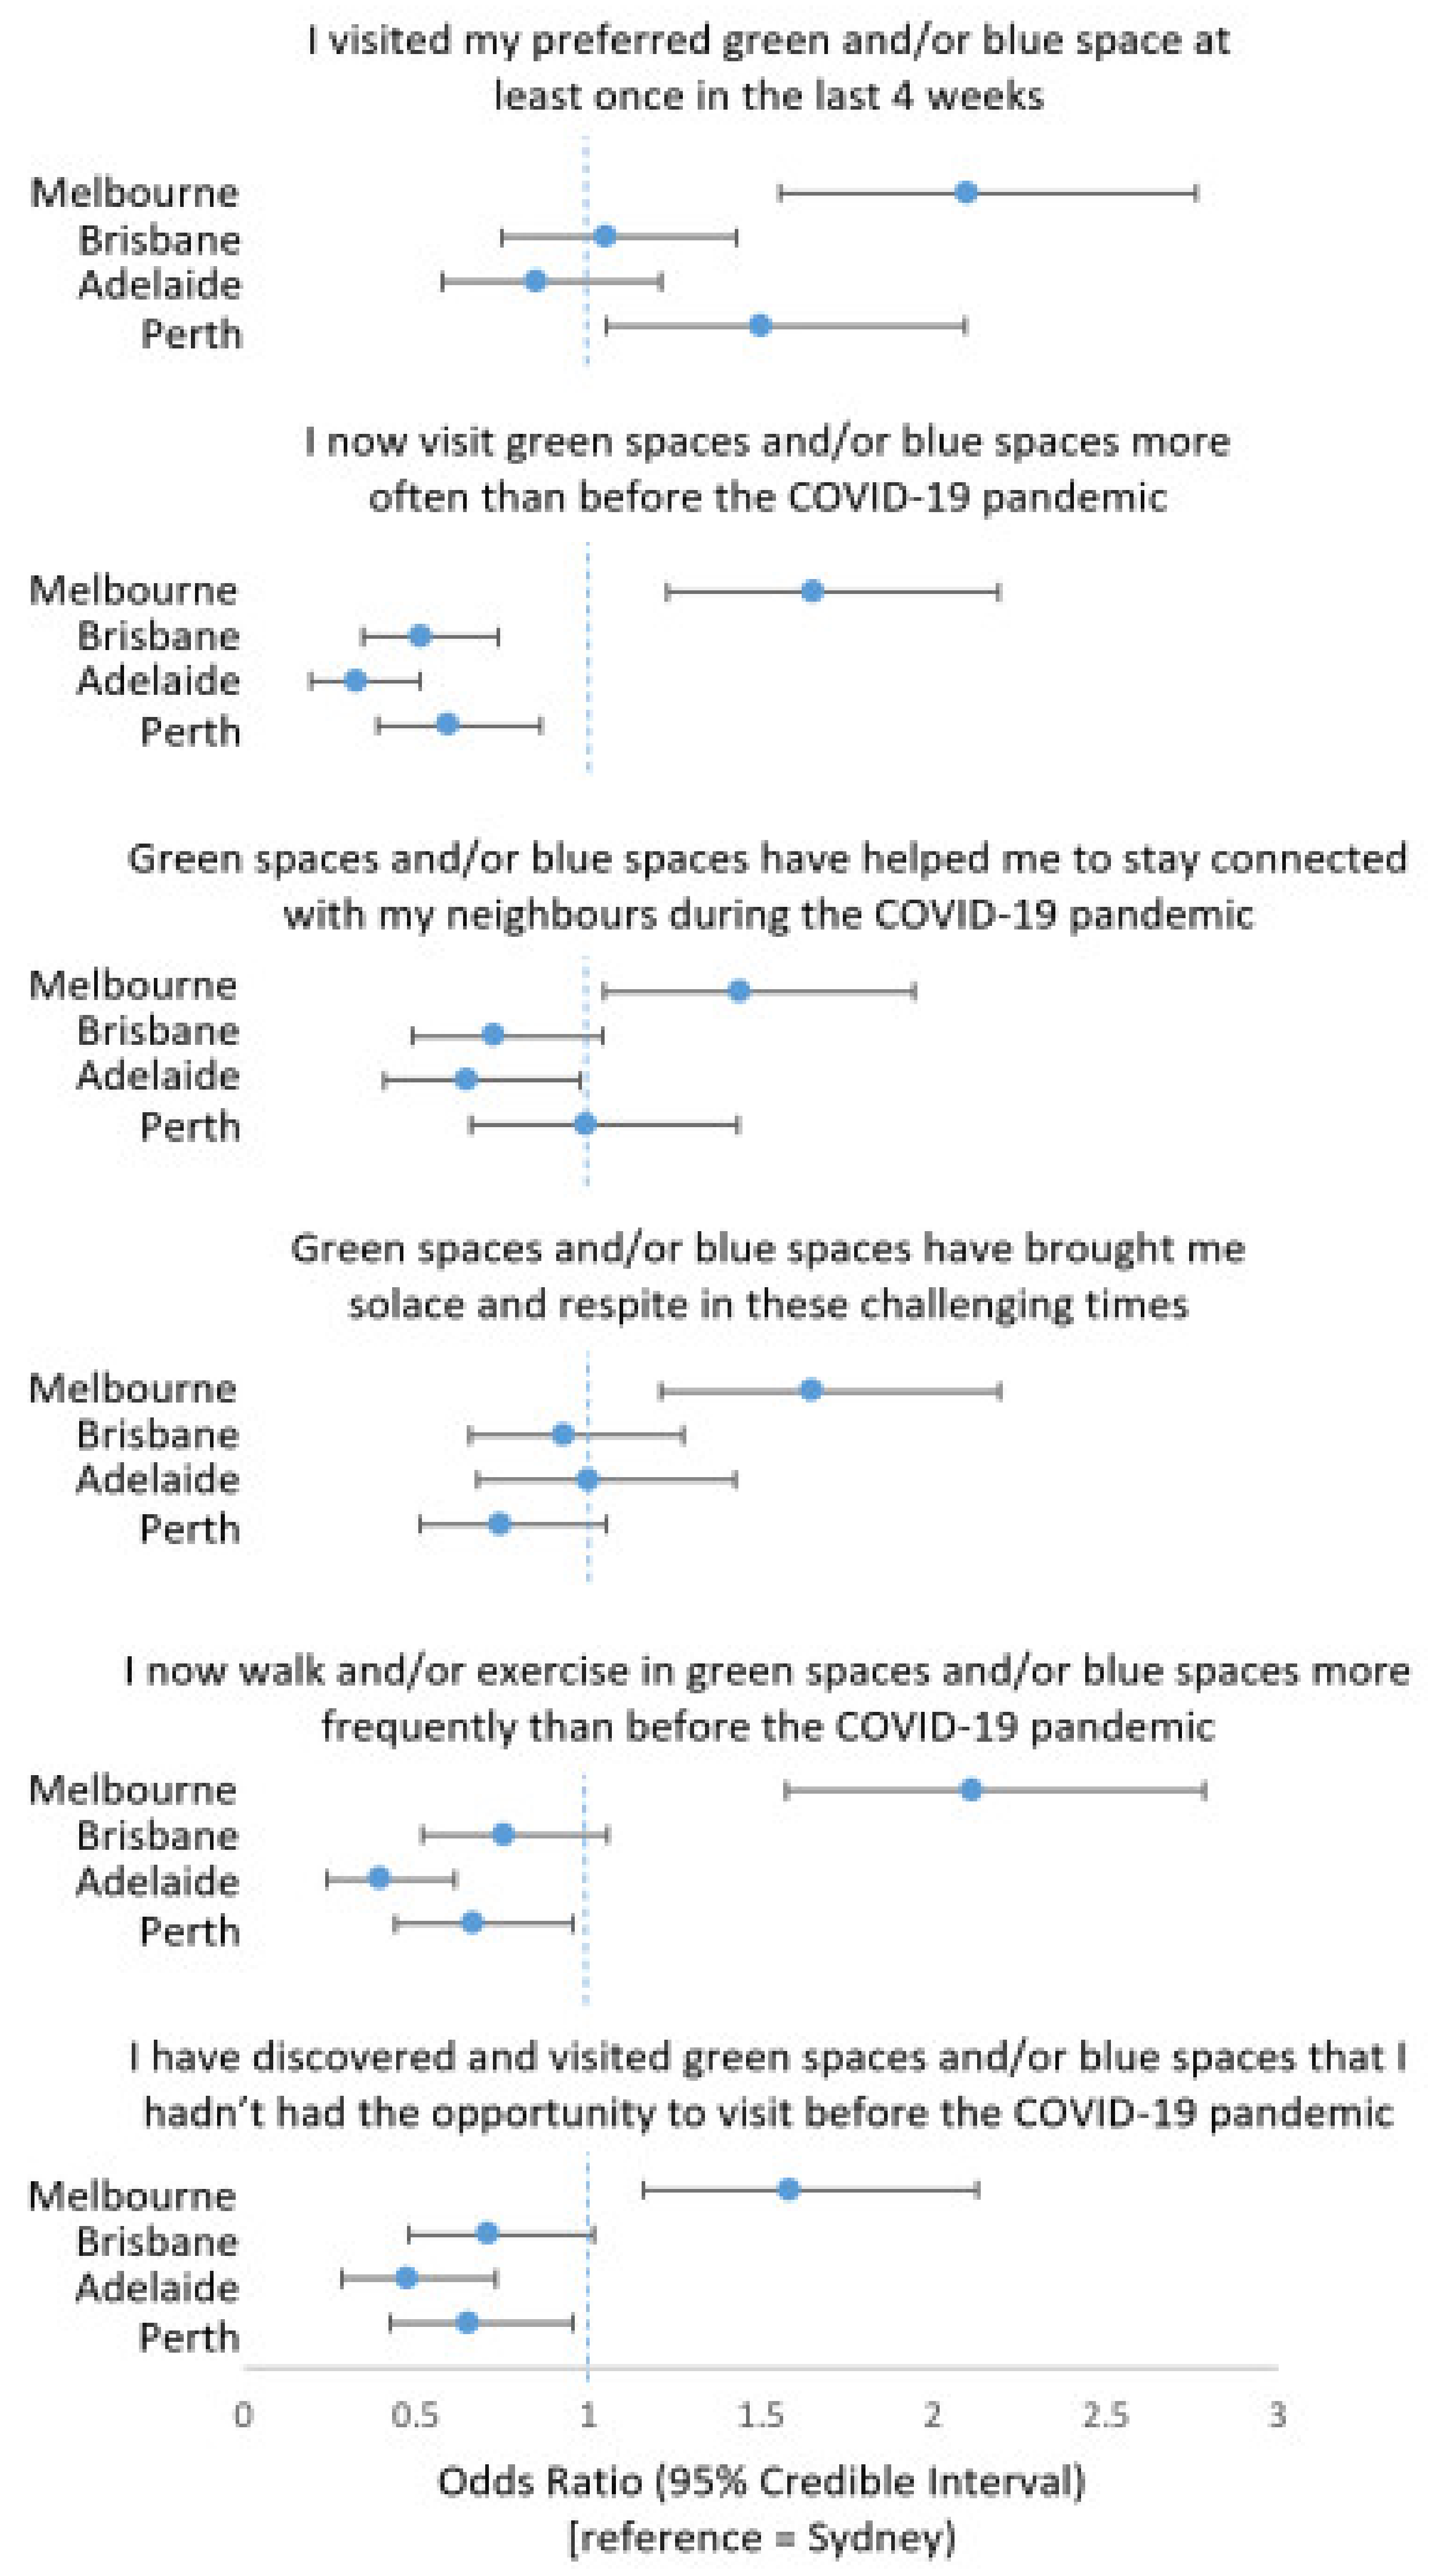
3.5. Between-City Differences
4. Discussion
5. Conclusions
Author Contributions
Funding
Institutional Review Board Statement
Informed Consent Statement
Data Availability Statement
Acknowledgments
Conflicts of Interest
References
- Brynjolfsson, E.; Horton, J.J.; Ozimek, A.; Rock, D.; Sharma, G.; TuYe, H.-Y. COVID-19 and Remote Work: An Early Look at US Data; National Bureau of Economic Research: Cambridge, MA, USA, 2020.
- Kramer, A.; Kramer, K.Z. The potential impact of the Covid-19 pandemic on occupational status, work from home, and occupational mobility. J. Vocat. Behav. 2020, 119, 103442. [Google Scholar] [CrossRef]
- Lin, B.B.; Fuller, R.A.; Bush, R.; Gaston, K.J.; Shanahan, D.F. Opportunity or orientation? Who uses urban parks and why. PLoS ONE 2014, 9, e87422. [Google Scholar]
- Flowers, E.P.; Freeman, P.; Gladwell, V.F. A cross-sectional study examining predictors of visit frequency to local green space and the impact this has on physical activity levels. BMC Public Health 2016, 16, 1–8. [Google Scholar] [CrossRef] [PubMed]
- Tovey, J. The Coronavirus Has Made Me So Grateful for City Parks. We Should Fight for Them. The Guardian. Available online: https://www.theguardian.com/lifeandstyle/2020/apr/20/the-coronavirus-has-made-me-so-grateful-for-city-parks-we-should-fight-for-them (accessed on 20 April 2020).
- Wilson, M. ‘It Sort of Gives You Hope’: One Place New Yorkers Go to Escape Their Homes. New York Times. Available online: https://www.nytimes.com/2020/03/19/nyregion/nyc-parks-coronavirus.html (accessed on 11 May 2020).
- Barker, A.; Smith, A. Parks in a Pandemic: A Glimpse into the Future? Discovery Society. Available online: https://discoversociety.org/2020/04/29/parks-in-a-pandemic-a-glimpse-into-the-future/ (accessed on 11 May 2020).
- Venter, Z.S.; Barton, D.N.; Gundersen, V.; Figari, H.; Nowell, M. Urban nature in a time of crisis: Recreational use of green space increases during the COVID-19 outbreak in Oslo, Norway. Environ. Res. Lett. 2020, 15, 104075. [Google Scholar] [CrossRef]
- Ugolini, F.; Massetti, L.; Calaza-Martínez, P.; Cariñanos, P.; Dobbs, C.; Ostoić, S.K.; Marin, A.M.; Pearlmutter, D.; Saaroni, H.; Šaulienė, I.; et al. Effects of the COVID-19 pandemic on the use and perceptions of urban green space: An international exploratory study. Urban For. Urban Green. 2020, 56, 126888. [Google Scholar] [CrossRef]
- Pouso, S.; Borja, Á.; Fleming, L.E.; Gómez-Baggethun, E.; White, M.P.; Uyarra, M.C. Contact with blue-green spaces during the COVID-19 pandemic lockdown beneficial for mental health. Sci. Total Environ. 2020, 756, 143984. [Google Scholar] [CrossRef]
- Dzhambov, A.M.; Lercher, P.; Browning, M.H.; Stoyanov, D.; Petrova, N.; Novakov, S.; Dimitrova, D.D. Does greenery experienced indoors and outdoors provide an escape and support mental health during the COVID-19 quarantine? Environ. Res. 2020, 110420. [Google Scholar] [CrossRef] [PubMed]
- Botha, F.; John, P.; Sonja, C.; Ribar, D.C.; Salamanca, N. Implications of COVID-19 labour market shocks for inequality in financial wellbeing. J. Popul. Econ. 2021, 34, 655–689. [Google Scholar] [CrossRef] [PubMed]
- Borland, J.; Charlton, A. The Australian Labour Market and the Early Impact of COVID–19: An Assessment. Aust. Econ. Rev. 2020, 53, 297–324. [Google Scholar] [CrossRef]
- Nadler, R. Understanding “Zoom fatigue”: Theorizing spatial dynamics as third skins in computer-mediated communication. Comput. Compos. 2020, 58, 102613. [Google Scholar] [CrossRef]
- Hartig, T.; Mitchell, R.; de Vries, S.; Frumkin, H. Nature and Health. Annu. Rev. Public Health 2014, 35, 207–228. [Google Scholar] [CrossRef] [PubMed]
- Markevych, I.; Schoierer, J.; Hartig, T.; Chudnovsky, A.; Hystad, P.; Dzhambov, A.M.; de Vries, S.; Triguero-Mas, M.; Brauer, M.; Nieuwenhuijsen, M.J.; et al. Exploring pathways linking greenspace to health: Theoretical and methodological guidance. Environ. Res. 2017, 158, 301–317. [Google Scholar] [CrossRef] [PubMed]
- Foley, R.; Kearns, R.; Kistemann, T.; Wheeler, B. Blue Space, Health and Wellbeing: Hydrophilia Unbounded; Routledge: London, UK, 2019. [Google Scholar]
- Iorio, K. Melbourne Enters New Coronavirus Lockdown. Here Are the Key Points from Premier Daniel Andrews (7 July 2020). Available online: https://www.abc.net.au/news/2020-07-07/melbourne-lockdown-daniel-andrews-key-points/12431708 (accessed on 15 January 2021).
- Graham, J. Melbourne’s Coronavirus Restrictions Ease as Victorian Premier Daniel Andrews Announces End to Lockdown (26 October 2020). Available online: https://www.abc.net.au/news/2020-10-26/melbourne-coronavirus-restrictions-daniel-andrews-lockdown/12812858 (accessed on 15 January 2021).
- White, M.P.; Alcock, I.; Grellier, J.; Wheeler, B.W.; Hartig, T.; Warber, S.L.; Bone, A.; Depledge, M.H.; Fleming, L.E. Spending at least 120 min a week in nature is associated with good health and wellbeing. Sci. Rep. 2019, 9, 1–11. [Google Scholar] [CrossRef]
- Shanahan, D.F.; Bush, R.; Gaston, K.J.; Lin, B.B.; Dean, J.; Barber, E.; Fuller, R.A. Health benefits from nature experiences depend on dose. Sci. Rep. 2016, 6, 28551. [Google Scholar] [CrossRef]
- Astell-Burt, T.; Feng, X.; Mavoa, S.; Badland, H.M.; Giles-Corti, B. Do low-income neighbourhoods have the least green space? A cross-sectional study of Australia’s most populous cities. BMC Public Health 2014, 14, 292. [Google Scholar] [CrossRef]
- Wolch, J.R.; Byrne, J.; Newell, J.P. Urban green space, public health, and environmental justice: The challenge of making cities ‘just green enough’. Landsc. Urban Plan. 2014, 125, 234–244. [Google Scholar] [CrossRef]
- Anguelovski, I.; Connolly, J.J.; Garcia-Lamarca, M.; Cole, H.; Pearsall, H. New scholarly pathways on green gentrification: What does the urban ‘green turn’ mean and where is it going? Prog. Hum. Geogr. 2019, 43, 1064–1086. [Google Scholar] [CrossRef]
- Williams, T.G.; Logan, T.M.; Zuo, C.T.; Liberman, K.D.; Guikema, S.D. Parks and safety: A comparative study of green space access and inequity in five US cities. Landsc. Urban Plan. 2020, 201, 103841. [Google Scholar] [CrossRef]
- Jay, J.; Bor, J.; Nsoesie, E.O.; Lipson, S.K.; Jones, D.K.; Galea, S.; Raifman, J. Neighbourhood income and physical distancing during the COVID-19 pandemic in the United States. Nat. Hum. Behav. 2020, 4, 1294–1302. [Google Scholar] [CrossRef] [PubMed]
- Sampson, L.; Ettman, C.K.; Abdalla, S.M.; Colyer, E.; Dukes, K.; Lane, K.J.; Galea, S. Financial hardship and health risk behavior during COVID-19 in a large US national sample of women. SSM-Popul. Health 2021, 13, 100734. [Google Scholar] [CrossRef]
- Ettman, C.K.; Abdalla, S.M.; Cohen, G.H.; Sampson, L.; Vivier, P.M.; Galea, S. Low assets and financial stressors associated with higher depression during COVID-19 in a nationally representative sample of US adults. J. Epidemiol. Community Health 2020. [Google Scholar] [CrossRef] [PubMed]
- Stanaway, F.; Irwig, L.; Teixeira-Pinto, A.; Bell, K. COVID-19: How many Australians might have died if we’d had an outbreak like that in England and Wales? Med. J. Aust. 2020, 1, 51. [Google Scholar]
- Nisbet, E.K.; Zelenski, J.M. The NR-6: A new brief measure of nature relatedness. Front. Psychol. 2013, 4, 813. [Google Scholar] [CrossRef] [PubMed]
- Rasbash, J.; Browne, W.; Goldstein, H.; Yang, M.; Plewis, I.; Healy, M.; Woodhouse, G.; Draper, D.; Langford, I.; Lewis, T. A User’s Guide to MLwiN; Institute of Education: London, UK, 2000. [Google Scholar]
- Browne, W.J. MCMC Estimation in MLwiN: Version 2.0; Centre for Multilevel Modelling, University of Bristol: Bristol, UK, 2005. [Google Scholar]
- Feng, X.; Astell-Burt, T. Residential green space quantity and quality and child wellbeing: A longitudinal study. Am. J. Prev. Med. 2017, 53, 616–624. [Google Scholar] [CrossRef] [PubMed]
- Feng, X.; Astell-Burt, T. Residential green space quantity and quality and symptoms of psychological distress: A 15-year longitudinal study of 3897 women in postpartum. BMC Psychiatry 2018, 18, 348. [Google Scholar] [CrossRef]
- Astell-Burt, T.; Hartig, T.; Eckerman, S.; Nieuwenhuijsen, M.; McMunn, A.; Frumkin, H.; Feng, F. More green, less lonely? A longitudinal cohort study. Int. J. Epidemiol 2021. under review. [Google Scholar]
- Mavoa, S.; Koohsari, M.J.; Badland, H.M.; Davern, M.; Feng, X.; Astell-Burt, T.; Giles-Corti, B. Area-level disparities of public open space: A geographic information systems analysis in Metropolitan Melbourne. Urban Policy Res. 2015, 33, 306–323. [Google Scholar] [CrossRef]
- Byrne, J. When green is White: The cultural politics of race, nature and social exclusion in a Los Angeles urban national park. Geoforum 2012, 43, 595–611. [Google Scholar] [CrossRef]
- Birch, J.; Rishbeth, C.; Payne, S.R. Nature doesn’t judge you–how urban nature supports young people’s mental health and wellbeing in a diverse UK city. Health Place 2020, 62, 102296. [Google Scholar] [CrossRef]
- Hartig, T. Restoration in nature: Beyond the conventional narrative. In Nature and Psychology: Biological, Cognitive, Developmental, and Social Pathways to Well-Being, Proceedings of the 67th Annual Nebraska Symposium on Motivation, Cham, Switzerland, April 2019; Schutte, A.R., Torquati, J., Stevens, J.R., Eds.; Springer: Cham, Switzerland, 2021; in press. [Google Scholar]
- Kondo, M.C.; Oyekanmi, K.O.; Gibson, A.; South, E.C.; Bocarro, J.; Hipp, J.A. Nature Prescriptions for Health: A Review of Evidence and Research Opportunities. Int. J. Environ. Res. Public Health 2020, 17, 4213. [Google Scholar] [CrossRef] [PubMed]
- Macintyre, S.; Macdonald, L.; Ellaway, A. Lack of agreement between measured and self-reported distance from public green parks in Glasgow, Scotland. Int. J. Behav. Nutr. Phys. Act. 2008, 5, 26. [Google Scholar] [CrossRef] [PubMed]


| N | % | Minutes Walking to the Nearest Green/Blue Space | Nearest Green/Blue Space Preferred to Visit Locally and Most Often | |||
|---|---|---|---|---|---|---|
| Mean (95% CI) | IRR (95% CrI) | % Yes (95% CI) | OR (95% CrI) | |||
| Full sample | 2697 | 100 | 8.3 (7.8, 8.7) | 53.9 (51.5, 56.4) | ||
| Fixed Effects Gender (ref: Female) | 1217 | 45.1 | 7.5 (7.0, 8.0) | 56.6 (53.1, 60.0) | ||
| Male | 1483 | 54.9 | 9.0 (8.2, 9.8) | 1.20 (1.16, 1.23) | 51.3 (47.9, 54.7) | 0.84 (0.71, 0.99) |
| Age group (ref: 18–24) | 103 | 3.8 | 8.5 (6.1, 10.9) | 47.4 (37.0, 57.9) | ||
| 25–34 | 356 | 13.2 | 7.9 (6.8, 9.0) | 1.04 (0.96, 1.13) | 50.8 (44.5, 57.0) | 0.95 (0.58, 1.50) |
| 35–44 | 448 | 16.6 | 8.8 (7.6, 9.9) | 1.14 (1.05, 1.24) | 52.1 (46.3, 57.8) | 1.23 (0.75, 1.92) |
| 45–54 | 458 | 17.0 | 8.0 (7.0, 8.9) | 1.13 (1.04, 1.23) | 51.1 (45.7, 56.4) | 1.13 (0.69, 1.77) |
| 55–64 | 549 | 20.3 | 7.8 (7.1, 8.4) | 1.19 (1.09, 1.29) | 54.4 (49.5, 59.3) | 1.19 (0.72, 1.85) |
| 65–74 | 541 | 20.0 | 8.3 (7.5, 9.2) | 1.18 (1.08, 1.28) | 61.2 (56.1, 66.0) | 1.28 (0.73, 2.12) |
| 75+ | 245 | 9.1 | 9.1 (7.8, 10.5) | 1.34 (1.21, 1.48) | 70.9 (63.5, 77.3) | 2.13 (1.11, 3.76) |
| Economic status (ref: Employed, not working from home) | 680 | 25.2 | 7.9 (7.1, 8.7) | 51.7 (47.0, 56.4) | ||
| Employed, working from home sometimes | 285 | 10.6 | 7.2 (6.1, 8.3) | 0.89 (0.84, 0.94) | 44.9 (37.9, 52.0) | 0.84 (0.62, 1.12) |
| Employed, working from home often | 201 | 7.4 | 8.1 (6.3, 9.9) | 0.99 (0.93, 1.04) | 53.7 (45.0, 62.1) | 1.13 (0.80, 1.56) |
| Employed, working from home always | 380 | 14.1 | 7.9 (6.9, 8.9) | 1.02 (0.97, 1.07) | 53.7 (47.2, 60.0) | 0.91 (0.69, 1.19) |
| Unemployed | 188 | 7.0 | 9.9 (8.0, 11.7) | 1.06 (1.01, 1.12) | 56.9 (47.9, 65.4) | 1.09 (0.75, 1.53) |
| Retired | 787 | 29.2 | 8.6 (7.9, 9.3) | 1.00 (0.95, 1.05) | 63.2 (59.0, 67.1) | 1.16 (0.83, 1.59) |
| Long-term sick or disabled | 73 | 2.7 | 8.9 (6.7, 11.0) | 1.12 (1.04, 1.21) | 46.6 (32.6, 61.1) | 0.75 (0.43, 1.21) |
| Highest qualification (ref: <Year 12) | 345 | 12.8 | 9.5 (8.3, 10.6) | 62.9 (56.9, 68.5) | ||
| Year 12 | 332 | 12.3 | 8.4 (7.0, 9.7) | 0.87 (0.83, 0.92) | 50.4 (44.0, 56.8) | 0.65 (0.46, 0.89) |
| Certificate or advanced diploma | 744 | 27.6 | 8.3 (7.5, 9.1) | 0.95 (0.91, 0.99) | 55.6 (51.4, 59.7) | 0.82 (0.61, 1.08) |
| Bachelor degree or graduate certificate | 859 | 31.8 | 7.2 (6.5, 7.8) | 0.85 (0.81, 0.89) | 48.6 (43.9, 53.3) | 0.59 (0.44, 0.77) |
| Postgraduate qualification | 420 | 15.6 | 8.3 (7.1, 9.5) | 0.90 (0.86, 0.95) | 52.7 (46.6, 58.8) | 0.66 (0.47, 0.90) |
| Annual household income before tax (AUD; ref: <AUD 50,000) | 776 | 28.7 | 9.6 (8.6, 10.6) | 60.2 (55.6, 64.6) | ||
| AUD 51,000–AUD 100,000 | 842 | 31.2 | 9.1 (8.1, 10.1) | 0.98 (0.94, 1.02) | 52.6 (48.2, 56.9) | 0.87 (0.69, 1.09) |
| AUD 101,000–AUD 150,000 | 468 | 17.3 | 7.2 (6.4, 7.9) | 0.90 (0.86, 0.95) | 54.6 (48.8, 60.2) | 0.99 (0.73, 1.31) |
| >AUD 150,000 | 441 | 16.3 | 6.2 (5.5, 7.0) | 0.84 (0.80, 0.89) | 47.1 (41.2, 53.1) | 0.85 (0.60, 1.15) |
| Financial situation (ref: Comfortable) | 825 | 30.6 | 6.7 (6.1, 7.2) | 53.6 (49.2, 58.0) | ||
| Doing ok | 1156 | 42.8 | 8.5 (7.7, 9.2) | 1.16 (1.12, 1.20) | 53.6 (49.9, 57.4) | 1.00 (0.82, 1.22) |
| Getting by | 491 | 18.2 | 9.5 (8.5, 10.6) | 1.27 (1.22, 1.33) | 55.6 (49.9, 61.1) | 1.03 (0.79, 1.33) |
| Difficult or very difficult | 228 | 8.4 | 9.5 (7.8, 11.2) | 1.24 (1.17, 1.31) | 52.9 (44.9, 60.8) | 0.92 (0.65, 1.28) |
| Nature relatedness scale (ref: Tertile 1 (1.0–3.4)) | 884 | 32.7 | 7.8 (7.3, 8.4) | 49.4 (45.7, 53.1) | ||
| Tertile 2 (3.5–4.0) | 1082 | 40.1 | 8.0 (7.0, 8.9) | 0.94 (0.91, 0.97) | 56.3 (51.8, 60.7) | 1.23 (1.01, 1.48) |
| Tertile 3 (4.1–5.0) | 734 | 27.2 | 9.4 (8.3, 10.5) | 1.06 (1.03, 1.10) | 59.3 (54.7, 63.8) | 1.30 (1.05, 1.57) |
| Random Effects Unadjusted mean (95% CrI) † | 0.05 (0.02, 0.12) | <0.01 (<0.01, 0.03) | ||||
| Adjusted mean (95% CrI) | 0.03 (0.01, 0.09) | <0.01 (<0.01, 0.04) | ||||
| Percentage reduction in variance | 27.5 | - | ||||
| How Much Further Is It to Walk to Your Preferred Green/Blue Space, If Not the Nearest? (Minutes) | ||||
|---|---|---|---|---|
| N | % | Mean (95% CI) | IRR (95% CrI) | |
| Full sample | 1122 | 22.0 (20.2, 23.9) | ||
| Fixed Effects Gender (ref: Female) | 484 | 43.1 | 20.6 (17.9, 23.2) | |
| Male | 638 | 56.9 | 23.3 (20.7, 25.9) | 1.05 (1.02, 1.08) |
| Age group (ref: 18–24) | 41 | 3.7 | 23.7 (15.1, 32.4) | |
| 25–34 | 173 | 15.4 | 25.0 (20.2, 29.7) | 1.01 (0.94, 1.09) |
| 35–44 | 195 | 17.4 | 25.6 (21.7, 29.6) | 0.96 (0.89, 1.03) |
| 45–54 | 205 | 18.3 | 23.9 (19.7, 28.0) | 0.85 (0.79, 0.92) |
| 55–64 | 233 | 20.8 | 17.2 (14.2, 20.3) | 0.71 (0.66, 0.76) |
| 65–74 | 207 | 18.5 | 16.2 (12.6, 19.8) | 0.57 (0.52, 0.62) |
| 75+ | 68 | 6.1 | 12.2 (7.6, 16.8) | 0.41 (0.37, 0.46) |
| Economic status (ref: Employed, not working from home) | 294 | 26.2 | 22.9 (19.0, 26.7) | |
| Employed, working from home sometimes | 140 | 12.5 | 20.9 (16.2, 25.6) | 0.98 (0.94, 1.03) |
| Employed, working from home often | 89 | 7.9 | 21.5 (15.5, 27.5) | 1.01 (0.96, 1.07) |
| Employed, working from home always | 173 | 15.4 | 17.3 (14.1, 20.5) | 0.81 (0.77, 0.85) |
| Unemployed | 75 | 6.7 | 27.1 (20.0, 34.3) | 1.08 (1.02, 1.14) |
| Retired | 280 | 25.0 | 17.0 (13.9, 20.2) | 1.35 (1.27, 1.42) |
| Long-term sick or disabled | 33 | 2.9 | 38.6 (24.8, 52.5) | 1.46 (1.36, 1.57) |
| Highest qualification (ref: <Year 12) | 112 | 10.0 | 21.0 (15.4, 26.6) | |
| Year 12 | 138 | 12.3 | 21.3 (17.1, 25.5) | 0.97 (0.92, 1.03) |
| Certificate or advanced diploma | 283 | 25.2 | 22.8 (19.4, 26.2) | 1.02 (0.98, 1.08) |
| Bachelor degree or graduate certificate | 402 | 35.8 | 23.8 (20.3, 27.4) | 1.20 (1.14, 1.26) |
| Postgraduate qualification | 187 | 16.7 | 17.9 (13.4, 22.5) | 0.97 (0.92, 1.03) |
| Annual household income before tax (AUD; ref: <AUD 50,000) | 282 | 25.1 | 22.7 (18.5, 26.9) | |
| AUD 51,000–AUD 100,000 | 357 | 31.8 | 25.0 (21.5, 28.6) | 1.07 (1.03, 1.11) |
| AUD 101,000–AUD 150,000 | 206 | 18.4 | 21.5 (17.9, 25.2) | 1.07 (1.02, 1.12) |
| >AUD 150,000 | 214 | 19.1 | 18.3 (14.8, 21.9) | 0.99 (0.93, 1.04) |
| Financial situation (ref: Comfortable) | 353 | 31.5 | 19.9 (16.4, 23.3) | |
| Doing ok | 480 | 42.8 | 21.8 (18.9, 24.8) | 1.12 (1.08, 1.16) |
| Getting by | 194 | 17.3 | 22.0 (18.4, 25.5) | 1.12 (1.07, 1.17) |
| Difficult or very difficult | 95 | 8.5 | 29.4 (23.2, 35.6) | 1.43 (1.36, 1.50) |
| Nature relatedness scale (ref: Tertile 1 (1.0–3.4)) | 514 | 45.8 | 22.1 (19.5, 24.7) | |
| Tertile 2 (3.5–4.0) | 331 | 29.5 | 20.2 (17.0, 23.5) | 0.93 (0.90, 0.96) |
| Tertile 3 (4.1–5.0) | 277 | 24.7 | 24.2 (19.8, 28.6) | 0.98 (0.95, 1.01) |
| Random Effects Unadjusted mean (95% CrI) † | 0.05 (0.03, 0.11) | |||
| Adjusted mean (95% CrI) | 0.05 (0.02, 0.10) | |||
| Percentage reduction in variance | 14.6 | |||
| N | % | Total Hours in Green/Blue Space in the Last 7 Days | N Types of Green/Blue Spaces Visited in the Last 7 Days | |||
|---|---|---|---|---|---|---|
| Mean (95% CI) | IRR (95% CrI) | Mean (95% CI) | IRR (95% CrI) | |||
| Full sample | 2697 | 100 | 3.2 (3.1, 3.3) | 1.6 (1.5, 1.7) | ||
| Fixed Effects Gender (ref: Female) | 1217 | 45.1 | 3.3 (3.1, 3.5) | 1.7 (1.6, 1.8) | ||
| Male | 1483 | 54.9 | 3.1 (3.0, 3.3) | 0.79 (0.76, 0.81) | 1.5 (1.4, 1.6) | 0.93 (0.87, 0.99) |
| Age group (ref: 18–24) | 103 | 3.8 | 2.1 (1.7, 2.6) | 1.2 (1.0, 1.5) | ||
| 25–34 | 356 | 13.2 | 3.0 (2.8, 3.3) | 1.48 (1.30, 1.69) | 1.5 (1.4, 1.7) | 1.09 (0.89, 1.32) |
| 35–44 | 448 | 16.6 | 3.1 (2.9, 3.4) | 1.78 (1.56, 2.03) | 1.5 (1.4, 1.7) | 1.19 (0.98, 1.44) |
| 45–54 | 458 | 17.0 | 3.0 (2.7, 3.2) | 1.52 (1.33, 1.73) | 1.7 (1.5, 1.9) | 1.19 (0.97, 1.44) |
| 55–64 | 549 | 20.3 | 3.5 (3.3, 3.8) | 2.03 (1.78, 2.31) | 1.6 (1.4, 1.7) | 1.12 (0.92, 1.37) |
| 65–74 | 541 | 20.0 | 4.1 (3.9, 4.4) | 2.14 (1.86, 2.45) | 1.7 (1.6, 1.9) | 1.08 (0.87, 1.34) |
| 75+ | 245 | 9.1 | 3.9 (3.5, 4.3) | 1.96 (1.68, 2.25) | 1.8 (1.6, 2.1) | 1.09 (0.86, 1.37) |
| Economic status (ref: Employed, not working from home) | 680 | 25.2 | 2.9 (2.6, 3.1) | 1.4 (1.3, 1.5) | ||
| Employed, working from home sometimes | 285 | 10.6 | 3.2 (2.9, 3.6) | 1.06 (1.00, 1.12) | 1.6 (1.4, 1.9) | 1.08 (0.97, 1.21) |
| Employed, working from home often | 201 | 7.4 | 3.4 (3.0, 3.8) | 1.01 (0.94, 1.08) | 1.8 (1.6, 2.0) | 1.27 (1.13, 1.43) |
| Employed, working from home always | 380 | 14.1 | 3.3 (3.0, 3.7) | 1.19 (1.13, 1.26) | 1.8 (1.6, 2.0) | 1.14 (1.03, 1.26) |
| Unemployed | 188 | 7.0 | 2.6 (2.2, 3.1) | 0.98 (0.90, 1.06) | 1.3 (1.1, 1.6) | 1.05 (0.91, 1.21) |
| Retired | 787 | 29.2 | 4.1 (3.9, 4.3) | 1.05 (0.99, 1.11) | 1.8 (1.7, 2.0) | 1.30 (1.15, 1.46) |
| Long-term sick or disabled | 73 | 2.7 | 2.4 (1.5, 3.2) | 0.79 (0.70, 0.90) | 0.8 (0.6, 1.1) | 0.75 (0.58, 0.95) |
| Highest educational qualification (ref: <Year 12) | 345 | 12.8 | 3.2 (2.9, 3.5) | 1.4 (1.3, 1.6) | ||
| Year 12 | 332 | 12.3 | 2.7 (2.4, 3.0) | 0.88 (0.82, 0.94) | 1.4 (1.3, 1.6) | 1.03 (0.91, 1.17) |
| Certificate or advanced diploma | 744 | 27.6 | 3.3 (3.1, 3.5) | 0.96 (0.91, 1.01) | 1.6 (1.4, 1.7) | 1.07 (0.96, 1.18) |
| Bachelor degree or graduate certificate | 859 | 31.8 | 3.4 (3.1, 3.6) | 1.01 (0.96, 1.06) | 1.7 (1.6, 1.8) | 1.21 (1.09, 1.33) |
| Postgraduate qualification | 420 | 15.6 | 3.8 (3.5, 4.1) | 0.99 (0.93, 1.06) | 1.9 (1.8, 2.1) | 1.32 (1.18, 1.48) |
| Annual household income before tax (AUD; ref: <AUD 50,000) | 776 | 28.7 | 3.3 (3.1, 3.5) | 1.5 (1.4, 1.6) | ||
| AUD 51,000–AUD 100,000 | 842 | 31.2 | 3.1 (2.8, 3.3) | 0.98 (0.94, 1.02) | 1.5 (1.3, 1.6) | 1.05 (0.96, 1.14) |
| AUD 101,000–AUD 150,000 | 468 | 17.3 | 3.1 (2.8, 3.4) | 0.92 (0.86, 0.97) | 1.7 (1.5, 1.9) | 1.11 (0.99, 1.23) |
| >AUD 150,000 | 441 | 16.3 | 3.6 (3.3, 3.9) | 1.05 (0.98, 1.11) | 1.8 (1.6, 2.0) | 1.15 (1.02, 1.29) |
| Financial situation (ref: Comfortable) | 825 | 30.6 | 3.6 (3.4, 3.8) | 1.8 (1.6, 1.9) | ||
| Doing ok | 1156 | 42.8 | 3.2 (3.0, 3.4) | 0.89 (0.86, 0.93) | 1.6 (1.5, 1.7) | 0.96 (0.89, 1.03) |
| Getting by | 491 | 18.2 | 3.0 (2.7, 3.2) | 0.80 (0.76, 0.84) | 1.5 (1.3, 1.6) | 0.88 (0.80, 0.97) |
| Difficult or very difficult | 228 | 8.4 | 2.8 (2.4, 3.1) | 0.79 (0.74, 0.85) | 1.4 (1.1, 1.6) | 0.83 (0.72, 0.94) |
| Nature relatedness scale (ref: Tertile 1 (1.0–3.4)) | 884 | 32.7 | 2.6 (2.5, 2.8) | 1.3 (1.2, 1.4) | ||
| Tertile 2 (3.5–4.0) | 1082 | 40.1 | 3.5 (3.2, 3.7) | 1.42 (1.37, 1.48) | 1.8 (1.6, 1.9) | 1.32 (1.23, 1.42) |
| Tertile 3 (4.1–5.0) | 734 | 27.2 | 4.0 (3.8, 4.2) | 1.81 (1.74, 1.88) | 1.9 (1.8, 2.0) | 1.47 (1.37, 1.58) |
| Random Effects Unadjusted mean (95% CrI) † | 0.12 (0.05, 0.26) | 0.01 (<0.01, 0.02) | ||||
| Adjusted mean (95% CrI) | 0.05 (0.02, 0.10) | 0.01 (0.00, 0.02) | ||||
| Percentage reduction in variance | 61.4 | - | ||||
| N | % | Visited Preferred Green/Blue Space at Least Once a Week in Last 4 Weeks | Visit Green/Blue Spaces More Often Now than before COVID | |||
|---|---|---|---|---|---|---|
| % Yes (95% CI) | OR (95% CrI) | % Yes (95% CI) | OR (95% CrI) | |||
| Full sample | 2697 | 100 | 52.0 (49.6, 54.4) | 27.6 (25.5, 29.9) | ||
| Fixed Effects Gender (ref: Female) | 1217 | 45.1 | 53.2 (49.7, 56.7) | 26.9 (23.8, 30.3) | ||
| Male | 1483 | 54.9 | 50.8 (47.4, 54.2) | 0.88 (0.74, 1.04) | 28.3 (25.4, 31.5) | 1.18 (0.97, 1.44) |
| Age group (ref: 18–24) | 103 | 3.8 | 42.0 (32.0, 52.7) | 37.3 (27.7, 48.0) | ||
| 25–34 | 356 | 13.2 | 47.7 (41.4, 53.9) | 1.33 (0.78, 2.13) | 37.2 (31.4, 43.5) | 1.00 (0.59, 1.63) |
| 35–44 | 448 | 16.6 | 46.5 (40.9, 52.3) | 1.45 (0.84, 2.33) | 34.4 (29.2, 40.0) | 0.78 (0.45, 1.27) |
| 45–54 | 458 | 17.0 | 51.5 (46.1, 56.9) | 1.61 (0.93, 2.57) | 21.7 (17.7, 26.4) | 0.53 (0.30, 0.87) |
| 55–64 | 549 | 20.3 | 56.4 (51.5, 61.3) | 1.76 (1.02, 2.82) | 16.3 (13.1, 20.2) | 0.40 (0.22, 0.65) |
| 65–74 | 541 | 20.0 | 65.4 (60.5, 70.1) | 1.65 (0.89, 2.76) | 19.8 (16.1, 24.2) | 0.48 (0.24, 0.82) |
| 75+ | 245 | 9.1 | 59.8 (52.2, 66.9) | 1.32 (0.66, 2.34) | 21.5 (15.9, 28.4) | 0.46 (0.21, 0.84) |
| Economic status (ref: Employed, not working from home) | 680 | 25.2 | 47.6 (43.0, 52.3) | 24.4 (20.4, 28.7) | ||
| Employed, working from home sometimes | 285 | 10.6 | 45.6 (38.7, 52.8) | 0.97 (0.71, 1.29) | 27.6 (21.5, 34.6) | 1.20 (0.84, 1.67) |
| Employed, working from home often | 201 | 7.4 | 52.1 (43.4, 60.6) | 1.24 (0.87, 1.72) | 30.4 (23.2, 38.7) | 1.52 (1.02, 2.16) |
| Employed, working from home always | 380 | 14.1 | 55.6 (49.1, 61.9) | 1.13 (0.85, 1.49) | 47.8 (41.4, 54.3) | 2.01 (1.46, 2.71) |
| Unemployed | 188 | 7.0 | 53.1 (44.0, 61.9) | 1.54 (1.06, 2.17) | 28.7 (20.9, 38.1) | 1.05 (0.67, 1.54) |
| Retired | 787 | 29.2 | 64.4 (60.2, 68.4) | 1.91 (1.35, 2.64) | 19.4 (16.3, 22.9) | 1.14 (0.74, 1.69) |
| Long-term sick or disabled | 73 | 2.7 | 30.5 (19.0, 45.1) | 0.60 (0.33, 0.99) | 13.3 (7.1, 23.7) | 0.86 (0.39, 1.58) |
| Highest qualification (ref: <Year 12) | 345 | 12.8 | 53.9 (47.9, 59.8) | 18.1 (14.0, 23.0) | ||
| Year 12 | 332 | 12.3 | 46.2 (39.8, 52.6) | 1.00 (0.70, 1.39) | 28.4 (22.6, 35.0) | 0.83 (0.54, 1.22) |
| Certificate or advanced diploma | 744 | 27.6 | 51.7 (47.5, 55.9) | 1.05 (0.78, 1.38) | 23.3 (19.8, 27.1) | 0.93 (0.65, 1.29) |
| Bachelor degree or graduate certificate | 859 | 31.8 | 52.9 (48.1, 57.6) | 1.38 (1.02, 1.82) | 38.7 (34.2, 43.4) | 1.26 (0.90, 1.75) |
| Postgraduate qualification | 420 | 15.6 | 60.6 (54.4, 66.5) | 1.64 (1.16, 2.26) | 34.9 (29.2, 41.1) | 1.12 (0.75, 1.61) |
| Annual household income before tax (AUD; ref: <AUD 50,000) | 776 | 28.7 | 52.3 (47.8, 56.8) | 23.9 (20.1, 28.1) | ||
| AUD 51,000–AUD 100,000 | 842 | 31.2 | 49.4 (45.1, 53.8) | 1.14 (0.89, 1.42) | 22.9 (19.3, 26.9) | 0.88 (0.66, 1.15) |
| AUD 101,000–AUD 150,000 | 468 | 17.3 | 50.7 (45.0, 56.5) | 1.02 (0.75, 1.35) | 32.4 (27.2, 38.0) | 1.16 (0.81, 1.60) |
| >AUD 150,000 | 441 | 16.3 | 57.6 (51.6, 63.4) | 1.18 (0.84, 1.61) | 33.6 (28.2, 39.4) | 1.05 (0.71, 1.50) |
| Financial situation (ref: Comfortable) | 825 | 30.6 | 58.9 (54.4, 63.2) | 27.8 (23.9, 32.0) | ||
| Doing ok | 1156 | 42.8 | 52.5 (48.7, 56.2) | 0.83 (0.68, 1.01) | 28.5 (25.2, 32.1) | 1.08 (0.85, 1.35) |
| Getting by | 491 | 18.2 | 44.0 (38.5, 49.5) | 0.62 (0.47, 0.79) | 28.4 (23.5, 34.0) | 1.21 (0.88, 1.61) |
| Difficult or very difficult | 228 | 8.4 | 45.3 (37.5, 53.3) | 0.56 (0.39, 0.78) | 21.4 (15.2, 29.4) | 0.77 (0.49, 1.14) |
| Nature relatedness scale (ref: Tertile 1 (1.0–3.4)) | 884 | 32.7 | 42.6 (39.0, 46.3) | 25.2 (22.0, 28.7) | ||
| Tertile 2 (3.5–4.0) | 1082 | 40.1 | 57.5 (52.9, 61.9) | 1.79 (1.47, 2.16) | 31.1 (27.0, 35.5) | 1.38 (1.10, 1.71) |
| Tertile 3 (4.1–5.0) | 734 | 27.2 | 62.5 (57.9, 66.9) | 2.06 (1.67, 2.52) | 28.0 (23.9, 32.4) | 1.36 (1.06, 1.70) |
| Random Effects Unadjusted mean (95% CrI) † | 0.06 (0.02, 0.16) | 0.46 (0.16, 1.13) | ||||
| Adjusted mean (95% CrI) | 0.07 (0.02, 0.19) | 0.31 (0.10, 0.82) | ||||
| Percentage reduction in variance | - | 30.8 | ||||
| N | % | Green Spaces and/or Blue Spaces Have Helped Me to Stay Connected during the Pandemic | Green Spaces and/or Blue Spaces Have Brought Me Solace and Respite in These Challenging Times | |||
|---|---|---|---|---|---|---|
| % Yes (95% CI) | OR (95% CrI) | % Yes (95% CI) | OR (95% CrI) | |||
| Full sample N | 2697 | 100 | 25.7 (23.7, 27.9) | 53.7 (51.3, 56.1) | ||
| Fixed Effects Gender (ref: Female) | 1217 | 45.1 | 23.0 (20.2, 26.1) | 47.5 (44.0, 51.0) | ||
| Male | 1483 | 54.9 | 28.4 (25.5, 31.4) | 1.47 (1.21, 1.76) | 59.8 (56.4, 63.1) | 1.74 (1.45, 2.06) |
| Age group (ref: 18–24) | 103 | 3.8 | 15.0 (9.0, 23.8) | 52.4 (41.8, 62.7) | ||
| 25–34 | 356 | 13.2 | 27.6 (22.3, 33.6) | 1.84 (0.95, 3.43) | 65.0 (58.8, 70.7) | 1.32 (0.77, 2.12) |
| 35–44 | 448 | 16.6 | 31.5 (26.3, 37.2) | 2.20 (1.13, 4.12) | 51.7 (45.9, 57.4) | 0.78 (0.46, 1.24) |
| 45–54 | 458 | 17.0 | 25.0 (20.6, 30.0) | 1.86 (0.97, 3.48) | 53.2 (47.7, 58.5) | 0.82 (0.48, 1.30) |
| 55–64 | 549 | 20.3 | 21.2 (17.6, 25.3) | 1.76 (0.90, 3.30) | 49.2 (44.3, 54.1) | 0.79 (0.46, 1.25) |
| 65–74 | 541 | 20.0 | 27.0 (22.7, 31.8) | 2.25 (1.08, 4.40) | 51.2 (46.0, 56.3) | 0.73 (0.39, 1.21) |
| 75+ | 245 | 9.1 | 30.5 (24.1, 37.7) | 3.10 (1.37, 6.32) | 44.8 (37.6, 52.3) | 0.54 (0.27, 0.96) |
| Economic status (ref: Employed, not working from home) | 680 | 25.2 | 24.4 (20.5, 28.7) | 49.1 (44.4, 53.8) | ||
| Employed, working from home sometimes | 285 | 10.6 | 27.3 (21.2, 34.3) | 1.19 (0.84, 1.64) | 54.4 (47.2, 61.4) | 1.36 (0.99, 1.82) |
| Employed, working from home often | 201 | 7.4 | 26.9 (20.1, 34.9) | 1.40 (0.95, 1.98) | 56.8 (48.0, 65.2) | 1.57 (1.08, 2.20) |
| Employed, working from home always | 380 | 14.1 | 29.7 (24.2, 36.0) | 1.19 (0.86, 1.59) | 65.2 (58.8, 71.0) | 1.54 (1.13, 2.05) |
| Unemployed | 188 | 7.0 | 24.3 (17.4, 32.9) | 1.34 (0.87, 1.98) | 52.3 (43.3, 61.2) | 1.28 (0.88, 1.82) |
| Retired | 787 | 29.2 | 27.0 (23.5, 30.9) | 1.22 (0.83, 1.73) | 50.1 (45.9, 54.3) | 1.47 (1.05, 2.02) |
| Long-term sick or disabled | 73 | 2.7 | 12.9 (7.0, 22.4) | 1.13 (0.54, 2.01) | 46.5 (32.6, 60.9) | 1.55 (0.86, 2.58) |
| Highest qualification (ref: <Year 12) | 345 | 12.8 | 20.4 (16.2, 25.3) | 41.9 (36.2, 47.9) | ||
| Year 12 | 332 | 12.3 | 22.2 (17.5, 27.8) | 1.35 (0.90, 1.96) | 50.3 (43.9, 56.7) | 1.16 (0.82, 1.62) |
| Certificate or advanced diploma | 744 | 27.6 | 26.4 (22.8, 30.4) | 1.33 (0.95, 1.82) | 52.2 (48.0, 56.3) | 1.33 (0.99, 1.75) |
| Bachelor degree or graduate certificate | 859 | 31.8 | 29.8 (25.7, 34.2) | 1.54 (1.10, 2.10) | 63.5 (58.9, 67.8) | 1.77 (1.32, 2.34) |
| Postgraduate qualification | 420 | 15.6 | 29.2 (23.9, 35.1) | 1.53 (1.04, 2.16) | 63.6 (57.5, 69.3) | 1.84 (1.31, 2.54) |
| Annual household income before tax (AUD; ref: <AUD 50,000) | 776 | 28.7 | 24.9 (21.2, 28.9) | 50.4 (45.9, 54.9) | ||
| AUD 51,000–AUD 100,000 | 842 | 31.2 | 22.2 (18.9, 25.9) | 0.97 (0.75, 1.25) | 50.4 (46.0, 54.8) | 1.06 (0.83, 1.33) |
| AUD 101,000–AUD 150,000 | 468 | 17.3 | 30.8 (25.7, 36.4) | 1.11 (0.79, 1.51) | 53.8 (48.0, 59.5) | 1.13 (0.83, 1.51) |
| >AUD 150,000 | 441 | 16.3 | 29.3 (24.0, 35.1) | 1.06 (0.73, 1.50) | 64.2 (58.3, 69.6) | 1.36 (0.95, 1.88) |
| Financial situation (ref: Comfortable) | 825 | 30.6 | 27.9 (24.1, 32.1) | 58.9 (54.5, 63.1) | ||
| Doing ok | 1156 | 42.8 | 26.9 (23.8, 30.4) | 1.09 (0.87, 1.34) | 52.6 (48.9, 56.4) | 1.01 (0.81, 1.23) |
| Getting by | 491 | 18.2 | 24.7 (20.3, 29.8) | 1.00 (0.75, 1.32) | 50.6 (44.9, 56.2) | 0.92 (0.70, 1.19) |
| Difficult or very difficult | 228 | 8.4 | 15.1 (10.4, 21.5) | 0.59 (0.37, 0.86) | 49.6 (41.6, 57.6) | 0.73 (0.50, 1.02) |
| Nature relatedness scale (ref: Tertile 1 (1.0–3.4)) | 884 | 32.7 | 19.0 (16.3, 22.0) | 38.1 (34.5, 41.7) | ||
| Tertile 2 (3.5–4.0) | 1082 | 40.1 | 27.0 (23.3, 31.0) | 1.65 (1.32, 2.04) | 63.1 (58.7, 67.3) | 2.94 (2.40, 3.56) |
| Tertile 3 (4.1–5.0) | 734 | 27.2 | 36.3 (31.9, 41.0) | 2.27 (1.79, 2.81) | 70.7 (66.5, 74.6) | 3.73 (3.01, 4.59) |
| Random Effects Unadjusted random effect mean (95% CrI) † | 0.06 (0.01, 0.17) | 0.07 (0.02, 0.22) | ||||
| Adjusted random effect mean (95% CrI) | 0.05 (0.01, 0.18) | 0.07 (0.01, 0.23) | ||||
| Percentage reduction in variance | 1.4 | 4.6 | ||||
| N | % | I Now Walk and/or Exercise in Green Spaces and/or Blue Spaces More Often than Before COVID | I Have Discovered and Visited Green/Blue Spaces That I Had Not Visited Before the Pandemic | |||
|---|---|---|---|---|---|---|
| % Yes (95% CI) | OR (95% CrI) | % Yes (95% CI) | OR (95% CrI) | |||
| Full sample N | 2697 | 100 | 28.2 (26.0, 30.5) | 27.1 (24.9, 29.5) | ||
| Fixed Effects Gender (ref: Female) | 1217 | 45.1 | 27.1 (24.0, 30.4) | 25.2 (22.1, 28.6) | ||
| Male | 1483 | 54.9 | 29.3 (26.2, 32.5) | 1.19 (0.98, 1.44) | 29.0 (25.9, 32.2) | 1.24 (1.02, 1.50) |
| Age group (ref: 18–24) | 103 | 3.8 | 38.6 (28.9, 49.3) | 40.8 (30.9, 51.6) | ||
| 25–34 | 356 | 13.2 | 39.7 (33.7, 45.9) | 1.02 (0.58, 1.65) | 37.5 (31.6, 43.8) | 0.79 (0.47, 1.27) |
| 35–44 | 448 | 16.6 | 30.7 (25.7, 36.1) | 0.69 (0.39, 1.13) | 34.3 (29.1, 39.9) | 0.62 (0.36, 0.99) |
| 45–54 | 458 | 17.0 | 22.8 (18.7, 27.5) | 0.56 (0.32, 0.93) | 20.6 (16.6, 25.2) | 0.36 (0.21, 0.58) |
| 55–64 | 549 | 20.3 | 16.3 (13.0, 20.1) | 0.39 (0.22, 0.65) | 15.1 (12.0, 18.8) | 0.29 (0.17, 0.47) |
| 65–74 | 541 | 20.0 | 21.5 (17.6, 26.0) | 0.54 (0.28, 0.95) | 17.7 (14.1, 22.1) | 0.38 (0.20, 0.66) |
| 75+ | 245 | 9.1 | 25.0 (19.0, 32.2) | 0.56 (0.26, 1.03) | 17.4 (12.4, 23.7) | 0.40 (0.19, 0.74) |
| Economic status (ref: Employed, not working from home) | 680 | 25.2 | 25.2 (21.3, 29.7) | 27.0 (22.9, 31.6) | ||
| Employed, working from home sometimes | 285 | 10.6 | 28.0 (21.8, 35.1) | 1.11 (0.77, 1.52) | 29.8 (23.5, 36.9) | 1.26 (0.89, 1.72) |
| Employed, working from home often | 201 | 7.4 | 33.9 (26.4, 42.4) | 1.61 (1.10, 2.27) | 29.4 (22.3, 37.8) | 1.32 (0.89, 1.89) |
| Employed, working from home always | 380 | 14.1 | 43.5 (37.2, 50.0) | 1.66 (1.20, 2.22) | 41.4 (35.2, 48.0) | 1.43 (1.03, 1.92) |
| Unemployed | 188 | 7.0 | 31.6 (23.7, 40.7) | 1.19 (0.78, 1.74) | 27.9 (19.9, 37.6) | 0.80 (0.50, 1.19) |
| Retired | 787 | 29.2 | 20.7 (17.5, 24.3) | 1.07 (0.71, 1.55) | 16.1 (13.2, 19.4) | 0.84 (0.55, 1.26) |
| Long-term sick or disabled | 73 | 2.7 | 14.1 (7.7, 24.3) | 1.01 (0.48, 1.80) | 15.4 (8.6, 26.0) | 1.16 (0.55, 2.11) |
| Highest qualification (ref: <Year 12) | 345 | 12.8 | 22.0 (17.3, 27.4) | 16.3 (12.4, 21.2) | ||
| Year 12 | 332 | 12.3 | 31.1 (25.3, 37.7) | 0.84 (0.56, 1.23) | 28.2 (22.5, 34.8) | 1.01 (0.66, 1.50) |
| Certificate or advanced diploma | 744 | 27.6 | 22.7 (19.3, 26.6) | 0.77 (0.54, 1.08) | 23.3 (19.7, 27.3) | 1.01 (0.70, 1.42) |
| Bachelor degree or graduate certificate | 859 | 31.8 | 36.8 (32.4, 41.4) | 1.15 (0.82, 1.60) | 36.1 (31.6, 40.8) | 1.27 (0.89, 1.77) |
| Postgraduate qualification | 420 | 15.6 | 35.6 (29.8, 41.8) | 1.05 (0.71, 1.51) | 37.7 (31.7, 44.1) | 1.42 (0.96, 2.07) |
| Annual household income before tax (AUD; ref: <AUD 50,000) | 776 | 28.7 | 26.1 (22.1, 30.4) | 21.7 (18.0, 25.8) | ||
| AUD 51,000–AUD 100,000 | 842 | 31.2 | 24.6 (21.0, 28.6) | 1.01 (0.76, 1.30) | 22.0 (18.6, 25.9) | 1.09 (0.82, 1.43) |
| AUD 101,000–AUD 150,000 | 468 | 17.3 | 30.3 (25.3, 35.9) | 1.13 (0.80, 1.57) | 33.1 (27.9, 38.8) | 1.33 (0.94, 1.86) |
| >AUD 150,000 | 441 | 16.3 | 34.8 (29.3, 40.7) | 1.19 (0.81, 1.68) | 36.4 (30.7, 42.5) | 1.35 (0.91, 1.92) |
| Financial situation (ref: Comfortable) | 825 | 30.6 | 29.3 (25.4, 33.5) | 26.7 (22.9, 31.0) | ||
| Doing ok | 1156 | 42.8 | 28.7 (25.3, 32.3) | 1.06 (0.85, 1.32) | 28.5 (25.1, 32.1) | 1.10 (0.88, 1.38) |
| Getting by | 491 | 18.2 | 24.9 (20.3, 30.1) | 1.00 (0.73, 1.32) | 26.9 (22.0, 32.4) | 1.14 (0.83, 1.53) |
| Difficult or very difficult | 228 | 8.4 | 28.9 (21.8, 37.2) | 0.89 (0.59, 1.30) | 22.3 (15.9, 30.5) | 0.85 (0.54, 1.26) |
| Nature relatedness scale (ref: Tertile 1 (1.0–3.4)) | 884 | 32.7 | 25.1 (22.0, 28.5) | 23.3 (20.2, 26.8) | ||
| Tertile 2 (3.5–4.0) | 1082 | 40.1 | 32.2 (28.1, 36.7) | 1.40 (1.12, 1.73) | 28.2 (24.3, 32.5) | 1.46 (1.16, 1.82) |
| Tertile 3 (4.1–5.0) | 734 | 27.2 | 28.9 (24.7, 33.5) | 1.33 (1.05, 1.67) | 32.7 (28.2, 37.5) | 1.65 (1.29, 2.07) |
| Random Effects Unadjusted random effect mean (95% CrI) † | 0.40 (0.14, 0.98) | 0.34 (0.10, 0.90) | ||||
| Adjusted random effect mean (95% CrI) | 0.29 (0.10, 0.75) | 0.21 (0.05, 0.63) | ||||
| Percentage reduction in variance | 30.0 | 61.1 | ||||
Publisher’s Note: MDPI stays neutral with regard to jurisdictional claims in published maps and institutional affiliations. |
© 2021 by the authors. Licensee MDPI, Basel, Switzerland. This article is an open access article distributed under the terms and conditions of the Creative Commons Attribution (CC BY) license (http://creativecommons.org/licenses/by/4.0/).
Share and Cite
Astell-Burt, T.; Feng, X. Time for ‘Green’ during COVID-19? Inequities in Green and Blue Space Access, Visitation and Felt Benefits. Int. J. Environ. Res. Public Health 2021, 18, 2757. https://doi.org/10.3390/ijerph18052757
Astell-Burt T, Feng X. Time for ‘Green’ during COVID-19? Inequities in Green and Blue Space Access, Visitation and Felt Benefits. International Journal of Environmental Research and Public Health. 2021; 18(5):2757. https://doi.org/10.3390/ijerph18052757
Chicago/Turabian StyleAstell-Burt, Thomas, and Xiaoqi Feng. 2021. "Time for ‘Green’ during COVID-19? Inequities in Green and Blue Space Access, Visitation and Felt Benefits" International Journal of Environmental Research and Public Health 18, no. 5: 2757. https://doi.org/10.3390/ijerph18052757
APA StyleAstell-Burt, T., & Feng, X. (2021). Time for ‘Green’ during COVID-19? Inequities in Green and Blue Space Access, Visitation and Felt Benefits. International Journal of Environmental Research and Public Health, 18(5), 2757. https://doi.org/10.3390/ijerph18052757