
Lead Emissions and Population Vulnerability in the Detroit Metropolitan Area, 2006–2013: Impact of Pollution, Housing Age and Neighborhood Racial Isolation and Poverty on Blood Lead in Children


Abstract
1. Introduction
2. Materials and Methods
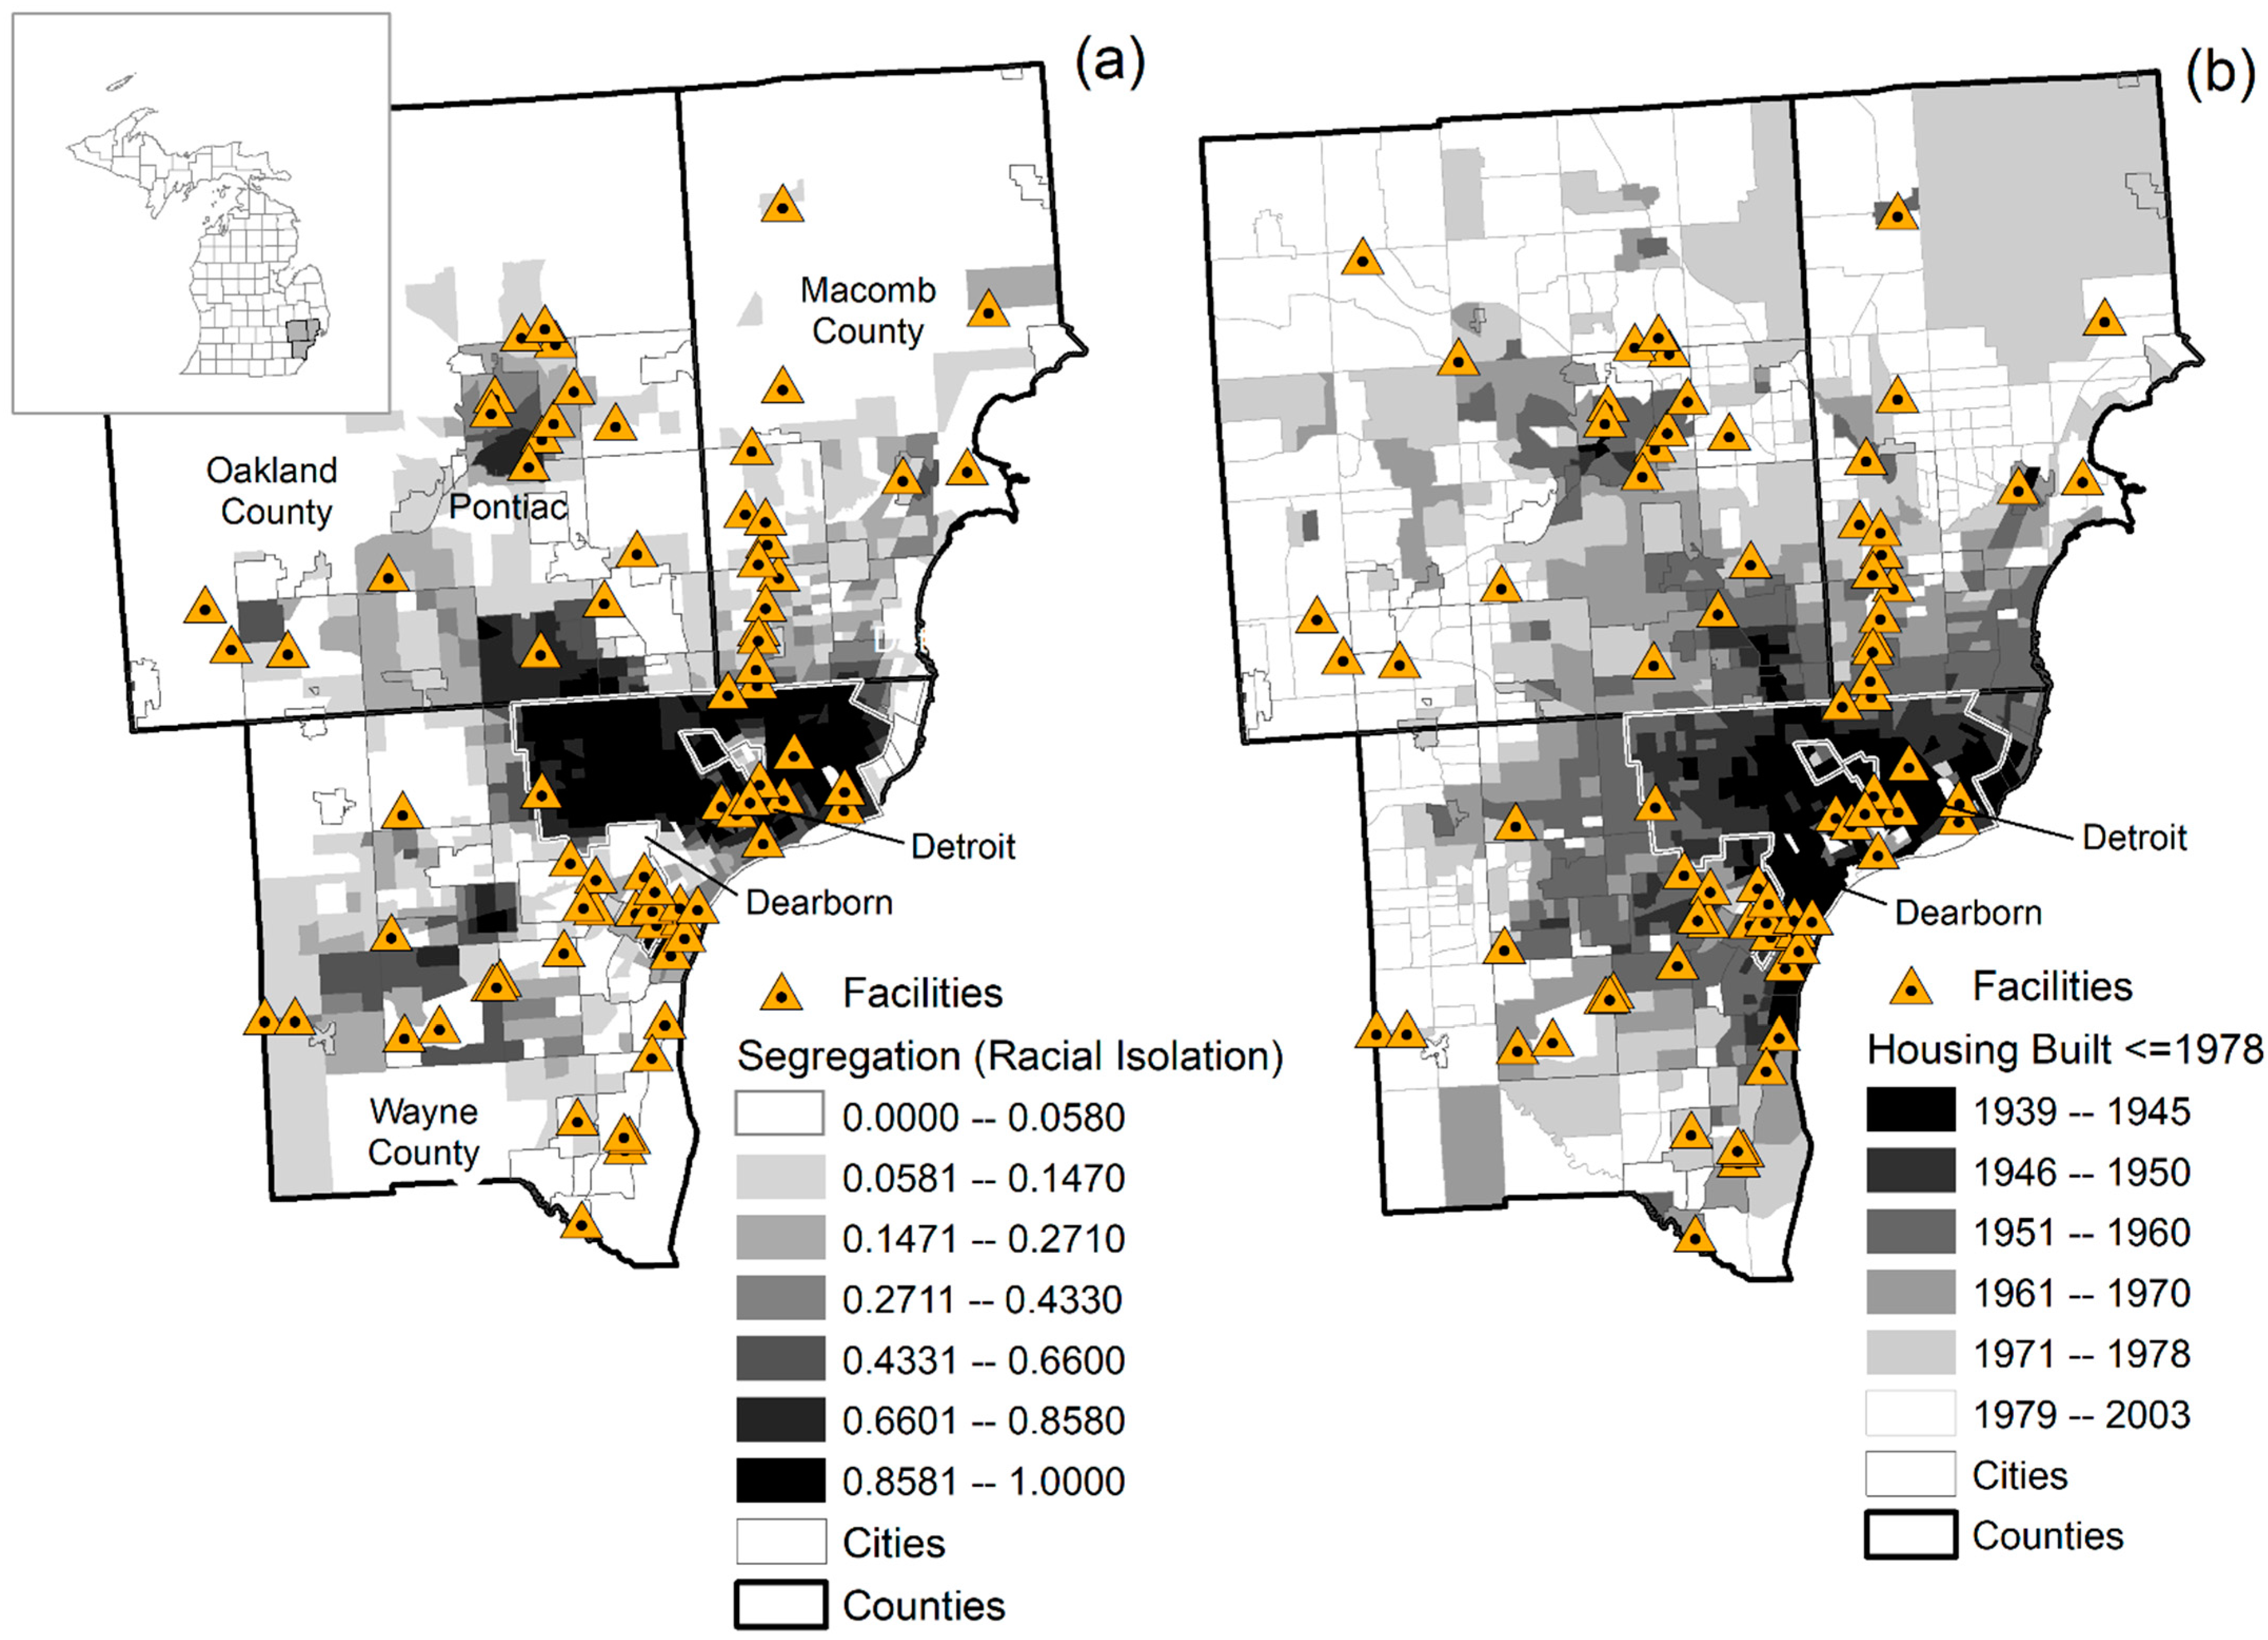
2.1. Study Area
2.2. Childhood BLLs
2.3. Lead Emissions and Modeling
2.4. Modeled Lead Emissions and Recipient Individuals’ BLLs
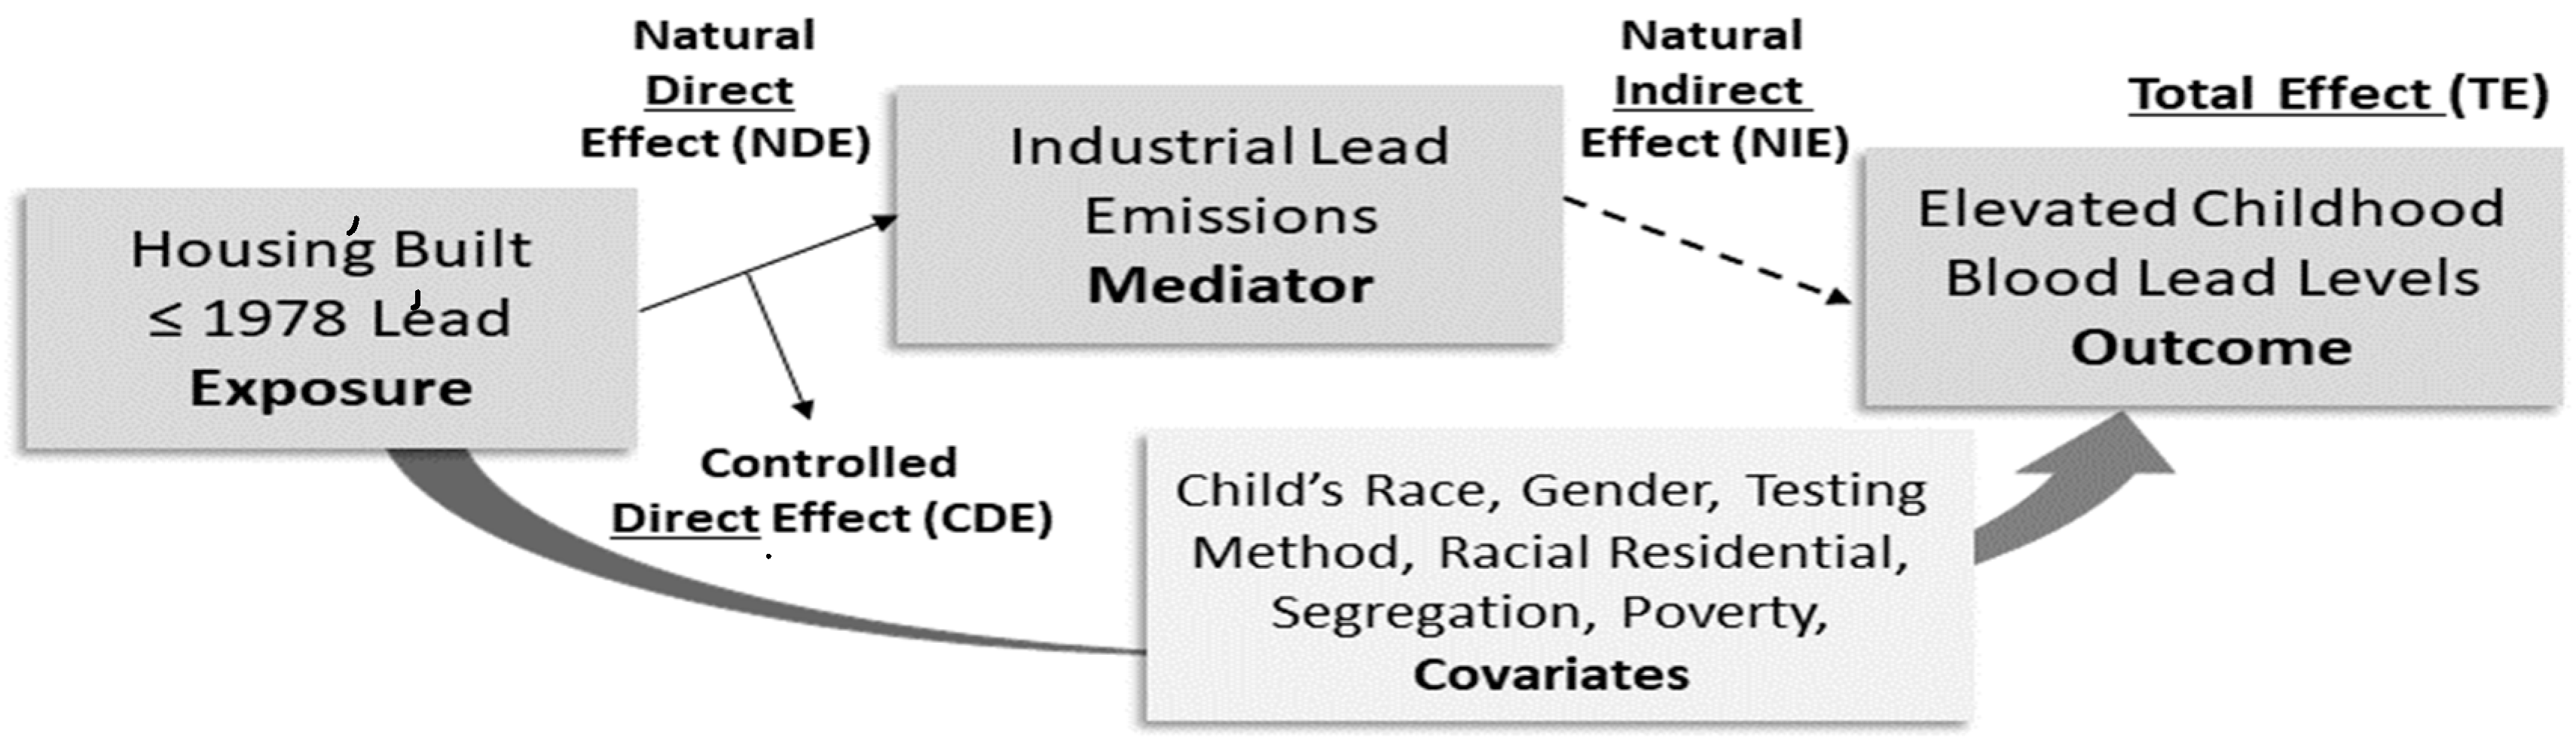
2.5. Causal Mediator Interaction Models
3. Results
3.1. Study Area
3.2. Childhood BLLs
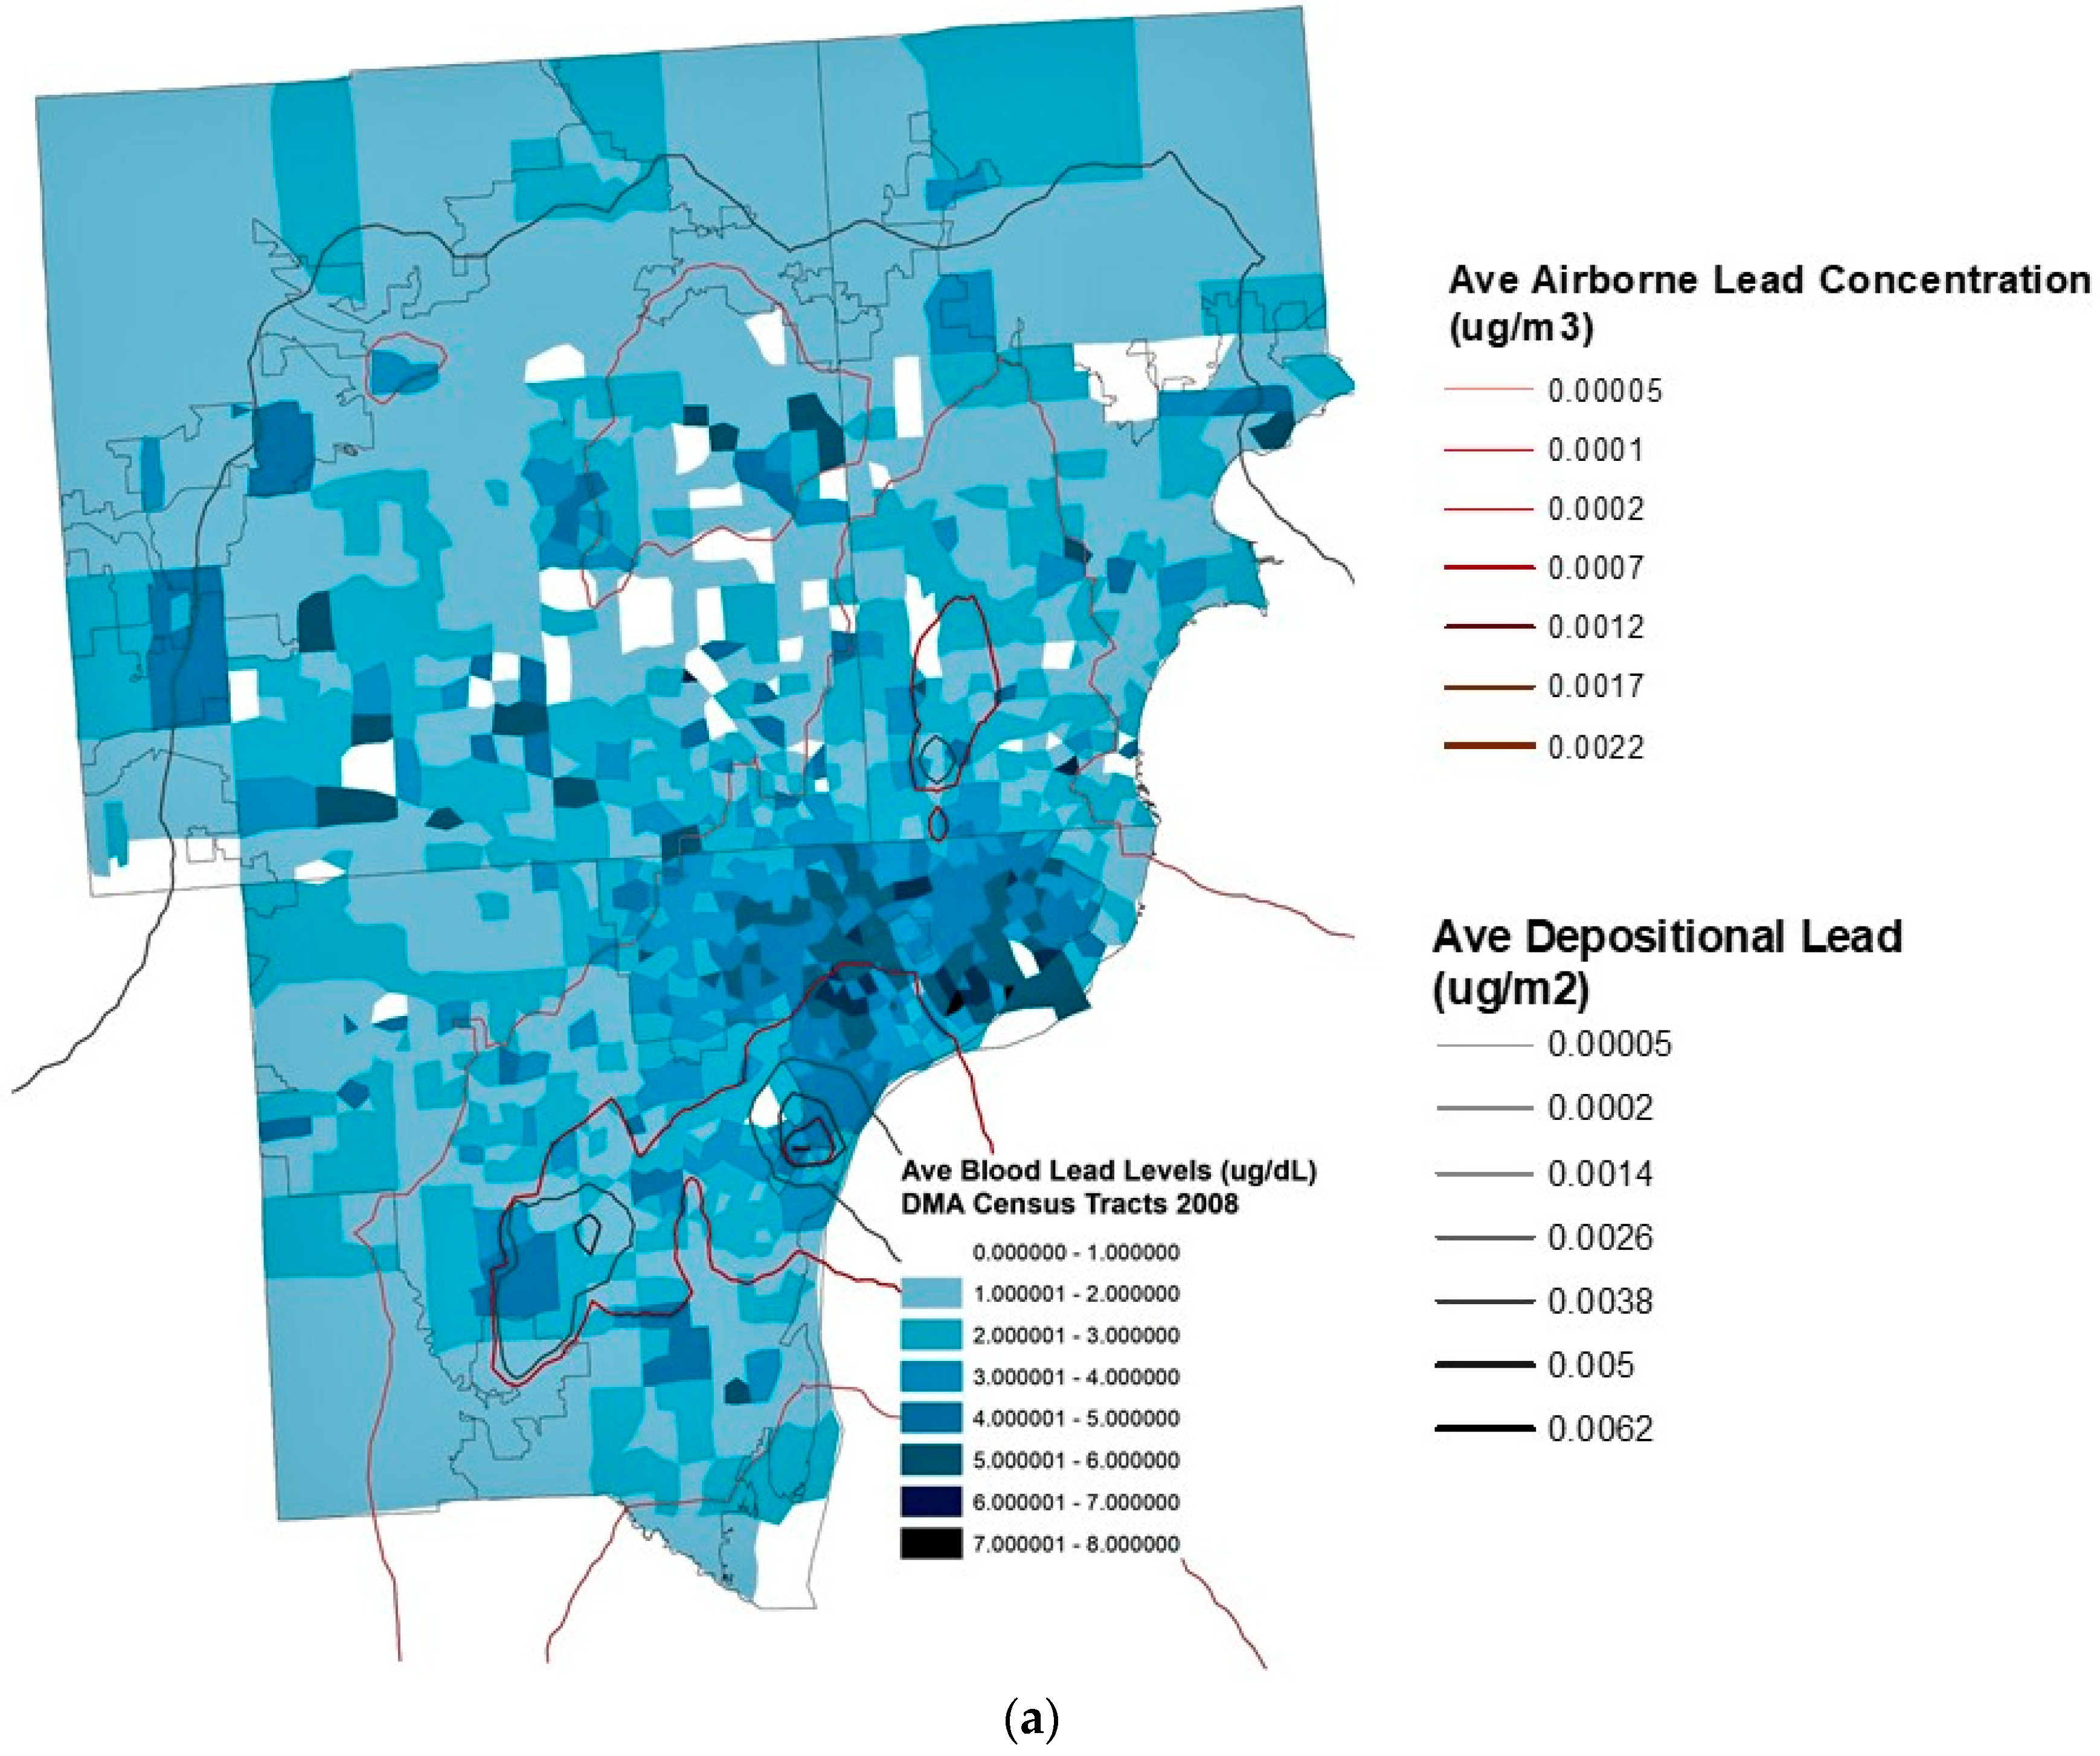
3.3. Lead Emissions and Modeling
3.4. Relationship between Industry Lead Emissions and BLLs
3.5. Causal Mediator Interaction Models
4. Discussion
5. Conclusions
Author Contributions
Funding
Institutional Review Board Statement
Informed Consent Statement
Data Availability Statement
Conflicts of Interest
Appendix A
References
- Moody, H.; Grady, S.C. Lead emissions and population vulnerability in the Detroit (Michigan, USA) Metropolitan Area, 2006–2013: A spatial and temporal analysis. Int. J. Environ. Res. Public Health 2017, 14, 1445. [Google Scholar] [CrossRef]
- Darden, J.; Malega, R.; Stallings, R. Social and economic consequences of black residential segregation by neighbourhood socioeconomic characteristics: The case of Metropolitan Detroit. Urban Stud. 2019, 56, 115–130. [Google Scholar] [CrossRef]
- Mohai, P.; Bryant, B. Is there a “race” effect on concern for environmental quality? Public Opin. Q. 1998, 62, 476–505. [Google Scholar] [CrossRef]
- Keeler, G.; Dvonch, T.; Yip, F.; Parker, E.; Israel, B.; Marsik, F.J.; Morishita, M.; Barres, J.A.; Robins, T.G.; Brakefield-Caldwell, W.; et al. Assessment of personal and community-level exposures to particulate matter among children with asthma in Detroit, Michigan, as part of Community Action Against Asthma (CAAA). Environ. Health Perspect. 2002, 110, 173–181. [Google Scholar] [CrossRef] [PubMed]
- Wu, Y.C.; Batterman, S. Proximity of schools in Detroit, Michigan to automobile and truck traffic. J. Expo. Sci. Environ. Epidemiol. 2006, 16, 457–470. [Google Scholar] [CrossRef]
- Downey, L. Environmental racial inequality in Detroit. Soc. Forces 2006, 85, 771–796. [Google Scholar] [CrossRef] [PubMed]
- Lee, S.; Mohai, P. Racial and socioeconomic assessments of neighborhoods adjacent to small-scale brownfield sites in the Detroit region. Environ. Pract. 2011, 13, 340–353. [Google Scholar] [CrossRef]
- Smith, C.L. Economic deprivation and environmental inequality in postindustrial Detroit. Organ. Environ. 2007, 20, 25–43. [Google Scholar] [CrossRef]
- Moody, H.; Darden, J.T.; Pigozzi, B.W. The racial gap in childhood blood lead levels related to socioeconomic position of residence in Metropolitan Detroit. Soc. Race Ethn. 2015, 16, 1–19. [Google Scholar] [CrossRef]
- Moody, H.; Darden, J.T.; Pigozzi, B.W. The relationship of neighborhood socioeconomic differences and racial residential segregation to childhood blood lead levels in Metropolitan Detroit. J. Urb. Health 2016, 93, 820–839. [Google Scholar] [CrossRef]
- Bellinger, D.C. Very low lead exposures and children’s neurodevelopment. Curr. Opin. Pediatrics 2008, 20, 172–177. [Google Scholar] [CrossRef] [PubMed]
- U.S. Agency for Toxic Substances and Disease Registry. ToxGuide for Lead Pb CAS#7439-92-1; Department of Health and Human Services, Public Health Service Agency for Toxic Substances and Disease Registry: Atlanta, GA, USA, 2020.
- Tian, H.; Cheng, K.; Wang, Y.; Zhao, D.; Lu, L.; Jia, W.; Hao, J. Temporal and spatial variation characteristics of atmospheric emissions of Cd, Cr, and Pb from coal in China. Atmos. Environ. 2012, 50, 157–163. [Google Scholar] [CrossRef]
- U.S. Environmental Protection Agency. Disposal of Coal Combustion Residuals from Electric Utilities Rulemakings. Available online: https://www.epa.gov/coalash/coal-ash-rule (accessed on 10 January 2020).
- Cao, S.; Duan, X.; Zhao, X.; Wang, B.; Ma, J.; Fan, D.; Sun, C.; He, B.; Wei, F.; Jiang, G. Isotopic ratio-based source apportionment of children’s blood lead around coking plant area. Environ. Int. 2014, 73, 158–166. [Google Scholar] [CrossRef] [PubMed]
- Pacyna, J.M.; Pacyna, E.G.; Aas, W. Changes of emissions and atmospheric deposition of mercury, lead, and cadmium. Atmos. Environ. 2009, 43, 117–127. [Google Scholar] [CrossRef]
- United Nations Economic Commission for Europe. Executive Body for the Convention on Long-Range Transboundary Air Pollution. Guidance Document on Best Available Techniques for Controlling Emissions of Heavy Metals and Their Compounds From the Source Categories Listed in Annex II to the Protocol on Heavy Metals. Available online: http://www.unece.org/fileadmin/DAM/env/documents/2012/EB/ECE_EB.AIR_116_E.pdf (accessed on 21 March 2017).
- Zhu, G.; Guo, Q.; Xiao, H.; Chen, T.; Yang, J. Multivariate statistical and lead isotopic analyses approach to identify heavy metal sources in topsoil from the industrial zone of Beijing Capital Iron and Steel Factory. Environ. Sci. Pollut. Res. 2017, 24, 14877–14888. [Google Scholar] [CrossRef] [PubMed]
- O’Rourke, D.; Connolly, S. Just oil? The distribution of environmental and social impacts of oil production and consumption. Ann. Rev. Environ. Resour. 2003, 28, 587–617. [Google Scholar] [CrossRef]
- Wang, S.; Kalkhajeh, Y.K.; Qin, Z.; Jiao, W. Spatial distribution and assessment of the human health risks of heavy metals in a retired petrochemical industrial area, South China. Environ. Res. 2020, 19, 109661. [Google Scholar] [CrossRef]
- Taylor, M.P.; Davies, P.J.; Kristensen, L.J.; Csavina, J.L. Licensed to pollute but not to poison: The ineffectiveness of regulatory authorities at protecting public health from atmospheric arsenic, lead and other contaminants resulting from mining and smelting operations. Aeolian Res. 2014, 14, 35–52. [Google Scholar] [CrossRef]
- Sullivan, M. Reducing lead in air and preventing childhood exposure near lead smelters learning from the US experience. NEW SOLUTIONS J. Environ. Occup. Health Policy 2015, 25, 78–101. [Google Scholar] [CrossRef] [PubMed]
- Yang, J.; Li, X.; Xiong, Z.; Wang, M.; Liu, Q. Environmental pollution effect analysis of lead compounds in China based on life cycle. Int. J. Environ. Res. Public Health 2020, 17, 2184. [Google Scholar] [CrossRef]
- Williams, R. New Permits Loosen Standards for Two of State’s Biggest Polluters. Available online: http://michiganradio.org/post/new-permits-loosen-standards-two-states-biggest-polluters (accessed on 15 May 2014).
- Matheny, K. Did State Agency Lobby to Bend Rules on Pollutants at Dearborn Steel Mill; Detroit Free Press: Detroit, MI, USA, 2014. [Google Scholar]
- Lanphear, B.P.; Dietrich, K.; Auinger, P.; Cox, C. Cognitive deficits associated with blood lead concentrations <10 microg/dL in U.S. children and adolescents. Public Health Rep. 2000, 115, 521–529. [Google Scholar] [CrossRef] [PubMed]
- Schnaas, L.; Rothenberg, S.J.; Perrom, E.; Martinez, S.; Hernandez, C.; Hernandez, R.M. Temporal pattern in the effect of postnatal blood lead level on intellectual development of young children. Neurotox. Teratol. 2000, 22, 805–810. [Google Scholar] [CrossRef]
- Lidsky, T.I.; Schneider, J.S. Lead neurotoxicity in children: Basic mechanisms and clinical correlates. Brain 2003, 126, 5–19. [Google Scholar] [CrossRef] [PubMed]
- Canfield, R.L.; Henderson, C.R.; Cory-Slechta, D.A.; Cox, C.; Jusko, T.A.; Lanphear, B.P. Intellectual impairment in children with blood lead concentrations below 10 μg per deciliter. N. Engl. J. Med. 2003, 348, 1517–1526. [Google Scholar] [CrossRef] [PubMed]
- Chiodo, L.M.; Jacobson, S.W.; Jacobson, J.L. Neurodevelopmental effects of postnatal lead exposure at very low levels. Neurotoxicol. Teratol. 2004, 26, 359–371. [Google Scholar] [CrossRef] [PubMed]
- Téllez-Rojo, M.M.; Bellinger, D.C.; Arroyo-Quiroz, C.; Lamadrid-Figueroa, H.; Mercado-Garcia, A.; Schnaas-Arrieta, L.; Wright, R.O.; Hérnandez-Avila, M.; Hu, H. Longitudinal associations between blood lead concentrations lower than 10 μg/dL and neurobehavioral development in environmentally exposed children in Mexico City. Pediatrics 2006, 118, 323–330. [Google Scholar] [CrossRef]
- Surkan, P.J.; Zhang, A.; Trachtenberg, F.; Daniel, D.B.; McKinlay, S.; Bellinger, D.C. Neuropsychological function in children with blood lead levels <10 μg/dL. Neurotoxicology 2007, 28, 1170–1177. [Google Scholar] [CrossRef] [PubMed]
- Miranda, M.L.; Kim, D.; Galeano, M.A.O.; Paul, C.J.; Hull, A.P.; Morgan, S.P. The relationship between early childhood blood lead levels and performance on end-of-grade tests. Environ. Health Persp. 2007, 115, 1242–1247. [Google Scholar] [CrossRef]
- Grandjean, P.; Landrigan, P.J. Neurobehavioural effects of developmental toxicity. Lancet Neurol. 2014, 13, 330–338. [Google Scholar] [CrossRef]
- Maantay, J. Mapping environmental injustices: Pitfalls and potential of geographic information systems in assessing environmental health and equity. Environ. Health Perspect. 2002, 110, 161–171. [Google Scholar] [CrossRef]
- U.S. Census Bureau. ACS QuickFacts. Available online: https://www.census.gov/quickfacts/detroitcitymichigan (accessed on 20 May 2019).
- Logan, J.R.; Stults, F. The persistence of segregation in the metropolis: New findings from the 2010 census. In Census Brief. Prepared for Project US2010; Census Brief Prepared for Project US2010: Rhode Island, RI, USA, 2011. [Google Scholar]
- U.S. Census Bureau. American Community Survey 2009–2013. 5-Year Estimate Census of Population and Housing (SF3): Michigan. Available online: https://data.census.gov/cedsci/all?q=5-year%20estimate%20census%20of%20population%20and%20housing%20%28SF3%29 (accessed on 20 May 2018).
- Massey, D.S.; Brodmann, S. Spheres of Influence: The Social Ecology of Racial and Class Inequality; Russell Sage Foundation: New York, NY, USA, 2014; pp. 1–351. [Google Scholar]
- Massey, D.S.; Tannen, J. A research note on trends in black hypersegregation. Demography 2015, 52, 1025–1034. [Google Scholar] [CrossRef]
- U.S. Census Bureau. American Community Survey 2014. 5-Year Estimates of Race (SF3): Michigan. Available online: https://data.census.gov/cedsci/all?q=5-year%20estimate%20census%20of%20population%20and%20housing%20%28SF3%29 (accessed on 11 February 2021).
- U.S. Census Bureau. American Community Survey 2018. 5-Year Estimates of Housing (SF3): Michigan. Available online: https://data.census.gov/cedsci/all?q=5-year%20estimate%20census%20of%20population%20and%20housing%20%28SF3%29. (accessed on 11 February 2021).
- Department of Health and Human Services, Centers for Disease Control and Prevention. Fourth National Report on Human Exposure to Environmental Chemicals: Quality Assurance of Chemical Measurements. Available online: https://www.cdc.gov/exposurereport/index.html (accessed on 5 March 2021).
- U.S. Census Bureau. Summary File 1. American FactFinder. 2006–2010 5-Year Estimate Census of Population and Housing (SF3): Michigan. Available online: https://data.census.gov/cedsci/all?q=2006%E2%80%932010%205-year%20Estimate%20Census%20of%20Population%20and%20Housing%20%28SF3%29 (accessed on 20 May 2019).
- Environmental Systems Research Institute. ArcGIS Desktop: Release 10.6. Available online: https://desktop.arcgis.com/en/arcmap/10.6/get-started/setup/arcgis-desktop-system-requirements.htm (accessed on 5 March 2021).
- Dignam, T.; Kaufmann, R.B.; LeStourgeon, L.; Brown, M.J. Control of lead sources in the United States, 1970-2017: Public health progress and current challenges to eliminating lead exposure. J. Public Health Manag. Pract. 2019, 25, S13. [Google Scholar] [CrossRef] [PubMed]
- U.S. Department of Housing and Urban Development. American Healthy Homes Survey: Lead and Arsenic Findings. Available online: http://portal.hud.gov/hudportal/documents/huddoc?id=AHHS_REPORT.pdf (accessed on 28 January 2020).
- Centre for Multilevel Modelling University of Bristol. MLwiN, Version 2.23; Centre for Multilevel Modelling University of Bristol: Bristol, UK, 2020. [Google Scholar]
- StataCorp LLP. Stata Desktop. Version 16. Available online: https://www.stata.com/ (accessed on 8 January 2020).
- Reardon, S.F.; Firebaugh, G. Measures of multigroup segregation. Soc. Method. 2002, 32, 33–67. [Google Scholar] [CrossRef]
- Reardon, S.F.; Townsend, J.B. ‘SEG’ module available in STATA. From Reardon, S.F.; Firebaugh, G. Measures of multigroup segregation. Soc. Method. 2002, 32, 33–67. [Google Scholar] [CrossRef]
- SAS Inc. SAS Customer Support. 2021. Available online: https://support.sas.com/documentation/onlinedoc/stat/143/causalmed.pdf (accessed on 8 January 2021).
- Michigan Department of Environment Great Lakes and Energy. Michigan Air Emissions Reporting System: User Guide. Available online: http://www.michigan.gov/documents/deq/deq-oppca-workbook-maers_307061_7.pdf (accessed on 14 October 2017).
- Accredited Language. From the Middle East to the Midwest: Arabic in Dearborn. Available online: https://www.alsintl.com/blog/arabic-in-dearborn-michigan/ (accessed on 11 February 2021).
- Maantay, L. What is environmental justice? What is fairness? In The Routledge Companion to Environmental Planning; Davoudi, S., Cowell, R., White, I., Blanco, H., Eds.; Routledge: Philadelphia, PA, USA, 2019; pp. 207–221. [Google Scholar]
- U.S. Environmental Protection Agency. AERMOD Implementation Guide Model Supporting Documents: AERMOD Deposition Algorithms-Science Document (Revised Draft); Office of Air Quality Planning and Standards, Air Quality Assessment Division, 2019; Research Triangle Park: North Carolina, NC, USA, 2004. [Google Scholar]
- Wells, C.W. Environmental Justice in Postwar America: A Documentary Reader; University of Washington Press: Seattle, WA, USA, 2018; pp. 1–161. [Google Scholar]
- Bullard, R.D. Race and environmental justice in the United States. Yale J. Int’l L. 1993, 18, 319. [Google Scholar]
- Reuben, R.; Caspi, A.; Belsky, D.W.; Broadbent, J.; Harrington, H.; Sugden, K.; Houts, R.M.; Ramrakha, S.; Poulton, R.; Moffitt, T.E. Association of childhood blood lead levels with cognitive function and socioeconomic status at age 38 years and with IQ change and socioeconomic mobility between childhood and adulthood. JAMA 2017, 317, 1244–1251. [Google Scholar] [CrossRef] [PubMed]
- Grady, S.C. Racial disparities in low birthweight and the contribution of residential segregation: A multilevel analysis. Soc. Sci. Med. 2006, 63, 3013–3029. [Google Scholar] [CrossRef]
- Grady, S.C.; McLafferty, S. Segregation, nativity, and health: Reproductive health inequalities for immigrant and native-born black women in New York City. Urban. Geogr. 2007, 28, 377–397. [Google Scholar] [CrossRef]
- U.S. Environmental Protection Agency. Federal Register. Revision to the Guideline on Air Quality Models: Enhancement to the AERMOD Dispersion Modeling System and Incorporation of Approaches to Address Ozone and Fine Particulate Matter; Proposed Rule. Office of Air Quality Planning and Standards, 2015; Research Triangle Park: North Carolina, NC, USA, 2015; Volume 80, No. 145. [Google Scholar]
- Cimorelli, A.J.; Perry, S.G.; Venkatram, A.; Weil, J.C.; Paine, R.J.; Peters, W.D. AERMOD: Description of model formulation. U.S. Environmental Protection Agency OoAQPaS, Emissions, Monitoring, and Analysis Division, Environmental Protection Agency; Office of Air Quality Planning and Standards, Emissions, Monitoring, and Analysis Division: North Carolina, NC, USA, 2004.
- U.S. Environmental Protection Agency. AERMOD implementation guide. Office of Air Quality Planning and Standards, Air Quality Assessment Division; Research Triangle Park: North Carolina, NC, USA, 2015. [Google Scholar]


| Variables | ||||||||
|---|---|---|---|---|---|---|---|---|
| 2006 | 2007 | 2008 | 2009 | 2010 | 2011 | 2012 | 2013 | |
| Sex | ||||||||
| Male = 0 | 29,722 (51.90) | 27,701 (52.10) | 24,726 (51.80) | 24,101 (51.50) | 22,426 (51.40) | 22,544 (51.50) | 22,739 (51.90) | 25,759 (51.40) |
| Female = 1 | 27,507 (48.10) | 25,430 (47.90) | 23,022 (48.20) | 22,664 (48.50) | 21,169 (48.60) | 21,201 (48.50) | 21,039 (48.10) | 24,362 (48.60) |
| Total/Mean/Std Dev | 57,229/0.48/0.50 | 53,131/0.48/0.50 | 47,748/0.48/0.50 | 46,765/0.48/0.50 | 43,595/0.49/0.50 | 43,745/0.48/0.60 | 43,778/0.48/0.50 | 50,121/0.49/0.50 |
| Age in Years | ||||||||
| 0–2 | 14,419 (25.20) | 16,066 (30.23) | 16,866 (35.32) | 18,800 (40.20) | 19,025 (43.64) | 21,500 (49.15) | 22,662 (51.77) | 27,615 (55.10) |
| 2.1–6 | 33,600 (58.71) | 28,375 (53.41) | 23,803 (49.85) | 22,000 (47.04) | 19,734 (45.27) | 18,365 (41.98) | 18,045 (41.22) | 19,888 (39.68) |
| >6 to 16 | 9210 (16.09) | 8690 (16.36) | 7079 (14.83) | 5965 (12.76) | 4836 (11.09) | 3880 (8.87) | 3071 (7.01) | 2618 (5.22) |
| Total/Mean/Std Dev | 57,229/4.04/2.85 | 53,131/3.87/2.91 | 47,748/3.65/2.97 | 46,765/3.37/2.88 | 43,595/3.19/2.81 | 43,745/2.91/2.69 | 43,778/2.71/2.53 | 50,121/2.48/2.23 |
| Race/Ethnicity | ||||||||
| Non-Hispanic Black = 1 | 26,090 (45.60) | 21,452 (40.40) | 16,769 (35.10) | 15,939 (34.10) | 15,455 (35.50) | 15,229 (34.80) | 15,694 (35.80) | 18,283 (36.50) |
| Non-Hispanic White = 2 | 17,358 (30.30) | 18,181 (6.60) | 18,921 (39.60) | 19,261 (41.20) | 18,131 (41.60) | 18,179 (41.60) | 17,684 (40.40) | 20,299 (40.50) |
| Hispanic = 3 | 4030 (7.00) | 3500 (6.60) | 2875 (6.00) | 2530 (5.40) | 2353 (5.40) | 2386 (5.50) | 2487 (5.70) | 2741 (5.50) |
| Native Hawaiian or Pacific Islander = 4 | 64 (0.10) | 57 (0.10) | 60 (0.20) | 67 (0.10) | 97 (0.20) | 144 (0.30) | 150 (0.30) | 285 (0.50) |
| Asian = 5 | 605 (1.10) | 693 (1.30) | 765 (1.60) | 824 (1.80) | 813 (1.80) | 959 (2.20) | 904 (2.10) | 1162 (2.30) |
| Arab = 6 | 153 (0.30) | No Longer Reported | No Longer Reported | No Longer Reported | No Longer Reported | No Longer Reported | No Longer Reported | No Longer Reported |
| American Indian or Native Alaskan = 7 | 28 (0.00) | 143 (0.30) | 159 (0.40) | 184 (0.40) | 186 (0.40) | 138 (0.30) | 136 (0.30) | 180 (0.40) |
| Mixed Race = 8 | 28 (0.00) | 19 (0.00) | 16 (0.00) | 11 (0.00) | 35 (0.10) | 28 (0.10) | 43 (0.10) | 54 (0.10) |
| No Report = 9 | 8901 (15.60) | 9086 (17.10) | 8183 (17.10) | 7949 (17.00) | 6525 (15.00) | 6682 (15.20) | 6680 (15.3) | 7117 (14.20) |
| Total | 57,229 | 53,131 | 47,748 | 46,765 | 43,595 | 43,745 | 43,778 | 50,121 |
| BLL µg/dL Cases | 57,229 (100.00) | 53,131 (100.00) | 47,748 (100.00) | 46,765 (100) | 43,595 (100) | 43,745 (100) | 43,778 (100) | 50,121 (100) |
| † Mean/Stan Dev | 3.05/2.98 | 2.78/2.69 | 2.50/2.75 | 2.43/2.59 | 2.28/2.54 | 2.15/2.18 | 2.00/2.05 | 2.00/2.09 |
| % ≥5 µg/dL | 17.38 | 14.22 | 10.67 | 9.21 | 7.42 | 5.65 | 5.21 | 4.37 |
| Blood Collection Method | ||||||||
| Capillary = 0 | 9886 (17.30) | 8389 (15.80) | 9225 (19.30) | 10,727 (22.90) | 10,642 (24.40) | 12,225 (27.90) | 13,474 (30.80) | 18,678 (37.30) |
| Intravenous = 1 | 47,343 (82.70) | 44,742 (84.20) | 38,523 (80.70) | 36,038 (77.10) | 32,953 (75.60) | 31,520 (72.10) | 30,304 (69.20) | 31,443 (62.70) |
| Total/Mean/Std Dev | 57,229/0.83/0.38 | 53,131/0.84/0.37 | 47,748/0.81/0.40 | 46,765/0.77/0.42 | 43,595/0.75/0.43 | 43,745/0.72/0.45 | 43,778/0.69/0.46 | 50,121/0.63/0.48 |
| 1.0 µg/dL Reports | 16,365 (28.60) | 18,199 (34.25) | 20,029 (41.95) | 17,776 (38.01) | 18,555 (42.56) | 18,130 (41.44) | 23,885 (54.56) | 26.507 (52.89) |
| Insurance Coverage Type | ||||||||
| Non-Medicaid = 0 | 12,867 (22.50) | 14,341 (27.00) | 14,585 (30.50) | 14,120 (30.20) | 10,642 (24.40) | 12,951 (29.60) | 12,119 (27.70) | 13,559 (27.10) |
| Medicaid = 1 | 44,362 (77.50) | 38,790 (73.00) | 33,163 (69.50) | 32,645 (69.80) | 32,953 (75.60) | 30,794 (70.40) | 31,659 (72.30) | 36,562 (72.90) |
| Total/Mean/Std Dev | 57,229/0.78/0.42 | 53,131/0.73/0.44 | 47,748/0.69/0.46 | 46,765/0.70/0.46 | 43,595/0.71/0.45 | 43,745/0.70/0.46 | 43,778/0.72/0.45 | 50,121/0.74/0.44 |
| Total Pounds Lead Emitted | ||||||||
| Wayne County (Detroit) | 1483 (68.03) | 1809 (69.95) | 1559 (46.89) | 1051 (59.28) | 981 (88.62) | 930 (93.28) | 1242 (98.26) | 1431 (99.17) |
| Macomb County | 55 (2.52) | 87 (3.36) | 38 (1.14) | 30 (1.69) | 9 (0.81) | 15 (1.50) | 6 (0.47) | 1 (0.07) |
| Oakland County | 642 (29.45) | 690 (26.68) | 1728 (51.97) | 692 (39.03) | 117 (10.57) | 52 (5.22) | 16 (1.27) | 11 (0.76) |
| Total: | 2180 | 2586 | 3325 | 1773 | 1107 | 997 | 1264 | 1443 |
| Mean Modeled Total Lead | ||||||||
| Deposition, DMA (µg/m2) | 0.00225 | 0.001164 | 0.00134 | 0.000867 | 0.001237 | 0.001197 | 0.001966 | 0.002113 |
| Mean Modeled Airborne | ||||||||
| Emissions, DMA (µg/m3) | 0.000994 | 0.000244 | 0.000324 | 0.000145 | 0.000296 | 0.000206 | 0.000378 | 0.000507 |
| 2006 | 2007 | 2008 | 2009 | 2010 | 2011 | 2012 | 2013 | |
|---|---|---|---|---|---|---|---|---|
| Modeled Total Lead Deposition (Wet plus Dry) (µg/m2) | 0.022 n = 57,229 | 0.047 n = 53,131 | 0.087 n = 47,748 | 0.047 n = 46,765 | 0.139 n = 43,595 | 0.059 n = 43,745 | 0.037 n = 43,778 | 0.046 n = 50,121 |
| Modeled Airborne Lead Emissions (µg/m3) | 0.048 n = 57,229 | 0.059 n = 53,131 | 0.092 n = 47,748 | 0.080 n = 46,765 | 0.115 n = 43,595 | 0.067 n = 43,745 | 0.066 n = 43,778 | 0.062 n = 50,121 |
| 2006 | 2007 | 2008 | 2009 | 2010 | 2011 | 2012 | 2013 | |
|---|---|---|---|---|---|---|---|---|
| Modeled Total Lead Deposition (Wet plus Dry) (µg/m2) | 24.82 n = 57,229 | 41.853 n = 53,131 | 59.698 n = 47,748 | 23.472 n = 46,765 | 132.029 n = 43,595 | 54.003 n = 43,745 | 24.507 n = 43,778 | 43.982 n = 50,121 |
| Modeled Airborne Lead Emissions (µg/m3) | 258.727 n = 57,229 | 236.26 n = 53,131 | 361.895 n = 47,748 | 354.539 n = 46,765 | 564.149 n = 43,595 | 306.202 n = 43,745 | 291.275 n = 43,778 | 293.662 n = 50,121 |
| Interaction Term | ||||||||
| Total Deposition | 60.764 | 74.576 | 77.015 | 77.504 | 144.503 | 80.85 | 44.937 | 69.053 |
| Lead * Housing | −0.024 | −0.026 | −0.013 | −0.015 | −0.017 | −0.014 | −0.014 | −0.010 |
| Gender | −0.027 | −0.024 | −0.016 | −0.007 | −0.008 | −0.006 | −0.007 | −0.007 |
| Race/Ethnicity | n = 57,181 | n = 53,067 | n = 47,691 | n = 46,719 | n = 43,545 | n = 43,676 | n = 43,733 | n = 50,063 |
| Interaction Term | ||||||||
| Airborne Lead * | 392.084 | 328.556 | 423.139 | 435.933 | 577.506 | 314.628 | 383.016 | 384.383 |
| Housing | −0.024 | −0.026 | −0.013 | −0.015 | −0.017 | −0.014 | −0.014 | −0.010 |
| Gender | −0.027 | −0.024 | −0.016 | −0.007 | −0.008 | −0.005 | −0.007 | −0.007 |
| Race/Ethnicity | n = 57,181 | n = 53,067 | n = 47,691 | n = 46,719 | n = 43,545 | n = 43,676 | n = 43,733 | n = 50,063 |
| Average Depositional Lead | Average Airborne Lead Concentration | |||||
|---|---|---|---|---|---|---|
| β 1 | 95% LCI, UCI | β | 95% LCI, UCI | |||
| 2008 | ||||||
| Total (Direct + Indirect) Effect (TE) | 0.21 | 0.20 | 0.23 | 0.20 | 0.18 | 0.21 |
| Controlled Direct Effect (CDE) | 0.16 | 0.14 | 0.18 | 0.14 | 0.12 | 0.15 |
| Natural Direct Effect (NDE) | 0.10 | 0.08 | 0.11 | 0.10 | 0.07 | 0.10 |
| Natural Indirect Effect (NIE) | 0.12 | 0.11 | 0.13 | 0.11 | 0.10 | 0.12 |
| Percentage Mediated (PM) | 54.42 | 50.34 | 58.50 | 56.55 | 52.28 | 60.82 |
| Percentage Due to Interaction (PAI) | 28.20 | 26.15 | 31.84 | 25.38 | 22.14 | 28.61 |
| Percentage Eliminated (PE) | 25.42 | 22.30 | 28.55 | 31.17 | 27.41 | 34.93 |
| 2010 | ||||||
| Total (Direct + Indirect) Effect (TE) | 0.20 | 0.18 | 0.21 | 0.19 | 0.18 | 0.21 |
| Controlled Direct Effect (CDE) | 0.15 | 0.13 | 0.16 | 0.14 | 0.13 | 0.16 |
| Natural Direct Effect (NDE) | 0.12 | 0.10 | 0.12 | 0.11 | 0.10 | 0.12 |
| Natural Indirect Effect (NIE) | 0.09 | 0.08 | 0.10 | 0.09 | 0.08 | 0.09 |
| Percentage Mediated (PM) | 44.37 | 40.72 | 48.01 | 43.97 | 40.50 | 47.43 |
| Percentage Due to Interaction (PAI) | 18.90 | 16.13 | 21.67 | 17.58 | 14.57 | 20.60 |
| Percentage Eliminated (PE) | 25.47 | 22.30 | 28.63 | 26.38 | 23.01 | 29.76 |
| 2011 | ||||||
| Total (Direct + Indirect) Effect (TE) | 0.12 | 0.10 | 0.13 | 0.12 | 0.11 | 0.13 |
| Controlled Direct Effect (CDE) | 0.12 | 0.11 | 0.13 | 0.11 | 0.10 | 0.13 |
| Natural Direct Effect (NDE) | 0.11 | 0.10 | 0.12 | 0.10 | 0.09 | 0.11 |
| Natural Indirect Effect (NIE) | 0.00 (ns) | −0.00 | 0.01 | 0.02 | 0.01 | 0.03 |
| Percentage Mediated (PM) | 2.77 (ns) | −2.74 | 8.29 | 16.37 | 11.98 | 20.76 |
| Percentage Due to Interaction (PAI) | 5.72 (ns) | 1.19 | 10.25 | 8.97 | 4.43 | 13.50 |
| Percentage Eliminated (PE) | −2.95 (ns) | −6.31 | 0.42 | 7.41 | 4.14 | 10.68 |
| Average Lead Deposition | Average Airborne Lead Concentration | |||||||||||
|---|---|---|---|---|---|---|---|---|---|---|---|---|
| β 1 | 95% LCI, UCI | β | 95% LCI, UCI | β | 95% LCI, UCI | β | 95% LCI, UCI | |||||
| 2008 | Black Children | White Children | Black Children | White Children | ||||||||
| Total (Direct + Indirect) Effect (TE) | 0.19 | 0.18 | 0.21 | 0.21 | 0.19 | 0.23 | 0.15 | 0.14 | 0.17 | 0.12 | 0.15 | 0.18 |
| Controlled Direct Effect (CDE) | 0.15 | 0.13 | 0.17 | 0.15 | 0.13 | 0.17 | 0.09 | 0.07 | 0.11 | 0.09 | 0.07 | 0.10 |
| Natural Direct Effect (NDE) | 0.08 | 0.06 | 0.09 | 0.09 | 0.08 | 0.11 | 0.03 | 0.01 | 0.04 | 0.04 | 0.02 | 0.05 |
| Natural Indirect Effect (NIE) | 0.12 | 0.11 | 0.13 | 0.12 | 0.11 | 0.13 | 0.13 | 0.12 | 0.14 | 0.13 | 0.12 | 0.14 |
| Percentage Mediated (PM) | 61.02 | 55.70 | 66.33 | 56.35 | 51.75 | 60.94 | 83.41 | 75.58 | 91.23 | 77.89 | 70.95 | 84.83 |
| Percentage Due to Interaction (PAI) | 25.54 | 22.59 | 28.49 | 31.24 | 27.97 | 34.51 | 30.81 | 26.77 | 34.86 | 35.39 | 31.10 | 39.68 |
| Percentage Eliminated (PE) | 23.47 | 19.54 | 27.40 | 29.32 | 25.76 | 32.88 | 42.25 | 35.84 | 48.66 | 46.07 | 40.14 | 51.99 |
| 2010 | Black Children | White Children | Black Children | White Children | ||||||||
| Total (Direct + Indirect) Effect (TE) | 0.18 | 0.17 | 0.19 | 0.17 | 0.16 | 0.19 | 0.176 | 0.16 | 0.19 | 0.18 | 0.17 | 0.12 |
| Controlled Direct Effect (CDE) | 0.13 | 0.11 | 0.14 | 0.13 | 0.11 | 0.14 | 0.124 | 0.11 | 0.14 | 0.12 | 0.11 | 0.14 |
| Natural Direct Effect (NDE) | 0.09 | 0.08 | 0.10 | 0.09 | 0.07 | 0.10 | 0.079 | 0.07 | 0.09 | 0.08 | 0.07 | 0.10 |
| Natural Indirect Effect (NIE) | 0.09 | 0.08 | 0.10 | 0.09 | 0.08 | 0.10 | 0.097 | 0.09 | 0.11 | 0.10 | 0.09 | 0.11 |
| Percentage Mediated (PM) | 49.38 | 44.94 | 53.81 | 50.61 | 45.99 | 55.23 | 55.28 | 50.58 | 59.97 | 53.70 | 49.26 | 58.15 |
| Percentage Due to Interaction (PAI) | 23.64 | 20.35 | 26.93 | 21.74 | 18.63 | 24.85 | 21.21 | 17.79 | 24.62 | 23.45 | 19.80 | 27.10 |
| Percentage Eliminated (PE) | 29.31 | 25.52 | 33.11 | 27.54 | 23.61 | 31.48 | 29.69 | 25.20 | 34.20 | 31.70 | 27.45 | 35.94 |
| 2011 | Black Children | White Children | Black Children | White Children | ||||||||
| Total (Direct + Indirect) Effect (TE) | 0.10 | 0.088 | 0.11 | 0.10 | 0.09 | 0.12 | 0.11 | 0.10 | 0.13 | 0.12 | 0.10 | 0.13 |
| Controlled Direct Effect (CDE) | 0.10 | 0.09 | 0.11 | 0.09 | 0.09 | 0.11 | 0.10 | 0.09 | 0.12 | 0.10 | 0.09 | 0.12 |
| Natural Direct Effect (NDE) | 0.09 | 0.08 | 0.10 | 0.09 | 0.08 | 0.11 | 0.08 | 0.07 | 0.09 | 0.08 | 0.07 | 0.09 |
| Natural Indirect Effect (NIE) | 0.01 | 0.01 | 0.02 | 0.01 | 0.01 | 0.02 | 0.04 | 0.03 | 0.04 | 0.04 | 0.03 | 0.04 |
| Percentage Mediated (PM) | 12.00 | 5.61 | 18.39 | 11.95 | 5.61 | 18.30 | 31.36 | 25.92 | 36.80 | 30.22 | 25.22 | 35.23 |
| Percentage Due to Interaction (PAI) | 9.44 | 4.23 | 14.65 | 9.79 | 4.41 | 15.18 | 13.69 | 9.16 | 18.23 | 16.82 | 11.47 | 22.18 |
| Percentage Eliminated (PE) | 1.97 | −2.30 | 6.24 | 2.36 | −1.87 | 6.57 | 11.95 | 7.09 | 16.81 | 15.14 | 10.95 | 19.33 |
Publisher’s Note: MDPI stays neutral with regard to jurisdictional claims in published maps and institutional affiliations. |
© 2021 by the authors. Licensee MDPI, Basel, Switzerland. This article is an open access article distributed under the terms and conditions of the Creative Commons Attribution (CC BY) license (http://creativecommons.org/licenses/by/4.0/).
Share and Cite
Moody, H.A.; Grady, S.C. Lead Emissions and Population Vulnerability in the Detroit Metropolitan Area, 2006–2013: Impact of Pollution, Housing Age and Neighborhood Racial Isolation and Poverty on Blood Lead in Children. Int. J. Environ. Res. Public Health 2021, 18, 2747. https://doi.org/10.3390/ijerph18052747
Moody HA, Grady SC. Lead Emissions and Population Vulnerability in the Detroit Metropolitan Area, 2006–2013: Impact of Pollution, Housing Age and Neighborhood Racial Isolation and Poverty on Blood Lead in Children. International Journal of Environmental Research and Public Health. 2021; 18(5):2747. https://doi.org/10.3390/ijerph18052747
Chicago/Turabian StyleMoody, Heather A., and Sue C. Grady. 2021. "Lead Emissions and Population Vulnerability in the Detroit Metropolitan Area, 2006–2013: Impact of Pollution, Housing Age and Neighborhood Racial Isolation and Poverty on Blood Lead in Children" International Journal of Environmental Research and Public Health 18, no. 5: 2747. https://doi.org/10.3390/ijerph18052747
APA StyleMoody, H. A., & Grady, S. C. (2021). Lead Emissions and Population Vulnerability in the Detroit Metropolitan Area, 2006–2013: Impact of Pollution, Housing Age and Neighborhood Racial Isolation and Poverty on Blood Lead in Children. International Journal of Environmental Research and Public Health, 18(5), 2747. https://doi.org/10.3390/ijerph18052747