Article

Estimating the Economic Burden of Low Health Literacy in the Blacktown Community in Sydney, Australia: A Population-Based Study

1
School of Business, Western Sydney University, Parramatta, NSW 2150, Australia
2
Translational Health Research Institute, Western Sydney University, Campbelltown, NSW 2560, Australia
3
Intensive Care Unit, Blacktown Hospital, Blacktown, NSW 2148, Australia
4
School of Medicine, Western Sydney University, Penrith, NSW 2751, Australia
*
Author to whom correspondence should be addressed.
Int. J. Environ. Res. Public Health 2021, 18(5), 2303; https://doi.org/10.3390/ijerph18052303
Submission received: 4 February 2021 / Revised: 19 February 2021 / Accepted: 23 February 2021 / Published: 26 February 2021
(This article belongs to the Special Issue Health Literacy and Health Equity)

Abstract

:
Evidence shows that inadequate or low health literacy (LHL) levels are significantly associated with economic ramifications at the individual, employer, and health care system levels. Therefore, this study aims to estimate the economic burden of LHL among a culturally and linguistically diverse (CALD) community in Blacktown: a local government area (LGA) in Sydney, Australia. This study is a secondary analysis of cross-sectional data from publicly available datasets, including 2011 and 2016 census data and National Health Survey (NHS) data (2017–2018) from the Australian Bureau of Statistics (ABS), and figures on Disease Expenditure in Australia for 2015–2016 provided by the Australian Institute of Health and Welfare (AIHW). This study found that 20% of Blacktown residents reported low levels of active engagement with health care providers (Domain 6 of the Health Literacy Questionnaire (HLQ)), with 14% reporting a limited understanding of the health information required to take action towards improving health or making health care decisions (Domain 9 of the HLQ). The overall extra/delta cost (direct and indirect health care costs) associated with LHL in the Blacktown LGA was estimated to be between $11,785,528 and $15,432,239 in 2020. This is projected to increase to between $18,922,844 and $24,191,911 in 2030. Additionally, the extra disability-adjusted life year (DALY) value in 2020, for all chronic diseases and age-groups—comprising the extra costs incurred due to years of life lost (YLL) and years lived with disability (YLD)—was estimated at $414,231,335. The findings of our study may enable policymakers to have a deeper understanding of the economic burden of LHL in terms of its impact on the health care system and the production economy.

1. Introduction

The health care system is continually evolving—shifting from a “paternalistic model”, where health care providers make decisions for patients, to a “patient-centred model”, where patients are empowered to actively make decisions about their health and health care in order to receive the best possible quality of medical attention [1,2]. In today’s society, there is an increased need for individuals to be “health literate” in order to navigate complex health care systems and understand intricate health information [3]. In 2014, the Australian Commission on Safety and Quality in Health Care (ACSQHC) defined health literacy (HL) as the skills, knowledge, motivation, and capacity of a person to access, understand, appraise, and apply the information necessary to make effective decisions about health and health care and to take appropriate action [4]. Assessing HL allows researchers, health care professionals, and policy makers to appreciate the current ability of community members to understand the information available about their health care needs and to apply this information in order to make informed health decisions that affect positive outcomes [5].
Evidence has shown that HL is the greatest factor influencing health—more than other social determinants, such as education, employment, socioeconomic status, and other lifestyle factors [6,7]. HL mediates the relationship between sociodemographic and socioeconomic factors, thus affecting an individual’s overall health status, health-related quality of life (HRQoL), health behaviours, and use of preventive services [8]. Studies show that patients with greater levels of HL report better clinical and hospital outcomes [9,10]. On the contrary, low HL (LHL)—or, in other words, “health illiteracy”—is associated with significant health burdens and adverse outcomes at both patient and practice levels. At the patient level, studies have shown that LHL is associated with worse health outcomes, poorer HRQoL, and an increased risk of mortality [11,12,13,14]. A systematic review by DeWalt et al. in 2004 [15] estimated that people with LHL are 1.5 to 3 times more likely to experience a poor health outcome. At the practice level, studies have shown that LHL is often associated with non-adherence to taking medication as prescribed or following recommended treatment regimens due to the inability to understand health information [16,17]. This inability to understand health information, coupled with other cultural, social, and systemic barriers, limits both a patient’s capacity to self-manage their medical condition(s) and their health providers’ ability to deliver an appropriate level of care [18].
In Australia, a nationwide Adult Literacy and Life Skills (ALLS) survey in 2006 reported that approximately 60% of Australians had inadequate levels of HL [19]. The Health Literacy Survey (HLS)—which replaced the ALLS survey in 2018—differs from its predecessor by using a conceptual model to capture a wider range of HL domains, including: Australians’ use of health information; their engagement with health providers; and their ability to self-manage medical conditions [20]. The findings of the HLS survey indicated that only one in four Australians strongly agreed that they had sufficient information to manage their health and only 18% strongly agreed that they could actively manage their health [20]. Lower rates of confidence in the ability to manage one’s health were reported by those with chronic health conditions: only 12% of this demographic felt that they had adequate levels of self-management behaviours and only 17% reported active engagement with a health care team [20].
With the ongoing advancements and prevalence of information technology, Australians are often seeking health information online [21]. An Australian cross-sectional study in 2015 indicated that the information available on over 250 Australian health websites was above the average Australian’s level of HL and comprehension [22]. This finding warrants the prioritisation of programs to provide basic HL education to the general public and the development of policies that acknowledge the barriers to health information accessibility. It is imperative that health information be catered to an individual’s level of understanding whilst also being culturally appropriate.
While LHL has been associated with poorer health outcomes, studies have also shown a significant correlation between LHL and economic ramifications at the health care system level [23,24]. A 2007 report released by the University of Connecticut estimated the economic burden of LHL on the United States (US) economy as between $106 billion and $238 billion annually, a figure representing between 7 and 17% of all personal health care expenditure [25]. The first systematic review of the cost of LHL to the health care system by Eichler et al. (2009) indicated an additional fiscal burden of 3 to 5% of the total health care expenditure per year [26]. Eichler et al.’s study also reported the cost of LHL to the individual as ranging from $143 to $7798 per year, compared to those with an adequate level of HL [26]. In Australia, there is currently a knowledge gap with respect to the economic and health care system burden of LHL, with limited studies having been undertaken at the state and national level, and even less at the local level. This study aims to address this knowledge gap by estimating the economic burden of LHL among a culturally and linguistically diverse (CALD) community in Blacktown—a local government area (LGA) in Sydney, Australia.
The article opens with an overview of the materials and methods used in the study—detailing the study design, data sources, source population, and costing methodology—before presenting the research findings and examining their significance at the individual, employer, and health care system levels.

2. Materials and Methods

2.1. Aims and Objectives

The hypothesis of the study is that LHL is associated with additional costs to different economic agents. The broad aim of this study was to estimate the overall extra or delta cost (direct and indirect health care costs) associated with LHL among residents of the Blacktown LGA.
The specific objectives of the study are as follows:
  • To estimate the cost of LHL to the health care system, the government, employers/businesses, and at the individual and household levels.
  • To estimate the cost of LHL by age group area of health service, and by chronic health condition.
  • To estimate the burden of disease associated with LHL.

2.2. Study Design and Data Sources

This study is a secondary analysis of cross-sectional data from publicly available datasets, including 2011 and 2016 census data and National Health Survey (NHS) data of 2017–2018 from the Australian Bureau of Statistics (ABS), and figures on Disease Expenditure in Australia for 2015–2016 provided by the Australian Institute of Health and Welfare (AIHW). The 2017–2018 NHS is the most recent in a series of Australia-wide health surveys conducted by the ABS [27]. The NHS dataset includes data on demographics, socioeconomic factors, chronic conditions, and HL items. The census data were used to forecast the population by age for the Blacktown LGA for 2020. In addition to using publicly available data from the AIHW on Disease Expenditure in Australia for 2015–2016, a literature review was conducted in order to locate suitable research studies and reports to use as the source for the various elements of our cost data.
The study population included people aged over 20 years who were residents of the Blacktown LGA. Extra costs were estimated for the economic burden of LHL for those with chronic diseases.

2.3. Source Population

The Blacktown LGA is situated approximately 35 kilometres west of the Sydney central business district, in the state of New South Wales (NSW), Australia [28]. The city spreads across 247 square kilometres and includes 48 suburbs [29]. According to the 2016 census, the Blacktown LGA has the second highest population among LGAs in NSW, comprising 370,000 residents. This is projected to increase to 522,000 by 2036 [29,30]. The Blacktown LGA also has one of the largest urban Aboriginal and Torres Strait Islander populations in Australia, making up 3.2% of the indigenous Australian population [30]. Additionally, the proportion of Blacktown’s CALD community is higher than the NSW average, with 45.9% of residents born in a country other than Australia [28,29]. Compared to the NSW average, the Blacktown LGA has lower Socioeconomic Indexes for Areas (SEIFA) scores (1002 vs. 986), lower levels of tertiary qualifications (23.4% vs. 22.2%), and increased rates of unemployment (6.3% vs. 7.8%) [30].
With respect to the health profile of Blacktown LGA residents, chronic diseases—such as cancer, cardiovascular disease (CVD), respiratory disorders, and mental illness—were reported by the NHS in 2018 to be the leading causes of death across the Blacktown LGA [29,31]. Blacktown LGA residents also report lower indicators of Health-adjusted Life expectancy (HALE), at both birth and at 65 years, compared to the NSW average. In terms of HRQoL and disability, 16 in 100 residents, aged 15 years and above, self-rated their health as fair or poor in the NHS, which again is higher than the average figures for NSW and Australia (14 per 100 people). In addition, the Blacktown LGA has a significantly larger percentage of people living with disability—especially amongst elders aged 85 years and over—compared to Greater Sydney areas (59.8% vs. 50.4%) [29].
In terms of health service utilisation—with the exception of musculoskeletal conditions—the overall hospital admission rates, as well as hospital admissions specific to chronic conditions, were higher among the Blacktown LGA compared to the NSW average [31]. Additionally, modifiable risk factors, such as potentially avoidable hospitalisations, maternal smoking, obesity-related deaths, and hospitalisations, were also higher in comparison to the NSW average [31]. With respect to preventative health service use, the Blacktown community had lower participation rates of bowel, breast, and cervical cancer screening programs compared to the NSW average and other Greater Sydney communities [32].

2.4. Health Literacy Questionnaire

The Health Literacy Questionnaire (HLQ) is a widely used multi-dimensional measure of HL developed in 2013 by Osborne et al. in Victoria, Australia [33]. This questionnaire was designed to identify health inequality, inform policy changes, and evaluate HL levels [33]. It has been reported that the HLQ has been used in many countries and in many different settings, including for population health surveys [20,34], the development of interventions [34], and in the evaluation of health programs [35,36,37]. The validity of the HLQ has been widely tested in both English speaking [38,39] and non-English speaking settings [40,41].
Comprising nine domains and 44 items, the HLQ targets independent measures of HL, such as: how a person finds, perceives, and applies health information to effectively manage and make decisions about their health and medical care [33]. Data are collected for each item and domain, based on the respondent’s level of agreement (“strongly agree”, “agree”, “disagree”, or “strongly disagree”) with a set of HL statements or the perceived difficulty of a HL characteristic (“always easy”, “usually easy”, “sometimes difficult”, “usually difficult”, or “cannot do or always difficult”) [29]. It is important to note that all nine domains of the HLQ are considered separate and results are not to be combined across domains [12].
The multidimensional measure of the HLQ survey does not allow for the combination of scores across domains. This study selected Domains 6 (engagement with health care providers) and 9 (understanding health information to take appropriate action, such as seeing a medical practitioner) as they were identified to be the most frequently used measures of HL—as pertains to the self-management of medical conditions—when compared to other domains [42,43] in international research studies. Domain 9 was also chosen due to Osborne et al.’s (2013) finding that this domain of the HLQ was highly correlated with other validated instruments, such as the Test of Functional Health Literacy in Adults (TOFHLA) and the Newest Vital Sign (NVS) health literacy assessment tool [33].
Subscales within each domain were scored from one to five based on difficulty (from “very difficult” to “always easy”). However, as there were no specific cut-off scores provided by the instrument to effectively distinguish between poor and sufficient HL level, we followed a number of computational iterations and used different cut-off scores in our effort to categorise HLQ respondents as possessing an inadequate level of HL if their score was >3.5 or an adequate level of HL if their score was <3.5. These cut-off scores closely resemble the findings on chronic health conditions reported by the NHS of 2017–2018 [20]. Based on the cut-off score, the percentage of respondents with LHL (calculated using Domains 6 and 9 in the HLQ) was calculated across different age groups and applied to the total population of the Blacktown LGA in order to obtain the number and weighted percentage of people with LHL.

2.5. Costing Methodology

The costs of health illiteracy were considered for different economic agents, including the public health care provider, individuals, employers, and the government. The economic costing included the cost to Australia’s health care system (Medicare), to households and individuals, employers/businesses, and to the government.

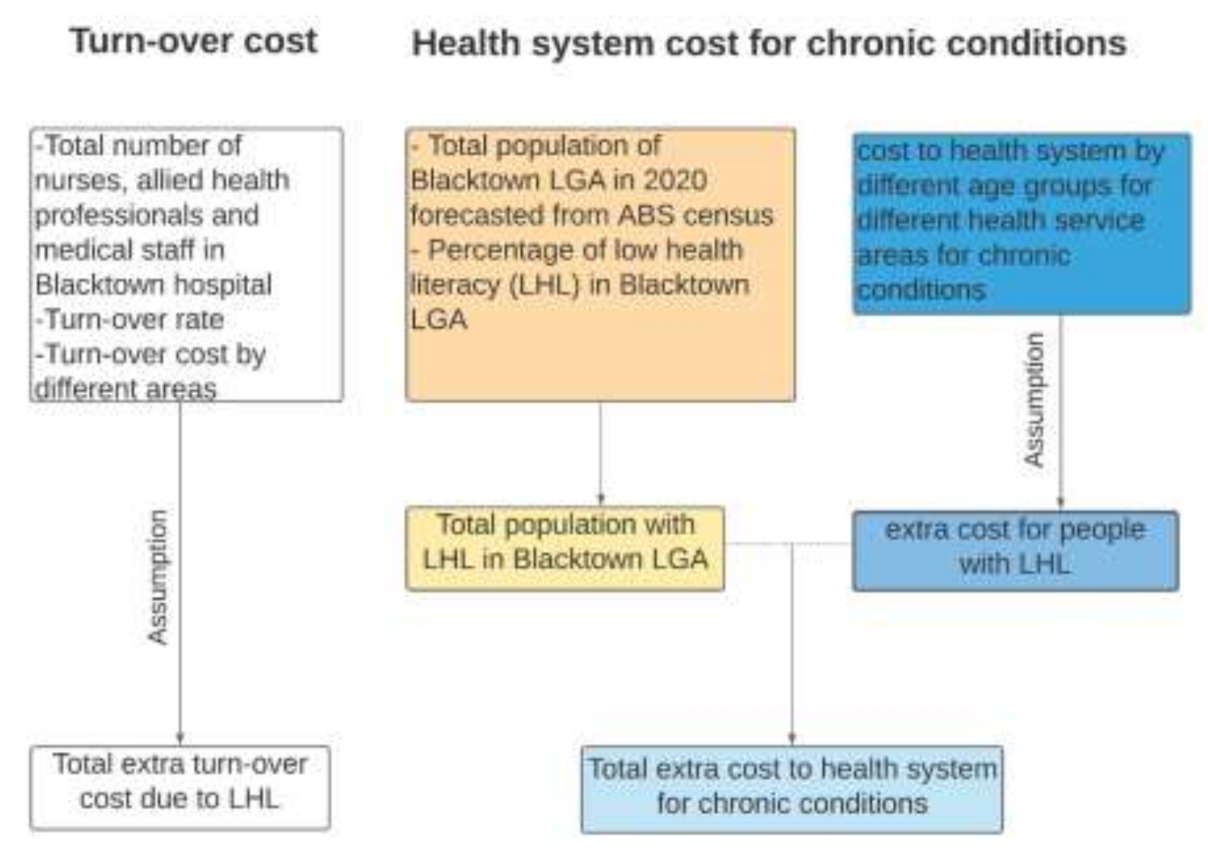
2.5.1. Costs to the Health Care System

Costs to the health care system include extra hospitalisation costs, emergency department visit costs, physician fees, costs for diagnostic tests, pharmaceutical costs due to increased health care need (as a consequence of health illiteracy), and staff turnover costs.
To determine the population for the Blacktown LGA in 2020 by age and gender, the latest available Australian census data of 2011 and 2016 [44,45] were used to calculate the population growth rate of this LGA. The estimated growth rate was then applied to predict the population by age in 2020. Once the total population was determined, the information on HL—obtained from the NHS of 2017–2018—was used to calculate the proportion of people with LHL. The percentage of LHL was multiplied by the total Blacktown LGA population to determine the total population with LHL in this LGA.
We have used the AIHW’s disease expenditure data of 2015–2016—a measurement of the health costs of those who live with chronic conditions—in order to estimate the extra direct costs borne by chronic disease sufferers with LHL. These figures were inflation-adjusted to reflect the 2020-dollar value before the per capita cost was calculated from the expenditure. Following Friedland et al.’s (1998) estimate [46], it was assumed that the extra cost due to LHL is the existing cost, marked-up by 10%. The extra cost was then multiplied by the Blacktown LGA population in order to calculate the total extra cost to different age groups, disease conditions, and service areas. For chronic illness sufferers, the extra cost of LHL was estimated across several areas of medical service, including the services performed by allied health practitioners and general practitioners, the economic strain further prescribed medications place on the pharmaceutical benefits scheme, the additional charges incurred by extra visits to the emergency department of a public hospital, admittance as a patient, and outpatient charges, as well as specialist service providers. Cardiovascular disorders, musculoskeletal disorders, mental illnesses, cancers, chronic kidney diseases, respiratory disorders, and diabetes were the chronic health conditions considered in this study.
Those delivering health care services face increased stress and professional responsibilities due to the increased demand for health care that LHL levels produce. Research has shown that the turnover rate of health care providers is often high in areas with significant rates of LHL among community members [47]. In this study, we have estimated the extra economic cost of higher rates of staff turnover for nurses, allied health professionals, and other medical staff members (a category that includes staff not classified as nurses, doctors, or other specialists). These staff members comprise about 70% of the total staff in the Western Sydney Local Health District [48]. The total number of nurses, allied health professionals, and other medical staff members at Blacktown Hospital was sourced from a 2015 report by the Western Sydney Local Health District [48]. The population growth rate was applied to this figure in order to estimate the number of staff in 2020. The turnover rate of 10.7% [48] was applied to estimate the full-time staff member turnover in 2020. Our calculations assumed that 10% of this staff turnover was due to LHL. The extra cost of higher rates of staff turnover was calculated by multiplying 10% of the total number of staff turnover with relevant associated costs, such as advertising, hiring, temporary replacement, and training. The figures used to cost the turnover of medical staff were sourced from a 2015 study by Roche et al. that estimated the cost of nurse turnover in Australia and adjusted for inflation [49]. We have assumed that the costs for allied health professionals and other medical staff members are similar to nurses. Our framework for estimating the health care system cost is summarised in Figure 1.

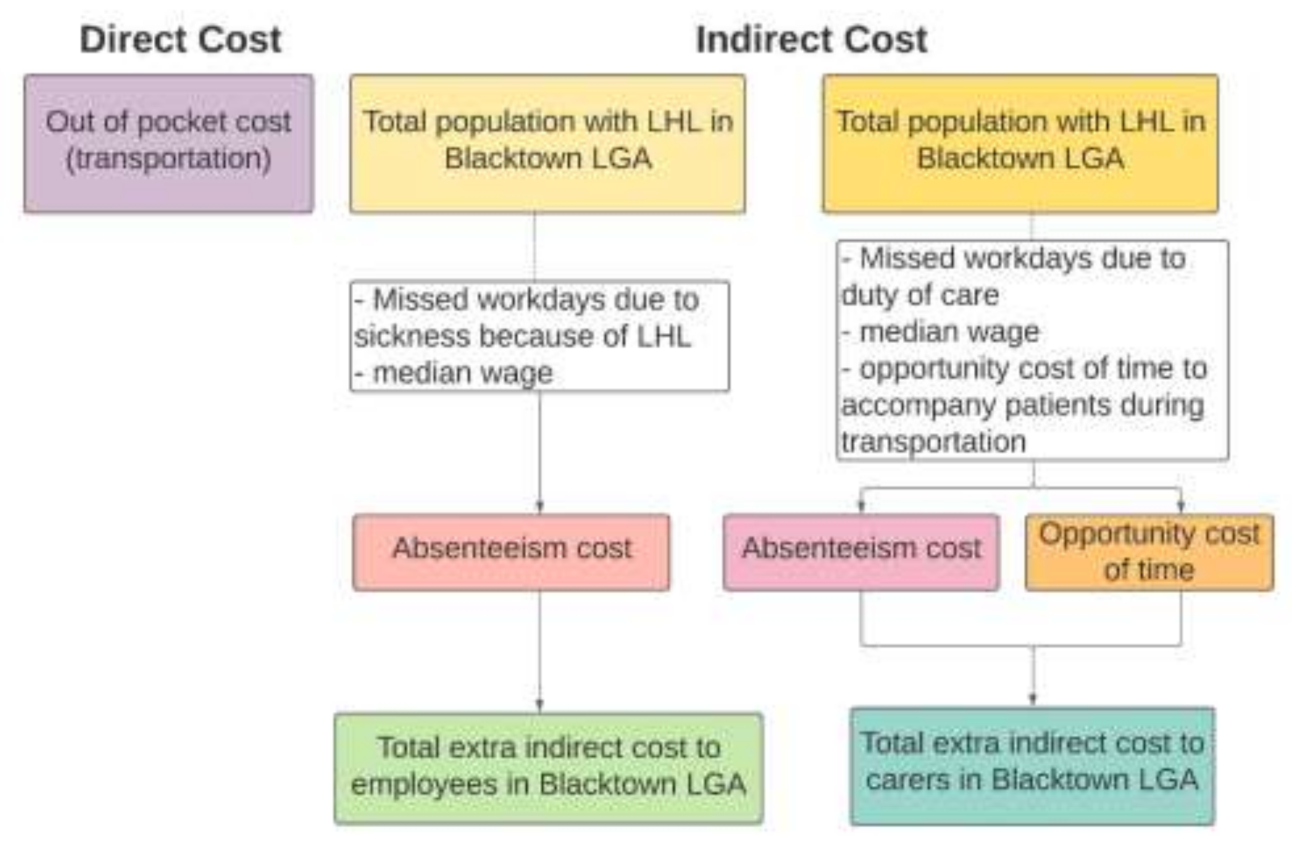
2.5.2. Costs to Individuals, Households, and Carers

Studies have shown that people with LHL tend to experience poorer health outcomes than those with higher rates of HL (Smith et al., 2018; Tormey et al., 2019; Panagioti et al., 2018; González-Chica et al., 2016), which results in both financial and non-financial burdens. The present study considered transportation fees for extra visits to physicians and hospitals direct out-of-pocket costs for those with LHL. To calculate indirect costs at the individual level, two components were considered: absenteeism costs and presenteeism costs. An absenteeism cost pertains to the loss of income an employee experiences when they are unable to attend work. Absent days are converted into weeks and multiplied with the median weekly wage to estimate the cost of absenteeism. In addition to assuming that those with LHL will miss a greater number of workdays than those with adequate levels of HL, we have also assumed that their likely lower health status will affect their performance at work. Their progress may be much lower than those employees without any medical conditions. This is considered as a presenteeism cost at the individual level. The conceptual framework we have used for calculating the production loss cost due to LHL is summarised in Figure 2.
The opportunity cost of carers’ time is also calculated as adding to the overall financial burden of LHL (Figure 2). The opportunity cost for carers is the value of their time that is lost as the result of having to take care of someone with an LHL-related health condition. If the carer was not engaged in looking after the individual with LHL, they could have participated in paid work. The relevant wage rate and number of missed days/time spent performing a carer’s role were multiplied to find the LHL burden for carers.

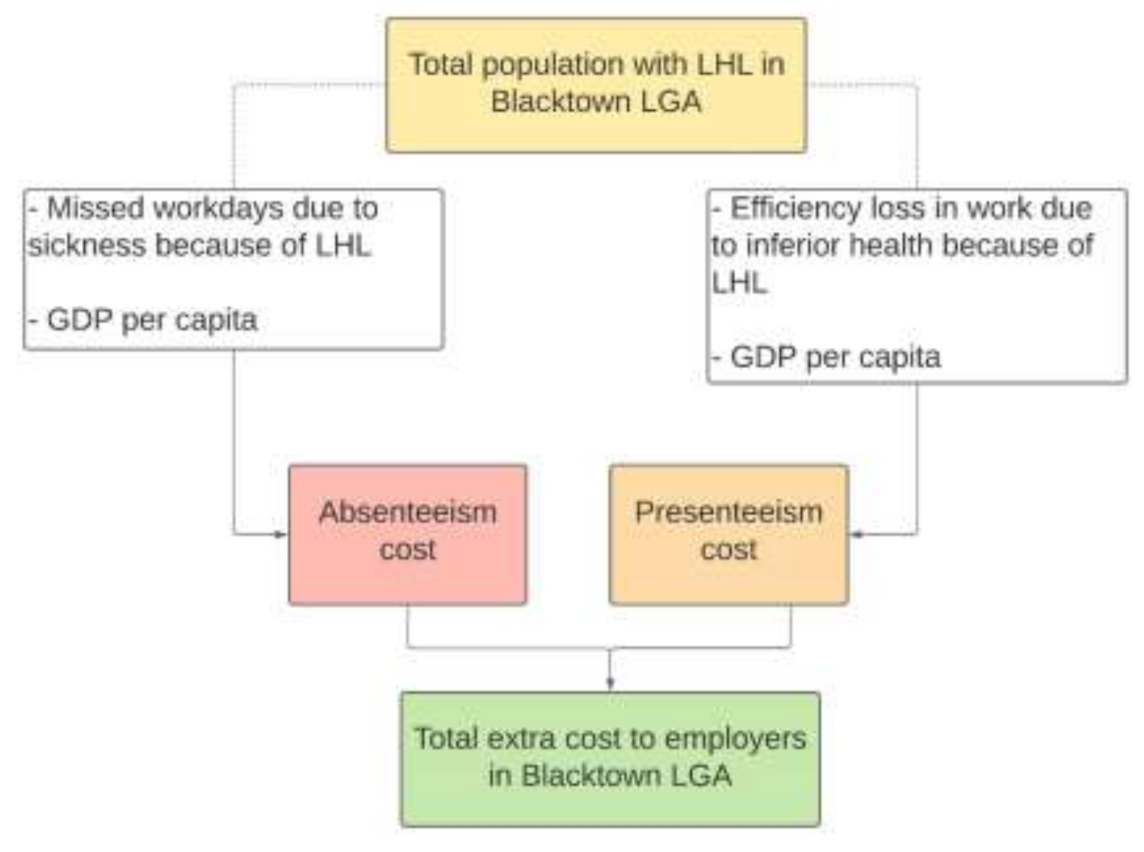
2.5.3. Costs to the Employer/Business

Employers bear costs due to LHL in two ways. Since people with LHL are more likely to suffer from chronic conditions, this typically results in more days absent from work than average. Therefore, an employer’s output and revenue will be less than their potential as the result of an under-utilisation of labour resources and the payment of full or partial salaries to their employees who may frequently be absent from work. Presenteeism cost as the result of LHL-related medical conditions has also been estimated and costed as a relevant factor producing lower production rates and, therefore, lower profits (Figure 3).

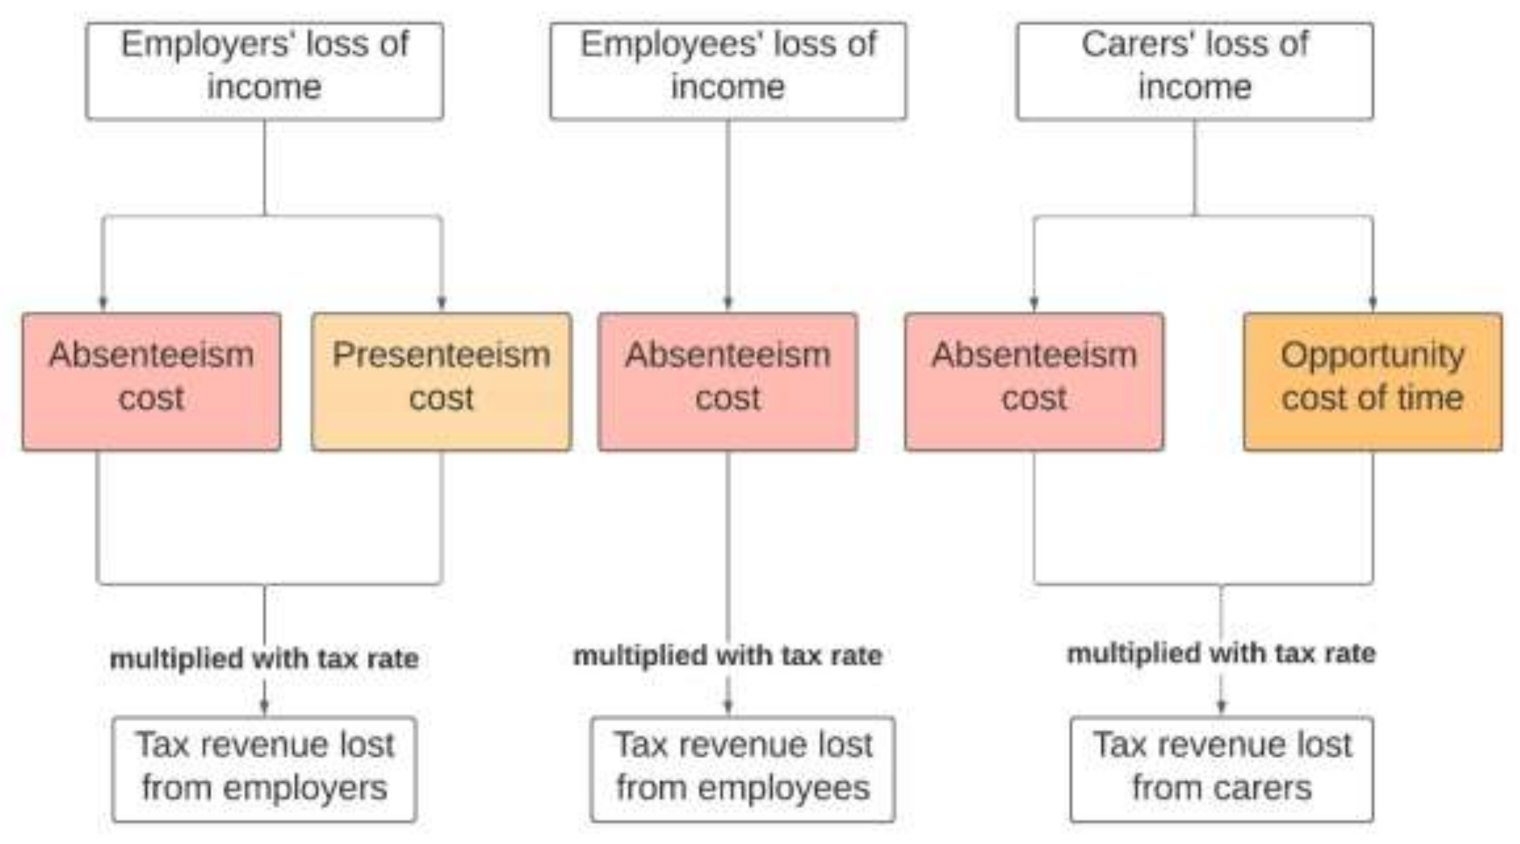
2.5.4. Costs to the Government

The government also experiences the financial burden of LHL in terms of lost tax revenue. Once the cost of the individual’s forgone salary, carers’ costs, and production losses are calculated, this figure can be used to estimate the total lost tax revenue. The average tax rate was multiplied with the annual figure to estimate the loss of tax revenue for the government (Figure 4).

2.5.5. Burden of Disease Due to LHL

A non-financial aspect of the cost of LHL is people’s experience of pain, suffering, and increased probability of early mortality. This burden is estimated in terms of Disability-adjusted life years (DALYs): a measure of the overall burden of a disease that takes into consideration years lived with a disability (YLD) and years of life lost (YLL) as the result of early death. These non-financial burdens are converted into monetary terms through using the value of a statistical life year estimate—the Australian Government currently estimates this as $213,000 [50]—in order to reflect the financial burden of LHL-related disability to the individual. The latest available Australian Burden of Disease Study data (2015) [51] were used to find out the burden of disease as the result of LHL for the Blacktown LGA. In order to calculate the burden of different diseases, YLD and YLL were sourced from the Australian Burden of Disease Study data of 2015. The proportion of the Australian population living in the Blacktown LGA was obtained for different age groups by using the ABS census data of 2011 and 2016. Assuming that the burden is shared according to the above proportion, the total YLD and YLL of different diseases for Australia were multiplied with the Blacktown LGA’s percentage of the population. This figure was then multiplied by 5% of the Blacktown LGA’s community that suffers from chronic disease(s) (5% being our assumption of the percentage of disabilities that are influenced by LHL) in order to obtain each component of DALY. The calculated DALY was multiplied with the value of statistical life-years (VSLYs) and adjusted for inflation.

3. Results

3.1. Prevalence of LHL in the Blacktown LGA

The prevalence of LHL in the Blacktown LGA population in 2020—using figures from Domains 6 and 9 of the HLQ—is shown in Table 1. One in five (20%) residents in the Blacktown community reported low levels of active engagement with health care providers (Domain 6) and 14% reported a limited understanding of the health information required to take action towards health and health care decisions (Table 1).

3.2. Total Extra/Delta Direct Health Care Costs

3.2.1. Domain 6—Engagement with Health Care Providers

With respect to engagement with health care providers (Domain 6), the total extra direct health costs associated with chronic diseases were estimated to be $9,166,409. A breakdown of total extra direct health costs by type of chronic disease group is shown in Table 2. Of the chronic disease groups considered in this study, LHL was most strongly associated with additional costs for mental illness treatments—accounting for 25% of the total extra costs for chronic disease sufferers—followed by musculoskeletal disorders (20.6%) and CVD (18.3%) (Table 2). Tertiary care accounted for almost 90% of the additional direct health care costs of individuals with LHL who suffer from chronic diseases.
The additional direct health costs incurred as a result of LHL are shown in Table 3, reporting both the overall cost and cost by area of service. Falling under tertiary care costs, public hospital admissions accounted for almost 35.6% of the total extra costs, followed by an additional financial strain on the Pharmaceutical Benefits Scheme (20.5%) and hospital outpatient services (10.6%). A further breakdown of the total extra direct health costs by area of health service, and separated by each type of chronic disease group, is presented in Appendix A.
In terms of age group, those 45 years and above accounted for more than half of the total extra direct health care costs (65.7%) in comparison to the younger population of the Blacktown LGA (Table 4). This may be explained by the greater prevalence of chronic diseases in persons aged over 45 years.

3.2.2. Domain 9—Understanding Health Care Information in Order to Take Action

With respect to the ability to understand health information and take appropriate action (Domain 9)—such as seeing a medical practitioner—the total extra direct health costs associated with chronic diseases were estimated to be $8,405,342. A breakdown of additional cost by type of chronic disease group is shown in Table 5. Of the chronic disease groups, LHL was most strongly associated with CVD, accounting for 22.2% of the total extra costs, followed by musculoskeletal disorders (20%) and mental illness (18.6%) (Table 5). Tertiary care accounted for more than 90% of the total direct additional costs of LHL for those suffering from chronic disease(s).
The additional direct health costs by area of health service are shown in Table 6. Public hospital admissions accounted for almost 43% of the total extra costs, followed by additional costs to the Pharmaceutical Benefits Scheme (24%), and fees for hospital outpatient services (11%).
Consistent with the higher prevalence of LHL noted among the elderly population in Domain 9 of the HLQ, people aged 65 years and above accounted for more than half of the total extra direct health care costs (53%), as shown in Table 7.

3.2.3. Out of Pocket Costs

The direct costs to the individual include gap fees for health service appointments and transportation costs for extra visits to hospital or physicians. In this study, we have considered the cost of transportation to and from the hospital as an out-of-pocket cost. According to Blacktown Hospital’s reported figures, in 2020, there were 43,376 hospital attendances in the first six months. If we assume the same number of attendances for the second half of the year, then the estimated number of hospital admissions per annum at Blacktown Hospital is 86,752. We have assumed that 10% of these visits are repeated visits due to LHL-related health conditions. Looking at the ABS census data of 2016, 7% of residences in the Blacktown LGA did not have a registered motor vehicle (we are assuming that most of the patients attending Blacktown Hospital are from the Blacktown LGA), meaning that 607 patients would have been admitted after having travelled by taxi, with the remainder travelling to hospital by using their own car. We calculated the transportation costs of travelling to Blacktown Hospital via taxi as $54,654 per annum (assuming that transportation will be needed both ways and using the average taxi fee of $45.00 per trip for our estimation). We have also estimated transportation costs for emergency department (ED) visits in a similar way. There were 96,405 visits to the ED of Blacktown Hospital in 2019. Taking population growth into account, we estimated that the number of ED visits for 2020 totalled 98,782. We estimated the annual transportation costs of using taxis for ED visits as $62,233. The total overall out-of-pocket transportation cost for LHL-related hospital visits was estimated as $116,886.

3.3. Total Extra/Delta Indirect Health Care Costs

Total indirect costs include costs to the employer, the individual, carers, and the government (Table 8). The total indirect additional cost due to LHL in the Blacktown LGA was estimated as $3.1 million if one week of work was missed due to poor health. It may be double that, at almost $6 million, if 10% of working days in the year are missed.

3.3.1. Costs to the Employer/Business

We have calculated both types of costs for employers: the absenteeism cost and the presenteeism cost. In order to do this, we first calculated the total number of people in the labour force in the Blacktown LGA. This figure was 258,223 for those aged 20 years and over in 2020. Given that 13.9% (domain 9) of people in this LGA have LHL, we have calculated the total number of people with LHL as 35,667. We have assumed that labour force participation rate does not vary by level of HL. The Blacktown LGA’s specific labour force participation rate of 60.6% and the employment rate of 91.9% were used to calculate the total number of employed people with LHL. We estimated that the total number of employed people with LHL was 19,864 for the Blacktown LGA in 2020. We also used this figure to calculate the absenteeism and presenteeism costs.
The absenteeism cost requires the total number of additional workdays missed due to an LHL-related sickness. To find out the total number of extra days missed due to illness, we have used the ABS NHS data of 2017–2018. Those with LHL are absent 1.42% more than those with adequate levels of HL, creating an additional absenteeism cost to the employer [20]. This extra cost was calculated by multiplying the extra 1.42% with the total number of employed people with LHL in the Blacktown LGA (n = 19,864). The resulting figure was multiplied with GDP per capita (converted into a weekly figure) in order to calculate the total monetary value of production loss due to LHL-related absenteeism. If we assume that employers only pay for missed workdays for their full-time employees—61.1% in the Blacktown LGA—then the total loss due to absenteeism is calculated as $281,421 per annum. This estimated loss increases to $1.5 million if absent days equate to 10% of workdays in a year (Table 8).
The calculation of the presenteeism cost of LHL is based on some assumptions. We have assumed that 50% of the total number of employees with LHL is 5% less efficient than those with adequate HL levels. We have also assumed that this inefficiency occurs for 5% of the total weeks in a year. The resulting loss in production is estimated as $1.8 million (Table 8). In our estimates, the total costs of absenteeism and presenteeism to the employer as the result of LHL can vary from $2.1 million to $3.3 million (Table 8).

3.3.2. Costs to Individuals and Households

The indirect costs to the individual due to LHL come in many different forms. Individuals bear the cost of absenteeism in terms of loss of wages. There is also a presenteeism cost caused by inefficiency at work. Since those with LHL are likely to have a lower health status on average, this will affect their performance at work. Their progress is likely to be much lower than it would be if they were in full health. Carers of sick individuals also suffer financial losses in terms of lost wages. In this report, we have considered the absenteeism cost borne by the employees and the cost to carers in needing to provide support to them. We have not calculated the presenteeism cost to individuals due to the nature of its complexity in modelling and the inability to source adequate data. We have assumed that employees with part-time or casual employment will lose their salaries for missed workdays due to illness. In order to find out the annual cost of absenteeism to part-time employees, we multiplied the total number of part-time employees with LHL who missed work with the median wage of $658 (inflation-adjusted), arriving at an estimated cost of $56,777 (Table 8). This cost can increase to $296,037 (Table 8) if missed workdays comprise 10% of the total weeks in a year.
We have calculated the cost to carers by assuming that they provide care for one-third of the period that individuals with LHL are absent from work. Forgoing wages in providing care, the estimated annual cost to carers varies from $188,552 to $1 million (Table 8). Carers also incur an opportunity cost in the form of leisure time that is consumed in helping those with LHL travel to the hospital for appointments or treatments or to visit the ED as well as time spent waiting in the ED. If we assume the opportunity cost of carers’ time to be 30 min each way (to and from the hospital), then this translates to a $30,363 per annum additional cost for hospital visits. Furthermore, the opportunity cost to carers when visiting and waiting in the ED is estimated as $149,358 per annum. Therefore, the total indirect cost to carers for waiting and visiting the hospital and the ED is $179,722 per year.

3.3.3. Costs to the Government

Lost tax revenue constitutes the indirect costs incurred by the government due to LHL. This lost revenue is calculated by multiplying the average tax rate of 30% with the total lost value of production. In our calculations, the estimated annual tax revenue loss varies from $711,595 to $1.4 million (Table 9).

3.4. Burden of Disease Due to LHL

The overall extra burden of disease cost associated with LHL in the Blacktown LGA is presented in Table A11. The extra DALY value (in 2020) for all chronic diseases and age-groups is estimated as $414,231,335, which includes the additional costs of YLL ($196,687,229) and YLD ($217,544,106)

4. Discussion

This study explored the prevalence of LHL in the CALD community of the Blacktown LGA and its associated economic costs. Our findings demonstrate that 20% of Blacktown LGA residents reported low levels of active engagement with health care providers in the HLQ survey (Domain 6) and that 14% had a limited understanding of the health information required to take action towards improving health or making health care decisions. With respect to age, the younger population of this LGA—those between 20 and 34 years—reported lower levels of engagement with health care providers and a limited understanding of health information compared to the elderly population. This may be due to the fact that younger adults are more likely to be healthy and, as a result, less likely to be sourcing information on health, or medical care, compared to those who are chronically ill and/or elderly [52,53,54].
Previous studies—particularly research from the US—have examined the economic burden of LHL. In Australia, while the prevalence of LHL has been discussed at the national level, the additional health care cost associated with LHL has not been explored. This is the first study in Australia to estimate the extra costs associated with LHL among the Blacktown LGA community. A scoping review by Choudhry and his colleagues [55] supports this claim that there are no comparable cost figures for Australia. The estimated costs of LHL-related health care were calculated across several areas: costs to the health care system, productivity costs to the employer, transactional costs, out-of-pocket costs to the individual, and the costs of the burden of disease. The overall extra/delta cost (direct and indirect health care costs) associated with LHL among the Blacktown LGA community was estimated to be between $11,785,528 and $15,432,239 in 2020. This is projected to increase to between $18,922,844 and $24,191,911 in 2030. The additional DALY value (in 2020) of LHL for all chronic diseases and age-groups was estimated as $414,231,335.
To compare our cost figures to other countries, we have calculated the per capita cost and its share of the health expenditure. The per capita cost due to LHL in the Blacktown LGA for those aged 20 years and above with chronic conditions was estimated to be between $32.5 and $35.5 per year. The per capita health expenditure in Australia in 2018–2019 was $7772 [56], indicating that 0.5% of the health expenditure for this period was due to LHL. The systematic review by Eicher and colleagues [26] found that additional expenditure per year due to LHL, at the patient level, varies from USD 143 to USD 7798. Two studies, for instance, found remarkably different prices for overall care and inpatient care: (USD 7798) [57] compared to (USD 1551) [58] for the former, and (USD 6214) [57] compared to (USD 1543) [58] for the latter. Price differences were also noted for outpatient care and hospital-based care [59]. Additional health system costs ranged from 3 to 5% of the total health care cost. Another study by Haun and co-authors [60] suggested that LHL is associated with up to USD 14,548 per patient for three years—an estimate gathered from a sample of veterans in the North Florida/South Georgia region.
Estimates from our study were lower than what has previously been found. One reason for this can be that our study takes a conservative approach to estimate the additional costs incurred due to LHL. Other studies have also been quite heterogeneous in their methodology. The methodology of our study is different from earlier studies in terms of our population, decision to include chronic health conditions in our costing, and the areas of health care that we focused on. It is also a challenge to accurately transfer the cost implications from studies conducted in other countries and apply them to the Australian health care system.

4.1. Strengths and Limitations

This is the first study in Australia to estimate the additional health costs associated with LHL in the Blacktown LGA community. This study also draws strength from using nationally representative datasets sourced from surveys and ABS censuses. The estimation of extra or delta health care costs has been stratified according to the type of chronic disease group, area of health service, and age group. In addition, extra costs incurred due to LHL have been calculated from different agents’ perspectives (the individual and household, employee, employer, and the government).
This study, however, has several limitations. It does not include gap fees as part of out-of-pocket costs to the individual or the associated presenteeism cost of LHL to the employee. We have not considered calculating the presenteeism cost to the individual due to the nature of its complexity in modelling and the data requirement. Annual staff turnover costs as a result of LHL were also not calculated in the study. Recognition has been made that the health illiteracy of patients causes additional stress for hospital staff members, creating the potential for greater staff turnover. However, we were unable to determine the turnover costs associated with LHL as the average turnover of Western Sydney Local Health Distinct (WSLHD) staff was comparable to several local health districts (LHDs) across NSW at a rate of 10.7% [48].
Although this study found a direct correlation between LHL levels and additional health care costs, it is important to note that HL and LHL levels are not purely symmetric: that is, increasing HL levels is not a guarantee of reducing the economic burden associated with LHL. Rather, LHL levels are but one factor placing an economic strain on the individual, employer, and health care system and, as such, a multifaceted approach would be required.

4.2. Policy Implications and Future Research

The findings of our study may enable policymakers to have a deeper understanding of the economic burden of LHL in terms of its impact on the health care system and the production economy. This research may also help clarify who bears the burden of LHL, aiding the efficient allocation of resources to alleviate the cost of LHL to the individual, public health care provider, and the government. With respect to future research, there is an opportunity to delve into all nine domains of the HLQ in order to obtain a deeper understanding of LHL and evaluate the costs associated with the different aspects of LHL. Once data on Primary Health Network (PHN) levels are available, future research could focus on comparing the Western Sydney PHN population to that of neighbouring PHNs (South Western and Nepean Blue Mountains PHNs) as well as high performing and affluent PHNs (North Sydney PHN).

5. Conclusions

Inadequate levels of HL have economic ramifications for individuals, employers, providers of health care services, as well as for wider society. This is the first study in Australia to estimate the extra costs associated with LHL in the Blacktown LGA community. The extra cost incurred due to LHL was explored from different agents’ perspectives (individual and household, employee, employer, and government). It is imperative that prevention and management initiatives be introduced to reduce the impact of LHL both for the individual and the wider community. Policies that focus on implementing educational programs to help raise awareness and HL levels, especially among CALD communities, may help alleviate the costs associated with LHL.

Author Contributions

Conceptualization, W.K.T., G.R. and G.A.; Data curation, M.U.A. and J.R.J.; Formal analysis, W.K.T., M.U.A. and J.R.J.; Funding acquisition, W.K.T., G.R. and G.A.; Methodology, W.K.T., M.U.A. and J.R.J.; Project administration, W.K.T.; Supervision, W.K.T.; Writing—original draft, M.U.A. and J.R.J.; Writing—review and editing, W.K.T., M.U.A. and J.R.J. All authors have read and agreed to the published version of the manuscript.

Funding

This research was funded by the Blacktown-Mt Druitt Health Medical Staff Council, grant number P00026796.

Institutional Review Board Statement

Ethical review and approval were waived for this study, due to the fact that only secondary data was used.

Informed Consent Statement

Patient consent was waived as only secondary data was used in this study.

Data Availability Statement

Data sharing not applicable. No new data were created or analyzed in this study. Data sharing is not applicable to this article.

Acknowledgments

We acknowledge the input and feedback provided by the Blacktown-Mt Druitt Health Medical Staff Council and Blacktown Hospital.

Conflicts of Interest

W.K.T., M.U.A. and J.R.J. have no competing interests. G.R. and G.A. work at the emergency department at Blacktown Hospital which funded this project. The funders had no role in the design of the study; in the collection, analyses, or interpretation of data; in the writing of the manuscript, or in the decision to publish the results.

Appendix A

Table A1. Extra costs incurred due to LHL for people diagnosed with CVD in the Blacktown LGA (Domain 6).
Age GroupsAllied Health and Other ServicesDiagnostic TestsGeneral PractitionerPharmaceutical Benefits SchemePublic Hospital Admitted PatientPublic Hospital Emergency DepartmentPublic Hospital OutpatientSpecialist ServicesTotal Services
20–24 years22410,96630,372428233,446705111,6856477104,503
25–34 years71381377031870930119114029201330,711
35–44 years60921,38046,34227,68690,54517,03819,70916,880240,189
45–54 years111327,53458,31082,743197,81432,78828,10228,519456,923
55–64 years85115,74930,42184,154161,24721,49619,54620,351353,815
65 years and over129113,34229,090120,164258,80830,34322,09319,595494,726
Total (inflation adjusted)415892,784202,239 320,900751,162110,626105,16493,8351,680,868
Table A2. Extra costs incurred due to LHL for people diagnosed with Musculoskeletal disorders in the Blacktown LGA (Domain 6).
Age GroupsAllied Health and Other ServicesDiagnostic TestsGeneral PractitionerPharmaceutical Benefits SchemePublic Hospital Admitted PatientPublic Hospital Emergency DepartmentPublic Hospital OutpatientSpecialist ServicesTotal Services
20–24 years278131,233 31,108 35,44234,10111,83738,0735816190,391
25–34 years9629503 7776 13,2448247269813,701179957,930
35–44 years860763,358 45,045 119,01865,00815,91260,58413,298390,830
45–54 years14,62691,119 55,511 177,845120,47318,25365,44619,913563,186
55–64 years10,36753,311 28,876 100,41493,162763838,68313,837346,288
65 years and over13,15941,525 28,501 83,714111,995697438,22913,960338,057
Total (inflation adjusted)50,501290,049 196,817 529,677432,98663,312254,71668,6231,886,681
Table A3. Extra costs incurred due to LHL for people diagnosed with Mental illness the Blacktown LGA (Domain 6).
Age GroupsAllied Health and Other ServicesDiagnostic TestsGeneral PractitionerPharmaceutical Benefits SchemePublic Hospital Admitted PatientPublic Hospital Emergency DepartmentPublic Hospital OutpatientSpecialist ServicesTotal Services
20–24 years95,7794791 48,415 32,283182,46237,15329,51426,899457,296
25–34 years22,6211506 11,438 10,29745,868697090226497114,219
35–44 years120,8399102 64,236 81,736251,15135,29254,71841,693658,767
45–54 years111,59212,399 71,395 95,324209,39329,27647,38146,621623,381
55–64 years40,3787215 32,721 38,77372,867879016,36820,133237,245
65 years and over18,2126049 27,071 24,04170,118766016,1059184178,440
Total (inflation adjusted)409,42141,063 255,275 282,453831,858125,142173,109151,0272,269,348
Table A4. Extra costs incurred due to Low HL for people diagnosed with Cancer in Blacktown LGA (Domain 6).
Age GroupsAllied Health and Other ServicesDiagnostic TestsGeneral PractitionerPharmaceutical Benefits SchemePublic Hospital Admitted PatientPublic Hospital Emergency DepartmentPublic Hospital OutpatientSpecialist ServicesTotal Services
20–24 years635027 8405 556218,99329711,251667256,270
25–34 years201757 2241 26156676943712235919,474
35–44 years16512,339 14,794 40,29764,76686631,16523,650188,042
45–54 years30418,575 22,022 90,097146,472202067,15350,909397,552
55–64 years22411,852 13,992 71,737117,094163254,03139,709310,271
65 years and over32310,793 15,517 79,212125,912171554,31238,691326,475
Total (inflation adjusted)109960,343 76,970 289,520479,9126625221,624161,9901,298,083
Table A5. Extra costs incurred due to LHL for people diagnosed with Chronic kidney disease in the Blacktown LGA (Domain 6).
Age GroupsAllied Health and Other ServicesDiagnostic TestsGeneral PractitionerPharmaceutical Benefits SchemePublic Hospital Admitted PatientPublic Hospital Emergency DepartmentPublic Hospital OutpatientSpecialist ServicesTotal Services
20–24 years316633 4239 505121,20162536290174851,446
25–34 years102119 1064 184162651495226555115,610
35–44 years8611,062 6130 17,29956,188880113,3654314117,245
45–54 years15713,377 7534 27,306110,72511,33620,7266474197,635
55–64 years1207439 3923 15,93577,787589213,4714299128,866
65 years and over1826030 3840 15,613109,107613595953972154,474
Total (inflation adjusted)58546,660 26,730 83,045381,27439,91265,71221,359665,277
Table A6. Extra costs incurred due to LHL for people diagnosed with respiratory disorders in the Blacktown LGA (Domain 6).
Age GroupsAllied Health and Other ServicesDiagnostic TestsGeneral PractitionerPharmaceutical Benefits SchemePublic Hospital Admitted PatientPublic Hospital Emergency DepartmentPublic Hospital OutpatientSpecialist ServicesTotal Services
20–24 years1034891 17,418 15,19927,23377788314422185,157
25–34 years331364 4326 4085552414262850139921,007
35–44 years2819070 25,073 26,65035,880797712,71511,205128,851
45–54 years51413,293 30,877 40,49857,38711,07014,12516,467184,231
55–64 years3937996 16,100 30,00445,2357553848110,030125,792
65 years and over5966527 15,682 40,53169,60612,24579007842160,929
Total (inflation adjusted)192143,141 109,477 156,968240,86448,04954,38551,165705,970
Table A7. Extra costs incurred due to LHL for people diagnosed with Endocrine disorders in the Blacktown LGA (Domain 6).
Age GroupsAllied Health and Other ServicesDiagnostic TestsGeneral PractitionerPharmaceutical Benefits SchemePublic Hospital Admitted PatientPublic Hospital Emergency DepartmentPublic Hospital OutpatientSpecialist ServicesTotal Services
20–24 years6678873 12,899 91389819214012,977196258,475
25–34 years2172960 3240 47002839370459561019,531
35–44 years199116,817 18,968 46,66823,341186820,5204410134,583
45–54 years387121,772 23,957 59,55542,445203826,4656289186,392
55–64 years301212,255 12,941 51,17030,58893217,3774129132,404
65 years and over382710,324 12,852 46,09036,84486114,1753823128,796
Total (inflation adjusted)13,58573,001 84,858 217,321145,876820996,10921,223660,182
Table A8. Extra costs incurred due to LHL for people diagnosed with CVD in the Blacktown LGA (Domain 9).
Age GroupsAllied Health and Other ServicesDiagnostic TestsGeneral PractitionerPharmaceutical Benefits SchemePublic Hospital Admitted PatientPublic Hospital Emergency DepartmentPublic Hospital OutpatientSpecialist ServicesTotal Services
20–24 years743621 10,030 141411,04523283859213934,510
25–34 years713813 7703 1870930119114029201330,711
35–44 years30010,546 22,859 13,65744,663840497228326118,477
45–54 years79019,552 41,408 58,758140,47423,28419,95620,252324,474
55–64 years3195906 11,408 31,55860,468806173307632132,682
65 years and over319633,041 72,041 297,581640,92675,14354,71148,5261,225,165
Total (inflation adjusted)475076,480 165,448 404,838906,876119,13199,60788,8881,866,018
Table A9. Extra costs incurred due to LHL for people diagnosed with Musculoskeletal disorders in the Blacktown LGA (Domain 9).
Age GroupsAllied Health and Other ServicesDiagnostic testsGeneral PractitionerPharmaceutical Benefits SchemePublic Hospital Admitted PatientPublic Hospital Emergency DepartmentPublic Hospital OutpatientSpecialist ServicesTotal Services
20–24 years91810,314 10,273 11,70411,261390912,573192162,873
25–34 years9629503 7776 13,2448247269813,701179957,930
35–44 years424531,252 22,219 58,70732,066784929,8846559192,781
45–54 years10,38664,706 39,420 126,29285,55112,96246,47514,141399,933
55–64 years388819,992 10,828 37,65534,936286414,5065189129,858
65 years and over32,587102,836 70,582 207,313277,35017,27194,67234,572837,183
Total (inflation adjusted)52,987238,603 161,098 454,916449,41147,553211,81164,1801,680,559
Table A10. Extra costs incurred due to LHL for people diagnosed with Mental illness in the Blacktown LGA (Domain 9).
Age GroupsAllied Health and Other ServicesDiagnostic TestsGeneral PractitionerPharmaceutical Benefits SchemePublic Hospital Admitted PatientPublic Hospital Emergency DepartmentPublic Hospital OutpatientSpecialist ServicesTotal Services
20–24 years31,6291582 15,988 10,66160,25512,26997478883151,014
25–34 years22,6211506 11,438 10,29745,868697090226497114,219
35–44 years59,6064490 31,685 40,317123,88317,40826,99020,565324,944
45–54 years79,2458805 50,699 67,693148,69520,79033,64733,107442,681
55–64 years15,1422706 12,270 14,54027,32532966138755088,967
65 years and over45,10114,980 67,039 59,535173,64418,97039,88422,743441,896
Total (inflation adjusted)253,34334,069 189,120 203,043579,67079,704125,42899,3461,563,723
Table A11. Extra costs incurred due to LHL for people diagnosed with Cancer in the Blacktown LGA (Domain 9).
Age GroupsAllied Health and Other ServicesDiagnostic TestsGeneral PractitionerPharmaceutical Benefits SchemePublic Hospital Admitted PatientPublic Hospital Emergency DepartmentPublic Hospital OutpatientSpecialist ServicesTotal Services
20–24 years211660 2776 18376272983716220318,583
25–34 years201757 2241 26156676943712235919,474
35–44 years816087 7297 19,87731,94642715,37211,66592,752
45–54 years21613,190 15,638 63,980104,014143547,68736,152282,312
55–64 years844444 5247 26,90243,91061220,26214,891116,352
65 years and over80126,729 38,427 196,165311,8144246134,50295,816808,500
Total (inflation adjusted)122353,868 71,625 311,375504,6336912225,250163,0871,337,973
Table A12. Extra costs incurred due to LHL for people diagnosed with Chronic kidney disease in the Blacktown LGA (Domain 9).
Age GroupsAllied Health and Other ServicesDiagnostic TestsGeneral PractitionerPharmaceutical Benefits SchemePublic Hospital Admitted PatientPublic Hospital Emergency DepartmentPublic Hospital OutpatientSpecialist ServicesTotal Services
20–24 years102190 1400 166870012065207757716,988
25–34 years102119 1064 184162651495226555115,610
35–44 years425457 3024 853327,71543416593212857,833
45–54 years1119500 5350 19,39178,629805014,7184597140,346
55–64 years452790 1471 597629,17022105051161248,325
65 years and over45014,933 9510 38,666270,19915,19423,7629836382,550
Total (inflation adjusted)66936,988 21,819 76,074418,98033,35454,46719,303661,653
Table A13. Extra costs incurred due to LHL for people diagnosed with Respiratory disorders in the Blacktown LGA (Domain 9).
Age GroupsAllied Health and Other ServicesDiagnostic TestsGeneral PractitionerPharmaceutical Benefits SchemePublic Hospital Admitted PatientPublic Hospital Emergency DepartmentPublic Hospital OutpatientSpecialist ServicesTotal Services
20–24 years341615 5752 5019899325682746139428,121
25–34 years331364 4326 4085552414262850139921,007
35–44 years1394474 12,368 13,14517,69839356272552763,558
45–54 years3659440 21,927 28,75940,752786110,03111,694130,829
55–64 years1472999 6038 11,25116,96328323180376147,171
65 years and over147616,163 38,836 100,374172,37630,32419,56319,421398,533
Total (inflation adjusted)219436,054 89,246 162,634262,30648,94744,64243,197689,220
Table A14. Extra costs incurred due to LHL for people diagnosed with Endocrine disorders in the Blacktown LGA (Domain 9).
Age GroupsAllied Health and Other ServicesDiagnostic TestsGeneral PractitionerPharmaceutical Benefits SchemePublic Hospital Admitted PatientPublic Hospital Emergency DepartmentPublic Hospital OutpatientSpecialist ServicesTotal Services
20–24 years2202930 4260 30183243707428564819,311
25–34 years2172960 3240 47002839370459561019,531
35–44 years9828295 9356 23,01911,51392210,122217566,384
45–54 years274915,461 17,012 42,29130,141144718,7944466132,361
55–64 years11294596 4853 19,18911,4703506516154849,651
65 years and over947725,567 31,829 114,13991,242213235,1049467318,957
Total (inflation adjusted)14,77559,809 70,550 206,357150,448592779,41618,914606,196
Table A15. Extra costs incurred due to LHL for people with different chronic conditions—Method 2.
Domain 6Domain 9
Age groupDiabetesCVDMental DisorderCKDDiabetesCVDMental DisorderCKD
20–24 years953622,80431,78817,3993149753110,4975746
25–34 years27079326679667102707932667966710
35–44 years15,615111,97344,70955,648770255,23222,05327,449
45–54 years21,068285,08047,475416,76414,961202,44333,713295,956
55–64 years11,218258,02516,136340,744420796,7596051127,779
65 years and over6299550,96210,3111,061,39115,5991,364,43025,5352,628,482
Total (inflation adjusted)66,4441,238,170157,2151,898,65648,3261,735,721104,6453,092,121

References

  1. Delaney, L.J. Patient-centred care as an approach to improving health care in Australia. Collegian 2018, 25, 119–123. [Google Scholar] [CrossRef]
  2. Vat, L.E.; Ryan, D.; Etchegary, H. Recruiting patients as partners in health research: A qualitative descriptive study. Res. Involv. Engagem. 2017, 3, 15. [Google Scholar] [CrossRef] [PubMed]
  3. Altin, S.V.; Stock, S. The impact of health literacy, patient-centered communication and shared decision-making on patients’ satisfaction with care received in German primary care practices. BMC Health Serv. Res. 2016, 16, 450. [Google Scholar] [CrossRef] [PubMed] [Green Version]
  4. Australian Commission on Safety and Quality in Health Care. Health Literacy: Taking Action to Improve Safety and Quality; Australian Commission on Safety and Quality in Health Care: Sydney, Australia, 2014. [Google Scholar]
  5. Mackey, L.M.; Doody, C.; Werner, E.L.; Fullen, B. Self-management skills in chronic disease management: What role does health literacy have? Med. Decis. Mak. 2016, 36, 741–759. [Google Scholar] [CrossRef] [PubMed]
  6. Berkman, N.D.; Sheridan, S.L.; Donahue, K.E.; Halpern, D.J.; Crotty, K. Low health literacy and health outcomes: An updated systematic review. Ann. Intern. Med. 2011, 155, 97–107. [Google Scholar] [CrossRef]
  7. Kickbusch, I. Health literacy: An essential skill for the twenty-first century. Health Educ. 2008, 108, 101–104. [Google Scholar] [CrossRef]
  8. Stormacq, C.; Van den Broucke, S.; Wosinski, J. Does health literacy mediate the relationship between socioeconomic status and health disparities? Integrative review. Health Promot. Int. 2019, 34, e1–e17. [Google Scholar] [CrossRef] [PubMed]
  9. Paterick, T.E.; Patel, N.; Tajik, A.J.; Chandrasekaran, K. Improving health outcomes through patient education and partnerships with patients. Proc. (Bayl. Univ. Med. Cent.) 2017, 30, 112–113. [Google Scholar] [CrossRef] [Green Version]
  10. Olesen, K.; Reynheim, A.L.F.; Joensen, L.; Ridderstråle, M.; Kayser, L.; Maindal, H.T.; Osborne, R.H.; Skinner, T.; Willaing, I. Higher health literacy is associated with better glycemic control in adults with type 1 diabetes: A cohort study among 1399 Danes. BMJ Open Diabetes Res. Care 2017, 5, 1–8. [Google Scholar] [CrossRef] [Green Version]
  11. Smith, S.G.; Jackson, S.E.; Kobayashi, L.C.; Steptoe, A. Social isolation, health literacy, and mortality risk: Findings from the English Longitudinal Study of Ageing. Health Psychol. 2018, 37, 160–169. [Google Scholar] [CrossRef]
  12. Tormey, L.K.; Reich, J.; Chen, Y.S.; Singh, A.; Lipkin-Moore, Z.; Yu, A.; Weinberg, J.; Farraye, F.A.; Paasche-Orlow, M.K. Limited health literacy is associated with worse patient-reported outcomes in inflammatory bowel disease. Inflamm. Bowel Dis. 2019, 25, 204–212. [Google Scholar] [CrossRef]
  13. Panagioti, M.; Skevington, S.M.; Hann, M.; Howells, K.; Blakemore, A.; Reeves, D.; Bower, P. Effect of health literacy on the quality of life of older patients with long-term conditions: A large cohort study in UK general practice. Qual. Life Res. 2018, 27, 1257–1268. [Google Scholar] [CrossRef] [PubMed] [Green Version]
  14. González-Chica, D.A.; Mnisi, Z.; Avery, J.; Duszynski, K.; Doust, J.; Tideman, P.; Murphy, A.; Burgess, J.; Beilby, J.; Stocks, N. Effect of health literacy on quality of life amongst patients with ischaemic heart disease in Australian general practice. PLoS ONE 2016, 11, e0151079. [Google Scholar] [CrossRef]
  15. DeWalt, D.A.; Berkman, N.D.; Sheridan, S.; Lohr, K.N.; Pignone, M.P. Literacy and health outcomes: A systematic review of the literature. J. Gen. Intern. Med. 2004, 19, 1228–1239. [Google Scholar] [CrossRef] [PubMed]
  16. Turkoglu, A.R.; Demirci, H.; Coban, S.; Guzelsoy, M.; Toprak, E.; Aydos, M.M.; Ture, D.A.; Ustundag, Y. Evaluation of the relationship between compliance with the follow-up and treatment protocol and health literacy in bladder tumor patients. Aging Male 2019, 22, 266–271. [Google Scholar] [CrossRef]
  17. Oscalices, M.I.L.; Okuno, M.F.P.; Lopes, M.C.B.T.; Batista, R.E.A.; Campanharo, C.R.V. Health literacy and adherence to treatment of patients with heart failure. Rev. Esc. Enferm. USP 2019, 53, e03447. [Google Scholar] [CrossRef] [Green Version]
  18. Lambert, M.; Luke, J.; Downey, B.; Crengle, S.; Kelaher, M.; Reid, S.; Smylie, J. Health literacy: Health professionals’ understandings and their perceptions of barriers that Indigenous patients encounter. BMC Health Serv. Res. 2014, 14, 614. [Google Scholar] [CrossRef] [Green Version]
  19. Australian Bureau of Statistics. Adult Literacy and Life Skills Survey 2006; ABS Publication 4228.0; Australian Bureau of Statistics: Canberra, Australia, 2006. [Google Scholar]
  20. Australian Bureau of Statistics. National Health Survey: Health Literacy, 2018; ABS Publication; Australian Bureau of Statistics: Canberra, Australia, 2018. [Google Scholar]
  21. Australian Bureau of Statistics. Household Use of Information Technology, Australia, 2016-17 Quality Declaration; ABS Publication 8146.0; Australian Bureau of Statistics: Canberra, Australia, 2018. [Google Scholar]
  22. Cheng, C.; Dunn, M. Health literacy and the Internet: A study on the readability of Australian online health information. Aust. N. Z. J. Public Health 2015, 39, 309–314. [Google Scholar] [CrossRef] [PubMed]
  23. Abdullah, A.; Liew, S.M.; Salim, H.; Ng, C.J.; Chinna, K. Prevalence of limited health literacy among patients with type 2 diabetes mellitus: A systematic review. PLoS ONE 2019, 14, e0216402. [Google Scholar] [CrossRef] [PubMed] [Green Version]
  24. Geboers, B.; Reijneveld, S.A.; Jansen, C.J.; de Winter, A.F. Health literacy is associated with health behaviors and social factors among older adults: Results from the LifeLines Cohort Study. J. Health Commun. 2016, 21, 45–53. [Google Scholar] [CrossRef]
  25. Vernon, J.A.; Trujillo, A.; Rosenbaum, S.R.; DeBuono, B. Low Health Literacy: Implications for National Health Policy. Available online: https://publichealth.gwu.edu/departments/healthpolicy/CHPR/downloads/LowHealthLiteracyReport10_4_07.pdf (accessed on 19 January 2021).
  26. Eichler, K.; Wieser, S.; Brügger, U. The costs of limited health literacy: A systematic review. Int. J. Public Health 2009, 54, 313–324. [Google Scholar] [CrossRef] [PubMed] [Green Version]
  27. Australian Bureau of Statistics. National Health Survey: First Results 2017-18; ABS Publications; Australian Bureau of Statistics: Canberra, Australia, 2018. [Google Scholar]
  28. Blacktown City Council. Transforming Blacktown. Annual Report 2018/19. Available online: https://www.blacktown.nsw.gov.au/files/assets/public/2018-19-annual-report.pdf (accessed on 1 February 2021).
  29. Blacktown City Council. Social Profile 2020. Available online: https://www.blacktown.nsw.gov.au/files/assets/public/community/social-profile/social-profile-2020.pdf (accessed on 1 February 2021).
  30. Australian Bureau of Statistics. Blacktown-2016 Census QuickStats; ABS Publications; Australian Bureau of Statistics: Canberra, Australia, 2017. [Google Scholar]
  31. Centre for Epidemiology and Evidence. HealthStats NSW, 2018–2019. 2018. Available online: http://www.healthstats.nsw.gov.au/ (accessed on 26 February 2021).
  32. Public Health Information Development Unit (PHIDU). Social Health Atlases. Torrens University Australia. Available online: https://phidu.torrens.edu.au/social-health-atlases (accessed on 1 February 2021).
  33. Osborne, R.H.; Batterham, R.W.; Elsworth, G.R.; Hawkins, M.; Buchbinder, R. The grounded psychometric development and initial validation of the Health Literacy Questionnaire (HLQ). BMC Public Health 2013, 13, 658. [Google Scholar] [CrossRef] [Green Version]
  34. Bo, A.; Friis, K.; Osborne, R.H.; Maindal, H.T. National indicators of health literacy: Ability to understand health information and to engage actively with healthcare providers-a population-based survey among Danish adults. BMC Public Health 2014, 14, 1095. [Google Scholar] [CrossRef] [PubMed] [Green Version]
  35. Batterham, R.W.; Buchbinder, R.; Beauchamp, A.; Dodson, S.; Elsworth, G.R.; Osborne, R.H. The OPtimising HEalth LIterAcy (Ophelia) process: Study protocol for using health literacy profiling and community engagement to create and implement health reform. BMC Public Health 2014, 14, 694. [Google Scholar] [CrossRef] [Green Version]
  36. Leslie, C.J.; Hawkins, M.; Smith, D.L. Using the Health Literacy Questionnaire (HLQ) with Providers in the Early Intervention Setting: A Qualitative Validity Testing Study. Int. J. Environ. Res. Public Health 2020, 17, 2603. [Google Scholar] [CrossRef] [Green Version]
  37. Banbury, A.; Nancarrow, S.; Dart, J.; Gray, L.; Dodson, S.; Osborne, R.; Parkinson, L. Adding value to remote monitoring: Co-design of a health literacy intervention for older people with chronic disease delivered by telehealth-The telehealth literacy project. Patient Educ. Couns. 2020, 103, 597–606. [Google Scholar] [CrossRef]
  38. Hawkins, M.; Gill, S.D.; Batterham, R.; Elsworth, G.R.; Osborne, R.H. The Health Literacy Questionnaire (HLQ) at the patient-clinician interface: A qualitative study of what patients and clinicians mean by their HLQ scores. BMC Health Serv. Res. 2017, 17, 309. [Google Scholar] [CrossRef] [PubMed] [Green Version]
  39. Beauchamp, A.; Buchbinder, R.; Dodson, S.; Batterham, R.W.; Elsworth, G.R.; McPhee, C.; Sparkes, L.; Hawkins, M.; Osborne, R.H. Distribution of health literacy strengths and weaknesses across socio-demographic groups: A cross-sectional survey using the Health Literacy Questionnaire (HLQ). BMC Public Health 2015, 15, 678. [Google Scholar] [CrossRef] [PubMed] [Green Version]
  40. Maindal, H.T.; Kayser, L.; Norgaard, O.; Bo, A.; Elsworth, G.R.; Osborne, R.H. Cultural adaptation and validation of the Health Literacy Questionnaire (HLQ): Robust nine-dimension Danish language confirmatory factor model. SpringerPlus 2016, 5, 1232. [Google Scholar] [CrossRef] [Green Version]
  41. Kolarcik, P.; Cepova, E.; Geckova, A.M.; Elsworth, G.R.; Batterham, R.W.; Osborne, R.H. Structural properties and psychometric improvements of the health literacy questionnaire in a Slovak population. Int. J. Public Health 2017, 62, 591–604. [Google Scholar] [CrossRef]
  42. Muscat, D.M.; Song, W.; Cvejic, E.; Ting, J.H.C.; Medlin, J.; Nutbeam, D. The Impact of the Chronic Disease Self-Management Program on Health Literacy: A Pre-Post Study Using a Multi-Dimensional Health Literacy Instrument. Int. J. Environ. Res. Public Health 2020, 17, 58. [Google Scholar] [CrossRef] [Green Version]
  43. Friis, K.; Lasgaard, M.; Pedersen, M.H.; Duncan, P.; Maindal, H.T. Health literacy, multimorbidity, and patient-perceived treatment burden in individuals with cardiovascular disease. A Danish population-based study. Patient Educ. Couns. 2019, 102, 1932–1938. [Google Scholar] [CrossRef]
  44. Australian Bureau of Statistics. 2011 Census Data; ABS Publications; Australian Bureau of Statistics: Canberra, Australia, 2011. [Google Scholar]
  45. Australian Bureau of Statistics. 2016 Census Data; ABS Publications; Australian Bureau of Statistics: Canberra, Australia, 2016. [Google Scholar]
  46. Friedland, R. New estimates of the high costs of inadequate health literacy. In Proceedings of the Pfizer Conference “Promoting Health Literacy: A Call to Action; Pfizer, Inc.: Washington, DC, USA, 1998; pp. 6–10. [Google Scholar]
  47. Finlay, S.; Megetto, E.; Robinson, A.; Davis, C. Health literacy education for rural health professionals: Shifting perspectives. Aust. Health Rev. 2019, 43, 404–407. [Google Scholar] [CrossRef]
  48. Western Sydney Local Health District. Workforce Strategic Framework 2015–2020. Available online: https://www.wslhd.health.nsw.gov.au/ArticleDocuments/1336/WSLHD%20Workforce%20Strategic%20Framework%202015%20-%202020%20v18.pdf.aspx (accessed on 1 February 2021).
  49. Roche, M.A.; Duffield, C.M.; Homer, C.; Buchan, J.; Dimitrelis, S. The rate and cost of nurse turnover in Australia. Collegian 2015, 22, 353–358. [Google Scholar] [CrossRef] [PubMed] [Green Version]
  50. Department of the Prime Minister and Cabinet. Best Practice Regulation Guidance Note Value of Statistical Life. Available online: https://www.pmc.gov.au/sites/default/files/publications/Value_of_Statistical_Life_guidance_note.pdf (accessed on 1 February 2021).
  51. Australian Institute of Health and Welfare. Australian Burden of Disease Study: Impact and Causes of Illness and Death in Australia 2015. Available online: https://www.aihw.gov.au/getmedia/c076f42f-61ea-4348-9c0a-d996353e838f/aihw-bod-22.pdf.aspx?inline=true (accessed on 1 February 2021).
  52. Rickwood, D.J.; Deane, F.P.; Wilson, C.J. When and how do young people seek professional help for mental health problems? Med. J. Aust. 2007, 187, S35–S39. [Google Scholar] [CrossRef] [PubMed]
  53. McPhail, S.M. Multimorbidity in chronic disease: Impact on health care resources and costs. Risk Manag. Healthc. Policy 2016, 9, 143–156. [Google Scholar] [CrossRef] [PubMed] [Green Version]
  54. Forman, D.E.; Maurer, M.S.; Boyd, C.; Brindis, R.; Salive, M.E.; Horne, F.M.; Bell, S.P.; Fulmer, T.; Reuben, D.B.; Zieman, S. Multimorbidity in older adults with cardiovascular disease. J. Am. Coll. Cardiol. 2018, 71, 2149–2161. [Google Scholar] [CrossRef]
  55. Choudhry, F.R.; Ming, L.C.; Munawar, K.; Zaidi, S.T.R.; Patel, R.P.; Khan, T.M.; Elmer, S. Health literacy studies conducted in Australia: A scoping review. Int. J. Environ. Res. Public Health 2019, 16, 1112. [Google Scholar] [CrossRef] [Green Version]
  56. Australian Institute of Health and Welfare. Health Expenditure Australia 2018-19; AIHW: Canberra, Australia, 2020. [Google Scholar]
  57. Weiss, B.D.; Palmer, R. Relationship Between Health Care Costs and Very Low Literacy Skills in a Medically Needy and Indigent Medicaid Population. J. Am. Board Fam. Pract. 2004, 17, 44–47. [Google Scholar] [CrossRef] [PubMed]
  58. Howard, D.H.; Gazmararian, J.; Parker, R.M. The impact of low health literacy on the medical costs of Medicare managed care enrollees. Am. J. Med. 2005, 118, 371–377. [Google Scholar] [CrossRef]
  59. Sanders, L.M.; Thompson, V.T.; Wilkinson, J.D. Caregiver health literacy and the use of child health services. Pediatrics 2007, 119, e86–e92. [Google Scholar] [CrossRef] [PubMed]
  60. Haun, J.N.; Patel, N.R.; French, D.D.; Campbell, R.R.; Bradham, D.D.; Lapcevic, W.A. Association between health literacy and medical care costs in an integrated healthcare system: A regional population based study. BMC Health Serv. Res. 2015, 15, 249. [Google Scholar] [CrossRef] [PubMed] [Green Version]
Figure 1. Estimating the economic burden of low health literacy (LHL) on the health care system.
Ijerph 18 02303 g001
Figure 2. Estimating the economic costs of LHL to individuals and households.
Ijerph 18 02303 g002
Figure 3. Estimating the economic cost of LHL to the employer/business.
Ijerph 18 02303 g003
Figure 4. Estimating the economic cost of LHL to the government.
Ijerph 18 02303 g004
Table 1. The prevalence of LHL in the Blacktown local government area (LGA) by domain (6 and 9).
Age GroupsTotal Population 2020
(n = 258,223)
LHL Population (Domain 6)
(n = 53,451)
% of LHL (Domain 6)LHL Population (Domain 9)
(n = 35,667)
% of LHL
(Domain 9)
20–24 years24,36812,05049.45397916.33
25–34 years56,17126634.7426634.74
35–44 years55,80713,66724.49674112.08
45–54 years44,21814,88833.6710,57323.91
55–64 years36,522642817.6024106.6
≥65 years41,13737569.13930122.61
Prevalence of LHL 20.70 13.81
Table 2. Total extra direct health care costs incurred due to LHL by type of chronic disease group in the Blacktown LGA (Domain 6).
Type of Chronic Disease GroupDirect Health Care Cost ($)Direct Health Care Cost (%)
Cardiovascular disorders1,680,86918.3
Musculoskeletal disorder1,886,68120.6
Mental illness2,269,34724.8
Cancer1,298,08314.2
Chronic Kidney Disease665,2777.3
Respiratory disorders705,9707.7
Diabetes660,1827.2
Preventive care (sub-total)952,366 (10.4%)
Tertiary care (sub-total)8,214,043 (89.6%)
Total9,166,409100.0
Table 3. Additional direct health care costs incurred due to LHL for those with a chronic condition (by area of health service) in the Blacktown LGA (Domain 6).
Area of ServiceDirect Health Care Cost ($)Direct Health Care Cost (%)
Allied health and other services481,2705.3
Diagnostic services647,0417.1
General Practitioner952,36610.4
Pharmaceutical benefits scheme1,879,88420.5
Public hospital admitted patient3,263,93135.6
Public hospital emergency department401,8744.4
Public hospital outpatient970,82010.6
Specialist services569,2216.2
Total9,166,407100.0
Table 4. Additional direct health care costs incurred due to LHL for those with a chronic condition (by age group) in the Blacktown LGA (Domain 6).
Age GroupDirect Health Care Cost ($)Direct Health Care Cost (%)
20–24 years1,003,54110.9
25–34 years278,4823.0
35–44 years1,858,50620.3
45–54 years2,609,29728.5
55–64 years1,634,68317.8
65 years and over1,781,89919.4
Total9,166,408100.0
Table 5. Additional direct health care costs incurred due to LHL (by type of chronic disease group) in the Blacktown LGA (Domain 9).
Type of Chronic Disease GroupDirect Health Care Cost ($)Direct Health Care Cost (%)
Cardiovascular disorders1,866,01922.2
Musculoskeletal disorders1,680,55820.0
Mental illness1,563,72218.6
Cancer1,337,97315.9
Chronic Kidney Disease661,6537.9
Respiratory disorders689,2218.2
Diabetes606,1967.2
Preventive care (sub-total)768,906 (9.1%)
Tertiary care (sub-total)7,636,435 (90.9%)
Total8,405,342100.0
Table 6. Additional direct health care costs incurred due to LHL for those with a chronic condition (by area of health service) in the Blacktown LGA (Domain 9).
Area of ServiceDirect Health Care Cost ($)Direct Health Care Cost (%)
Allied health and other services329,9404.3
Diagnostic services535,8707.0
General Practitioner768,90610.1
Pharmaceutical benefits scheme1,819,23623.8
Public hospital admitted patient3,272,32442.9
Public hospital emergency department341,5294.5
Public hospital outpatient840,62011.0
Specialist services496,9156.5
Total8,405,342100.0
Table 7. Additional direct health care costs incurred due to LHL for those diagnosed with a chronic condition (by age group) in the Blacktown LGA (Domain 9).
Age GroupsDirect Health Care Cost ($)Direct Health Care Cost (%)
20–24 years331,4013.9
25–34 years278,4823.3
35–44 years916,73110.9
45–54 years1,852,93422.0
55–64 years613,0067.3
65 years and over4,412,78752.5
Total8,405,342100.0
Table 8. Additional annual indirect costs due to LHL in the Blacktown LGA.
Type of AgentType of CostMissed Weeks Due to Sickness
1 Week10% of Weeks in a Year
EmployerAbsenteeism cost281,4211,467,329
Presenteeism cost1,845,233
Total2,126,6533,312,561
IndividualAbsenteeism cost56,777296,037
Opportunity cost of time due to transportation30,363
CarersCarer’s cost188,552983,110
GovernmentLost tax revenue-employer (absenteeism)84,426440,199
Lost tax revenue-employer (presenteeism)553,570
Lost tax revenue-employer (total)637,996993,768
Lost tax revenue-employee(absenteeism)17,03388,811
Lost tax revenue-carer (absenteeism)56,566294,933
Total711,5951,377,513
Total Indirect cost3,113,9405,999,584
Table 9. Extra burden of disease cost due to LHL in the Blacktown LGA.
Age GroupsCancer and Other NeoplasmsCardiovascular DiseasesEndocrine DisordersKidney and Urinary DiseasesMental Illness and Substance Abuse DisordersMusculoskeletal ConditionsRespiratory Diseases
20–24 years 2.951.590.2600.2100.46
25–34 years 13.067.170.850.530.890.390.9
35–44 years 37.6620.71.931.731.180.692.01
45–54 years 72.9535.933.472.562.281.065.55
55–64 years 125.1149.485.354.651.551.7311.73
65–74 years 139.0562.786.575.951.362.223.75
75–84 years 76.0158.655.836.380.961.8918.39
85 years and over 26.1652.783.334.560.711.489.28
Extra YLL for all chronic diseases492.95289.0827.5926.359.159.4572.07
Extra YLL value (2020 $) for all chronic diseases104,632,76961,360,0615,856,2505,593,9161,941,5982,004,83515,297,799
Extra YLL value (2020 $) for all chronic diseases and age-groups196,687,229
20–24 years 2.331.380.820.0931.719.396.12
25–34 years 10.295.972.630.6477.3830.2813.43
35–44 years 26.1915.014.781.4365.2939.5715.19
45–54 years 43.2222.746.471.9337.0740.9614.39
55–64 years 63.6929.378.752.9916.5943.8816.23
65–74 years 65.8936.728.463.77.0936.1121.3
75–84 years 30.9828.564.023.211.913.1812.62
85 years and over 9.5621.071.491.880.683.314.94
Extra YLD for all chronic diseases252.17160.8237.4115.88237.72216.68104.23
Extra YLD value (2020 $) for all chronic diseases53,524,08134,136,2957,940,1333,370,36250,458,07145,992,59022,122,575
Extra YLD value (2020 $) for all chronic diseases and age-groups217,544,106
20–24 years 5.282.971.070.0931.929.396.58
25–34 years 23.3513.143.471.1878.2730.6714.33
35–44 years 63.8435.726.713.1666.4840.2617.21
45–54 years 116.1758.679.944.539.3642.0319.94
55–64 years 188.8178.8514.17.6418.1445.6127.96
65–74 years 204.9499.515.039.658.4638.3145.06
75–84 years 106.9987.219.859.592.8615.0731
85 years and over 35.7273.854.826.431.394.7914.22
Extra DALY for all chronic diseases745.12449.916542.23246.87226.13176.3
Extra DALY value (2020 $) for all chronic diseases158,156,85095,496,35613,796,3828,964,27852,399,66947,997,42537,420,374
Extra DALY value (2020 $) for all chronic diseases and age-groups414,231,335
Publisher’s Note: MDPI stays neutral with regard to jurisdictional claims in published maps and institutional affiliations.

