
Health Investment Management and Healthcare Quality in the Public System: A Gender Perspective


Abstract
1. Introduction
Literature Background and Hypotheses
2. Materials and Methodology
2.1. Sample and Data Collection
2.2. Measurement Variables
2.3. Data Analysis
3. Results
3.1. Measurement Model
3.1.1. Composite Mode A
3.1.2. Composite Mode B
3.2. Structural Model
3.3. Multi-Group Analysis (MGA)
4. Discussion
5. Conclusions
Author Contributions
Funding
Informed Consent Statement
Data Availability Statement
Conflicts of Interest
References
- Arrazola-Vacas, M.; Hevia-Payá, J.; Rodríguez-Esteban, L. ¿Qué factores ayudan a explicar la satisfacción con la Atención Primaria en España? Rev. Calid. Asist. 2015, 30, 226–236. [Google Scholar] [CrossRef] [PubMed]
- Hussain, A.; Asif, M.; Jameel, A.; Hwang, J.; Sahito, N.; Kanwel, S. Promoting OPD Patient Satisfaction through Different Healthcare Determinants: A Study of Public Sector Hospitals. Int. J. Environ. Res. Public Health 2019, 16, 3719. [Google Scholar] [CrossRef]
- Fernández-Pérez, Ángel; Sánchez, Ángeles Improving People’s Self-Reported Experience with the Health Services: The Role of Non-Clinical Factors. Int. J. Environ. Res. Public Health 2019, 17, 178. [CrossRef]
- Dávila, F.; Herrera, J.; Yasnó, D.; Forero, L.; Alvarado, M. Satisfaction according to health care insurance systems in an emergency department. Rev. Calid. Asist. 2017, 32, 89–96. [Google Scholar] [CrossRef] [PubMed]
- Lostao, L.; Ronda, E.; Pascual, C.; Cea-Soriano, L.; Moreno, A.; Regidor, E. Erosion of universal health coverage and trend in the frequency of physician consultations in Spain. Int. J. Equity Health 2020, 19, 1–8. [Google Scholar] [CrossRef] [PubMed]
- De Simone, S.; Planta, A.; Cicotto, G. The role of job satisfaction, work engagement, self-efficacy and agentic capacities on nurses’ turnover intention and patient satisfaction. Appl. Nurs. Res. 2018, 39, 130–140. [Google Scholar] [CrossRef] [PubMed]
- Maesala, A.; Paul, J. Service quality, consumer satisfaction and loyalty in hospitals: Thinking for the future. J. Retail. Consum. Serv. 2018, 40, 261–269. [Google Scholar] [CrossRef]
- Aliman, N.K.; Mohamad, W.N. Linking Service Quality, Patients’ Satisfaction and Behavioral Intentions: An Investigation on Private Healthcare in Malaysia. Procedia-Soc. Behav. Sci. 2016, 224, 141–148. [Google Scholar] [CrossRef]
- Taqdees, F.; Shahab, A.; Asma, S. Hospital healthcare service quality, patient satisfaction and loyalty. Int. J. Qual. Reliab. Manag. 2018, 35, 1194–1214. [Google Scholar]
- García-Mayor, J.; Moreno-Llamas, A.; De La Cruz-Sánchez, E. Inequalities in the long-term impact of the economic recession on preventive healthcare use and health-related lifestyle in Spain (2006–2017). Health Soc. Care Community 2021, 29, 42–55. [Google Scholar] [CrossRef] [PubMed]
- Bible, J.; Shau, D.; Kay, H.; Cheng, J.; Aaronson, O. Are Low Patient Satisfaction Scores Always Due to the Provider? Spine 2018, 43, 58–64. [Google Scholar] [CrossRef]
- Mira, J.; Aranaz, J. La satisfacción del paciente como una medida del resultado de la atención sanitaria. Med. Clin. 2000, 114, 26–33. [Google Scholar]
- Ramírez-Sánchez, T.D.J.; Nájera-Aguilar, P.; Nigenda-López, G. Percepción de la calidad de la atención de los servicios de salud en México: perspectiva de los usuarios. Salud Pública de México 1998, 40, 3–12. [Google Scholar] [CrossRef]
- Correia, S.; Miranda, F. Calidad y satisfacción en el servicio de urgencias hospitalarias: Análisis de un hospital de la zona centro de Portugal. Investig. Eur. Dir. Econ. Empresa 2010, 16, 27–41. [Google Scholar] [CrossRef]
- Fernández-Martín, L.; Iglesias-de-Sena, H.; Fombellida-Velasco, C.; Vicente-Torres, I.; Alonso-Sardón, M.; Mirón-Canelo, J. Patient satisfaction as a quality indicator in mental health. Rev. Calid. Asist. 2016, 31, 254–261. [Google Scholar] [CrossRef]
- Numbeo. Europe: Health Care Index by Country 2020 Mid Year. Available online: https://www.numbeo.com/health-care/rankings_by_country.jsp (accessed on 15 November 2020).
- Aiken, L.H.; Sloane, D.M.; Ball, J.; Bruyneel, L.; Rafferty, A.M.; Griffiths, P. Patient satisfaction with hospital care and nurses in England: an observational study. BMJ Open 2017, 8, e019189. [Google Scholar] [CrossRef]
- Draper, M.; Cohen, P.; Buchan, H. Seeking consumer views: What use are results of hospital patient satisfaction surveys? Int. J. Qual. Health Care 2001, 13, 463–468. [Google Scholar] [CrossRef]
- García-Alfranca, F.; Puig, A.; Galup, C.; Aguado, H.; Cerdá, I.; Guilabert, M.; Pérez-Jover, V.; Carrillo, I.; Mira, J.J. Patient Satisfaction with Pre-Hospital Emergency Services. A Qualitative Study Comparing Professionals’ and Patients’ Views. Int. J. Environ. Res. Public Health 2018, 15, 233. [Google Scholar] [CrossRef]
- Pérez-Romero, S.; Gascón-Cánovas, J.; Salmerón-Martínez, D.; Parra-Hidalgo, P.; Monteagudo-Piqueras, O. Relevance of the socioeconomic and health context in patient satisfaction. Gac. Sanit. 2017, 31, 416–422. [Google Scholar] [CrossRef] [PubMed]
- Caminal, J. La medida de la satisfacción: Un instrumento de participación de la población en la mejora de la calidad de los servicios sanitarios. Rev. Calid. Asist. 2001, 16, 276–279. [Google Scholar] [CrossRef]
- Añel-Rodríguez, R.; Cambero-Serrano, M.; Irurzun-Zuazabal, E. Análisis de las reclamaciones de pacientes en Atención Primaria: Una oportunidad para mejorar la seguridad clínica. Rev. Calid. Asist. 2015, 30, 220–225. [Google Scholar] [CrossRef] [PubMed]
- Manzoor, F.; Wei, L.; Hussain, A.; Asif, M.; Shah, S.I.A. Patient Satisfaction with Health Care Services; An Application of Physician’s Behavior as a Moderator. Int. J. Environ. Res. Public Health 2019, 16, 3318. [Google Scholar] [CrossRef] [PubMed]
- Garcia-Lacalle, J.; Martin, E. Rural vs urban hospital performance in a ‘competitive’ public health service. Soc. Sci. Med. 2010, 71, 1131–1140. [Google Scholar] [CrossRef]
- Purcărea, V.L.; Gheorghe, I.R.; Petrescu, C.M. The Assessment of Perceived Service Quality of Public Health Care Services in Romania Using the SERVQUAL Scale. Procedia Econ. Financ. 2013, 6, 573–585. [Google Scholar] [CrossRef]
- Koss, E. The health of Regionville; Hafner: New York, NY, USA, 1954. [Google Scholar]
- Donabedian, A. Evaluating the Quality of Medical Care. Milbank Q. 2005, 83, 691–729. [Google Scholar] [CrossRef]
- Li, M.; Lowrie, D.B.; Huang, C.-Y.; Lu, X.-C.; Zhu, Y.-C.; Wu, X.-H.; Shayiti, M.; Tan, Q.-Z.; Yang, H.-L.; Chen, S.-Y.; et al. Evaluating patients’ perception of service quality at hospitals in nine Chinese cities by use of the ServQual scale. Asian Pac. J. Trop. Biomed. 2015, 5, 497–504. [Google Scholar] [CrossRef]
- Ferreira, P.L.; Raposo, V.; Tavares, A.I. Primary health care patient satisfaction: Explanatory factors and geographic characteristics. Int. J. Qual. Health Care 2020, 32, 93–98. [Google Scholar] [CrossRef]
- González, N.; Quintana, J.M.; Bilbao, A.; Esteban, C.; San Sebastián, J.A.; de la Sierra, E.; Aizpuru, F.; Escobar, A. Patient satisfaction in four hospitals of the Basque Health Service. Gac. Sanit. 2008, 22, 210–217. [Google Scholar] [CrossRef][Green Version]
- Mohd, A.; Chakravarty, A. Patient satisfaction with services of the outpatient department. Med. J. Armed Forces India 2014, 70, 237–242. [Google Scholar] [CrossRef] [PubMed]
- Serrano-Del-Rosal, R.; Galiano-Coronil, S.; Ranchal-Romero, J. Diseccionando la satisfacción de los usuarios con los servicios de atención hospitalaria del sistema sanitario público andaluz. Prax. Sociológica 2014, 18, 101–116. [Google Scholar]
- Kamra, V.; Singh, H.; De, K.K. Factors affecting patient satisfaction: An exploratory study for quality management in the health-care sector. Total Qual. Manag. Bus. Excel. 2015, 27, 1013–1027. [Google Scholar] [CrossRef]
- Handayani, P.W.; Hidayanto, A.N.; Sandhyaduhita, P.I.; Ayuningtyas, D. Strategic hospital services quality analysis in Indonesia. Expert Syst. Appl. 2015, 42, 3067–3078. [Google Scholar] [CrossRef]
- Faezipour, M.; Ferreira, S. A System Dynamics Perspective of Patient Satisfaction in Healthcare. Procedia Comput. Sci. 2013, 16, 148–156. [Google Scholar] [CrossRef]
- Vogus, T.J.; McClelland, L.E. When the customer is the patient: Lessons from healthcare research on patient satisfaction and service quality ratings. Hum. Resour. Manag. Rev. 2016, 26, 37–49. [Google Scholar] [CrossRef]
- Barrasa, J.; Aibar, C. Revisión sistemática de los estudios de la satisfacción realizados en España en el período 1986–2001. Rev. Calid. Asist. 2003, 18, 580–590. [Google Scholar] [CrossRef]
- Rebull, J.; Castellà, M.; Pablo, A.; Vázquez, R.; Portoles, M.; Chanovas, M. Satisfacción de los usuarios de un servicio de urgencias: Comparación de resultados. Rev. Calid. Asist. 2003, 18, 286–290. [Google Scholar] [CrossRef]
- Murillo, C.; Saurina, C. Measurement of the importance of user satisfaction dimensions in healthcare provision. Gac. Sanit. 2013, 27, 304–309. [Google Scholar] [CrossRef] [PubMed]
- Amin, M.; Nasharuddin, S.Z. Hospital service quality and its effects on patient satisfaction and behavioural intention. Clin. Gov. Int. J. 2013, 18, 238–254. [Google Scholar] [CrossRef]
- Fuente-Rodríguez, A.; Fernández-Lerones, M.; Hoyos-Valencia, Y.; León-Rodríguez, C.; Zuloaga-Mendiolea, C.; Ruíz-Garrido, M. Primary care urgent service. Study of patient perceived quality and satisfaction in the Altamira health (Spain) catchment area. Rev. Calid. Asist. 2009, 24, 109–114. [Google Scholar]
- Fatima, T.; Malik, S.A.; Shabbir, A. Hospital healthcare service quality, patient satisfaction and loyalty: An investigation in context of private healthcare systems. Int. J. Qual. Reliab. Manag. 2018, 35, 1195–1214. [Google Scholar] [CrossRef]
- Jaráiz, E.; Lagares, N.; Pereira, M. The components of patient satisfaction and their usefulness for hospital management. Rev. Española Cienc. Política 2013, 32, 161–181. [Google Scholar]
- Oliver, R.L. A Cognitive Model of the Antecedents and Consequences of Satisfaction Decisions. J. Mark. Res. 1980, 17, 460–469. [Google Scholar] [CrossRef]
- Cardozo, R.N. An Experimental Study of Customer Effort, Expectation, and Satisfaction. J. Mark. Res. 1965, 2, 244. [Google Scholar] [CrossRef]
- Yüksel, A.; Rimmington, M. Customer Satisfaction Measurement. Cornell Hosp Q. 1998, 1, 60–70. [Google Scholar]
- Huynh, H.P.; Sweeny, K.; Miller, T. Transformational leadership in primary care: Clinicians’ patterned approaches to care predict patient satisfaction and health expectations. J. Health Psychol. 2018, 23, 743–753. [Google Scholar] [CrossRef] [PubMed]
- Ricci-Cabello, I.; Stevens, S.; Dalton, A.R.H.; Griffiths, R.I.; Campbell, J.L.; Valderas, J.M. Identifying Primary Care Pathways from Quality of Care to Outcomes and Satisfaction Using Structural Equation Modeling. Health Serv. Res. 2017, 53, 430–449. [Google Scholar] [CrossRef] [PubMed]
- Chang, C.-W.; Tseng, T.-H.; Woodside, A.G. Configural algorithms of patient satisfaction, participation in diagnostics, and treatment decisions ’ influences on hospital loyalty. J. Serv. Mark. 2013, 27, 91–103. [Google Scholar] [CrossRef]
- Voda, A.I.; Bostan, I.; Tiganas, C.G. Impact of Macroeconomic and Healthcare Provision Factors on Patient Satisfaction. Curr. Sci. 2018, 115, 43–48. [Google Scholar] [CrossRef]
- Ministerio de Sanidad. Gasto Sanitario. Informe Anual del Sistema Nacional de Salud 2018. Madrid; 2018. Available online: https://cpage.mpr.gob.es/ (accessed on 25 November 2020).
- Cinaroglu, S.; Baser, O. Understanding the relationship between effectiveness and outcome indicators to improve quality in healthcare. Total Qual. Manag. Bus. Excel. 2016, 29, 1294–1311. [Google Scholar] [CrossRef]
- Valls Martínez, M.D.C.; Ramírez-Orellana, A. Patient satisfaction in the Spanish national health service: Partial least squares structural equation modeling. Int. J. Environ. Res. Public Health 2019, 16, 4886. [Google Scholar] [CrossRef]
- Ruo, B.; Rumsfeld, J.S.; Hlatky, M.A.; Liu, H.; Browner, W.S.; Whooley, M.A. Depressive Symptoms and Health-Related Quality of Life: The Heart and Soul Study. J. Am. Med. Assoc. 2003, 290, 215–221. [Google Scholar] [CrossRef]
- Yang, H.; Guo, X.; Wu, T. Exploring the influence of the online physician service delivery process on patient satisfaction. Decis. Support Syst. 2015, 78, 113–121. [Google Scholar] [CrossRef]
- Robst, J. A note on the relationship between medical care resources and mortality. Appl. Econ. Lett. 2001, 8, 737–739. [Google Scholar] [CrossRef]
- Penninx, B.W.J.H.; Van Tilburg, T.; Kriegsman, D.M.W.; Deeg, D.J.H.; Boeke, A.J.P.; Van Eijk, J.T.M. Effects of Social Support and Personal Coping Resources on Mortality in Older Age: The Longitudinal Aging Study Amsterdam. Am. J. Epidemiol. 1997, 146, 510–519. [Google Scholar] [CrossRef]
- Dal Negro, R.W.; Celli, B.R. Patient Related Outcomes-BODE (PRO-BODE): A composite index incorporating health utilization resources predicts mortality and economic cost of COPD in real life. Respir. Med. 2017, 131, 175–178. [Google Scholar] [CrossRef]
- Valls, M.; Abad, E. Patient satisfaction in the Spanish National Health System. An. Sist. Sanit. Navar. 2018, 41, 309–320. [Google Scholar]
- Fenton, J.; Jerant, A.; Bertakis, K.; Franks, P. The Cost of Satisfaction. A National Study of Patient Satisfaction, Health Care Utilization, Expenditures, and Mortality. Arch. Intern. Med. 2012, 172, 405–411. [Google Scholar] [CrossRef] [PubMed]
- Thornton, R.D.; Nurse, N.; Snavely, L.; Hackett-Zahler, S.; Frank, K.; DiTomasso, R.A. Influences on patient satisfaction in healthcare centers: a semi-quantitative study over 5 years. BMC Health Serv. Res. 2017, 17, 361. [Google Scholar] [CrossRef] [PubMed]
- Komal Jaipaul, C.; Rosenthal, G.E. Do Hospitals With Lower Mortality Have Higher Patient Satisfaction? A Regional Analysis of Patients With Medical Diagnoses. Am. J. Med. Qual. 2003, 18, 59–65. [Google Scholar] [CrossRef] [PubMed]
- Glickman, S.W.; Boulding, W.; Manary, M.; Staelin, R.; Roe, M.T.; Wolosin, R.J.; Ohman, E.M.; Peterson, E.D.; Schulman, K.A. Patient Satisfaction and Its Relationship With Clinical Quality and Inpatient Mortality in Acute Myocardial Infarction. Circ. Cardiovasc. Qual. Outcomes 2010, 3, 188–195. [Google Scholar] [CrossRef] [PubMed]
- Kennedy, G.D.; Tevis, S.E.; Kent, K.C. Is There a Relationship Between Patient Satisfaction and Favorable Outcomes? Ann. Surg. 2014, 260, 592–600. [Google Scholar] [CrossRef] [PubMed]
- Bleich, S.; Ozaltin, E.; Murray, C. How does satisfaction with the health-care system relate to patient experience? Bull. World Health Organ. 2009, 87, 271–278. [Google Scholar] [CrossRef] [PubMed]
- Hair, J.F., Jr.; Hult, G.T.; Ringle, C.M.; Sarstedt, M.; Castillo Apraiz, J.; Cepeda Carrión, G.; Roldán, J.L. Manual de Partial Least Squares Structural Equation Modelin (PLS-SEM), 2nd ed.; Omnia Publisher Scholar: Spain, Madrid, 2017. [Google Scholar]
- Pérez-Romero, S.; Gascón-Cánovas, J.; Salmerón-Martínez, D.; Parra-Hidalgo, P.; Monteagudo-Piqueras, O. Sociodemographic characteristics and geographic variability associated with patient satisfaction in Primary Care. Rev. Calid. Asist. 2016, 31, 300–308. [Google Scholar] [CrossRef]
- Morales, J.; Bonill, C.; Celdrán, M.; Morilla, J.; Martín, F.; Contreras, E.; San Alberto, M.; Castilla, J. Design and validation of a home care satisfaction questionnaire: SATISFAD. Gac. Sanit. 2007, 21, 106–113. [Google Scholar]
- Chang, M.; Alemán, M.; Cañizares, M.; Ibarra, A. Satisfacción de los pacientes con la atención médica. Rev. Cuba. Med. General Integral 1999, 15, 541–547. [Google Scholar]
- Valls Martínez, M.C.; Parra Oller, I.M. Health investment management based on patient satisfaction with the primary care doctor in the Spanish national health service context. A gender perspective. MOJ Gerontol. Geriatr. 2019, 4, 204–211. [Google Scholar] [CrossRef]
- Mateos del Cabo, R.; Gimeno, R.; Escot, L. Disentangling discrimination on spanish boards of directors. Corp. Gov. Int. Rev. 2010, 19, 77–95. [Google Scholar] [CrossRef]
- Ministerio de Sanidad, Consumo y Bienestar Social. Indicadores Clave Sistema Nacional de Salud. Available online: http://inclasns.msssi.es/ (accessed on 13 December 2020).
- Faul, F.; Erdfelder, E.; Buchner, A.; Lang, A.-G. Statistical power analyses using G*Power 3.1: Tests for correlation and regression analyses. Behav. Res. Methods 2009, 41, 1149–1160. [Google Scholar] [CrossRef]
- Sarstedt, M.; Hair, J.F.; Ringle, C.M.; Thiele, K.O.; Gudergan, S.P. Estimation issues with PLS and CBSEM: Where the bias lies! J. Bus. Res. 2016, 69, 3998–4010. [Google Scholar] [CrossRef]
- Henseler, J.; Dijkstra, T.K.; Sarstedt, M.; Ringle, C.M.; Diamantopoulos, A.; Straub, D.W.; Ketchen, D.J., Jr.; Hair, J.F.; Hult, G.T.; Calantone, R.J. Common Beliefs and Reality About PLS: Comments on Rönkkö and Evermann (2013). Organ. Res. Methods 2014, 17, 182–209. [Google Scholar] [CrossRef]
- Henseler, J.; Ringle, C.M.; Sarstedt, M. Testing measurement invariance of composites using partial least squares. Int. Mark. Rev. 2016, 33, 405–431. [Google Scholar] [CrossRef]
- SmartPLS, version 3.3.2; Microsoft: Redmond, WA, USA, 2015.
- Hair, J.; Hult, G.T.M.; Ringle, C.; Sarstedt, M. A Primer on Partial Least Squares Structural Equation Modeling (PLS-SEM); Sage: Los Angeles, CA, USA, 2014. [Google Scholar]
- Sarstedt, M.; Henseler, J.; Ringle, C.M. Multigroup Analysis in Partial Least Squares (PLS) Path Modeling: Alternative Methods and Empirical Results. New Chall. Int. Mark. 2011, 22, 195–218. [Google Scholar] [CrossRef]
- Henseler, J.; Ringle, C.M.; Sinkovics, R.R. The use of partial least squares path modeling in international marketing. Adv. Int. Mark. 2009, 20, 277–319. [Google Scholar]
- Debashis, K. Bootstrap Methods and Their Application. Tecnnometrics 2000, 42, 216–217. [Google Scholar]
- Hair, J.F.; Ringle, C.M.; Sarstedt, M. PLS-SEM: Indeed a Silver Bullet. J. Mark. Theory Pract. 2011, 19, 139–152. [Google Scholar] [CrossRef]
- Hair, J.F.; Risher, J.J.; Sarstedt, M.; Ringle, C.M. When to use and how to report the results of PLS-SEM. Eur. Bus. Rev. 2019, 31, 2–24. [Google Scholar] [CrossRef]
- Carmines, E.G.; Zeller, R.A. Reliability and Validity Assessment; Sage Publications: London, UK, 1979. [Google Scholar]
- Werts, C.E.; Linn, R.L.; Jöreskog, K.G. Interclass Reliability Estimates: Testing Structural Assumptions. Educ. Psychol. Meas. 1974, 34, 25–33. [Google Scholar] [CrossRef]
- Dijkstra, T.K.; Henseler, J. Consistent Partial Least Squares Path Modeling. MIS Q. 2015, 39, 297–316. [Google Scholar] [CrossRef]
- Fornell, C.; Larcker, D.F. Evaluating Structural Equation Models with Unobservable Variables and Measurement Error. J. Mark. Res. 1981, 18, 39. [Google Scholar] [CrossRef]
- Diamantopoulos, A.; Siguaw, J.A. Formative Versus Reflective Indicators in Organizational Measure Development: A Comparison and Empirical Illustration. Br. J. Manag. 2006, 17, 263–282. [Google Scholar] [CrossRef]
- Cenfetelli, R.T.; Bassellier, G. Interpretation of Formative Measurement in Information Systems Research. MIS Q. 2009, 33, 689. [Google Scholar] [CrossRef]
- Kock, N. One-Tailed or Two-Tailed P Values in PLS-SEM? Int. J. e-Collab. 2015, 11, 1–7. [Google Scholar] [CrossRef]
- Cepeda, G.; Nitzl, C.; Roldán, J. Mediation analyses in partial least squares structural equation modeling: Guidelines and empirical examples. In Partial Least Squares Path Modeling: Basic Concepts, Methodological Issues and Applications; Latan, H., Noonan, R., Eds.; Springer: Heidelberg, Germany, 2017; pp. 173–195. [Google Scholar]
- Shmueli, G.; Ray, S.; Estrada, J.M.V.; Chatla, S.B. The elephant in the room: Predictive performance of PLS models. J. Bus. Res. 2016, 69, 4552–4564. [Google Scholar] [CrossRef]
- Chin, W.W.; Dibbern, J. A Permutation Based Procedure for Multi-Group PLS Analysis: Results of Tests of Differences on Simulated Data and a Cross Cultural Analysis of the Sourcing of Information System Services between Germany an USA. In Handbook of Partial Least Squares: Concepts, Methods and Applications; Esposito Vinzi, V., Chin, W.W., Henseler, J., Wang, H., Eds.; Springer: Heidelberg, Germany, 2010; pp. 171–193. [Google Scholar]
- Yeh, M.-Y.; Wu, S.-C.; Tung, T.-H. The relation between patient education, patient empowerment and patient satisfaction: A cross-sectional-comparison study. Appl. Nurs. Res. 2018, 39, 11–17. [Google Scholar] [CrossRef]
- Xesfingi, S.; Vozikis, A. Patient satisfaction with the healthcare system: Assessing the impact of socio-economic and healthcare provision factors. BMC Health Serv. Res. 2016, 16, 16–94. [Google Scholar] [CrossRef]
- Pascoe, G.C. Patient satisfaction in primary health care: A literature review and analysis. Eval. Program Plan. 1983, 6, 185–210. [Google Scholar] [CrossRef]
- Rodríguez-Almagro, J.; García-Manzanares, Á.; Lucendo, A.J.; Hernández-Martínez, A. Health-related quality of life in diabetes mellitus and its social, demographic and clinical determinants: A nationwide cross-sectional survey. J. Clin. Nurs. 2018, 27, 4212–4223. [Google Scholar] [CrossRef] [PubMed]
- Owens, M.D.; Beckles, G.L.; Ho, K.K.-Y.; Gorrell, P.; Brady, J.; Kaftarian, J.S. Women with Diagnosed Diabetes across the Life Stages: Underuse of Recommended Preventive Care Services. J. Women’s Health 2008, 17, 1415–1423. [Google Scholar] [CrossRef]
- Almonacid, C.; Camarillo, M.; Gil, Z.; Medina, C.; Rebellón, J.; Mendieta, H. Evaluación de factores de riesgo asociados a enfermedad cardiovascular en jóvenes universitarios de la Localidad Santafé en Bogotá, Colombia. Nova. 2016, 13, 35–45. Available online: http://www.scielo.org.co/pdf/nova/v14n25/v14n25a04.pdf (accessed on 30 September 2020). [CrossRef]
- Pérez-Cantó, V.; Maciá-Soler, L.; González-Chordá, V.M. User satisfaction in the spanish health system: Trend analysis. Rev. Saúde Pública 2019, 53, 87. [Google Scholar] [CrossRef] [PubMed]
- European Observatory on Health Systems and Policies. State of Health in the EU-Spain-Country Health Profile 2019. Eur Comm. 2019, pp. 1–24. Available online: https://www.oecd.org/publications/spain-country-health-profile-2019-8f834636-en.htm (accessed on 3 October 2020).


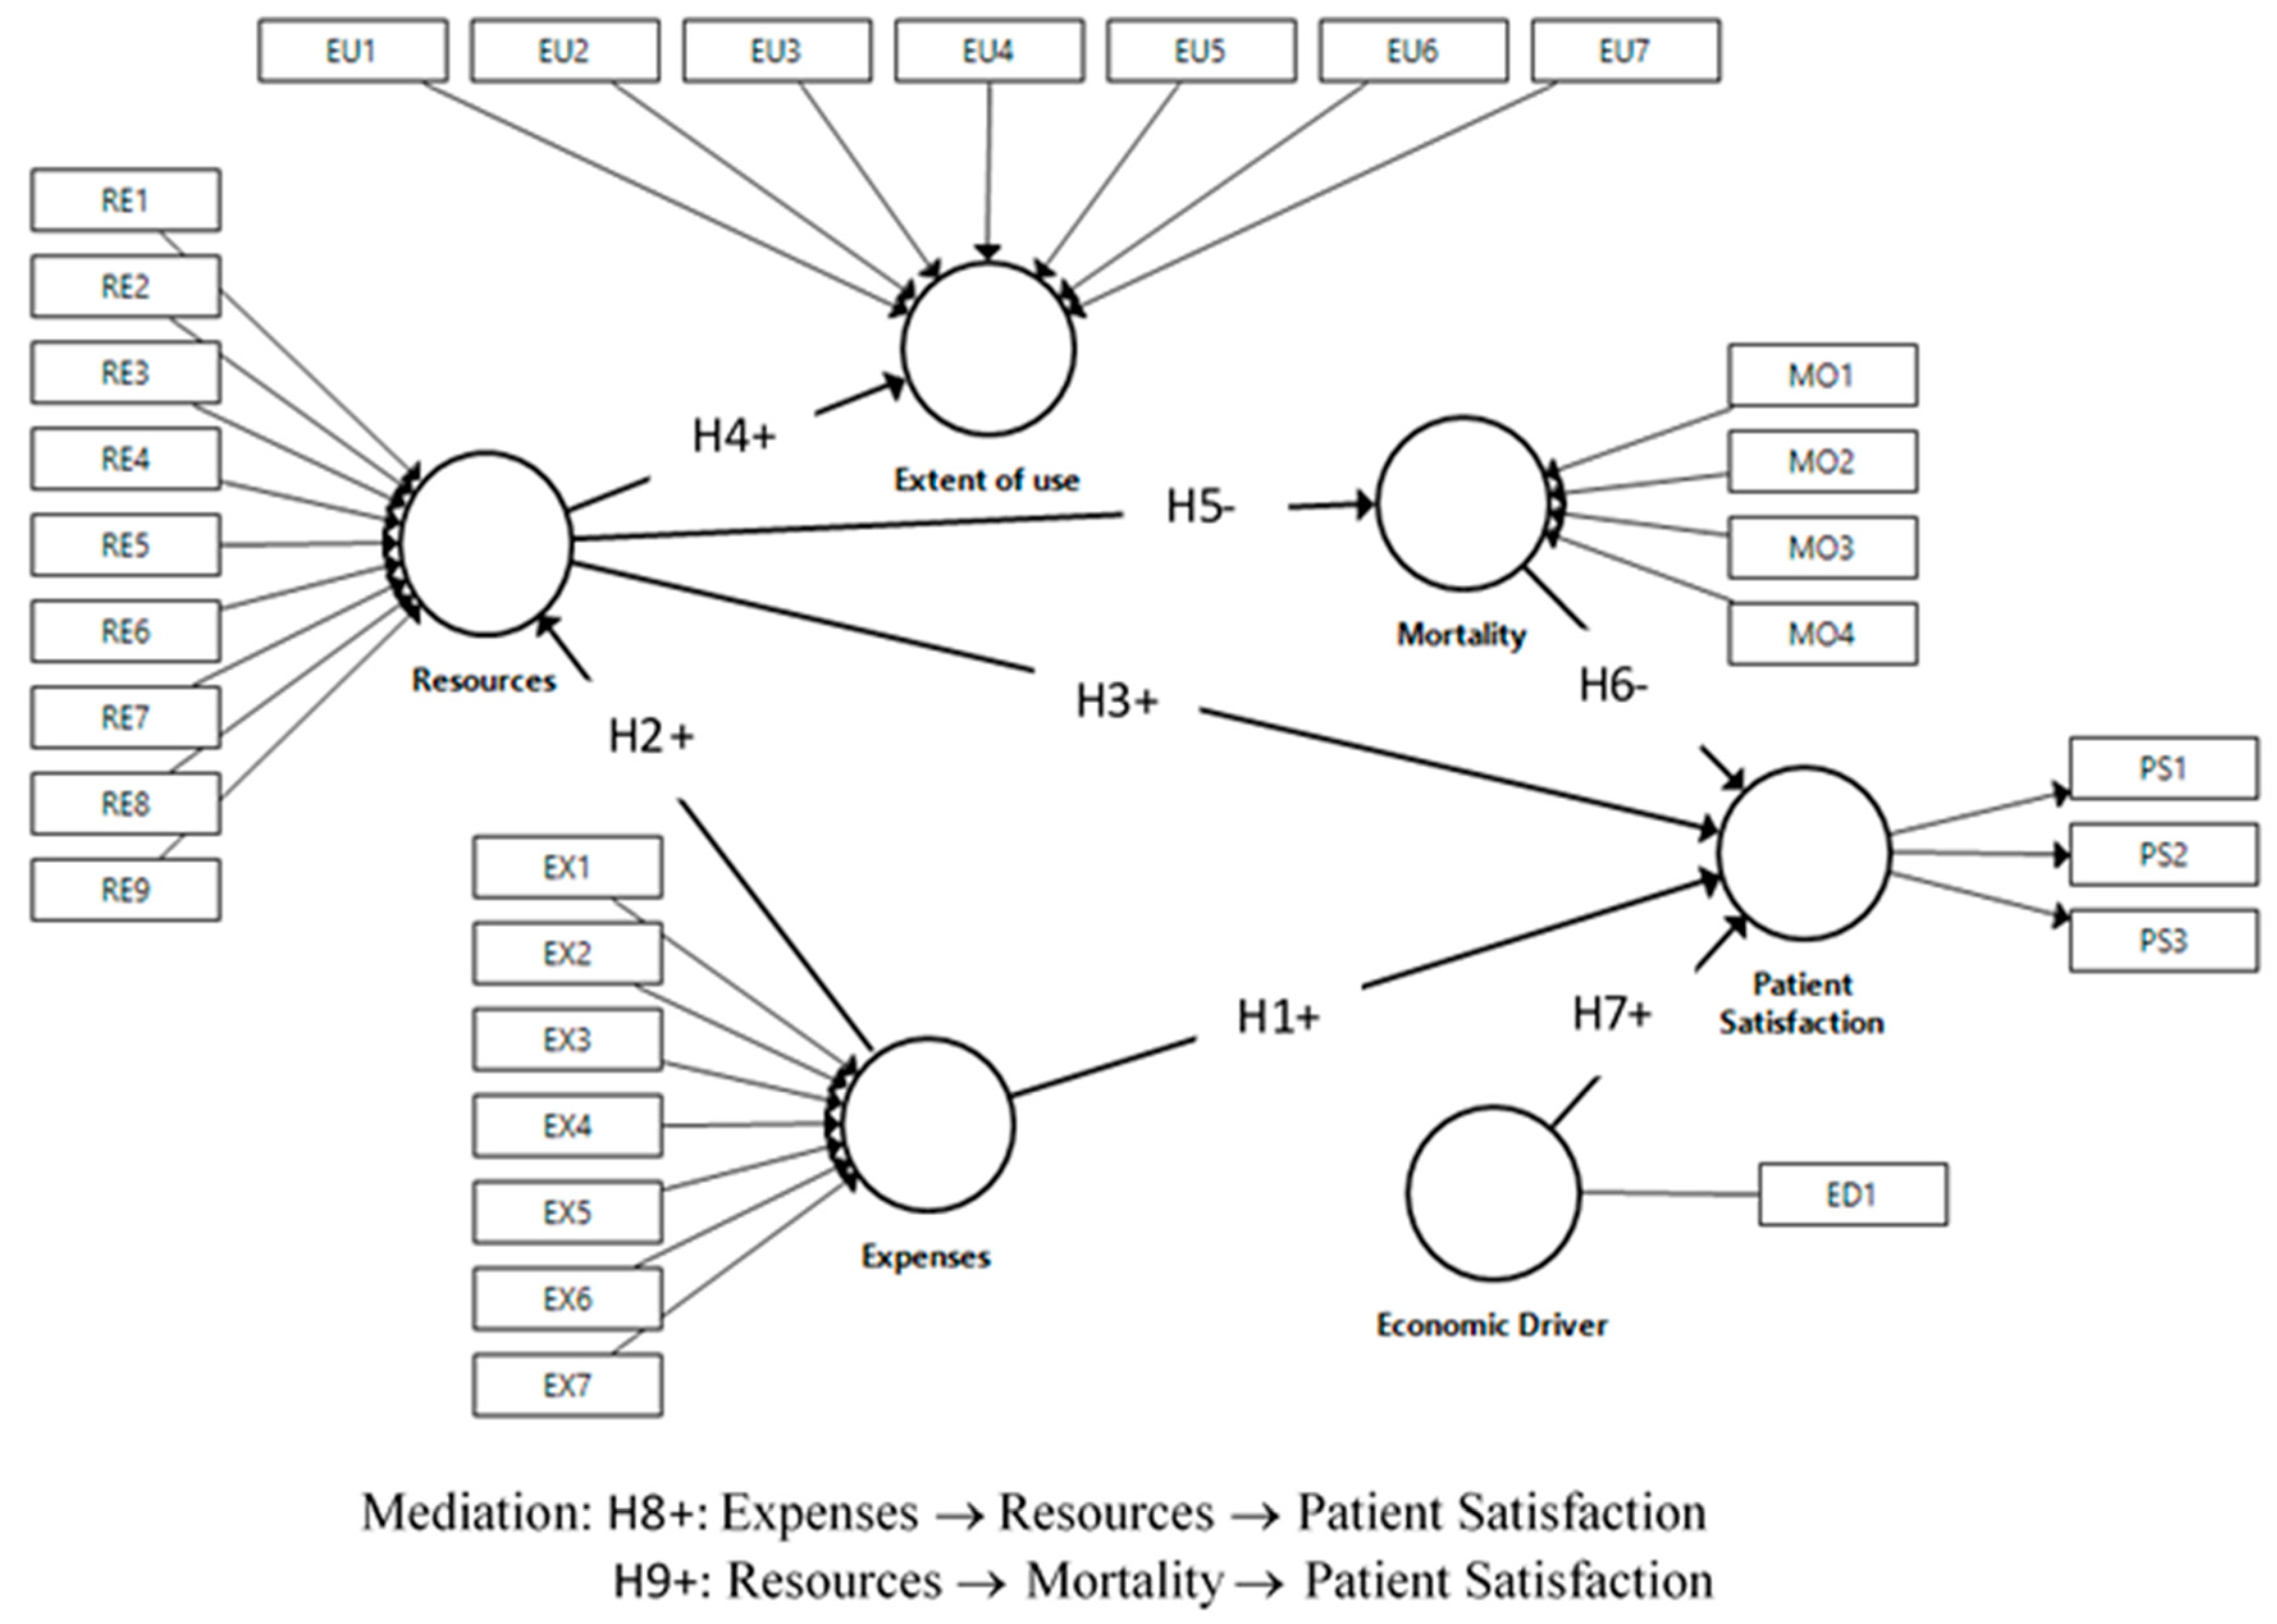
| Composite | Indicators | Description |
|---|---|---|
| Patient satisfaction (mode A) | PS1 | Degree of satisfaction with functioning of public health system |
| PS2 | Degree of satisfaction with knowledge of history and monitoring of health problems by family doctors and pediatricians | |
| PS3 | Degree of satisfaction with information received at specialists’ offices about health problems | |
| Expenses (mode B) | EX1 | Public health expenditure managed by autonomous community per protected inhabitant |
| EX2 | Percentage of spending on specialized care services | |
| EX3 | Percentage of spending on primary care | |
| EX4 | Percentage of spending dedicated to concerts | |
| EX5 | Percentage of spending on intermediate consumption | |
| EX6 | Percentage of public health expenditure on staff remuneration for training of residents | |
| EX7 | Percentage of pharmacy spending | |
| Resources (mode B) | RE1 | Medical personnel in specialized care per 1000 inhabitants |
| RE2 | Primary care medical staff per 1000 people assigned | |
| RE3 | Skilled care nurses per 1000 inhabitants | |
| RE4 | Primary care nurses per 1000 people assigned | |
| RE5 | Running hospital beds per 1000 inhabitants | |
| RE6 | Day hospital posts per 1000 inhabitants | |
| RE7 | Operating theaters per 100,000 inhabitants | |
| RE8 | Operating computed tomography (CT) equipment per 100,000 inhabitants | |
| RE9 | Nuclear magnetic resonance (NMR) per 100,000 inhabitants | |
| Extent of use (mode B) | EU1 | Frequency of specialized attention consultations per 1000 inhabitants/year |
| EU2 | Frequency of hospital admissions per 1000 inhabitants/year | |
| EU3 | Number of days of average hospital stay | |
| EU4 | Surgical intervention rate per 1000 inhabitants/year | |
| EU5 | Outpatient surgery percentage | |
| EU6 | CT usage rate per 1000 inhabitants/year | |
| EU7 | NMR usage rate per 1000 inhabitants/year | |
| Mortality (mode B) | MO1 | Age-adjusted mortality rate for Alzheimer’s disease per 100,000 inhabitants |
| MO2 | Age-adjusted death rate from cancer per 100,000 inhabitants | |
| MO3 | Age-adjusted mortality rate for diabetes mellitus per 100,000 inhabitants | |
| MO4 | Age-adjusted death rate from cerebrovascular disease per 100,000 inhabitants | |
| Economic driver | ED1 | Gross domestic product (GDP) per capita |
| Construct and Associated Indicators | Men | Women | ||
|---|---|---|---|---|
| Mean | Standard Deviation | Mean | Standard Deviation | |
| Patient satisfaction (PS) | ||||
| PS1 | 6.572 | 0.439 | 6.533 | 0.461 |
| PS2 | 7.365 | 0.424 | 7.481 | 0.402 |
| PS3 | 7.293 | 0.425 | 7.275 | 0.442 |
| Expenses (EX) | ||||
| EX1 | 1415.785 | 167.139 | 1415.785 | 167.139 |
| EX2 | 58.902 | 4.901 | 58.902 | 4.901 |
| EX3 | 13.969 | 1.748 | 13.969 | 1.748 |
| EX4 | 7.314 | 5.210 | 7.314 | 5.210 |
| EX5 | 22.867 | 4.437 | 22.867 | 4.437 |
| EX6 | 3.235 | 0.908 | 3.235 | 0.908 |
| EX7 | 18.546 | 3.034 | 18.546 | 3.034 |
| Resources (RE) | ||||
| RE1 | 1.698 | 0.221 | 1.698 | 0.221 |
| RE2 | 0.778 | 0.106 | 0.778 | 0.106 |
| RE3 | 2.931 | 0.446 | 2.931 | 0.446 |
| RE4 | 0.661 | 0.108 | 0.661 | 0.108 |
| RE5 | 2.497 | 0.457 | 2.497 | 0.457 |
| RE6 | 0.274 | 0.128 | 0.274 | 0.128 |
| RE7 | 6.438 | 1.016 | 6.438 | 1.016 |
| RE8 | 1.136 | 0.260 | 1.136 | 0.260 |
| RE9 | 0.558 | 0.224 | 0.558 | 0.224 |
| Extent of use (EU) | ||||
| EU1 | 1619.646 | 244.892 | 1619.646 | 244.892 |
| EU2 | 91.937 | 15.430 | 91.937 | 15.430 |
| EU3 | 7.897 | 0.976 | 6.600 | 0.703 |
| EU4 | 69.709 | 14.584 | 69.709 | 14.584 |
| EU5 | 39.609 | 8.462 | 41.537 | 8.251 |
| EU6 | 72.408 | 17.468 | 72.408 | 17.468 |
| EU7 | 28.395 | 14.788 | 28.395 | 14.788 |
| Mortality (MO) | ||||
| MO1 | 9.477 | 2.407 | 12.645 | 3.127 |
| MO2 | 213.869 | 20.038 | 100.495 | 6.233 |
| MO3 | 12.611 | 6.219 | 10.081 | 5.540 |
| MO4 | 36.937 | 9.981 | 28.790 | 8.318 |
| Economic driver (ED) | ||||
| ED1 | 22.987 | 4.578 | 22.987 | 4.578 |
| (A) Outer Loadings | ||||||||
| Indicator | Men | Women | ||||||
| PS1 | 0.881 | 0.883 | ||||||
| PS2 | 0.901 | 0.899 | ||||||
| PS3 | 0.867 | 0.876 | ||||||
| (B) Construct Reliability and Average Variance Extracted | ||||||||
| Composite | Cronbach’s Alpha | Dijkstra–Henseler’s Rho | Composite Reliability (CR) | AVE | ||||
| Variable | Men | Women | Men | Women | Men | Women | Men | Women |
| Patient satisfaction | 0.860 | 0.864 | 0.874 | 0.875 | 0.914 | 0.916 | 0.780 | 0.785 |
| (C) Discriminant Validity (Fornell–Larcker Criterion) | ||||||||
| Group | Variable | DE | EX | MO | RE | PS | EU | |
| Men | DE | 1.000 | ||||||
| EX | 0.305 | n.a. | ||||||
| MO | −0.459 | −0.700 | n.a. | |||||
| RE | 0.309 | 0.778 | −0.781 | n.a. | ||||
| PS | 0.185 | 0.598 | −0.505 | 0.618 | 0.883 | |||
| EU | 0.311 | 0.580 | −0.692 | 0.818 | 0.447 | |||
| Women | DE | 1 | ||||||
| EX | 0.339 | n.a. | ||||||
| MO | −0.551 | −0.703 | n.a. | |||||
| RE | 0.351 | 0.768 | −0.775 | n.a. | ||||
| PS | 0.131 | 0.566 | −0.454 | 0.580 | 0.886 | |||
| EU | 0.337 | 0.535 | −0.656 | 0.809 | 0.395 | |||
| (D) Discriminant Validity (HTMT Criterion) | ||||||||
| PS→DE | Original Sample | Sample Mean | CI Lo2.5% | CI Hi97.5% | ||||
| Men | 0.193 | 0.208 | 0.129 | 0.275 | ||||
| Women | 0.140 | 0.162 | 0.083 | 0.182 | ||||
| Variables | VIF | Weights | t | CI 2.5% | CI 97.5% | Loadings |
|---|---|---|---|---|---|---|
| Expenses | ||||||
| EX1 | 1.385 | 0.542 *** | 7.265 | 0.395 | 0.686 | 0.731 *** |
| EX2 | 3.559 | 0.282 *** | 2.797 | 0.094 | 0.491 | 0.604 *** |
| EX3 | 1.292 | 0.202 *** | 3.073 | 0.068 | 0.327 | 0.073 ‡ |
| EX4 | 1.363 | −0.126 ** | 2.292 | −0.233 | −0.018 | −0.156 ** |
| EX5 | 2.536 | 0.038 ‡ | 0.371 | −0.189 | 0.223 | 0.552 *** |
| EX6 | 1.610 | 0.293 *** | 3.867 | 0.157 | 0.454 | 0.456 *** |
| EX7 | 2.316 | −0.323 *** | 3.637 | −0.494 | −0.143 | −0.754 *** |
| Resources | ||||||
| RE1 | 4.345 | 0.311 *** | 3.556 | 0.155 | 0.502 | 0.799 *** |
| RE2 | 3.704 | 0.109 ‡ | 1.426 | −0.036 | 0.264 | 0.304 *** |
| RE3 | 3.604 | 0.191 ** | 2.451 | 0.044 | 0.354 | 0.723 *** |
| RE4 | 4.674 | 0.151 * | 1.646 | −0.028 | 0.331 | 0.358 *** |
| RE5 | 1.797 | −0.488 *** | 6.725 | −0.626 | −0.341 | 0.162 * |
| RE6 | 1.831 | 0.254 *** | 5.309 | 0.171 | 0.362 | 0.703 *** |
| RE7 | 3.412 | 0.226 *** | 2.828 | 0.074 | 0.386 | 0.733 *** |
| RE8 | 2.734 | −0.018 ‡ | 0.278 | −0.149 | 0.098 | 0.636 *** |
| RE9 | 2.210 | 0.337 *** | 4.938 | 0.211 | 0.479 | 0.807 *** |
| Extent of use | ||||||
| EU1 | 1.751 | 0.518 *** | 6.545 | 0.364 | 0.665 | 0.808 *** |
| EU2 | 2.487 | −0.103 ‡ | 0.837 | −0.353 | 0.129 | 0.511 *** |
| EU3 | 2.521 | −0.350 *** | 3.566 | −0.535 | −0.152 | −0.538 *** |
| EU4 | 3.226 | 0.005 ‡ | 0.049 | −0.171 | 0.240 | 0.667*** |
| EU5 | 1.619 | −0.014 ‡ | 0.188 | −0.163 | 0.132 | 0.323 *** |
| EU6 | 3.039 | 0.433 *** | 4.880 | 0.270 | 0.619 | 0.809 *** |
| EU7 | 3.222 | 0.123 ‡ | 1.324 | −0.056 | 0.313 | 0.782 *** |
| Mortality | ||||||
| MO1 | 1.162 | −0.194 ** | 2.457 | −0.347 | −0.038 | −0.028 |
| MO2 | 1.694 | −0.016 ‡ | 0.152 | −0.232 | 0.187 | 0.772 *** |
| MO3 | 1.018 | 0.619 *** | 7.125 | 0.438 | 0.771 | 0.636 *** |
| MO4 | 1.648 | 0.784 *** | 9.966 | 0.638 | 0.947 | 0.777 *** |
| Variables | VIF | Weights | t | CI 2.5% | CI 97.5% | Loadings |
|---|---|---|---|---|---|---|
| Expenses | ||||||
| EX1 | 1.385 | 0.579 *** | 7.947 | 0.435 | 0.721 | 0.755 *** |
| EX2 | 3.559 | 0.323 *** | 3.010 | 0.118 | 0.542 | 0.601 *** |
| EX3 | 1.292 | 0.196 *** | 2.838 | 0.057 | 0.329 | 0.075 ‡ |
| EX4 | 1.363 | −0.094 ‡ | 1.444 | −0.223 | 0.030 | −0.100 |
| EX5 | 2.536 | −0.046 ‡ | 0.391 | −0.296 | 0.167 | 0.489 *** |
| EX6 | 1.610 | 0.285 *** | 3.648 | 0.149 | 0.453 | 0.411 *** |
| EX7 | 2.316 | −0.323 *** | 3.526 | −0.497 | −0.143 | −0.773 *** |
| Resources | ||||||
| RE1 | 4.345 | 0.323 *** | 4.063 | 0.185 | 0.503 | 0.839 *** |
| RE2 | 3.704 | 0.027 ‡ | 0.337 | −0.137 | 0.179 | 0.299 *** |
| RE3 | 3.604 | 0.217 *** | 2.687 | 0.070 | 0.378 | 0.767 *** |
| RE4 | 4.674 | 0.204* | 1.947 | 0.009 | 0.415 | 0.385 *** |
| RE5 | 1.797 | −0.380 *** | 5.368 | −0.516 | −0.239 | 0.254 *** |
| RE6 | 1.831 | 0.267 *** | 5.528 | 0.182 | 0.374 | 0.731 *** |
| RE7 | 3.412 | 0.222 *** | 2.568 | 0.063 | 0.403 | 0.750 *** |
| RE8 | 2.734 | −0.072 ‡ | 1.063 | −0.220 | 0.052 | 0.633 *** |
| RE9 | 2.210 | 0.315 *** | 4.152 | 0.171 | 0.466 | 0.816 *** |
| Extent of use | ||||||
| EU1 | 1.743 | 0.438 *** | 5.549 | 0.293 | 0.587 | 0.826 *** |
| EU2 | 2.288 | 0.068 ‡ | 0.617 | −0.159 | 0.293 | 0.593 *** |
| EU3 | 1.785 | −0.077 ‡ | 0.823 | −0.251 | 0.112 | −0.211 ** |
| EU4 | 3.189 | 0.172 ‡ | 1.405 | −0.053 | 0.418 | 0.724 *** |
| EU5 | 1.708 | −0.037 ‡ | 0.488 | −0.118 | 0.180 | 0.465 *** |
| EU6 | 3.021 | 0.323 *** | 3.489 | 0.146 | 0.510 | 0.818 *** |
| EU7 | 3.088 | 0.220 ** | 2.299 | 0.044 | 0.423 | 0.792 *** |
| Mortality | ||||||
| MO1 | 1.082 | −0.139 * | 1.835 | −0.282 | 0.013 | −0.102 |
| MO2 | 1.208 | −0.006 ‡ | 0.076 | −0.170 | 0.153 | 0.313 *** |
| MO3 | 1.161 | 0.608 *** | 7.420 | 0.446 | 0.758 | 0.749 *** |
| MO4 | 1.058 | 0.671 *** | 11.369 | 0.558 | 0.785 | 0.794 *** |
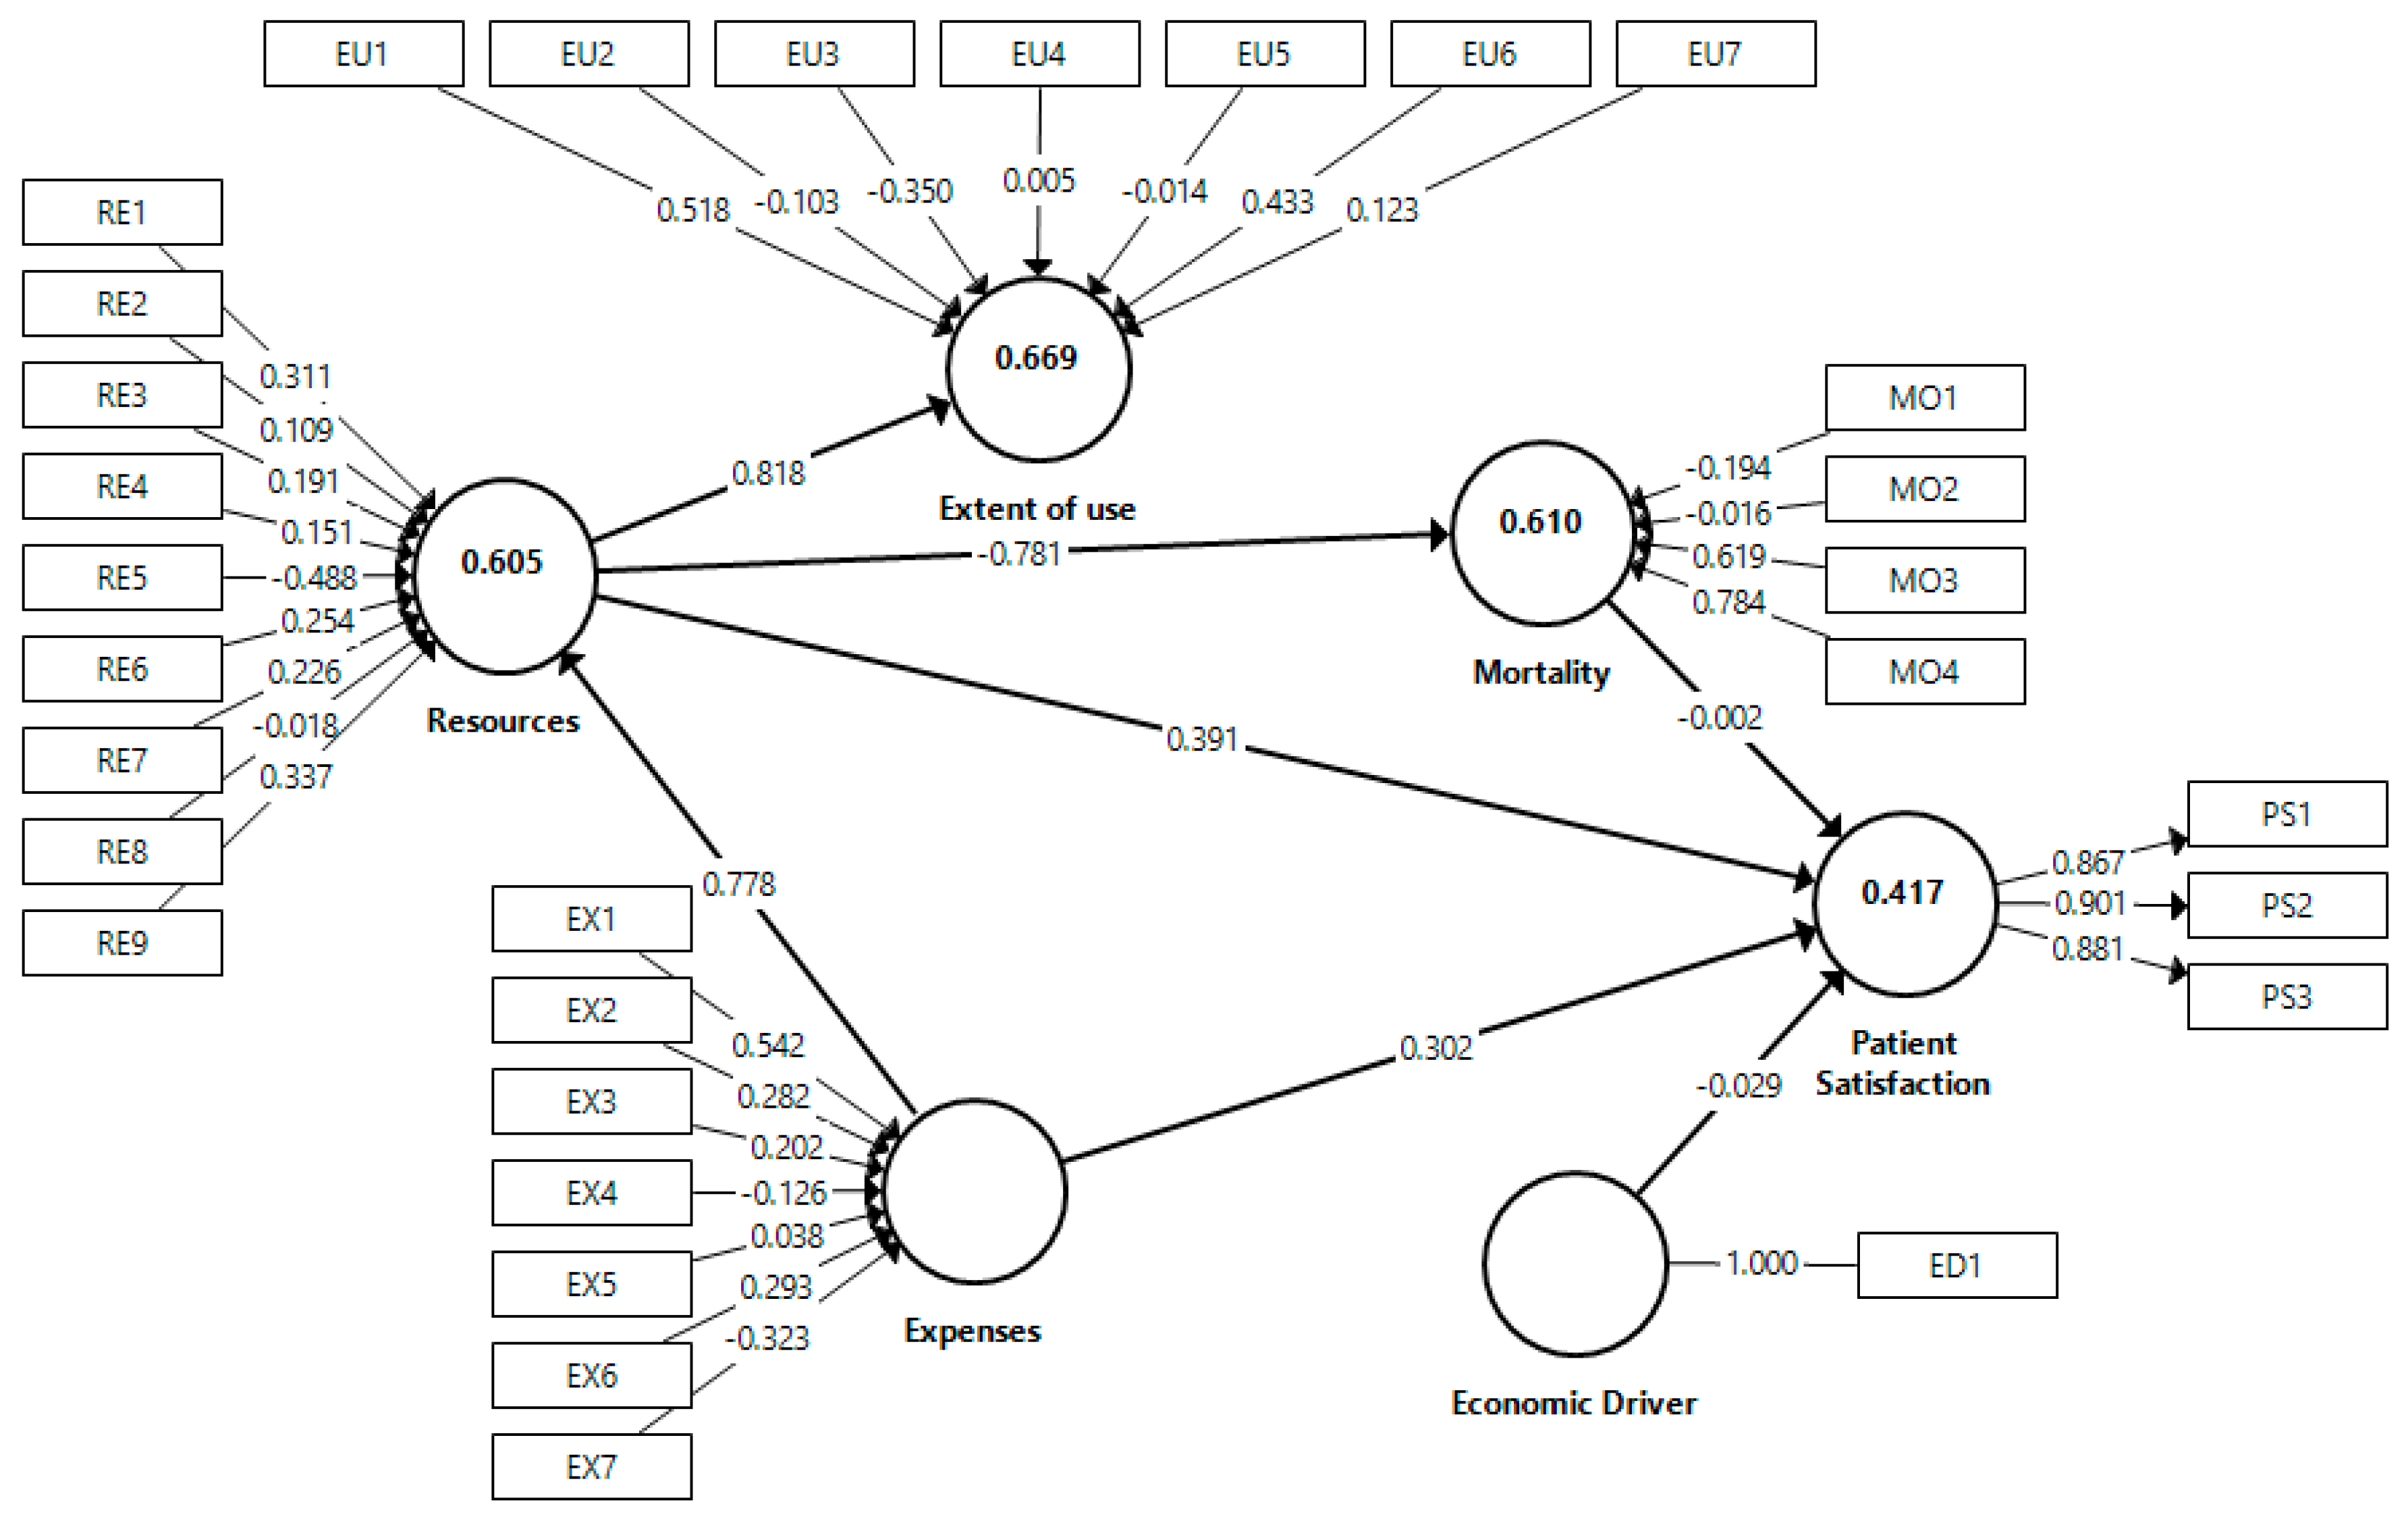
| (A) Direct Effects | |||||||
| Effects | Path | t | CI 2.5% | CI 97.5% | f2 | VIF | |
| ED→PS | −0.029 ‡ | 0.560 | −0.130 | 0.070 | 0.001 | 1.278 | |
| EX→PS | 0.302 *** | 3.109 | 0.101 | 0.488 | 0.058 | 2.684 | |
| RE→PS | 0.391 *** | 3.829 | 0.181 | 0.583 | 0.074 | 3.102 | |
| MO→PS | −0.002 ‡ | 0.016 | −0.205 | 0.197 | 0 | 3.539 | |
| R2 = 0.417; Q2 = 0.306 | |||||||
| EX→RE | 0.778 *** | 31.679 | 0.714 | 0.816 | 1.535 | 1 | |
| R2 = 0.605; Q2 = 0.212 | |||||||
| RE→EU | 0.818 *** | 33.768 | 0.757 | 0.857 | 2.022 | 1 | |
| R2 = 0.669; Q2 = 0.289 | |||||||
| RE→MO | −0.781 *** | 32.697 | −0.821 | −0.724 | 1.566 | 1 | |
| R2 = 0.610; Q2 = 0.203 | |||||||
| (B) Specific Indirect Effects | |||||||
| Effects | Path | t | CI 2.5% | CI 97.5% | |||
| EX→RE→MO | −0.608 *** | 19.574 | −0.658 | −0.531 | |||
| RE→MO→PS | 0.001 ‡ | 0.016 | −0.155 | 0.163 | |||
| EX→RE→MO→PS | −0.001 ‡ | 0.016 | −0.531 | 0.129 | |||
| EX→RE→PS | 0.304 *** | 3.811 | 0.137 | 0.451 | |||
| EX→RE→EU | 0.636 *** | 21.679 | 0.564 | 0.683 | |||
| (C) Total Indirect Effects | |||||||
| EX→MO | −0.608 *** | 19.574 | −0.658 | −0.531 | |||
| EX→PS | 0.305 *** | 3.842 | 0.132 | 0.448 | |||
| EX→EU | 0.636 *** | 21.679 | 0.564 | 0.683 | |||
| RE→PS | 0.001 ‡ | 0.016 | −0.155 | 0.163 | |||
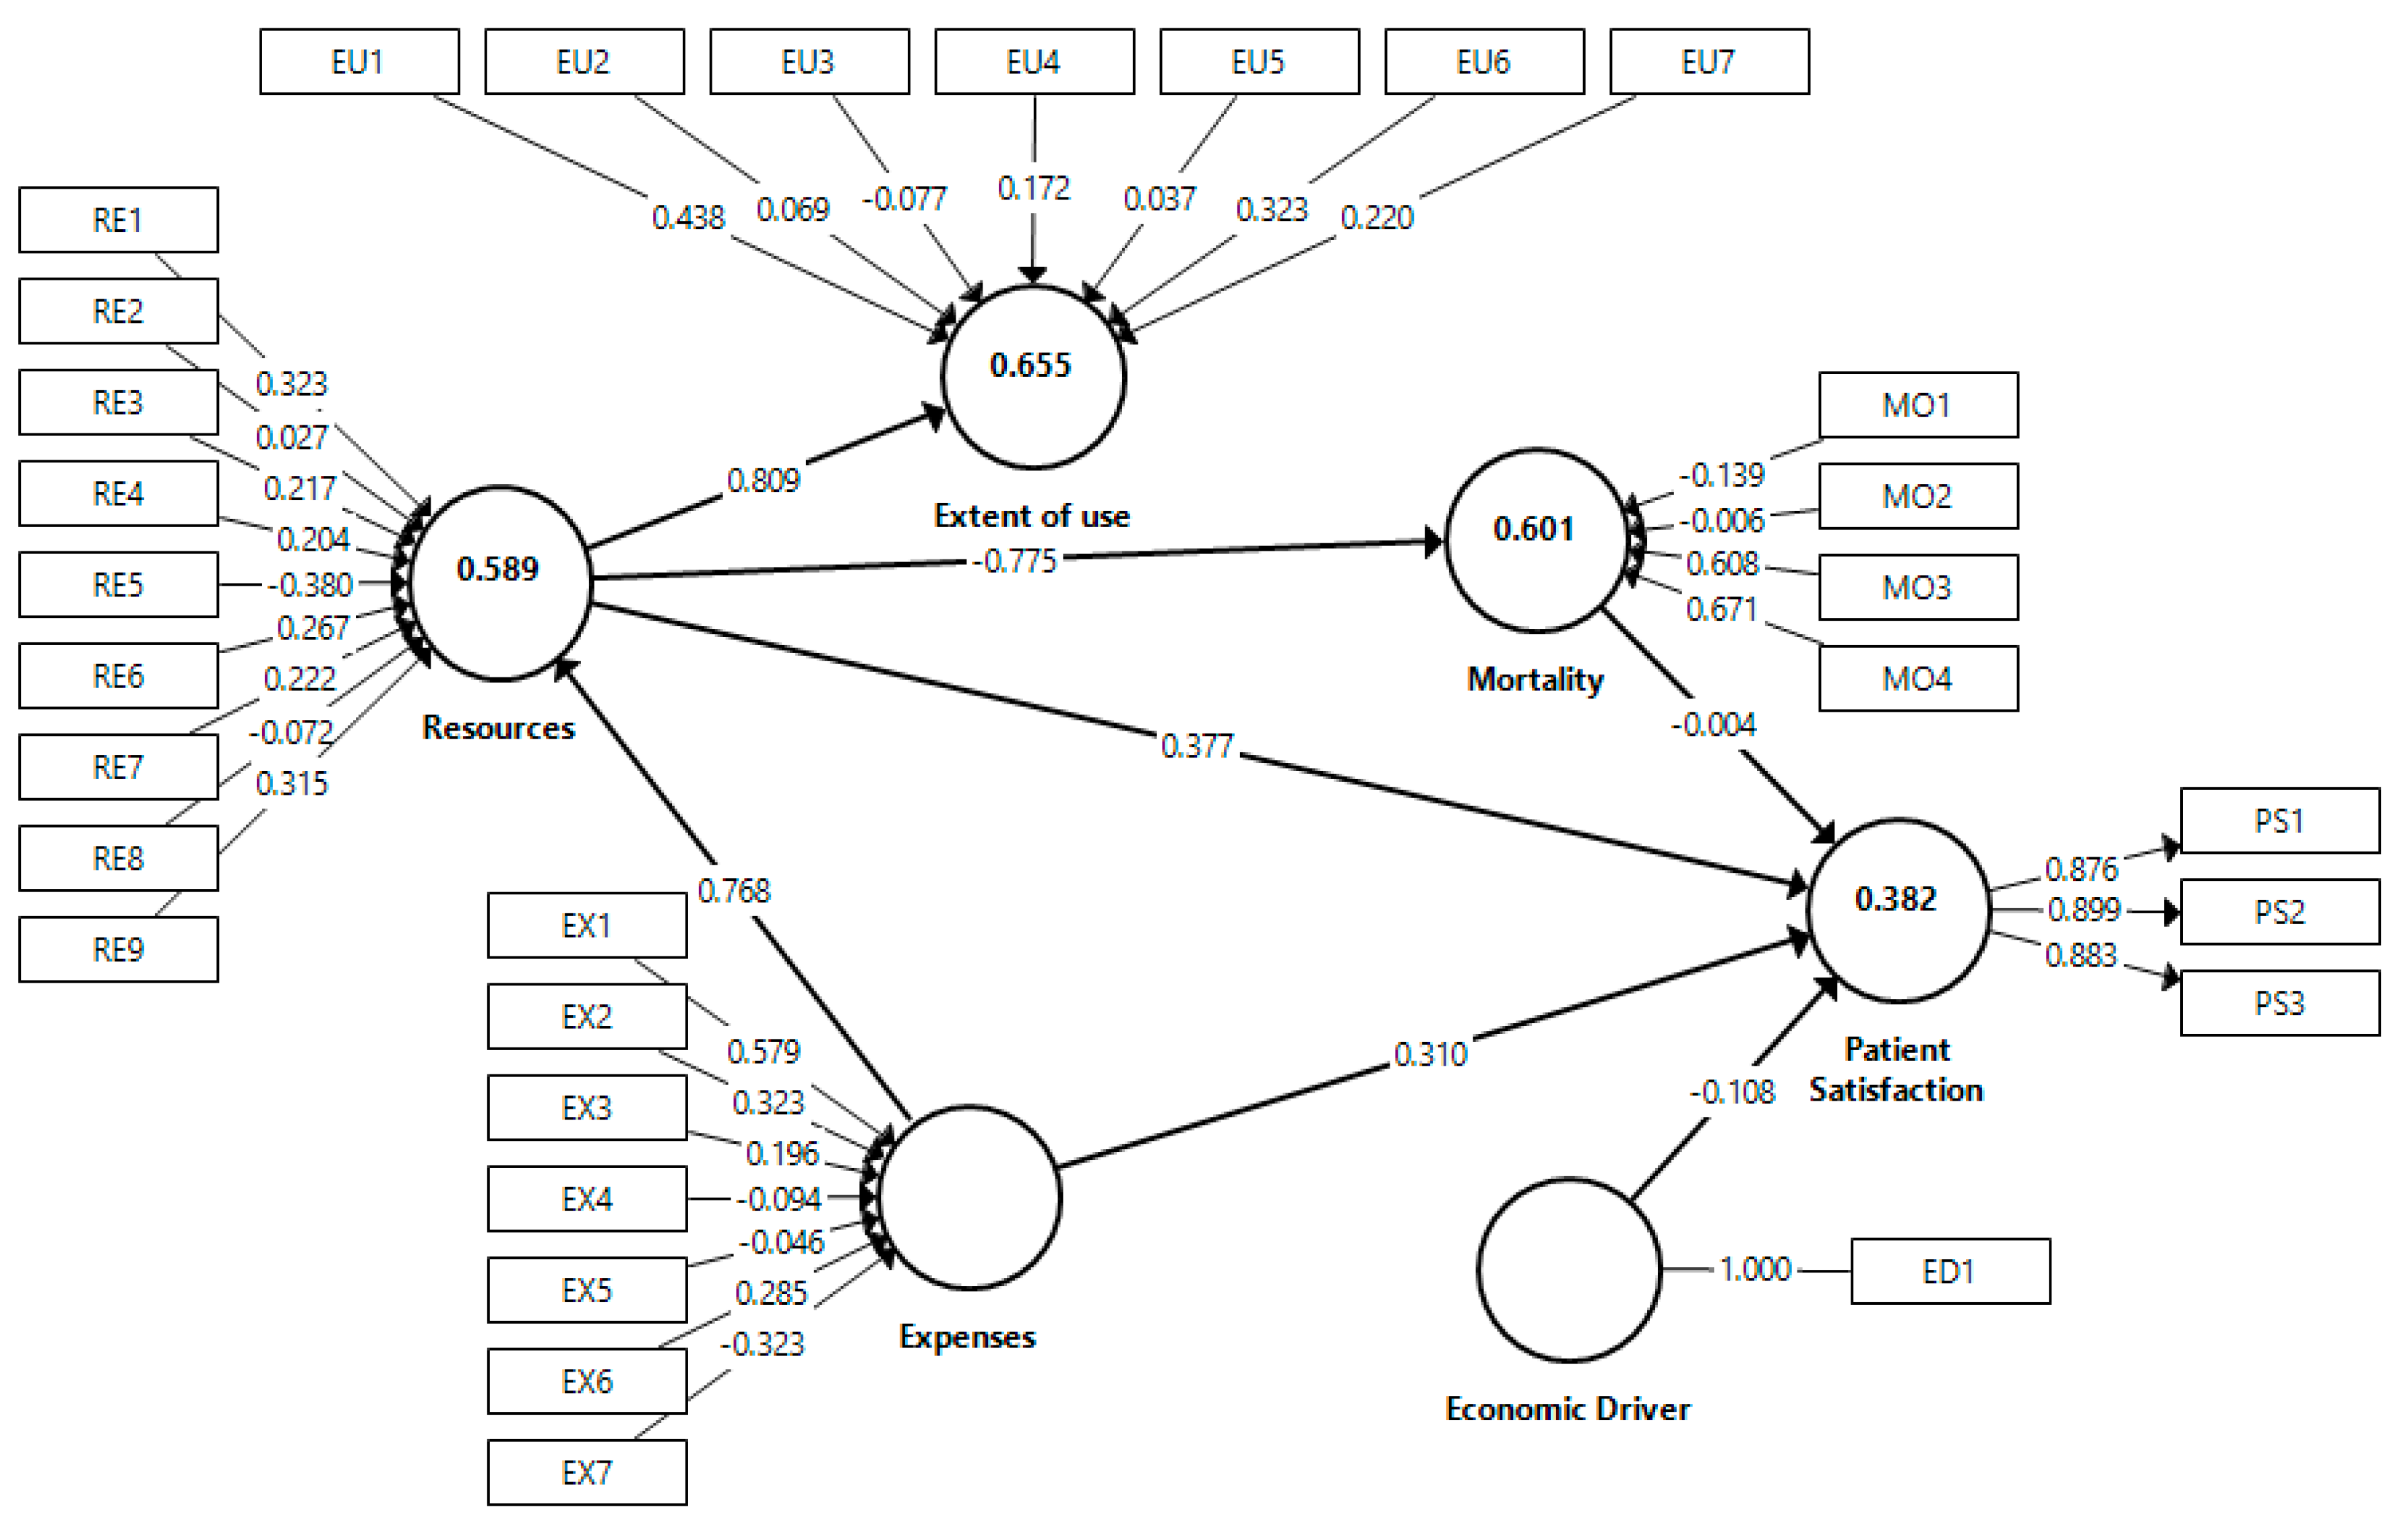
| (A) Direct Effects (Path Coefficients) | |||||||
| Effects | Path | t | CI 2.5% | CI 97.5% | f2 | VIF | |
| ED→PS | −0.108 * | 1.746 | −0.227 | 0.016 | 0.013 | 1.467 | |
| EX→PS | 0.310 *** | 2.803 | 0.078 | 0.514 | 0.059 | 2.621 | |
| RE→PS | 0.377 *** | 3.512 | 0.157 | 0.579 | 0.068 | 3.367 | |
| MO→PS | −0.004 ‡ | 0.031 | −0.243 | 0.234 | 0 | 3.521 | |
| R2 = 0.382; Q2 = 0.282 | |||||||
| EX→RE | 0.768 *** | 30.480 | 0.700 | 0.806 | 1.434 | 1 | |
| R2 = 0.589; Q2 = 0.215 | |||||||
| RE→EU | 0.809 *** | 33.118 | 0.745 | 0.846 | 1.894 | 1 | |
| R2 = 0.655; Q2 = 0.287 | |||||||
| RE→MO | −0.775 *** | 32.131 | −0.817 | –0.721 | 1.503 | 1 | |
| R2 = 0.601; Q2 = 0.192 | |||||||
| (B) Specific Indirect Effects | |||||||
| Effects | Path | t | CI 2.5% | CI 97.5% | |||
| EX→RE→MO | −0.595 *** | 19.476 | −0.645 | −0.522 | |||
| RE→MO→PS | 0.003 ‡ | 0.031 | −0.181 | 0.191 | |||
| EX→RE→MO→PS | −0.002 ‡ | 0.030 | −0.142 | 0.149 | |||
| EX→RE→PS | 0.289 *** | 3.534 | 0.117 | 0.442 | |||
| EX→RE→EU | 0.621 *** | 21.257 | 0.548 | 0.666 | |||
| (C) Total Indirect Effects | |||||||
| EX→MO | −0.595 *** | 19.476 | −0.645 | −0.522 | |||
| EX→PS | 0.291 *** | 3.436 | 0.107 | 0.443 | |||
| EX→EU | 0.621 *** | 21.257 | 0.548 | 0.666 | |||
| RE→PS | 0.003 ‡ | 0.031 | −0.181 | 0.191 | |||
| Construct | Configuration Invariance (Same Algorithms for Both Groups) | Compositional Invariance | Partial Measurement Invariance Established | Equal Mean Assessment | Equal Variance Assessment | Full Measurement Invariance Established | |||||||
|---|---|---|---|---|---|---|---|---|---|---|---|---|---|
| Correlation Original | 5% | Difference | CI 2.5% | CI 97.5% | Equal | Difference | CI 2.5% | CI 97.5% | Equal | ||||
| DE | Yes | 1.000 | 1.000 | Yes | −0.212 | 0.212 | −0.226 | 0.219 | |||||
| EX | Yes | 0.996 | 0.952 | Yes | −0.267 | 0.261 | −0.281 | 0.282 | |||||
| MO | Yes | 0.998 | 0.941 | Yes | 0.087 | −0.199 | 0.171 | Yes | -0.013 | −0.320 | 0.297 | Yes | Yes |
| RE | Yes | 0.993 | 0.972 | Yes | −0.178 | 0.201 | −0.254 | 0.238 | |||||
| PS | Yes | 1.000 | 0.999 | Yes | −0.069 | −0.180 | 0.191 | Yes | -0.024 | −0.246 | 0.256 | Yes | Yes |
| EU | Yes | 0.961 | 0.952 | Yes | −0.127 | −0.176 | 0.193 | Yes | 0.048 | −0.239 | 0.243 | Yes | Yes |
| Relationship | Men | Women | Difference | p-Value | Significant |
|---|---|---|---|---|---|
| Panel A. Direct Effects (Path Coefficients) | |||||
| ED→PS | −0.029 | −0.108 | 0.079 | 0.319 | No |
| EX→PS | 0.302 | 0.310 | −0.008 * | 0.951 | Yes |
| RE→PS | 0.391 | 0.377 | 0.014 | 0.931 | No |
| MO→PS | −0.002 | −0.004 | 0.002 * | 0.991 | Yes |
| EX→RE | 0.778 | 0.768 | 0.011 | 0.765 | No |
| RE→EU | 0.818 | 0.809 | 0.009 | 0.797 | No |
| RE→MO | −0.781 | −0.775 | −0.006 | 0.850 | No |
| Panel B. Specific Indirect Effects | |||||
| EX→RE→MO | −0.608 | −0.595 | −0.013 | 0.763 | No |
| RE→MO→PS | 0.001 | 0.003 | −0.002 * | 0.991 | Yes |
| EX→RE→MO→PS | 0.001 | 0.002 | −0.001 * | 0.992 | Yes |
| EX→RE→PS | 0.304 | 0.289 | 0.015 | 0.903 | No |
| EX→RE→EU | 0.636 | 0.621 | 0.016 | 0.711 | No |
Publisher’s Note: MDPI stays neutral with regard to jurisdictional claims in published maps and institutional affiliations. |
© 2021 by the authors. Licensee MDPI, Basel, Switzerland. This article is an open access article distributed under the terms and conditions of the Creative Commons Attribution (CC BY) license (http://creativecommons.org/licenses/by/4.0/).
Share and Cite
Valls Martínez, M.d.C.; Ramírez-Orellana, A.; Grasso, M.S. Health Investment Management and Healthcare Quality in the Public System: A Gender Perspective. Int. J. Environ. Res. Public Health 2021, 18, 2304. https://doi.org/10.3390/ijerph18052304
Valls Martínez MdC, Ramírez-Orellana A, Grasso MS. Health Investment Management and Healthcare Quality in the Public System: A Gender Perspective. International Journal of Environmental Research and Public Health. 2021; 18(5):2304. https://doi.org/10.3390/ijerph18052304
Chicago/Turabian StyleValls Martínez, María del Carmen, Alicia Ramírez-Orellana, and Mayra Soledad Grasso. 2021. "Health Investment Management and Healthcare Quality in the Public System: A Gender Perspective" International Journal of Environmental Research and Public Health 18, no. 5: 2304. https://doi.org/10.3390/ijerph18052304
APA StyleValls Martínez, M. d. C., Ramírez-Orellana, A., & Grasso, M. S. (2021). Health Investment Management and Healthcare Quality in the Public System: A Gender Perspective. International Journal of Environmental Research and Public Health, 18(5), 2304. https://doi.org/10.3390/ijerph18052304